Molecular mechanism underlying desensitization of the proton-activated chloride channel PAC
- Department of Physiology, Johns Hopkins University School of Medicine, United States
- Department of Structural Biology, Van Andel Institute, United States
- Department of Medicine, Johns Hopkins University School of Medicine, United States
- Solomon H. Snyder Department of Neuroscience, Johns Hopkins University School of Medicine, United States
Figures
Figure 1 with 1 supplement
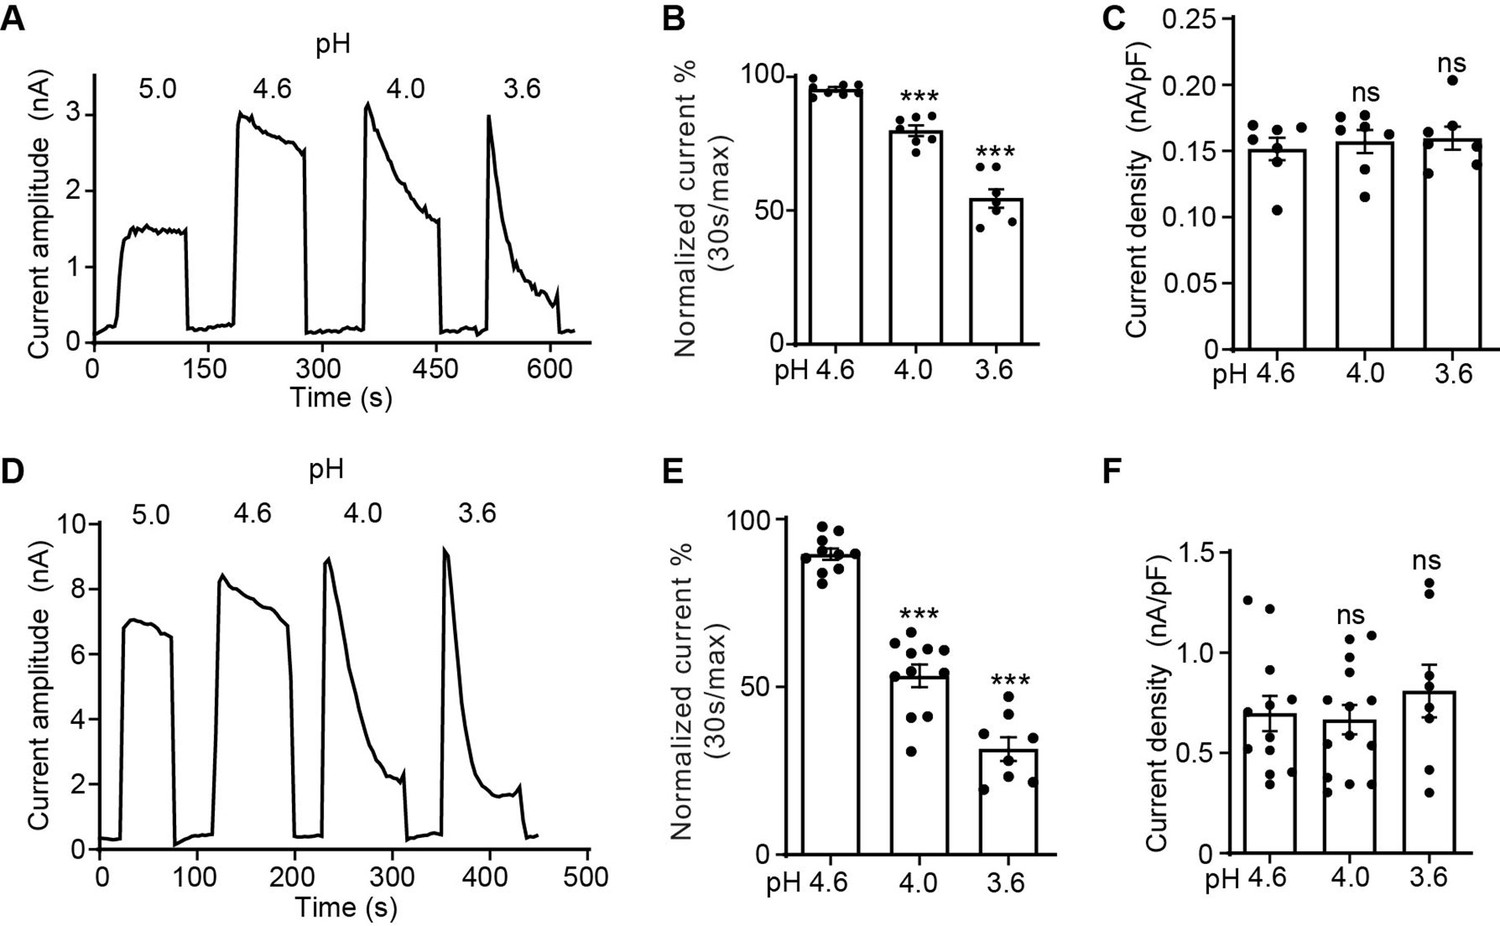
The proton-activated chloride (PAC) channel desensitizes at low pH.
(A) Representative whole-cell current traces of the endogenous PAC current (ICl, H) in wild-type (WT) HEK293T cells induced by extracellular acidification at pH 5.0, 4.6, 4.0, and 3.6. Cells were maintained in pH 7.3 solution before acidic solution application. Currents were monitored by voltage-ramp protocol and traces shown are at +100 mV. (B) Percentage desensitization (mean ± SEM) of ICl, H in WT HEK293T cells at pH 4.6, 4.0, and 3.6. Desensitized current after 30 s of acidic exposure was normalized to the initial maximum current of that recording and expressed as a percentage. ***p<0.001; one-way analysis of variance (ANOVA) with Bonferroni post hoc test. (C) Current densities (mean ± SEM) of the ICl, H in WT HEK293T cells induced by acidic solutions pH 4.6, 4.0, and 3.6 at +100 mV. ns, not significant; one-way ANOVA with Bonferroni post hoc test. (D) Representative whole-cell current trace of PAC overexpressing current in PAC KO HEK293T cells transfected with human PAC cDNA. Currents at different pH values were monitored by voltage-ramp protocol and traces shown are at +100 mV. (E) Percentage desensitization (mean ± SEM) of PAC overexpressing current in PAC KO HEK293T cells at pH 4.6, 4.0, and 3.6. Desensitized current after 30 s of acidic exposure was normalized to the initial maximum current of that recording and expressed as a percentage. ***p<0.001; one-way ANOVA with Bonferroni post hoc test. (F) Current densities (mean ± SEM) of PAC overexpressing current induced by pH 4.6, 4.0, and 3.6 solutions at +100 mV. ns, not significant; one-way ANOVA with Bonferroni post hoc test.
-
Figure 1—source data 1
Raw data for Figure 1A–F.
- https://cdn.elifesciences.org/articles/82955/elife-82955-fig1-data1-v1.xlsx
Figure 1—figure supplement 1
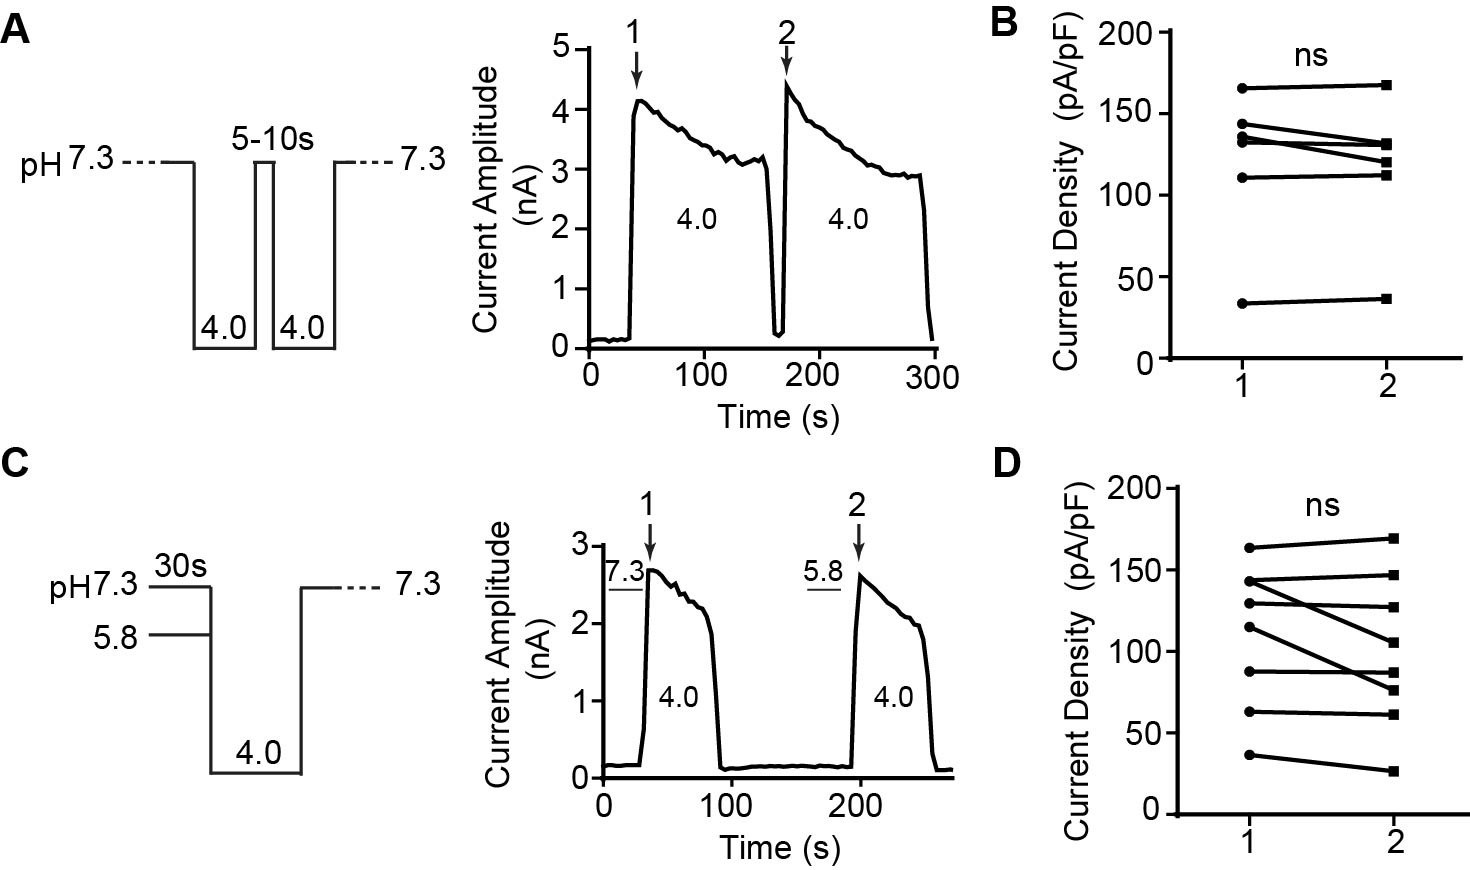
The proton-activated chloride (PAC) channel does not exhibit steady-state desensitization and shows fast recovery from desensitization.
(A) (Left) Protocol and (right) representative whole-cell trace for measuring the recovery from desensitization of the PAC current at pH 4.0. The cells were perfused with pH 4.0 solution to elicit current and then returned to baseline by applying pH 7.3 solution for 5–10 s before a second application of the pH 4.0 solution. (B) Maximum amplitudes of first (1) and second (2) pH 4.0-induced currents at +100 mV. Data are mean ± SEM. ns, not significant; two-tailed Student’s t test. (C) (Left) Protocol and (right) representative whole-cell current trace for measuring the steady-state desensitization of the endogenous PAC current in HEK293T cells. The cells were perfused with control conditioning solution (pH 7.3) for 30 s, before inducing the PAC current by pH 4.0 acidic solution. Current was returned to baseline by applying pH 7.3 solution. This was followed by a test conditioning solution (pH 5.8) for 30 s, before another pH-4.0-induced current was elicited. The current was then returned to baseline with pH 7.3 solution. (D) Maximum amplitudes of first (1) and second (2) pH 4.0-induced currents at +100 mV. Data are mean ± SEM. ns, not significant; two-tailed Student’s t test.
-
Figure 1—figure supplement 1—source data 1
Raw data for Figure 1—figure supplement 1A-D.
- https://cdn.elifesciences.org/articles/82955/elife-82955-fig1-figsupp1-data1-v1.xlsx
Figure 2
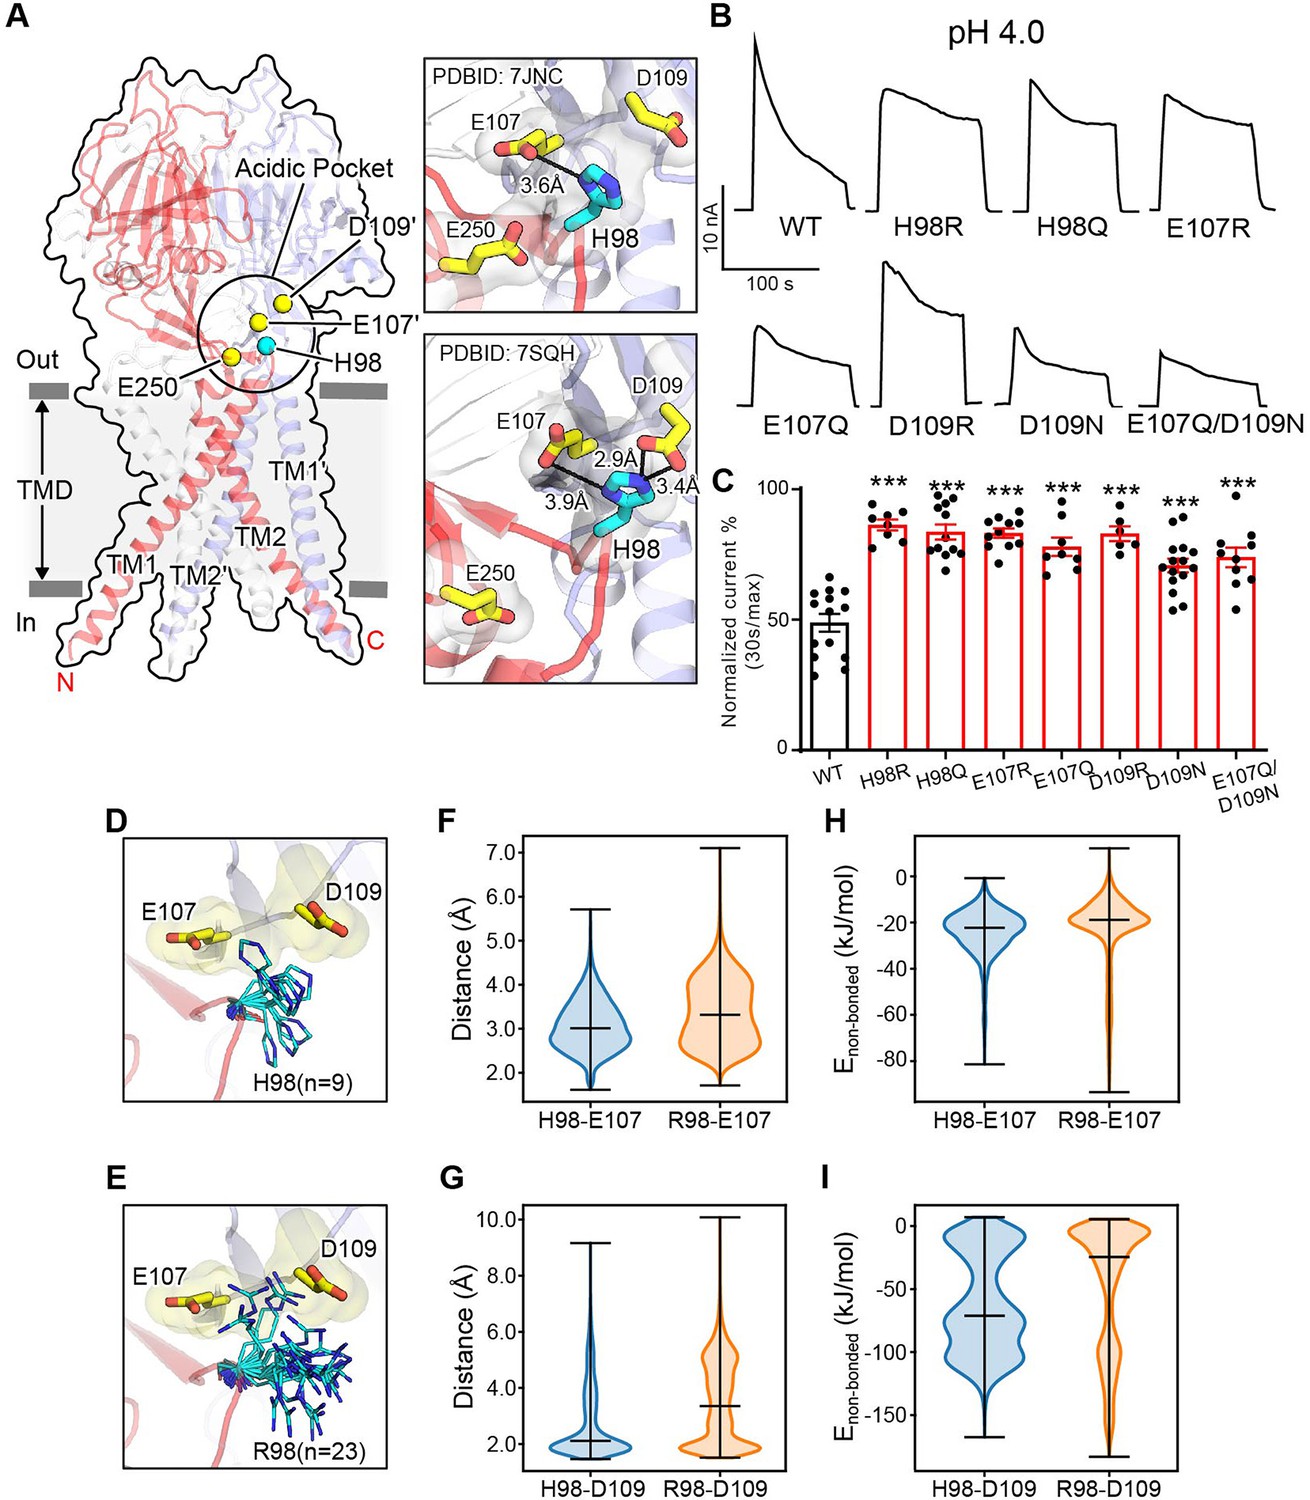
Association of H98 with E107/D109 in the extracellular domain–transmembrane domain (ECD–TMD) interface facilitates proton-activated chloride (PAC) channel desensitization.
(A) The structure of human PAC at pH 4. The acidic pocket residues are shown in yellow spheres. Histidine 98 is shown in a cyan sphere. Close-up views of the local interactions at the acidic pocket are shown on the right. Two recently determined low-pH non-conducting human PAC structures (PDBID 7JNC and 7SQH) are compared. (B) Representative whole-cell current traces of wild-type PAC, and mutants (H98Q, H98R, E107R, E107Q, D109R, D109N, and E107Q/D109N) induced by extracellular pH 4.0 solution at +100 mV. (C) Percentage desensitization of wild-type PAC and mutants. Desensitized current after 30 s of pH 4.0 acidic solution exposure was normalized to the initial maximum current of that recording and expressed as a percentage. Data are mean ± SEM of the pH 4.0-induced currents at +100 mV. ***p<0.001; one-way analysis of variance (ANOVA) with Bonferroni post hoc test. (D–E) The local flexibility of H98 (D) and R98 (E) during molecular dynamics (MD) simulation. Clustering analysis is conducted for the side-chain atoms of H98/R98. The centroid conformation of each identified cluster is shown in the panels. A total of 9 clusters are identified for H98, whereas 23 clusters are found for R98, suggesting increased local flexibility of the H98R mutant. (F) The quantification of the minimum distance between the side-chain atoms of H98/R98 and E107 during the simulation. R98 samples a broader range of conformations relative to H98. (G) The quantification of the minimum distance between the side-chain atoms of H98/R98 and D109 during the simulation. R98 samples a broader range of conformations relative to H98. (H) The non-bonded interaction energy (Coulombic and Leonard-Jones potential) between H98/R98 with E107. The non-bonded energy associated with H98/E107 interaction is stronger when compared to R98/E107. (I) The non-bonded interaction energy (Coulombic and Leonard–Jones potential) between H98/R98 with D109. The non-bonded energy associated with H98/D109 interaction is stronger when compared to R98/D109. For panels (F-I), bars indicate median and extrema.
-
Figure 2—source data 1
Raw data for Figure 2B-C, F-I.
- https://cdn.elifesciences.org/articles/82955/elife-82955-fig2-data1-v1.xlsx
Figure 3
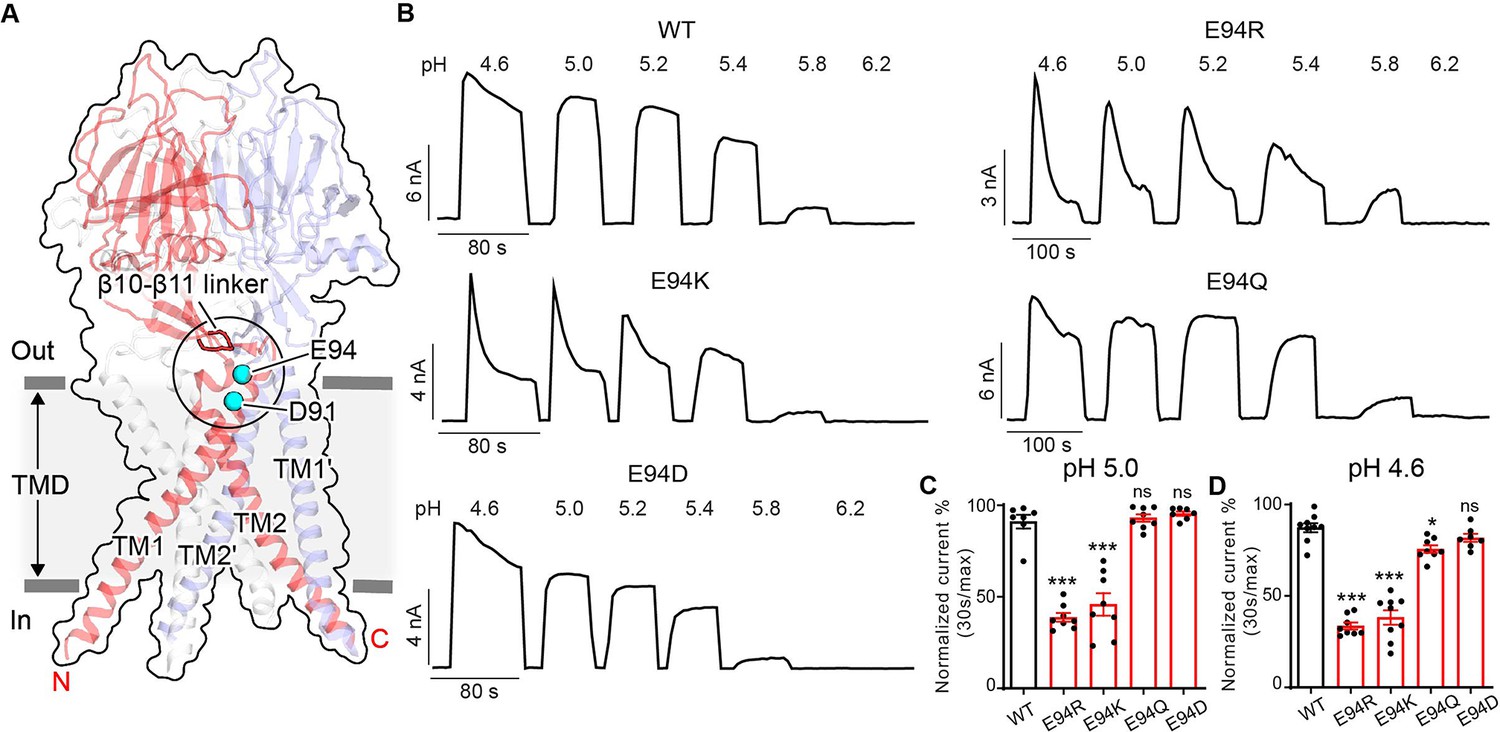
E94 in the extracellular transmembrane helix 1 (TM1) extension is critical for proton-activated chloride (PAC) channel desensitization.
(A) The structure of human PAC at pH 4. The β10–β11 loop is shown in red. Glutamic acid (E) 94 and aspartic acid (D) 91 is shown in a cyan sphere. (B) Representative whole-cell current traces of wild-type PAC, and mutants E94R, E94K, E94Q, and E94D induced by different extracellular acidic pH solutions (4.6, 5.0, 5.2, 5.4, 5.8, and 6.2) at +100 mV. Cells were maintained in a pH 7.3 solution before applying acidic solutions. (C) Percentage desensitization of wild-type PAC, and mutants (E94R, E94K, E94Q, E94D) at pH 5.0. Desensitized current after 30 s of pH 5.0 acidic solution exposure was normalized to the initial maximum current of that recording and expressed as a percentage. Data are mean ± SEM of the pH 5.0-induced currents at +100 mV. ***p<0.001, ns, not significant; one-way analysis of variance (ANOVA) with Bonferroni post hoc test. (D) Percentage desensitization of wild-type PAC, and mutants (E94R, E94K, E94Q, E94D) at pH 4.6. Desensitized current after 30 s of pH 4.6 acidic solution exposure was normalized to the initial maximum current of that recording and expressed as a percentage. Data are mean ± SEM of the pH 4.6-induced currents at +100 mV. *p<0.05, ***p<0.001, ns, not significant; one-way ANOVA with Bonferroni post hoc test.
-
Figure 3—source data 1
Raw data for Figure 3B–D.
- https://cdn.elifesciences.org/articles/82955/elife-82955-fig3-data1-v1.xlsx
Figure 4
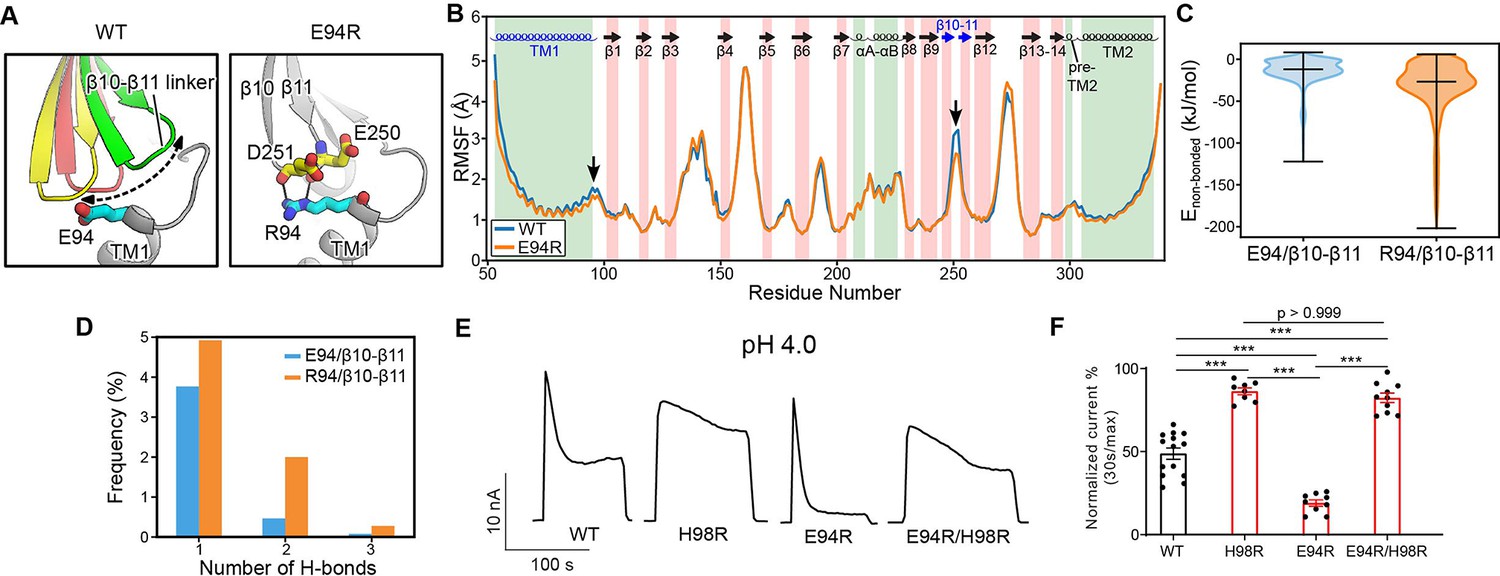
The E94R mutant promotes proton-activated chloride (PAC) channel desensitization by enhancing its interaction with the β10–β11 linker.
(A) A schematic figure shows the impact of E94/R94 on the β10–β11 linker of human PAC at pH 4. (B) The Cα atom root-mean-square-fluctuation (RMSF) of wild-type (WT) and E94R mutant simulations. As indicated by black arrows, a decreased RMSF value is observed for the β10–β11 linker and TM1 for E94R mutant. (C) The non-bonded interaction energy (Coulombic and Leonard–Jones potential) between E94/R94 with the β10–β11 linker of PAC at pH4. Bars indicate median and extrema. (D) The number of hydrogen bonds between H94/R94 with β10–β11 loop. (E) Representative whole-cell current traces of WT PAC, and mutants (H98R, E94R, E94R/H98R) at pH 4.0 and +100 mV. Cells were maintained in pH 7.3 solution before applying acidic solutions. (F) Percentage desensitization of WT PAC, and mutants (H98R, E94R, E94R/H98R) at pH 4.0. Desensitized current after 30 s of pH 4.0 acidic solution exposure was normalized to the initial maximum current of that recording and expressed as a percentage. The WT datasets were pooled from several experiments and shared with Figures 2C and 6C. Data are mean ± SEM of the pH 4.0-induced currents at +100 mV. ***p<0.001; one-way analysis of variance (ANOVA) with Bonferroni post hoc test.
-
Figure 4—source data 1
Raw data for Figure 4B–F.
- https://cdn.elifesciences.org/articles/82955/elife-82955-fig4-data1-v1.xlsx
Figure 5

D91 reduces proton-activated chloride (PAC) channel desensitization by destabilizing transmembrane helix 1 (TM1) and lipid interaction.
(A) Representative whole-cell current traces of wild-type (WT) PAC, and mutants D91R, and D91N induced by different extracellular acidic pH solutions (4.6, 5.0, 5.2, 5.4, 5.8, and 6.2) at +100 mV. The WT trace is the same as in Figure 3B. Cells were maintained in pH 7.3 solution before applying each acidic solution. (B) Percentage desensitization of WT PAC, and mutants D91R, and D91N at pH 5.0. Desensitized current after 30 s of pH 5.0 acidic solution exposure was normalized to the initial maximum current of that recording and expressed as a percentage. Data are mean ± SEM of the pH 5.0-induced currents at +100 mV. ***p<0.001, ns, not significant; one-way analysis of variance (ANOVA) with Bonferroni post hoc test. (C) Percentage desensitization of WT PAC, and mutants D91R, and D91N at pH 4.6. Desensitized current after 30 s of pH 4.6 acidic solution exposure was normalized to the initial maximum current of that recording and expressed as a percentage. The WT data were collected in the same set of experiments and shared with Figure 3C and D. Data are mean ± SEM of the pH 4.6-induced currents at +100 mV. *p<0.05, ***p<0.001; one-way ANOVA with Bonferroni post hoc test. (D) Comparison of the D91 conformation between the desensitized and open states. D91 is facing the lipid bilayer in the desensitized state, whereas it is pointing towards the ion-conducting pore in the open state. Mutation of D91R may destabilize the polar interactions with K95 and N305, resulting in destabilization of the open state. (E) The number of hydrogen bonds between D91/R91 with lipid molecules. R91 makes more favorable hydrogen-bonding interactions with lipid head group, which contribute to the stabilization of the desensitized state.
-
Figure 5—source data 1
Raw data for Figure 5A–C and E.
- https://cdn.elifesciences.org/articles/82955/elife-82955-fig5-data1-v1.xlsx
Figure 6
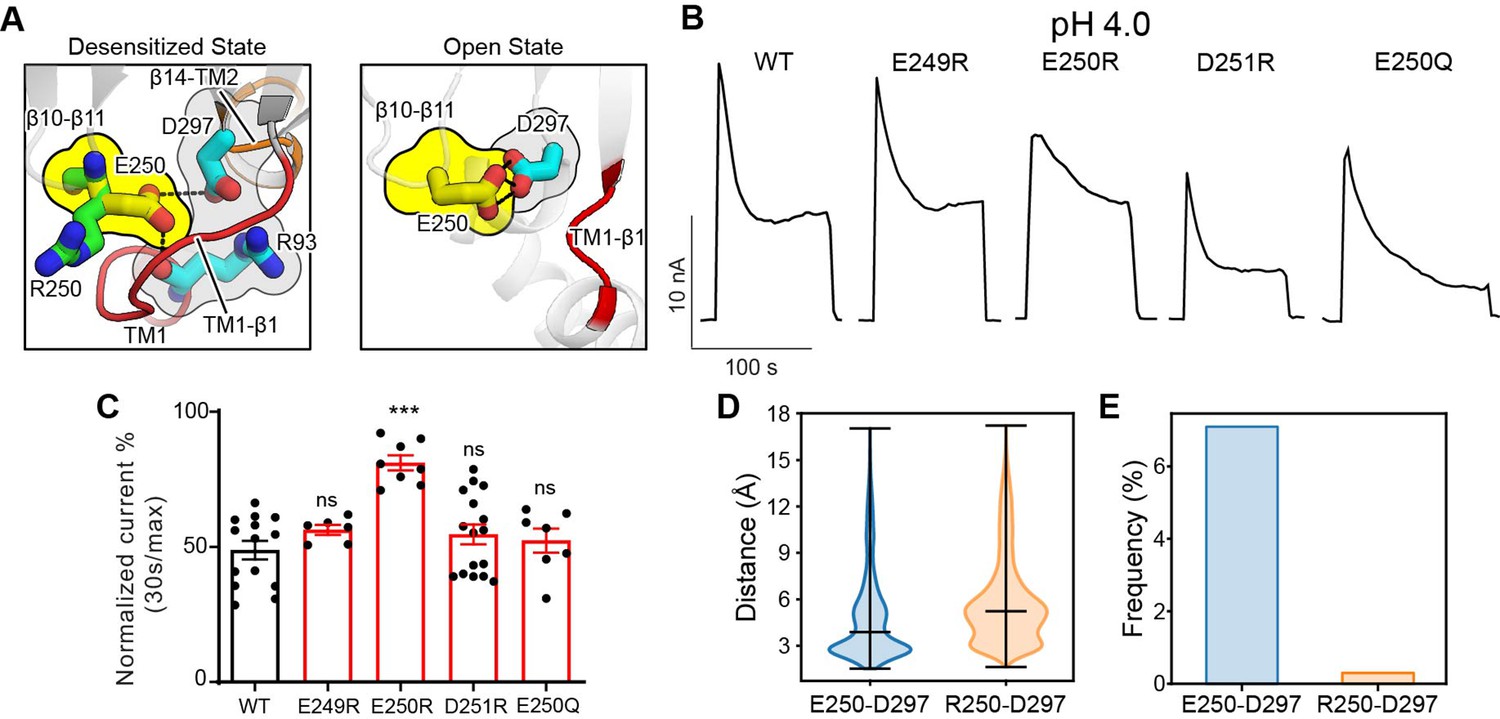
The β10–β11 linker regulates proton-activated chloride (PAC) channel desensitization via interactions with the transmembrane domain (TMD).
(A) Interactions between E250 in β10–β11 linker with TM1–β1 linker (R93) and β14–TM2 linker (D297). The left panel shows the desensitized state of PAC in which an arginine substitution at position 250 would result in its side chain pointing away from the pocket formed by the TM1–β1 and β14–TM2 linkers. The right panel shows the recently determined open state structure of PAC in which TM1–β1 adopts a different conformation which may pose less restriction to the side-chain conformation of E250/R250. (B) Representative whole-cell current traces of wild-type PAC and mutants (E249R, E250R, D251R, E250Q) at pH 4.0 and +100 mV. Cells were maintained in pH 7.3 solution before applying acidic solutions. (C) Percentage desensitization of wild-type PAC and mutants (E249R, E250R, D251R, E250Q) at pH 4.0. Desensitized current after 30 s of pH 4.0 acidic solution exposure was normalized to the initial maximum current of that recording and expressed as a percentage. Data are mean ± SEM of the pH 4.0-induced currents at +100 mV. ***p<0.001, ns, not significant, one-way analysis of variance (ANOVA) with Bonferroni post hoc test. (D) The minimum distance between E250/R250 with D297 during molecular dynamics (MD) simulation. E250R showed a larger distance indicating a weaker interaction with D297. Bars indicate median and extrema. (E) The frequency of forming hydrogen bonds between E250/R250 with D297. Due to the side-chain occlusion, R250 seldom makes hydrogen bond with D297.
-
Figure 6—source data 1
Raw data for Figure 6B–E.
- https://cdn.elifesciences.org/articles/82955/elife-82955-fig6-data1-v1.xlsx
Figure 7

A schematic model showing proton-activated chloride (PAC) channel pH-dependent activation and desensitization.
For simplicity, PAC trimer is depicted as two subunits, in the closed, open, and desensitized states. Excess extracellular acidification leads to PAC desensitization as a result of remodeling of the transmembrane domain (TMD). This process is regulated by critical interactions at the extracellular domain (ECD)–TMD interface, involving residues H98, E94, and D91 at the extracellular extension of the transmembrane helix 1 (TM1) and E107, D109, and E250 at the ECD–TMD interface. These interactions likely facilitate PAC desensitization by stabilizing the desensitized conformation of TM1. Therefore, our structure–function analysis supports the proposal that the previously observed proton-bound non-conducting structures of PAC represent a desensitized state of the channel (Ruan et al., 2020; Wang et al., 2022). Permeation of Cl− ions in the activated open state is illustrated.
Tables
Table 1
The predicted residue pKa value of relevant residues for the wild-type (WT) and mutants investigated.
| WT | H98R | E94R | D91R | |
|---|---|---|---|---|
| pKa(H98) | 6.10 | 12.42 (R) | 6.12 | 6.12 |
| pKa(E107) | 5.28 | 5.53 | 5.29 | 5.27 |
| pKa(D109) | 3.46 | 3.68 | 3.46 | 3.46 |
| pKa(E250) | 4.76 | 4.94 | 4.78 | 4.78 |
| pKa(E94) | 4.84 | 4.79 | 12.53 (R) | 4.52 |
| pKa(D91) | 3.70 | 3.69 | 3.59 | 12.45 (R) |
Key resources table
| Reagent type (species) or resource | Designation | Source or reference | Identifiers | Additional information |
|---|---|---|---|---|
| cell line (Homo-sapiens) | HEK293T | ATCC | Cat#: CRL-3216 | |
| cell line PACC1 knockout (Homo-sapiens) | PAC KO HEK293T | doi:10.1126/science.aav9739 | ||
| recombinant DNA reagent | pIRES2-EGFP-hPAC | doi:10.1126/science.aav9739 | ||
| commercial assay or kit | Lipofectamine2000 | Invitrogen | Cat#: 11668019 | |
| commercial assay or kit | QuikChange II XL site-directed mutagenesis | Agilent Technologies | Cat#: 200522 | |
| software, algorithm | pCLAMP 10.7 | Molecular Devices | RRID:SCR_011323 | |
| software, algorithm | Clampfit 10.7 | Molecular Devices | ||
| software, algorithm | PyMOL 2.3.4 | Schrodinger, LLC | ||
| software, algorithm | Gromacs 2020.1 | doi: 10.1016/j.softx.2015.06.001 | ||
| software, algorithm | CHARMM-GUI | doi: 10.1002/jcc.23702 | ||
| software, algorithm | PPM Web Server | doi: 10.1093/nar/gkr703 | ||
| software, algorithm | Python | Python Software Foundation | ||
| software, algorithm | GraphPad Prism 8 | GraphPad |
Additional files
Download links
A two-part list of links to download the article, or parts of the article, in various formats.
Downloads (link to download the article as PDF)
Open citations (links to open the citations from this article in various online reference manager services)
Cite this article (links to download the citations from this article in formats compatible with various reference manager tools)
Molecular mechanism underlying desensitization of the proton-activated chloride channel PAC
eLife 11:e82955.
https://doi.org/10.7554/eLife.82955


