Firing patterns of ventral hippocampal neurons predict the exploration of anxiogenic locations
- Division of Cognitive Neurobiology, Center for Brain Research, Medical University of Vienna, Austria
- Laboratory of Systems Neuroscience, Department of Physiology, University of Bern, Switzerland
Figures
Figure 1 with 1 supplement
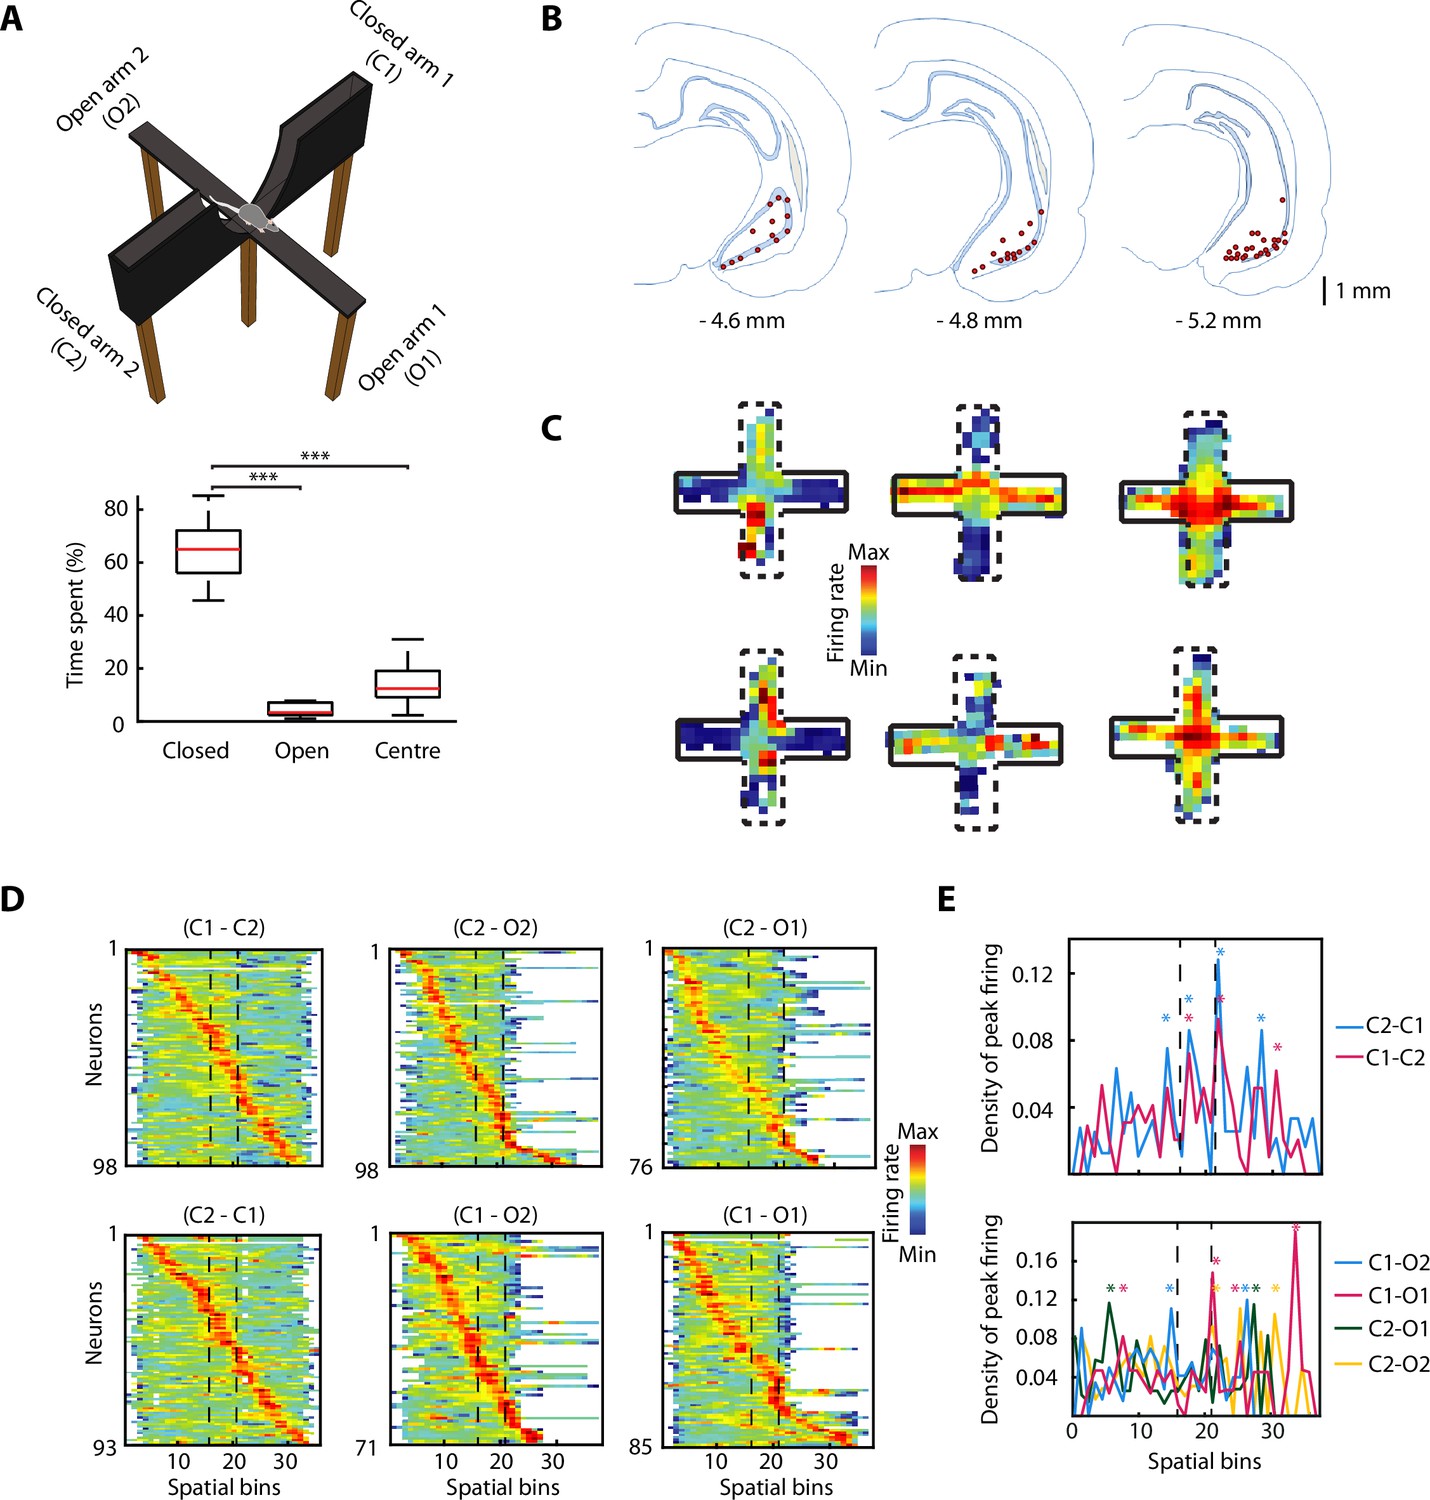
The activity of ventral hippocampal neurons is dynamically modulated during elevated plus maze (EPM) exploration.
(A) Top, picture of the EPM. Bottom, the percentage of the time spent in different areas by the rats (n=6) during the exploration of the EPM. The time spent in closed arms is significantly higher than in the open arms and the centre (p=9.5615e-10, p=9.5657e-10, respectively. One-way ANOVA, Tukey-Kramer for multiple comparisons, n=16 sessions). (B) Location of tetrodes in the ventral hippocampus are indicated by red dots in three consecutive coronal sections (n = 47, number of rats = 8, one additional rat, for which histological location could not be confirmed, was included based on: insertion coordinates, oscillatory LFP profile, and similarity of neuronal activity). (C) Firing rate of six individual neurons during the exploration of the EPM. Full black lines denote a closed arm while the dotted lines indicate an open arm. Note three different anxiety-related activity patterns: increased firing in the open arms (left) or in the closed arms (centre) or in the centre (right). (D) Z-transformed firing rates (colour-coded) of ventral hippocampal neurons during the exploration of the EPM, separated by trajectories and sorted by the spatial location of their peak firing activity. Dotted lines indicated the centre area. (E) Top, density plot of the peak firing activity location for all neurons recorded during the journeys from a closed arm to the other during EPM exploration. Stars indicate the bins with significant higher density, calculated by bootstrapping (see Materials and methods). Note the increased number of peak activity at the centre (i.e. the only open area for these trajectories). Bottom, same as on the top, but for the trajectories between a closed arm and an open arm. The dotted lines denote the beginning and end of the centre area.
Figure 1—figure supplement 1
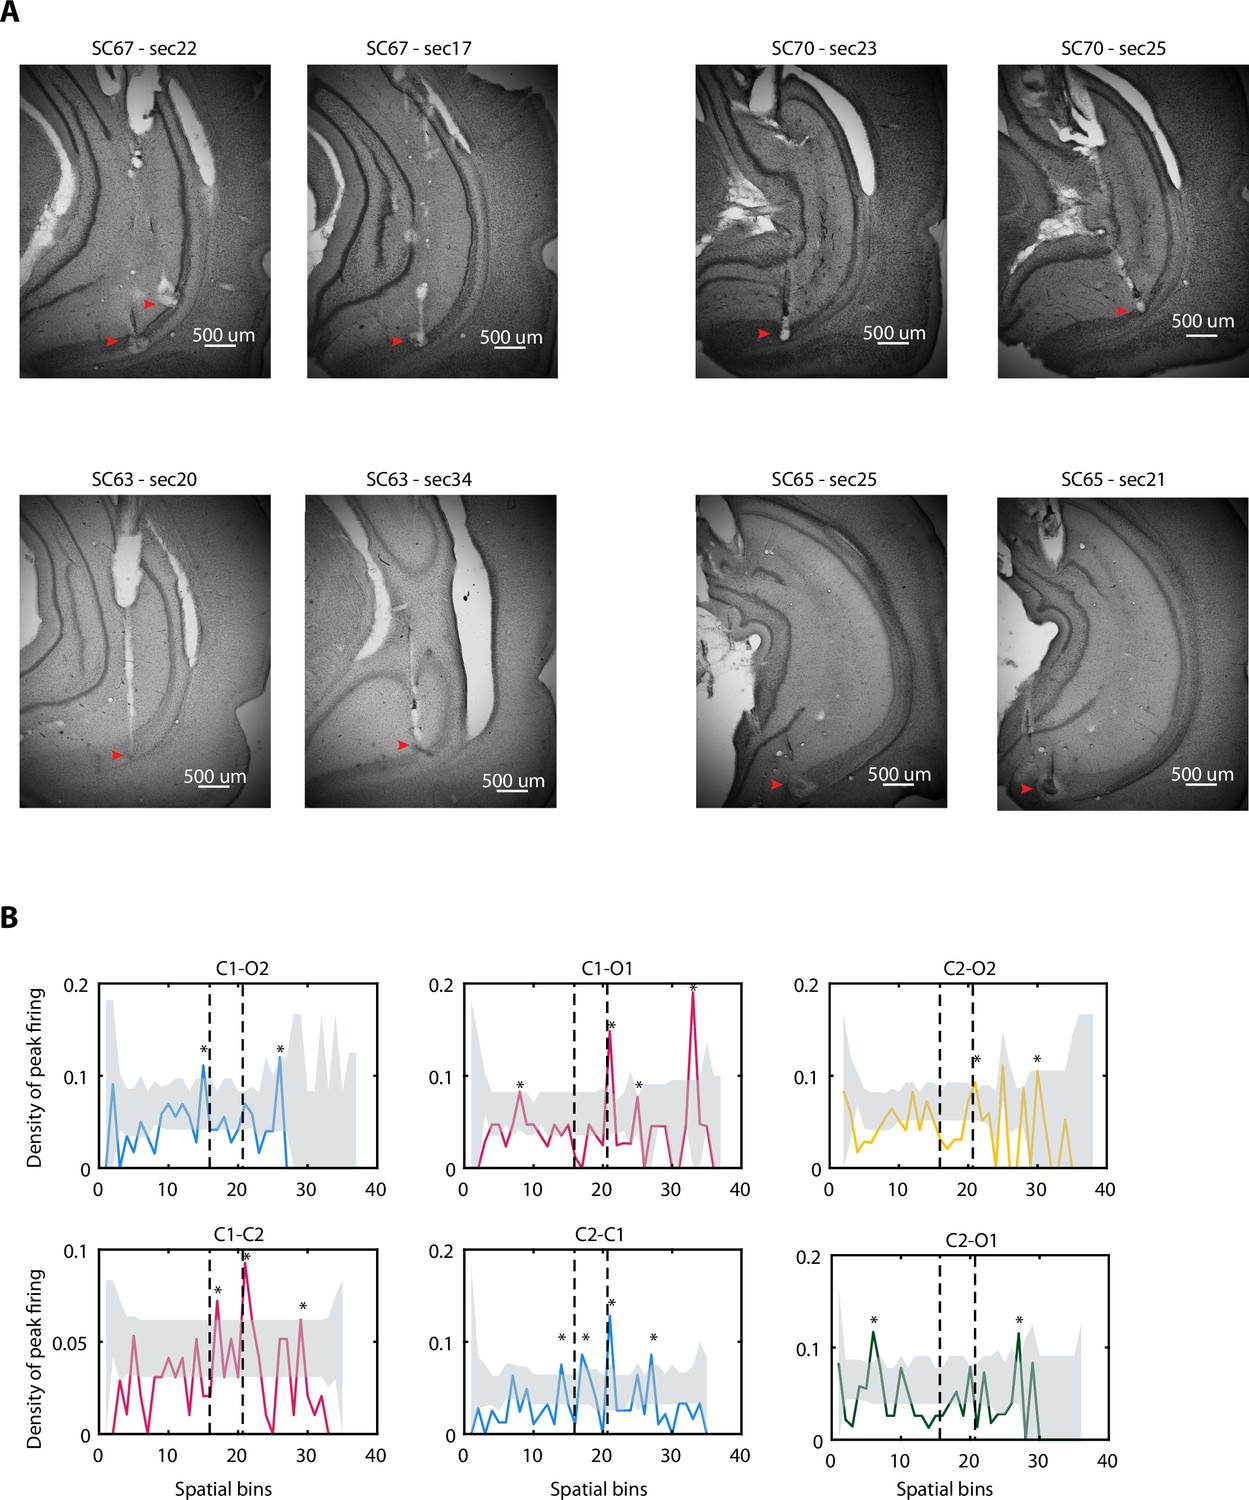
Nissl-stained sections and peak densities.
(A) Nissl-stained sections of four different brains showing the tetrode tracks. Red arrows indicate the tip end and electric lesion (see Materials and methods). (B) Density plots of peak firing from Figure 1E but separated by trajectory. Dotted lines represent beginning and end of the central area. Stars represent bins with significant higher density determined by bootstrapping (see Materials and methods). Shuffled distribution (median to 95th percentile) is shaded in grey.
Figure 2 with 1 supplement
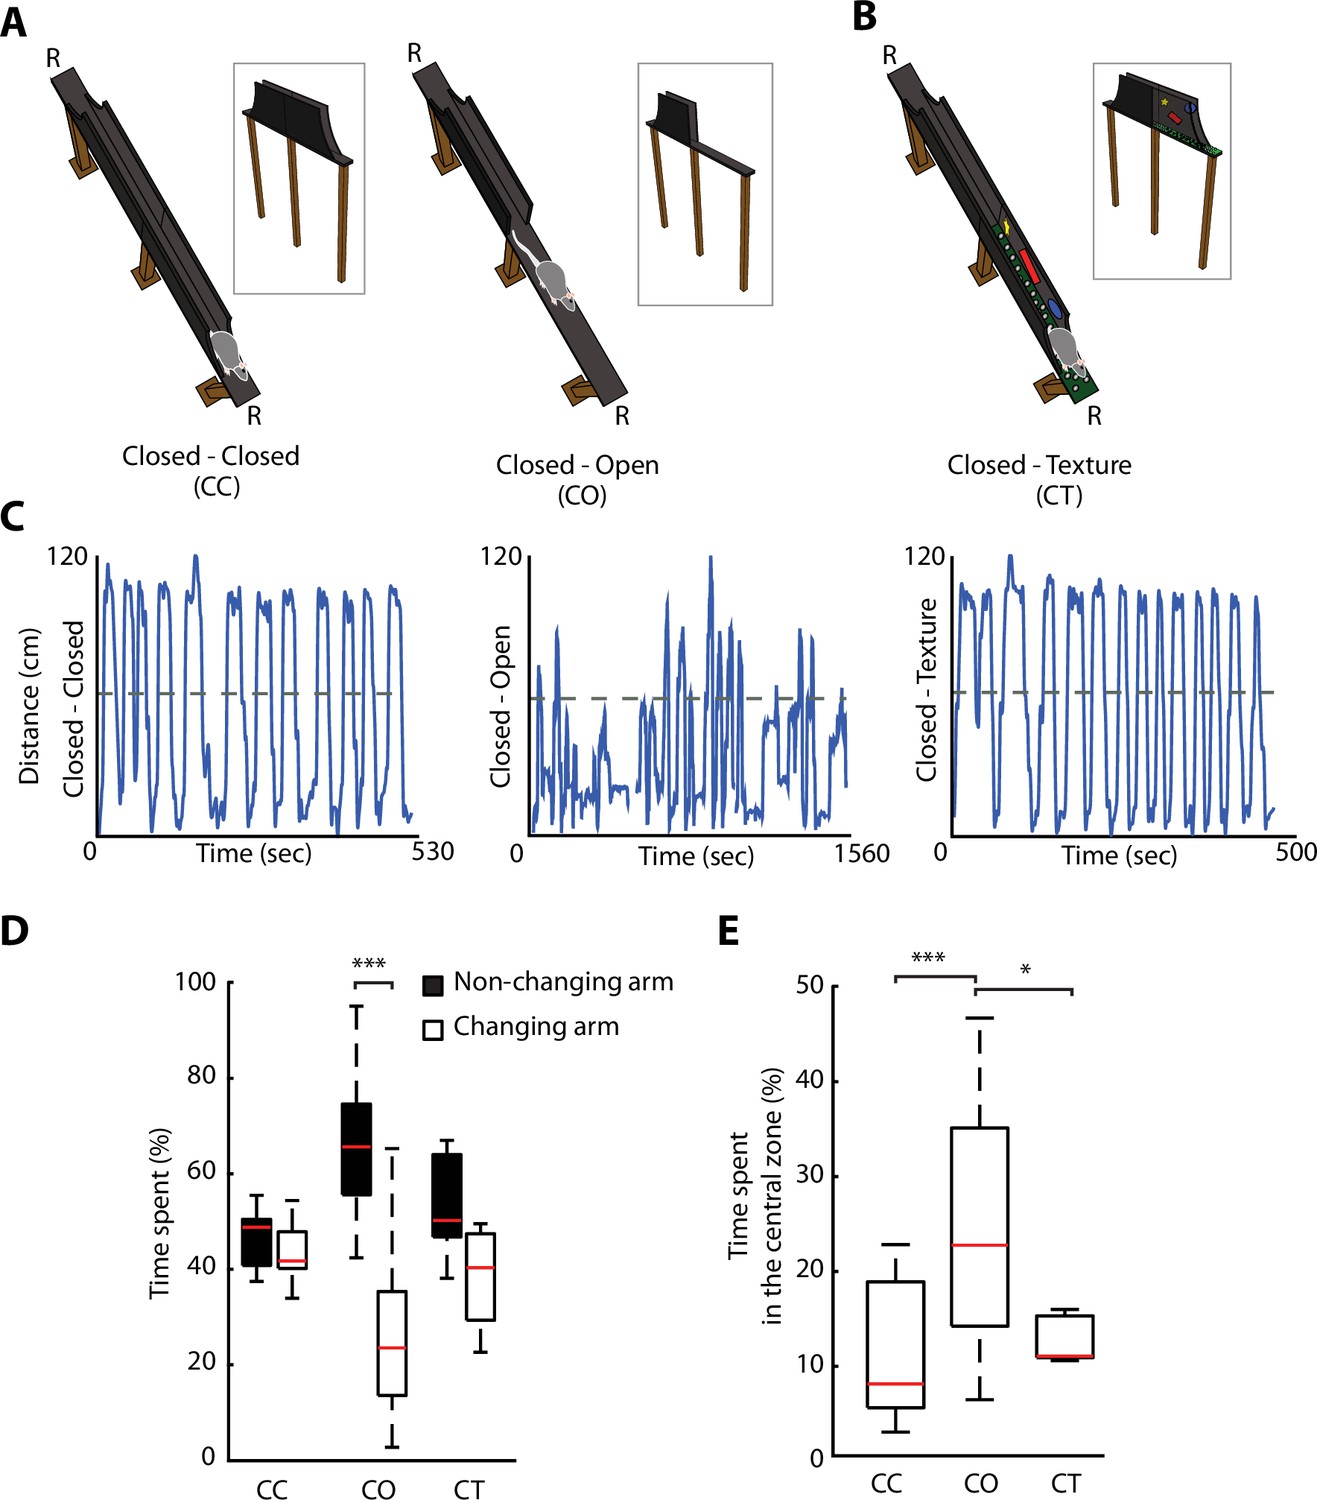
Removal of protective sidewalls along an elevated linear maze (ELM) induces anxiety behaviour.
(A). ELM configurations with sidewalls along the entire track (closed-closed [CC], both arms closed, left), and with sidewalls removed for half of the track (closed-open [CO], called one arm closed – one arm open, right). Note the presence of a non-changing arm, while the other arm changes from a closed to an open configuration. R, indicates locations of food reward. (B) ELM configuration with both arms closed, but the floor texture and visual cues on inner-walls are changed in one of the arms (CT, closed and texture arm). (C) Linearised trajectories of a rat running in the three different ELM configurations during a single behavioural session. The grey line denotes the centre of the linear maze and the division between the two arms. (D) Time spent in both the non-changing and the changing arm in each configuration. Significant differences in the time spent appeared solely in the CO configuration (p=1.45e-05, Wilcoxon signed-rank, n=14 sessions). (E) More time spent in the central zone (defined as 11.5 cm around centre of the track) in the CO configuration in comparison to the CC and CT configurations (p=2e-05 and p=0.034, respectively, one-way ANOVA, Tukey-Kramer for multiple comparisons, n=14 sessions).
Figure 2—figure supplement 1

Analysis of runs along the elevated linear maze (ELM) for different configurations.
(A) Boxplots of the number of trials per session for each configuration. (B) Boxplots of the number of rewarded (Rew., green) or not rewarded trials (N.Rew., white) per session for each configuration. Red lines are the medians, red dots the outliers.
Figure 3 with 3 supplements
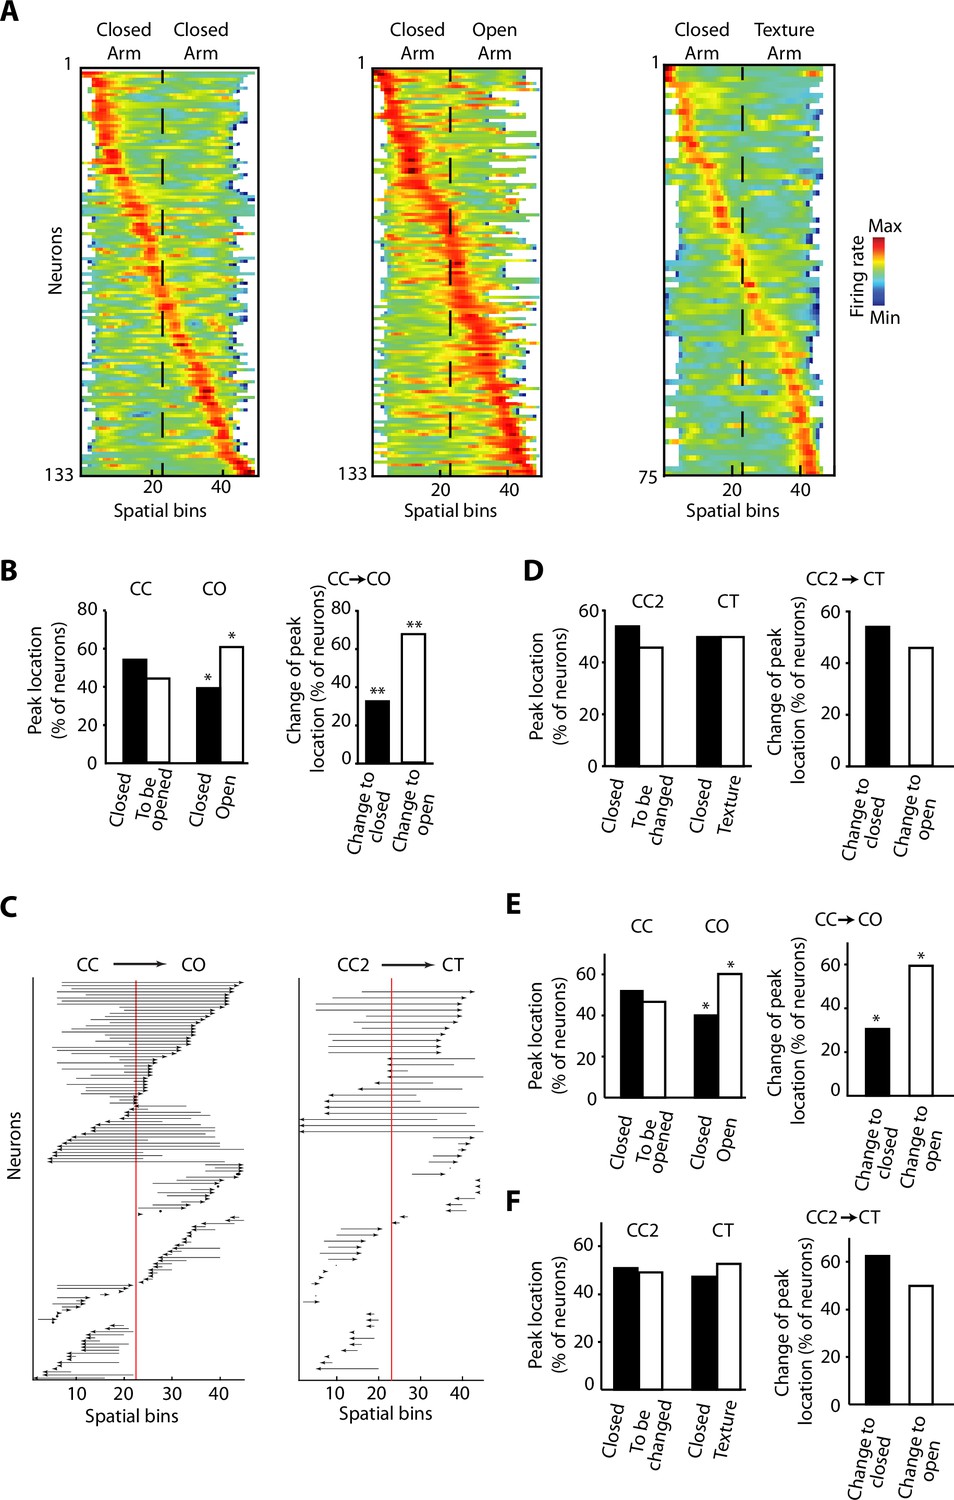
Overrepresentation and remapping of ventral hippocampal activity during anxiety.
(A) Z-transformed firing rates (colour coded) of ventral hippocampal neurons during the exploration of the elevated linear maze (ELM) and sorted by the spatial location of their peak firing activity for the three configurations: closed-closed (CC) (left); closed-open (CO) (centre); closed-texture (CT) (right). The order of neurons is sorted for each configuration independently. Dotted lines indicated the centre of the maze. Note that firing rates of neurons remain mostly in the middle ranges (green colour), which is different from classical place cells of the dorsal hippocampus. There is an increased number of neurons with peak firing activity in the open arm. (B) Left, comparisons of the percentage of neurons with peak firing activity located in the different arms of the CC and CO configurations of ELM. Note the significant differences of the proportion of neurons with peak firing activity in the open arm (p=0.0119, chi-squared test, total n=133). Right, upon removal of the sidewalls, a larger proportion of neurons change the location of their peak firing activity from a previously closed to a currently opened arm (p=0.0066, chi-square test, total n=59). (C) Changes of the spatial location of the peak firing activity for individual neurons between different configurations. Each arrow denotes the remapping of the location of the peak firing activity between the CC (base of the arrow) and the CO configurations (arrowhead). The red line indicates the centre of the linear maze. Note that the peak firing activity of the neurons shifted towards the open arm when changing from the CC to CO configuration. (D) Same analysis as in (B) for the CT configuration. CC2 is a configuration with sidewalls along the entire track (fully closed) explored right before the presentation of the CT configuration. No significant differences were observed. (E) Left, comparisons of the percentage of neurons with peak firing activity (after correction of the speed influence in the spiking activity by using the residuals of the generalised linear model [GLM]) located in the different arms of the CC and CO configurations of ELM (p=0.019, chi-squared test, total n=133). Right, upon removal of the sidewalls, a larger proportion of neurons change the location of their peak firing activity (after correction of the speed influence in the spiking activity) from a previously closed to a currently opened arm (p=0.0189, chi-square test, total n=59). (F) Same analysis as in (E) for the CT configuration. CC2 is a configuration with sidewalls along the entire track (fully closed) explored right before the presentation of the CT configuration. No significant differences were found.
Figure 3—figure supplement 1
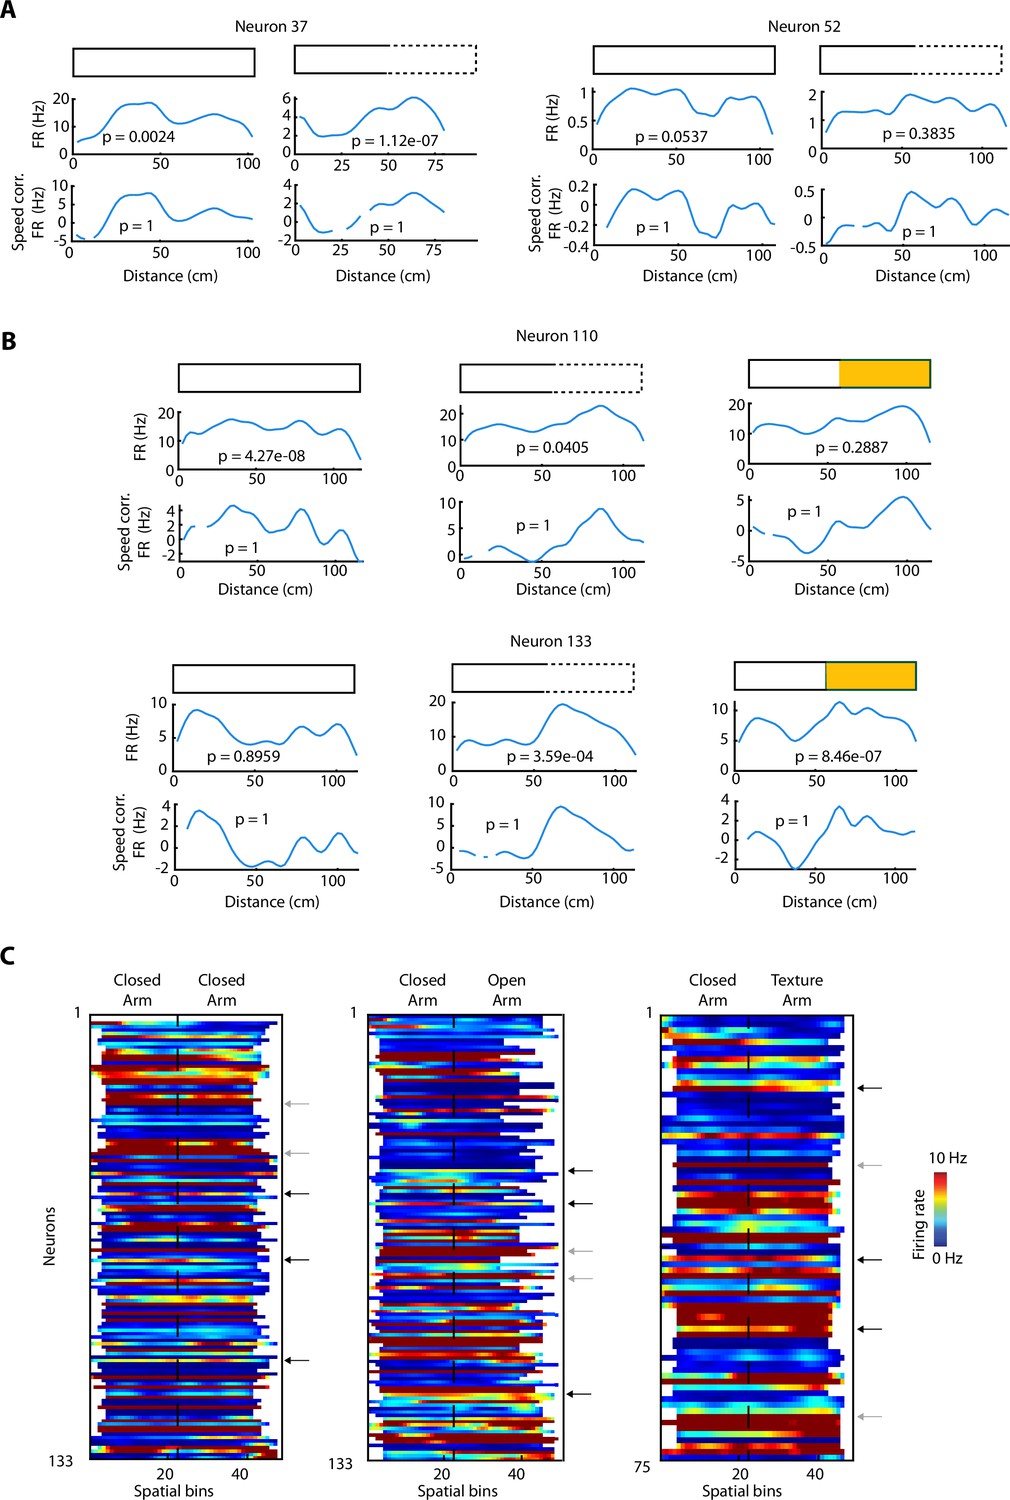
Neuronal activity during elevated linear maze (ELM) exploration.
(A) Activity of two individual vCA1 hippocampal neurons during the ELM exploration. For each neuron: top, configurations, closed-closed (CC) (shown by a rectangle with full lines) and a closed-open (CO) (shown by a rectangle with half full and half dashed lines). Middle, mean neuronal activity averaged during the entire exploration (see Materials and methods). Bottom, same as the middle, but for the activity corrected by the animal’s speed (see Materials and methods). The p-values on each panel denote the significance associated with the linear regression between the neuronal activity and the animal’s speed. (B) Same as in (A) but with an additional panel for the closed-texture (CT) exploration (half full, half yellow). (C) Data from Figure 3A are replotted here without z-scoring. Firing rates (colour coded to a maximum of 10 Hz) of ventral hippocampal neurons during the exploration of the ELM and sorted by the spatial location of their peak firing activity for the three configurations: CC (left); CO (centre); CT (right). The order of neurons is sorted for each configuration independently. Dotted lines indicated the centre of the maze. Black arrows indicate three individual neurons with a spatial peak, but the rest of the firing is still elevated. Grey arrows indicate two individual neurons per configuration with firing rates during the exploration of the ELM constantly above 10 Hz, therefore saturating to the maximum colour (red).
Figure 3—figure supplement 2
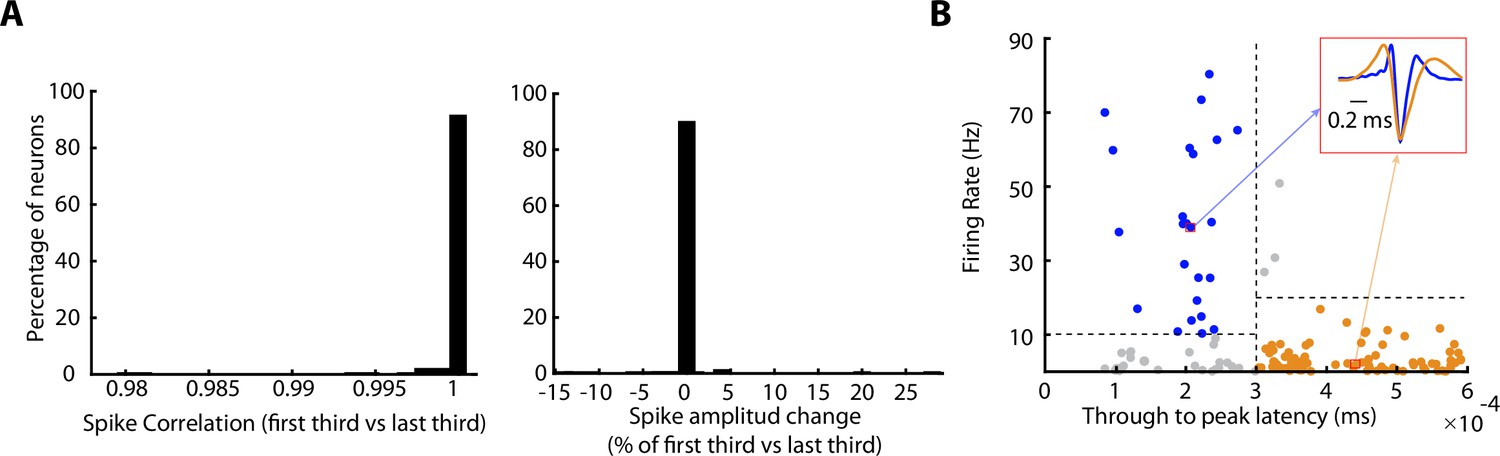
Spike-shape analyses.
(A) Left, histogram of the correlation between the averaged spike shapes of the first third and last third of the recording. Note that 100% of the neurons showed higher correlation than 0.98, implying that the spike shape is not changing between the start and the end of a recording. Right, histogram of the spike-amplitude’s change (%) between the averaged spike shapes of the first third and the last third of the recording. Note that more than 90% of the neurons show an amplitude change between –0.5% and 0.5% from the amplitude at the start. (B) Differentiation of putative pyramidal cells (yellow) and putative interneuron (blue), taking into account firing rate and the spike width (though-to-peak latency; see Materials and methods). Each dot indicates a neuron. Three neurons represented by grey dots were not classified. Red square shows the averaged spike of two individual neurons.
Figure 3—figure supplement 3
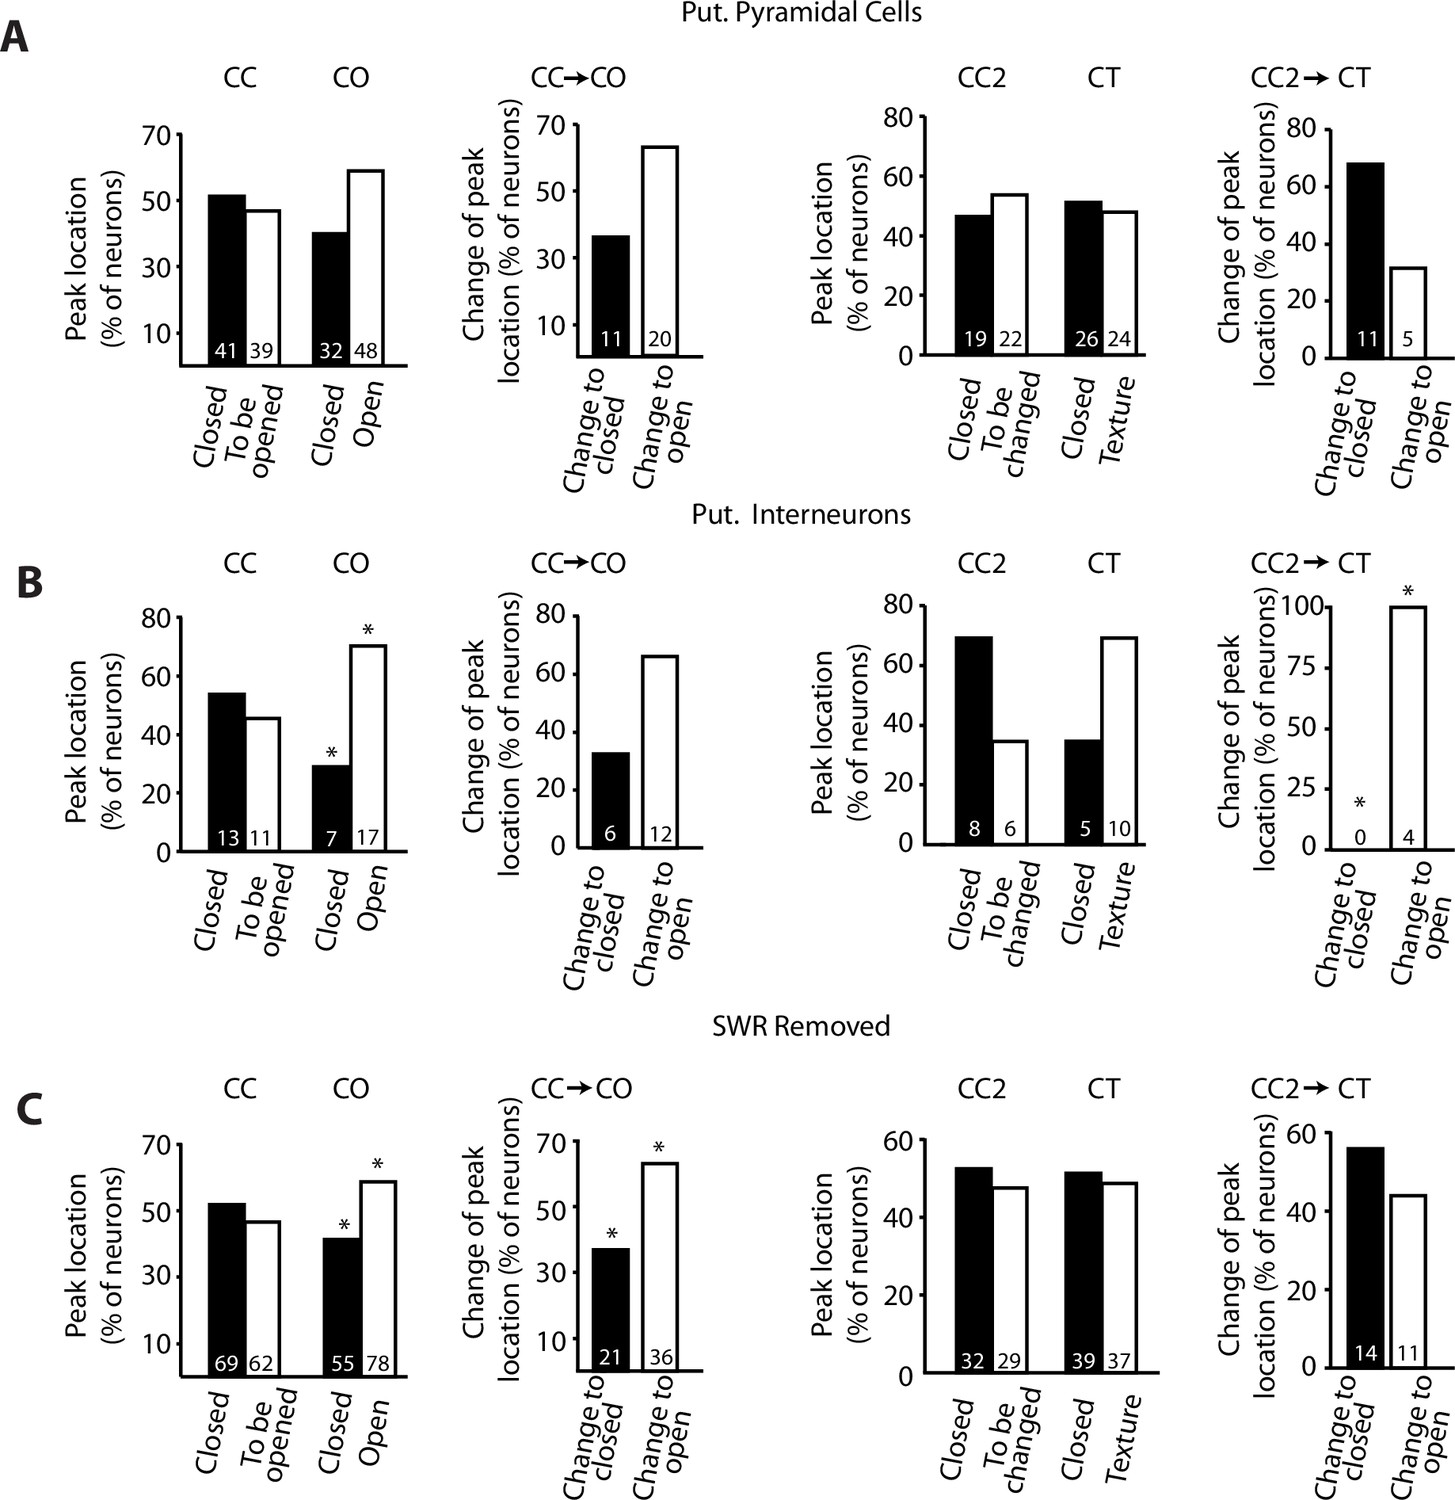
Remapping proportions for different subdivisions.
(A) Same comparisons as in Figure 3B and C but only taking into account putative pyramidal cells. No significant differences were observed for the distribution of peak firing rates when expected range is random (50%–50%). If distributions in the closed-close (CC) exploration are considered the expected range in the closed-open (CO) exploration, then the amount of putative pyramidal neurons with peak firing activity in the open arm was significant (p=0.044, chi-squared test). (B) Same comparisons as in Figure 3B and C but only taking into account putative interneurons. Upon removal of the sidewalls, the amount of putative interneurons with peak firing activity in the open arm was significant for the CO exploration (p=0.04, chi-squared test). If distributions in the CC and CC2 explorations were considered as the expected range in the CO and closed-texture (CT) explorations, respectively, then the amount of putative interneurons with peak firing activity in the open arm was significant for the CO exploration (p=0.014, chi-squared test) as well as for the CT exploration (p=0.001, chi-squared test). (C). Same comparison as in Figure 3B and C but after removing all sharp-wave ripple (SWR)-associated spikes (see Materials and methods). Similar to Figure 3, the proportion of neurons with peak firing activity in the open arm was significant (p=0.0461, chi-squared test) as well as the proportion of neurons that changed the location of their peak firing activity upon removal of the sidewalls, from a previously closed to an opened arm (p=0.047, chi-square test). Significances were preserved when the expected range for the chi-squared test was not defined as 50%–50% of the population but rather the range on the CC exploration. For information about the tests with different expected ranges, see Materials and methods.
Figure 4 with 1 supplement
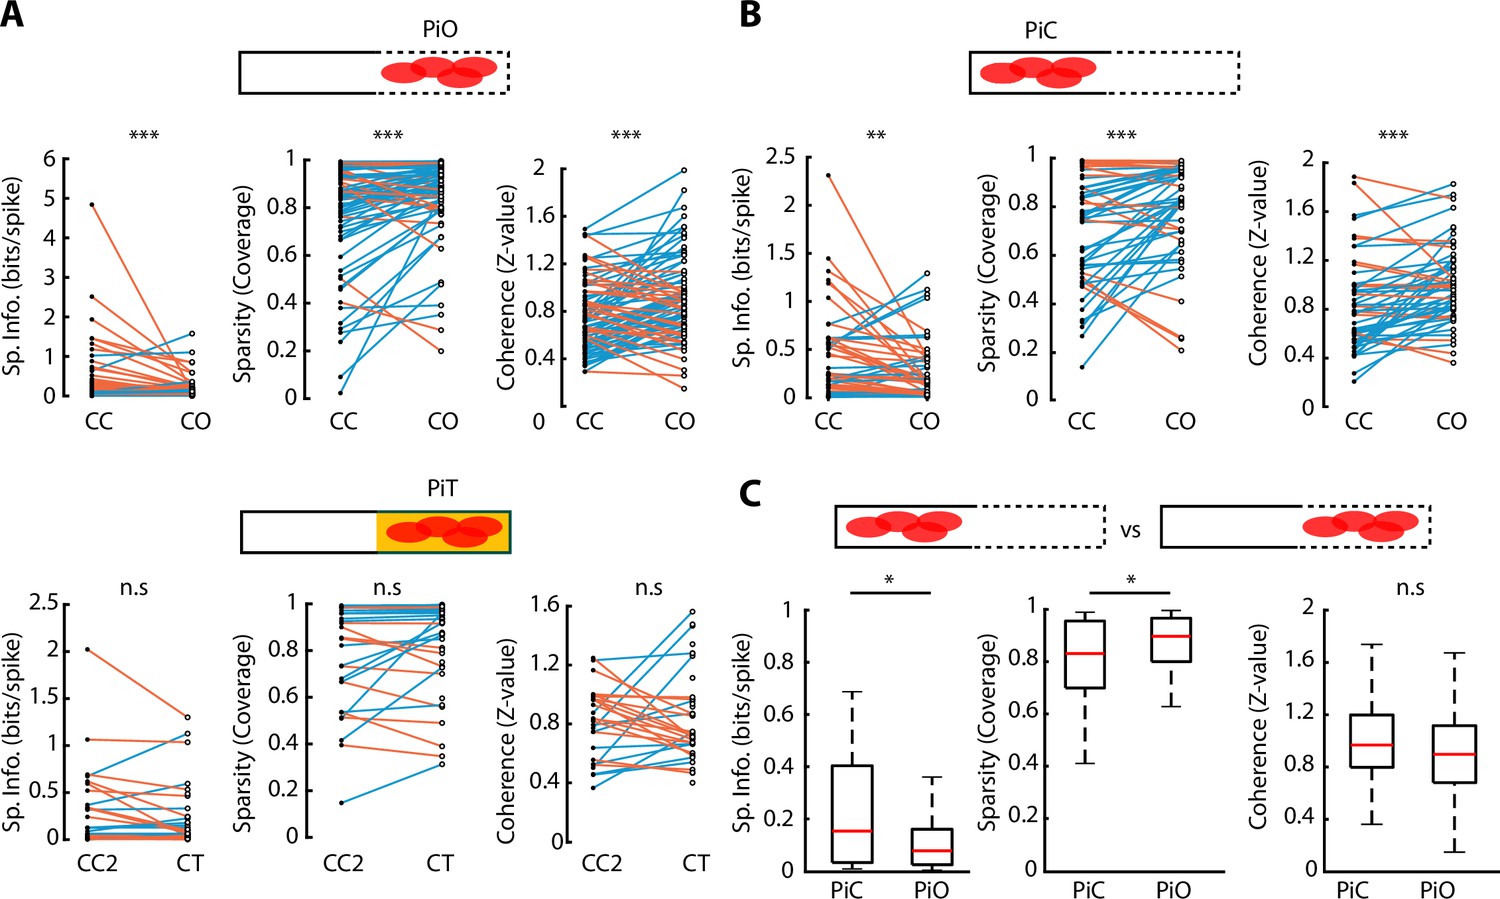
Spatial properties of neuronal activity during elevated linear maze (ELM) exploration.
(A) Top, paired comparison of the spatial properties for PiO (firing peak in open area of the closed-open [CO] configuration) neurons between their activity in the closed-closed (CC) and the CO configurations. Spatial information (p=1.66e-05, Wilcoxon signed-rank test, n=81), sparsity (p=6.86e-05, Wilcoxon signed-rank, n=81), and coherence (p=1.88e-05, Wilcoxon signed-rank, n=81) were significantly different. Blue lines indicate an increase in the score while orange lines indicate a decrease. Bottom, paired comparison of the spatial properties for PiT (firing peak in the texture area of the closed-texture [CT] configuration) neurons between their activity in the CC2 and the CT configurations. No significant difference in spatial information, sparsity, or coherence was observed (n=38). (B) Paired comparison of the spatial properties for PiC (firing peak in closed area of the CO configuration) neurons between their activity in the CC and the CO configurations. Spatial information (p=0.0074, Wilcoxon signed-rank test, n=52), sparsity (p=9.68e-04, Wilcoxon signed-rank test, n=52), and coherence (p=2.86e-04, Wilcoxon signed-rank test, n=52) were significantly different. (C) Comparison of spatial information, sparsity, and coherence during CO configuration between PiC and PiO neurons. Significant differences are observed in spatial information (p=0.0130, Wilcoxon rank-sum test) and sparsity (p=0.0311, Wilcoxon rank-sum test).
Figure 4—figure supplement 1
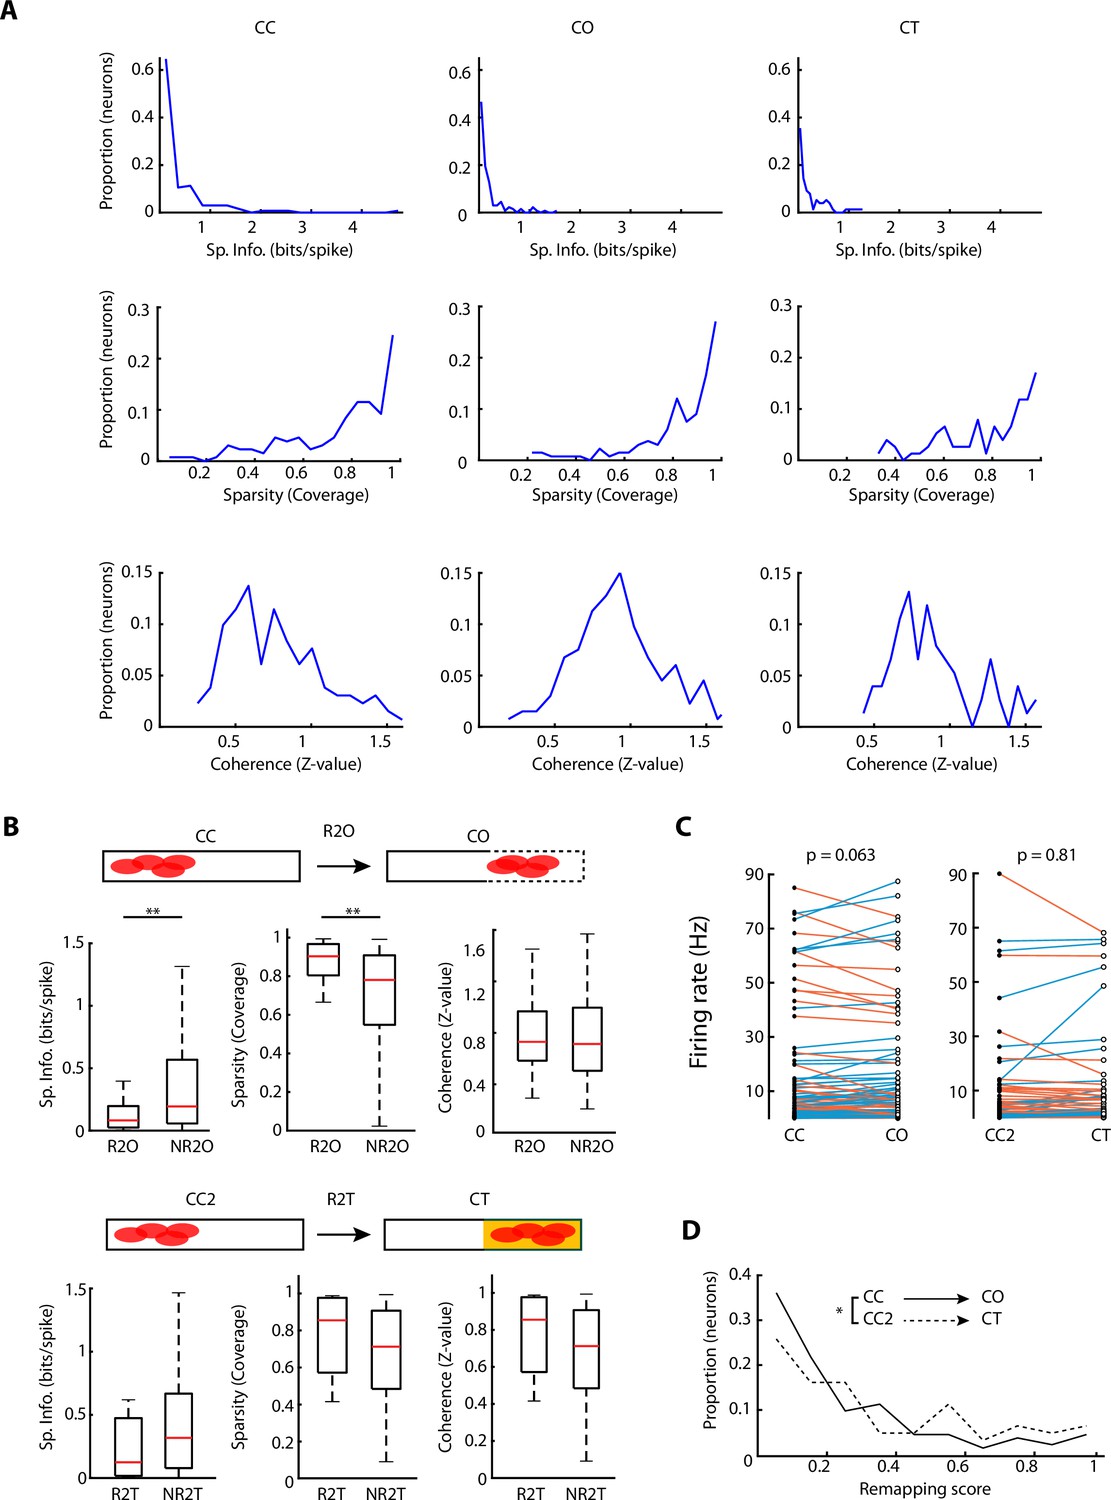
Spatial and firing – properties of recorded neurons.
(A) Histograms of the spatial properties of neurons for different configurations (top: spatial information, middle: sparsity, bottom: coherence). (B) Top panels, spatial properties comparison (spatial information, sparsity, and coherence) between neurons that change peak firing from the non-changing closed arm in the closed-closed (CC) exploration, towards the open arm in the closed-open (CO) exploration (R2O) and neurons that do not change peak firing location (NR2O). Significant differences were found in spatial information (p=0.0029, Wilcoxon rank-sum test, R2O: n=40 and NR2O: n=93) and sparsity (p=0.0016, Wilcoxon rank-sum test, R2O: n=40 and NR2O: n=93). Bottom panels, same as the top, but for neurons that changed peak firing from the non-changing closed arm in the CC2 exploration, towards the texture arm in the closed-texture (CT) exploration (R2T) and neurons that do not change peak firing location (NR2T). No significant differences were found. (C) Paired comparison of the neurons’ firing rates between CC to CO configurations, and CC2 to CT configurations. No significant differences were found. (D) Histogram of remapping score (see Materials and methods) of neuronal firing rates between CC-CO (black) and CC2-CT (dotted black). Remapping score was higher between CC2-CT in comparison to CC-CO configuration change (p=0.0358, Wilcoxon rank-sum test, CC to CO: n=133, CC2 to CT: n=62).
Figure 5 with 1 supplement
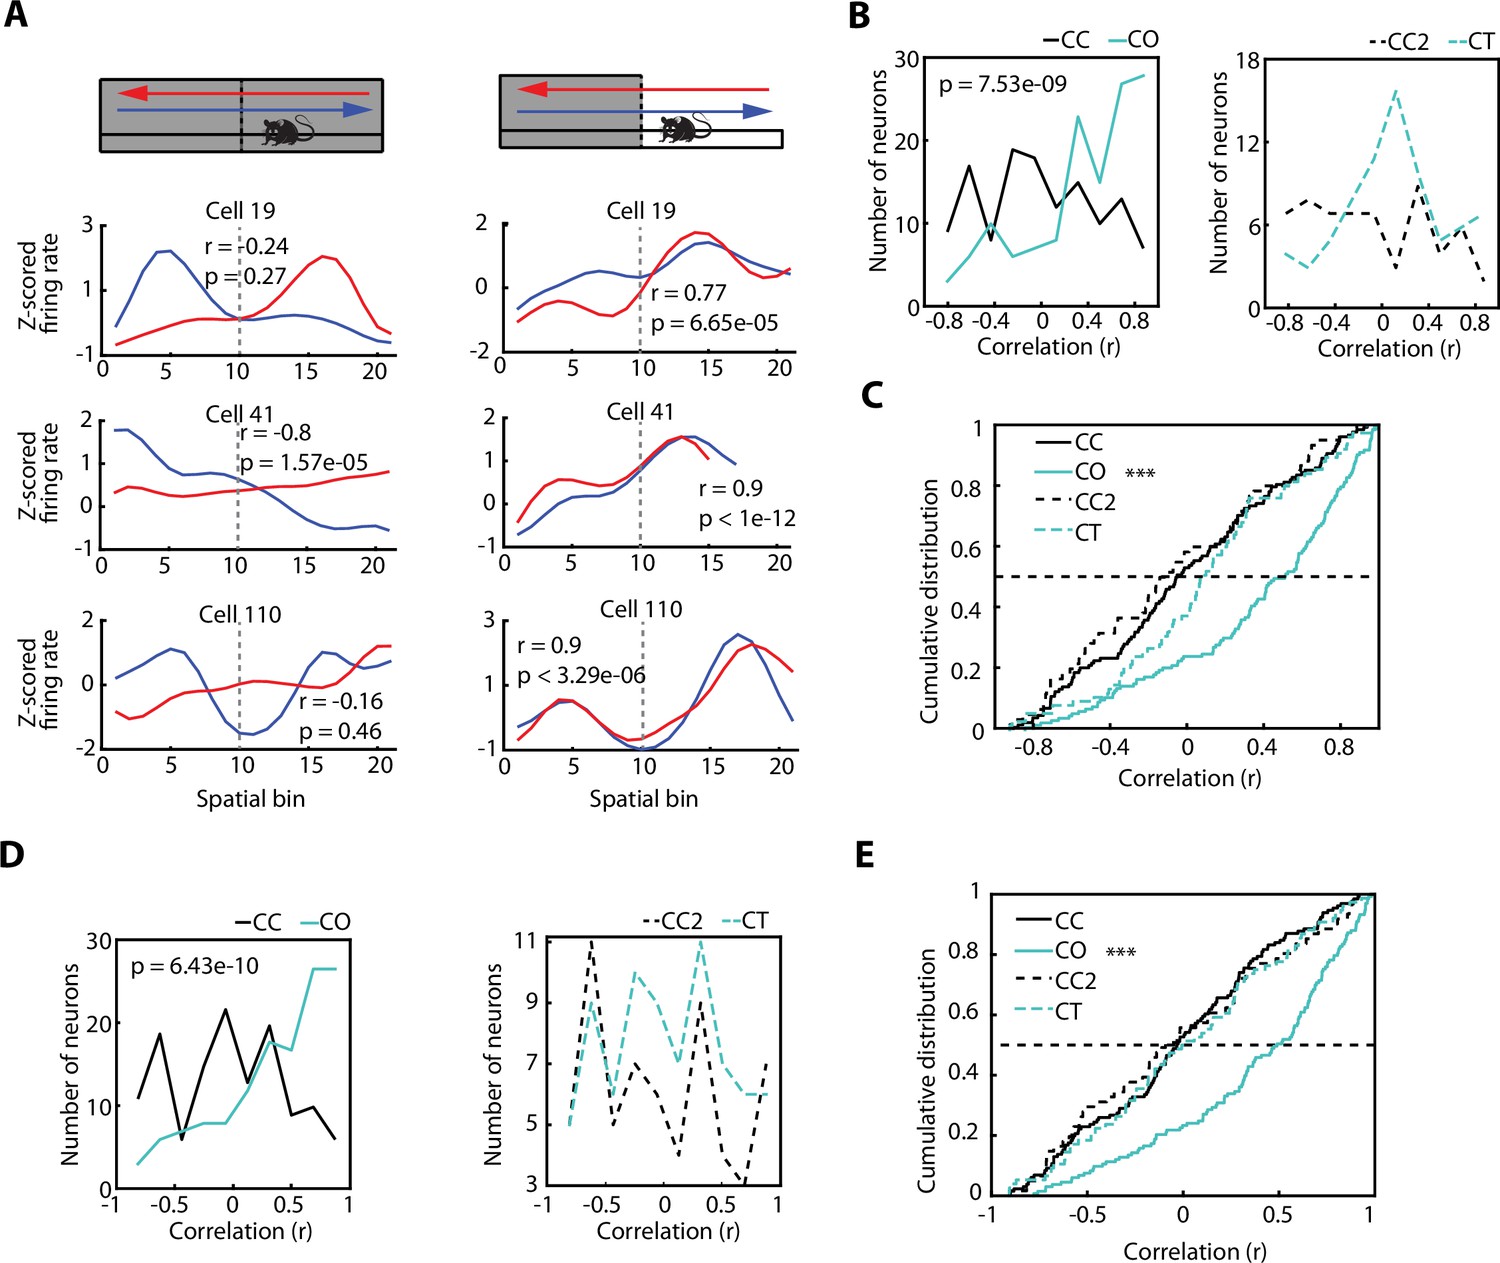
The direction-dependent activity of vCA1 neurons is homogenised after exposure to an anxiogenic location.
(A) Neuronal activity of individual ventral hippocampus (vH) neurons while animals explored the elevated linear maze (ELM) in both the closed-closed (CC) and the closed-open (CO) configuration. Blue lines denote when animals headed towards the arm that will be open (in the case of the CC configuration) or is open (in the case of the CO configuration). Red lines denote when animals returned from this arm. Correlation values (Spearman correlation) indicate the similarity between the neuronal activities of both trajectories. (B) Histograms of the firing rate maps similarity index (place field similarity [PFS], see Materials and methods) for the activities of single neurons calculated in the two possible directions on the ELM (left to right and right to left). Left, PFS index is higher during the CO configuration (cyan) compared to the CC (black) configuration (p=7.53e-09, Wilcoxon rank-sum test, CC: n=128 and CO: 133). Right, PFS index is not significantly different during the closed-texture (CT) configuration (dotted cyan) compared to the CC2 (dotted black) configuration (CC2: n=60 and CT: n=75). (C) Cumulative distributions of the PFS indexes for the CC, CO, CT, and CC2 configurations. Note that during the CO configuration the PFS index of neurons is significantly higher compared to the other configurations (vs CC, p=7.53e-09; vs CT, p=4.6e-05; and vs CC2 p=1.68e-07; Wilcoxon rank-sum test). (D) Histograms of the firing rate maps similarity index (PFS, see Materials and methods) for the activities of single neurons (after correction of the speed influence in the spiking activity) calculated in the two possible directions on the ELM (left to right and right to left). Left, PFS index is higher during the CO configuration (cyan) compared to the CC (black) configuration (p=6.43e-10, Wilcoxon rank-sum test). Right, PFS index is not significantly different during the CT configuration (dotted cyan) compared to the CC2 (dotted black) configuration. (E) Cumulative distribution of the PFS indexes in (D) for the CC, CO, CT, and CC2 configurations. Note that during the CO configuration the PFS index of neurons is significantly higher compared to the other configurations (vs CC, p=6.43e-10; vs CT, p=3.06e-06; and vs CC2 p=4.32e-06; Wilcoxon rank-sum test).
Figure 5—figure supplement 1
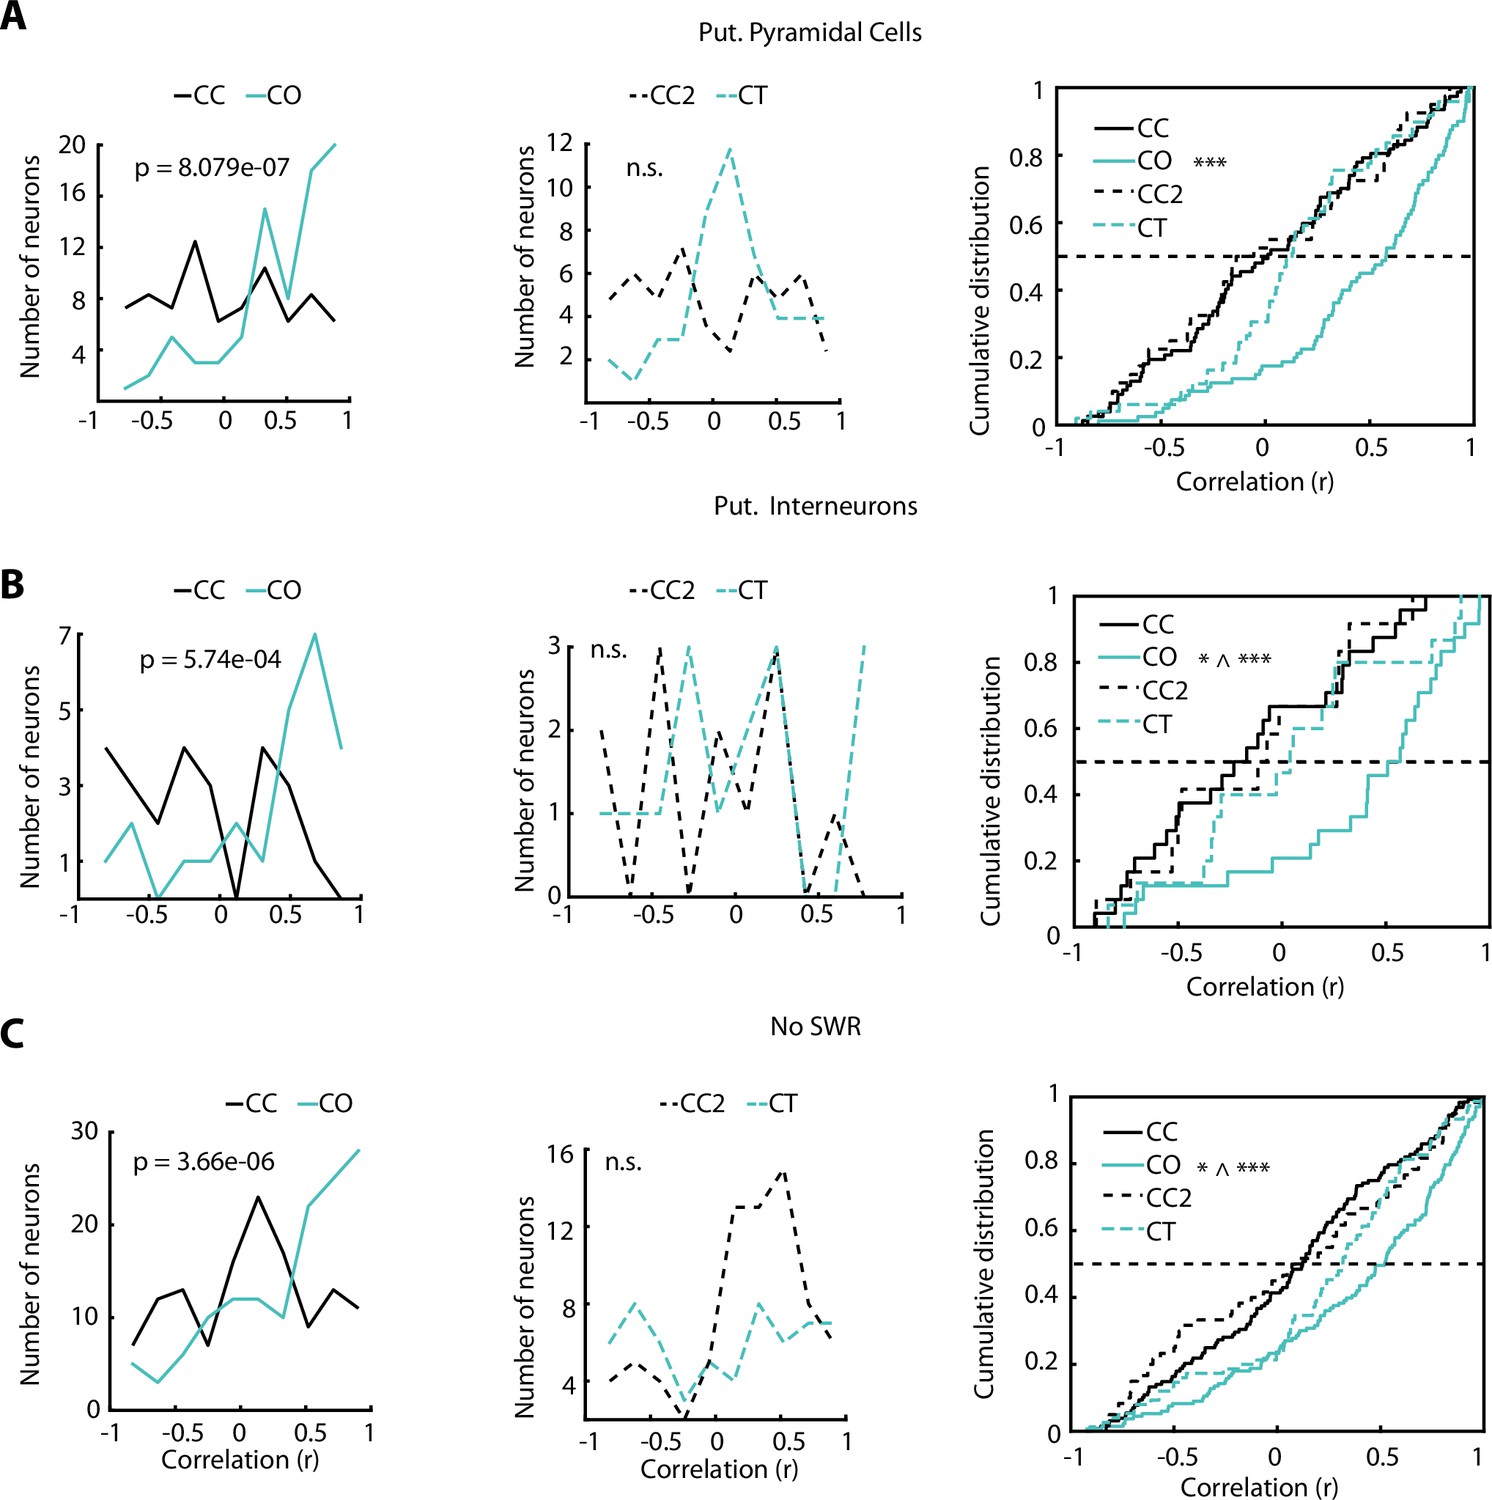
Additional analysis on the direction-dependent activity of ventral hippocampus (vH) neurons.
(A) Same comparisons as in Figure 5B and C but only for putative pyramidal neurons. Place field similarity (PFS) index was higher during the closed-open (CO) configuration (cyan) compared to the closed-closed (CC) (black) configuration (p=8.079e-07, Wilcoxon rank-sum test, CC: n=77 and CO: n=80). During the CO configuration, the PFS index of putative pyramidal neurons was significantly higher compared to other configurations (vs CC, p=8.079e-07; vs CT [closed-texture], p=9.37e-05; and vs CC2, p=2.69e-05; Wilcoxon rank-sum test). (B) Same comparisons as in Figure 5B and C but only for putative interneurons. PFS index was higher during the CO configuration (cyan) compared to the CC (black) configuration (p=5.7408e-04, Wilcoxon rank-sum test, n=24). During the CO configuration, the PFS index of putative interneurons was significantly higher compared to other configurations (vs CC, p=5.7408e-04; vs CT, p=0.048; and vs CC2, p=0.0048; Wilcoxon rank-sum test). (C) Same comparisons as in Figure 5B and C but for the neuronal activity after removal of all sharp-wave ripple (SWR)-associated spikes. PFS index was higher during the CO configuration (cyan) compared to the CC (black) configuration (p=3.66e-06, Wilcoxon rank-sum test). During the CO configuration the PFS index of putative pyramidal neurons was significantly higher compared to other configurations (vs CC, p=3.66e-06; vs CT, p=0.021; and vs CCT2 p=7.177e-04; Wilcoxon rank-sum test).
Figure 6 with 2 supplements

The activity of ventral hippocampal neurons predicts the extent of exploration of an anxiogenic location.
(A) For two behavioural sessions, the furthest spatial bin visited on each trial is plotted. The dotted line indicates the spatial bin set as a criterion to define two different types of trajectories: proximal (blue dots) and distal (magenta dots) exploration. (B) For the two behavioural sessions in (A), the single-unit activity of two co-recorded neurons during the run on the closed arm are shown. The dotted line in the panel indicates the result of support vector machine (SVM) plane for the separation of both, distal and proximal, categories (see Materials and methods). Firing rate is given as the z-score scaled by the SVM (see Materials and methods). (C) Predictions of the SVM for three additional individual sessions. The blue line shows the furthest spatial bin reached during specific trials. The dotted line indicates the middle of the exploration of the open arm and divides the trials into proximal (left) and distal (right) explorations (used for the SVM classifier). Dots at the right of each plot show the trial by trial accuracy of the SVM classifier (see Materials and methods). Full dots show trials with distal explorations while circles show trials with proximal explorations. Red colour implies inaccurate prediction of the SVM classifier for that specific trial. (D) Normalised distributions of the SVM classifier performance (observed data – shuffled data) for each of the 12 sessions used. For each session, the neuronal pair with the best SVM performance was subtracted from the performance of the same pair with shuffled distal and proximal explorations (1000 shuffles). Therefore, the grey line at 0 marks the SVM classifier performance on the observed data and the boxplots show the differential performance of each of the shuffled iterations. Not significant (n.s.); significant (*, lower than 0.05). Boxplots show median (red line), 25th and 75th percentile.
Figure 6—figure supplement 1

Speed comparison and neuronal activity of individual cells.
(A) Raster plots of the spike activity in time for the neuronal pairs in Figure 6A. Each tick indicates a spike. Each row shows a trial during which the animal goes from the closed towards the opened arm. Red dotted line denotes the moment when the animal crossed the midline. Translucid boxes at the right of the red line were labelled as proximal (blue) or distal (magenta) exploration. (B) Boxplots of the animal´s speed, in every session used for the support vector machine (SVM) analyses, calculated in the same area as the one used for the firing rates of the SVM (closed arm from the moment the animal heads towards the open area). Blue indicates proximal and magenta distal exploration. The p values are stated for each plot; green letters denote significant differences. Note that the first plot is for all the trials in all the sessions pulled together and the rest are for individual sessions.
Figure 6—figure supplement 2

Further analysis on support vector machine (SVM) predictions.
(A) Expanded plot as in Figure 6D. Black boxes indicate the shuffled SVM performance minus the actual performance of the best neuronal pair in the session. Red boxes show the distribution of the performances of all the other neuronal pairs in the same session for the observed data (all other pairs – best pair). (B) Same plot as in Figure 6D but for four different contingencies of the neuronal activity (speed controlled activity, activity after removal of sharp-wave ripple (SWR)-related spikes, only pairs of putative pyramidal neurons or putative interneurons). Note the good performance of the SVM during all these conditions across (A) and (B).
Additional files
Download links
A two-part list of links to download the article, or parts of the article, in various formats.
Downloads (link to download the article as PDF)
Open citations (links to open the citations from this article in various online reference manager services)
Cite this article (links to download the citations from this article in formats compatible with various reference manager tools)
Firing patterns of ventral hippocampal neurons predict the exploration of anxiogenic locations
eLife 12:e83012.
https://doi.org/10.7554/eLife.83012


