Changes in seam number and location induce holes within microtubules assembled from porcine brain tubulin and in Xenopus egg cytoplasmic extracts
- Univ Rennes, CNRS, IGDR (Institut de Génétique et Développement de Rennes) - UMR 6290, F-35000, France
- Department of Molecular, Cellular and Developmental Biology, University of Colorado Boulder, United States
- Laboratory of Biomolecular Research, Division of Biology and Chemistry, Paul Scherrer Institute, Switzerland
- University of Basel, Biozentrum, Switzerland
Figures
Figure 1
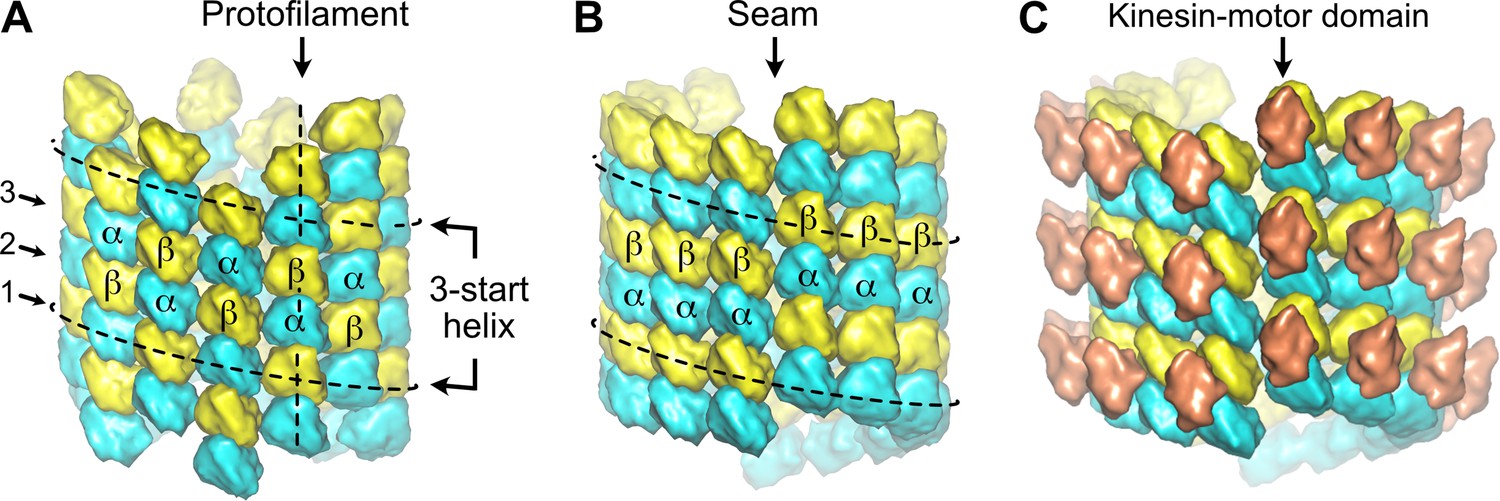
Organization of tubulin within microtubules.
The αβ-tubulin heterodimers (α in cyan, β in yellow) alternate head-to-tail along protofilaments, 13 of which associate laterally to form the microtubule wall. (A) In the A-type lattice, the lateral contacts are made between heterotypic subunits (α-β, β-α) along the three-start helices. (B) In the B-type lattice, the lateral contacts are made between homotypic subunits (α-α, β-β), except at one unique region of the A-type called the seam. (C) Decoration of microtubules with kinesin-motor domains (orange) that bind to β-tubulin highlights the organization of the tubulin heterodimer within microtubules.
Figure 2 with 6 supplements
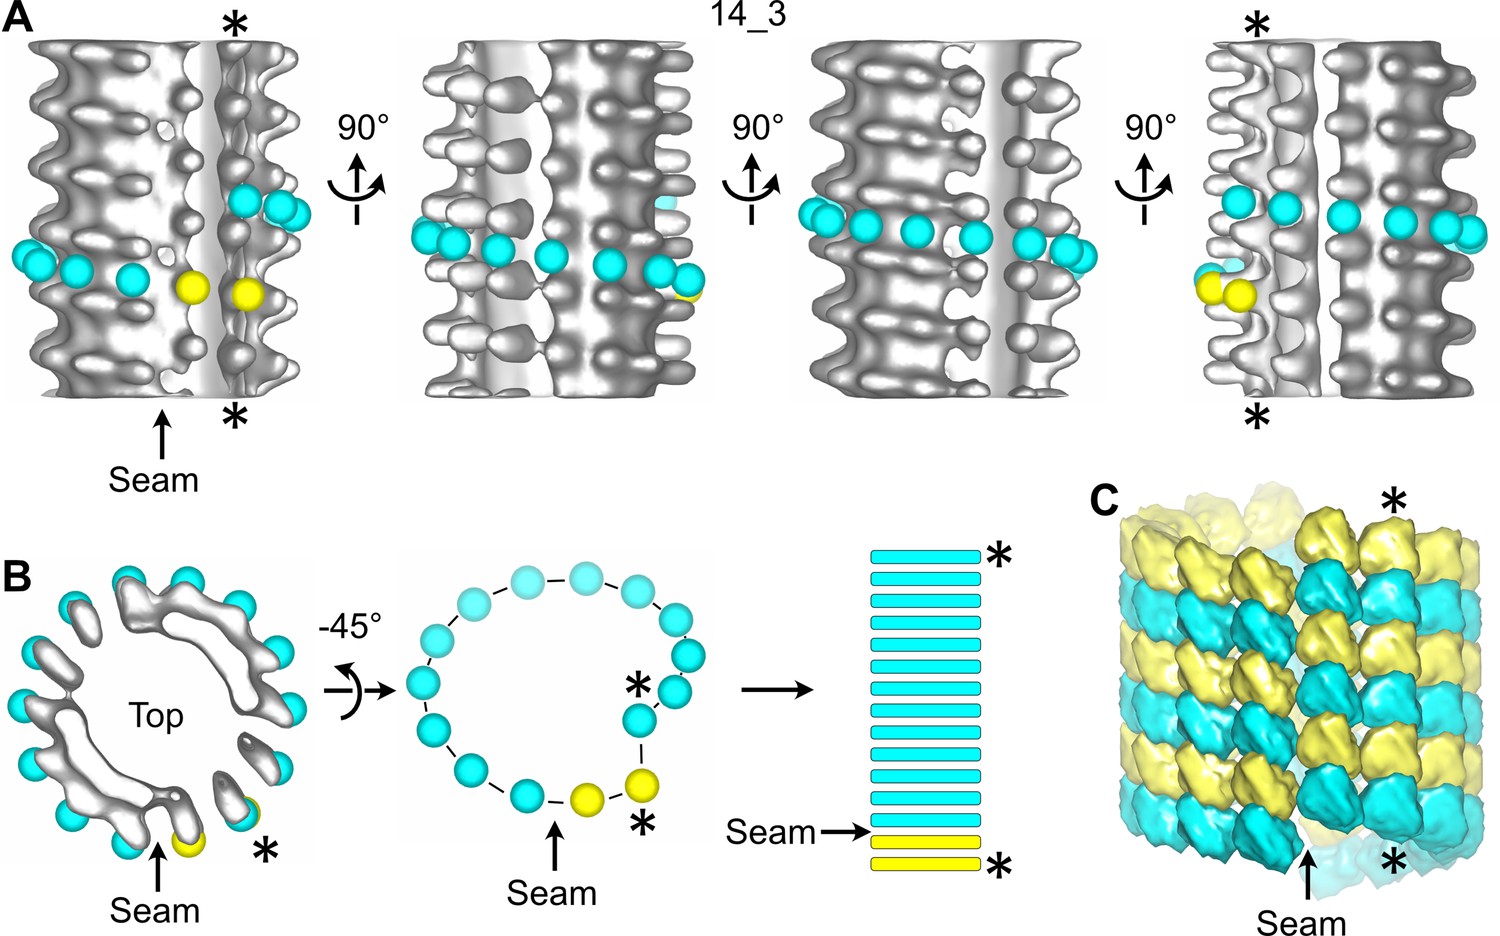
Sub-tomogram averaging of a 14_3 microtubule with a unique seam.
(A) Sub-tomogram average of a 1390.4 nm long 14_3 microtubule assembled in vitro from purified tubulin and decorated with kinesin-motor domains (Figure 2—figure supplement 3 MT3, Figure 2—video 2). The panel displays four views turned by 90° with respect to the longitudinal axis of the microtubule. Yellow spheres have been placed onto the kinesin-motor domain densities and cyan spheres in between them. They follow the left-handed, three-start helix of the microtubule lattice. The seam shows up as a change in color from yellow to cyan. (B) Symbolic representation of the microtubule lattice. The top view of the microtubule in (A) is turned by 45° around the X-axis, and the density is masked to reveal the organization of the tubulin subunits in one turn of the three-start helix. The helix is unrolled and represented as longitudinal bars that correspond to the organization of the αβ-subunits in microtubule segments. (C) 3D model of the underlying tubulin dimer lattice. The stars (*) indicate the same protofilament in (A–C).
Figure 2—figure supplement 1
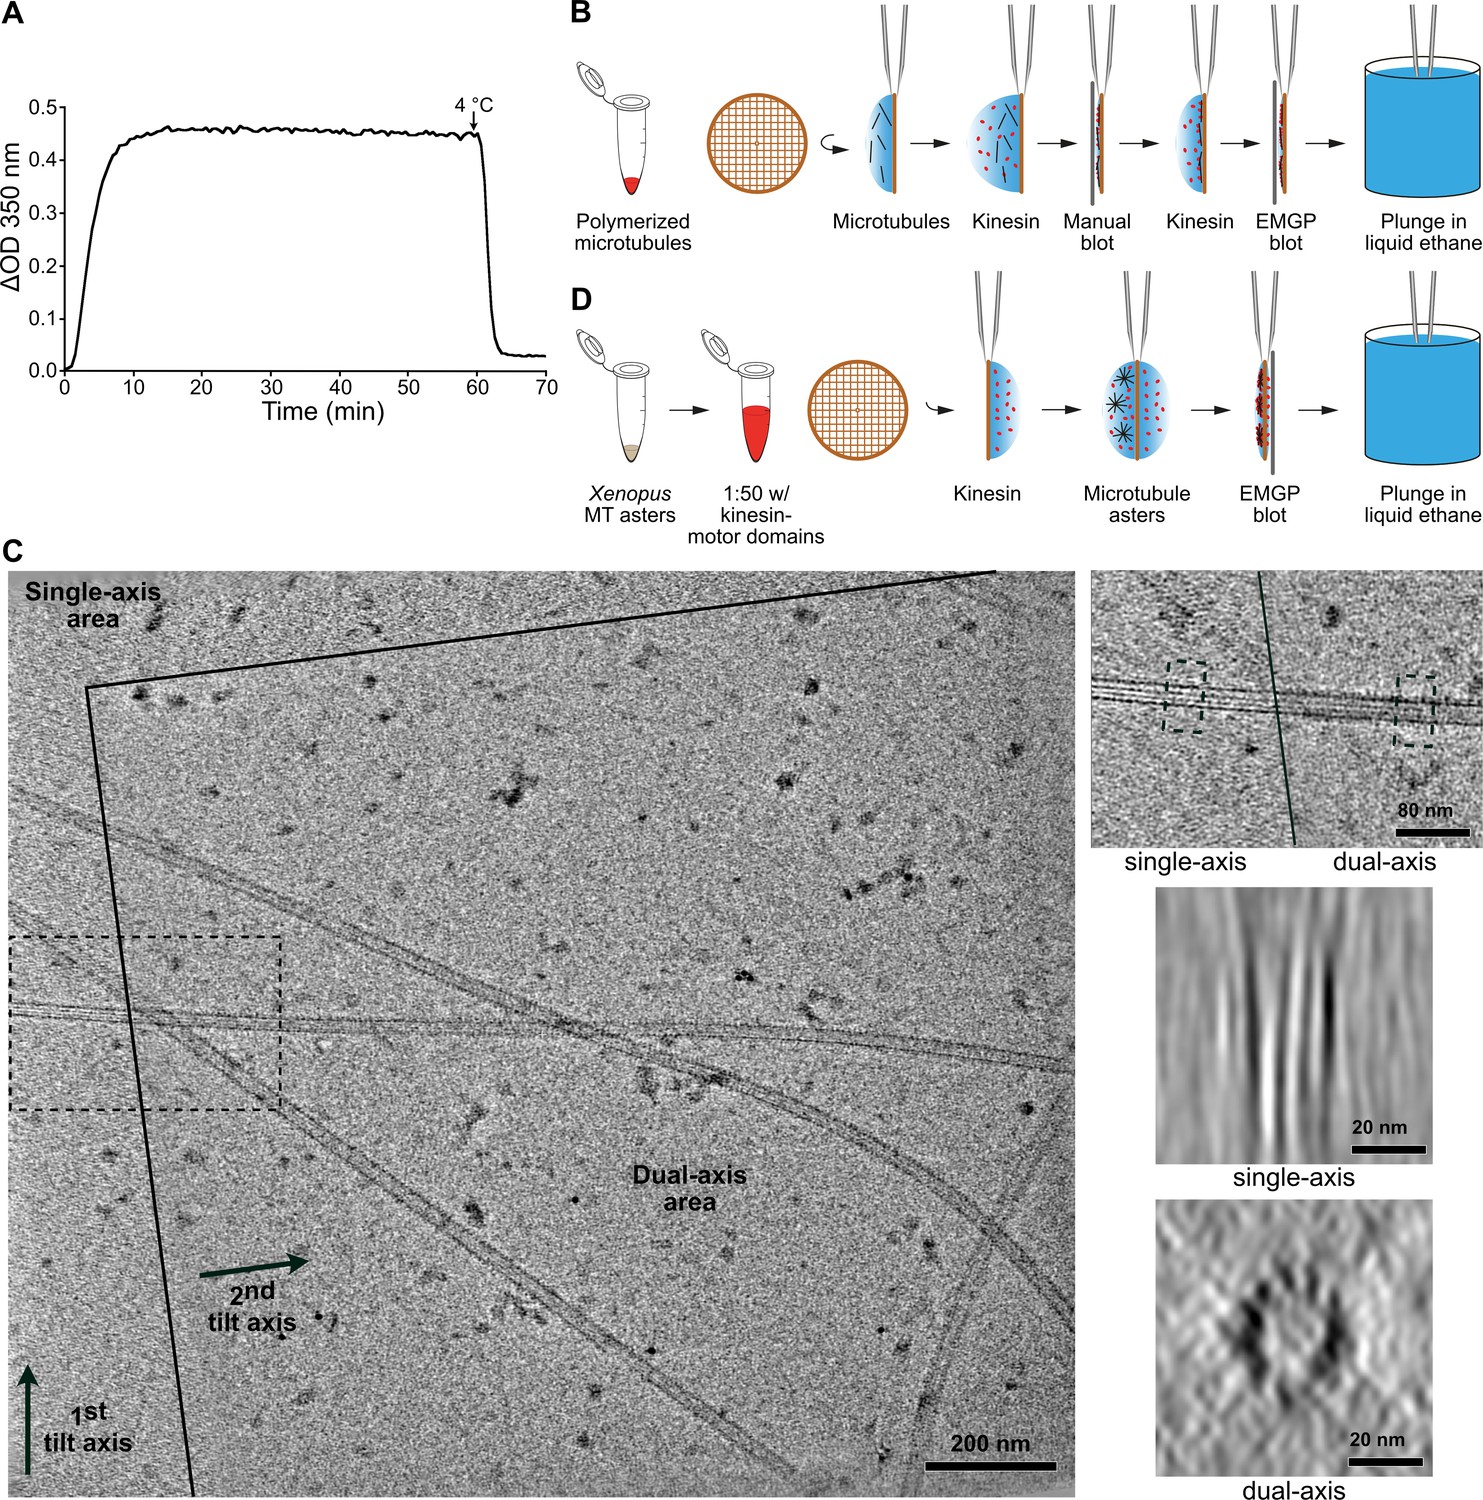
Preparation of microtubules for cryo-electron tomography.
(A) Microtubule assembly at 40 µM tubulin in BRB80, 1 mM GTP, 35°C. Variation of optical density (ΔOD) at 350 nm versus time (min). A cooling step was performed at the end of the experiment to assess the presence of aggregates evidenced by the value of the baseline at 4°C. Samples for cryo-electron microscopy were prepared after ~1 hr of polymerization. (B) Decoration of microtubules assembled in vitro from purified tubulin with kinesin-motor domains. Kinesin decoration is performed right before vitrification of the sample into liquid ethane. (C) Dual-axis cryo-electron tomography. Left: the dual-axis area is delimited by plain lines; arrows indicate the two tilt axes. Right top: enlargement of the dotted region in the overall view that encompass the single and dual axes regions of the tomogram. A microtubule oriented close to the perpendicular of the first tilt axis spans the two regions (Figure 2—video 1). Right middle: average of 50 slices along the microtubule in the single-axis area. The microtubule is severely elongated in the Z direction. Right bottom: the same microtubule visualized in the dual-axis area. Individual protofilaments are clearly individualized. (D) Decoration of microtubules assembled in Xenopus egg cytoplasmic extracts. Microtubule asters are deposited on one side of the grid, which is subsequently blotted from the opposite side.
Figure 2—figure supplement 2
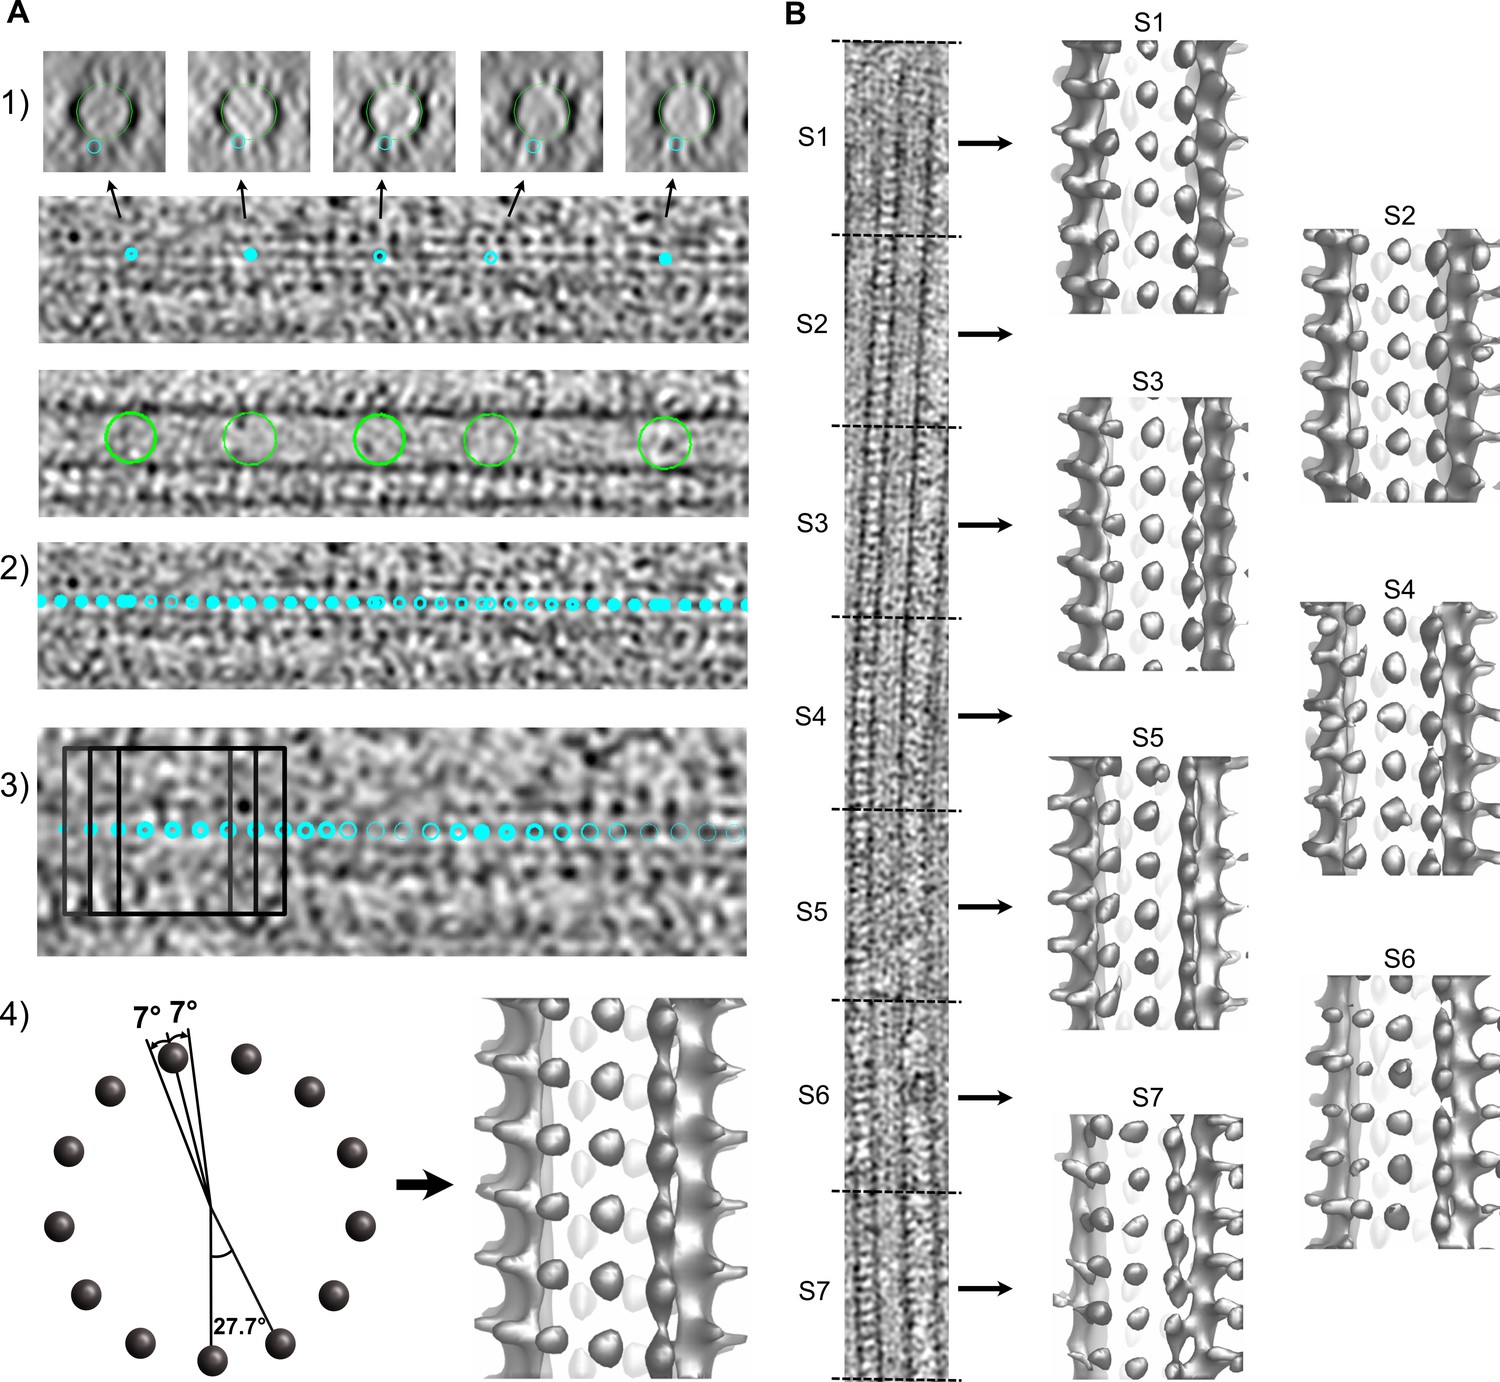
Segmented sub-tomogram averaging (SSTA) of microtubules decorated with kinesin-motor domains.
(A) STA. (1) A first model is created by placing model points onto individual protofilaments (small cyan circles) and at the microtubule center (large green circles). (2) A second model is extrapolated from the previous one with points spaced every ~8 nm along the microtubule. (3) Sub-volumes (dark squares) are extracted at every point position and aligned by cross-correlation using PEET. (4) The rotational search around the microtubule axis is restricted to about half the angular separation between protofilaments (left). The resulting average is displayed in isosurface rendering in IMOD (right). (B) SSTA. The model and motive list used to calculate the whole tomogram of the microtubule is split into shorter segments of equal dimensions and sub-tomograms are calculated for each segment (S1 to S7). The segment size is limited by the signal-to-noise ratio present in the tomograms (typically ~160 nm with our current data).
Figure 2—figure supplement 3
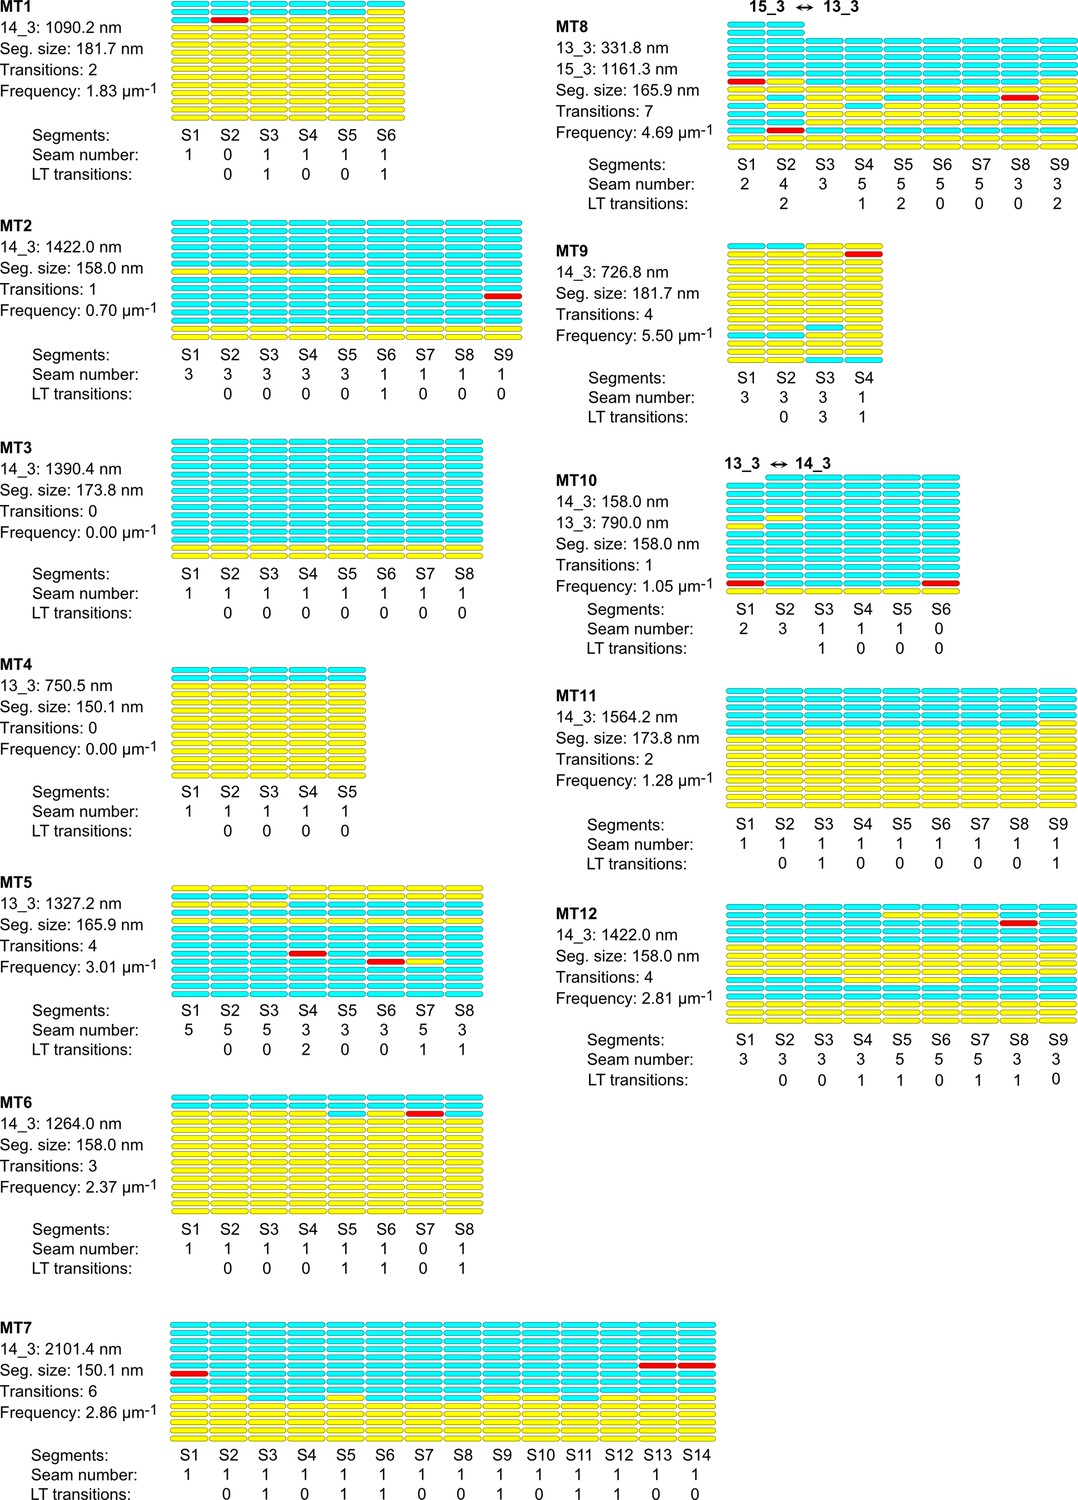
Lattice organization of microtubules assembled in vitro from purified porcine brain tubulin in the presence of GTP.
Figure 2—figure supplement 4

Lattice organization of microtubules assembled in vitro from purified porcine brain tubulin in the presence of GTP.
24 microtubules (31.7 µm in total length) were analyzed on four tomograms acquired on two independent samples. Number of microtubule segments: 195; number of lateral interactions: 2663 (A type: 460; B type: 2091; ND: 112); lattice-type transitions: 119; protofilament/helical-start (N/S) number transitions: 3.
Figure 2—video 1
Dual-axis cryo-electron tomography of microtubules.
Microtubule visualized in cross-section in the single- and dual-axis regions of a cryo-electron tomogram. Related to Figure 2—figure supplement 1C.
Figure 2—video 2
Sub-tomogram average of a 14_3 mono-seam microtubule.
Yellow spheres are placed on kinesin-motor domain densities and cyan spheres in between along one turn of the three-start helix.
Figure 3 with 1 supplement
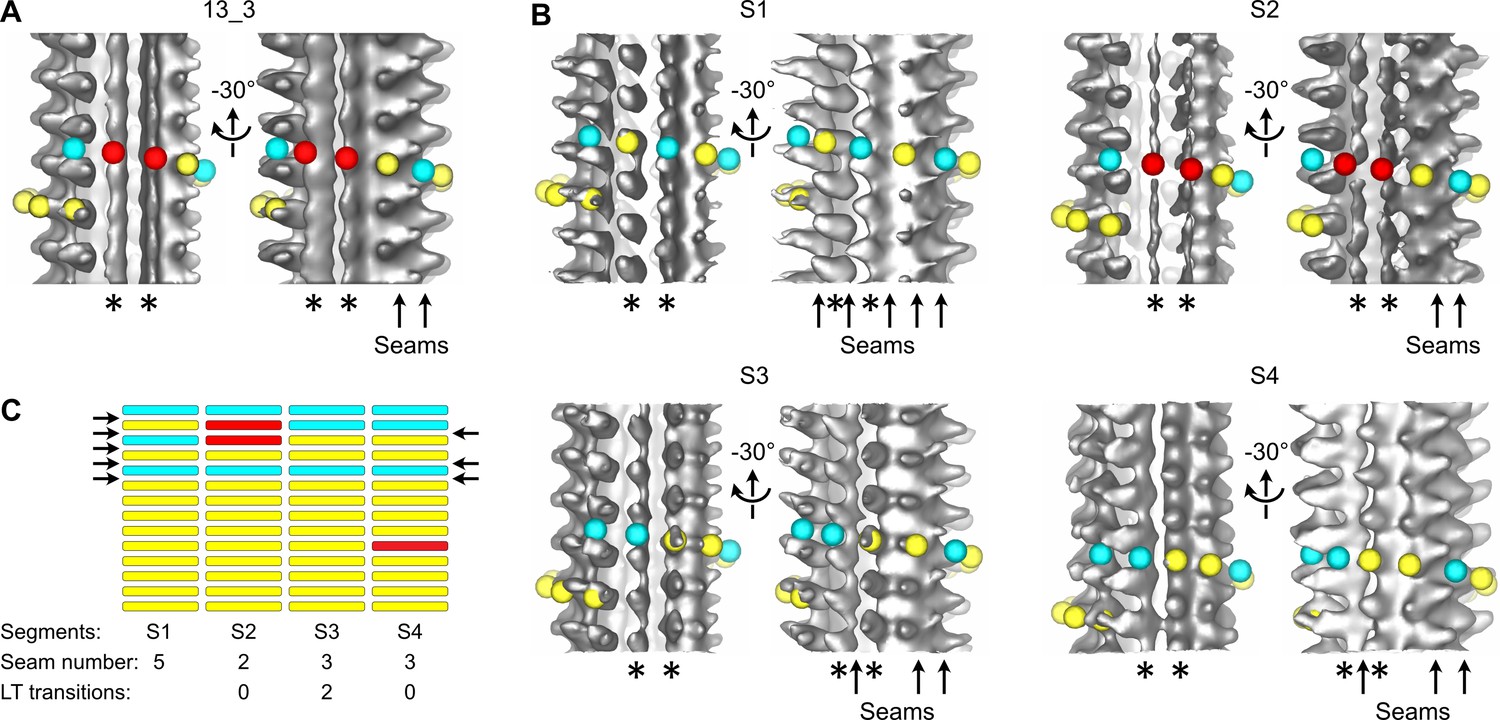
Transition in seam number within a 13_3 microtubule.
(A) Average of a 1327.2-nm-long 13_3 microtubule displaying two aberrant protofilaments (*) and two adjacent seams (arrows in the –30° view). Red spheres have been placed on top of the aberrant protofilaments. (B) Segmented sub-tomogram averaging of the microtubule in (A). The microtubule has been divided into four segments of 331.8 nm in length, and sub-tomogram averages have been calculated for each segment (S1 to S4). The two aberrant protofilaments in (A) are well resolved in S1, S3, and S4, while they still display an aberrant shape in S2. The lattice organization of these protofilaments must be offset by at least one tubulin subunit between S1 and S3. Hence, S2 constitutes a transition zone where kinesin-motor domain densities and absence of densities have been averaged. (C) Flat representation of the lattice organization within segments S1 to S4. S1 contains five seams while S3 and S4 contain three seams (arrows). Two lattice-type (LT) transitions occur between S1 and S3, and S4 contains an aberrant protofilament (Figure 3—video 1). A finer segmentation of the microtubule at 165.9 nm revealed an additional lattice-type transition in this region (Figure 2—figure supplement 3 MT5, between segments S5 and S7).
Figure 3—video 1
Segmented sub-tomogram averaging (SSTA) of a 13_3 multi-seam microtubule.
Figure 4
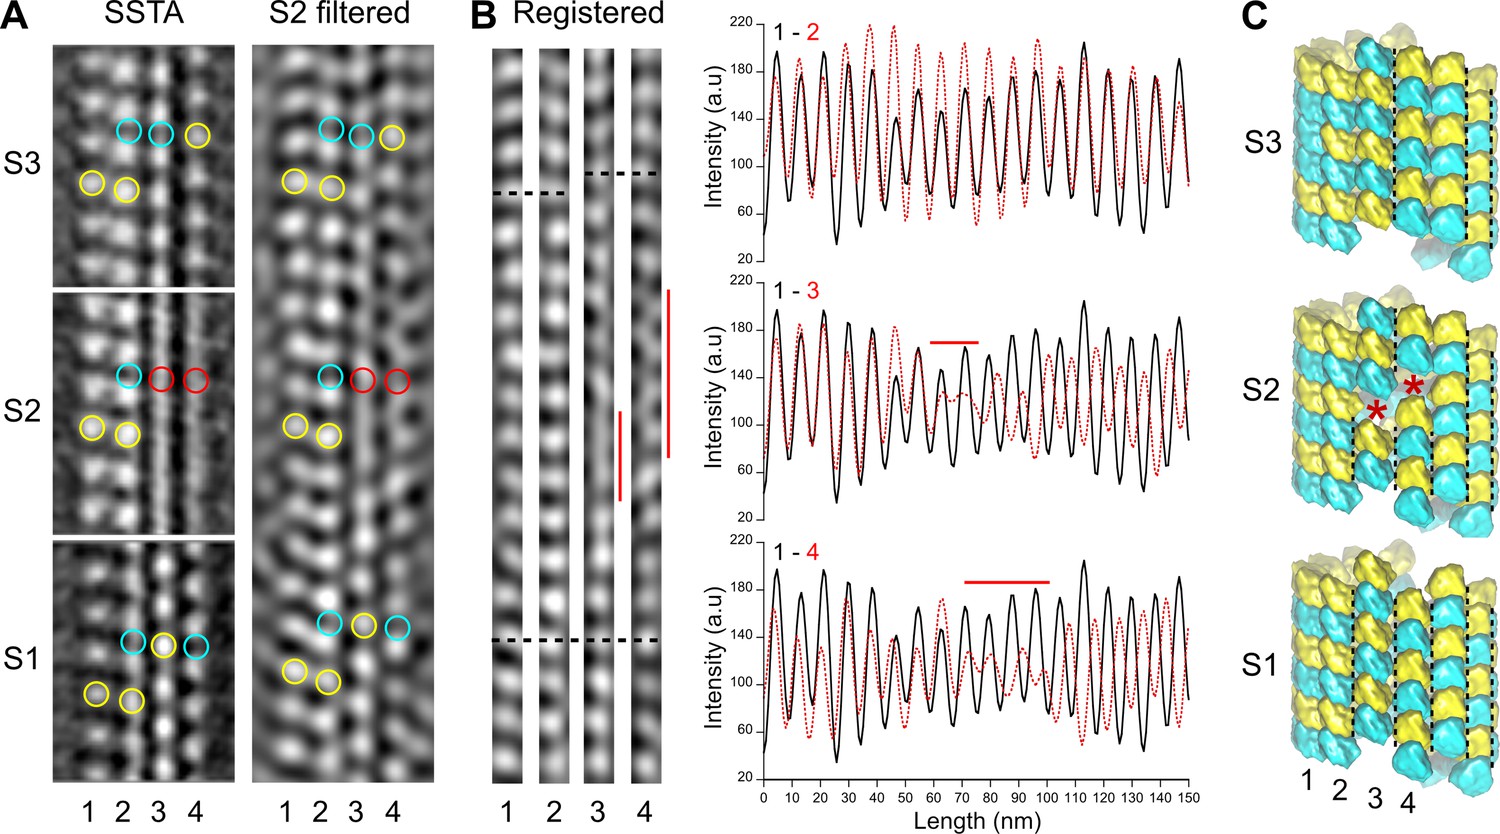
Comparison between segmented sub-tomogram averaging (SSTA) and Fourier filtered images of transition regions.
(A) SSTA: slices through the sub-tomogram averages of segments S1 to S3 in Figure 3B (left). The contrast has been inverted with respect to the original tomogram to represent protein densities as white. Yellow open circles have been placed on kinesin-motor domain densities, cyan open circles in between them, and red open circles on aberrant densities in S2. S2 filtered: slice through the filtered tomogram of the S2 region (right). The change in lattice seam number from S1 to S3 is clearly visualized in the S2 region. (B) Protofilaments 1–4 in (A) have been extracted from the filtered image and put into register (Registered, left). They remain in phase (bottom dotted line) until the densities in protofilaments 3 and 4 becomes fuzzy (vertical red lines). After these transition zones, the kinesin-motor domain periodicity in protofilaments 3 and 4 becomes out of phase with respect to that in protofilaments 1 and 2 (upper dotted lines). These changes in kinesin-motor domain periodicity are confirmed in the line plots of the protofilaments (right). While the kinesin-motor domain periodicity in protofilaments 1 and 2 remain perfectly in phase (upper graph), it becomes out of phase for protofilaments 3 and 4 after the transition zones (middle and bottom graphs). (C) Schematic representation of the αβ-tubulin heterodimer organization in segments S1 to S3. The transition from five seams in S1 to three seams in S3 requires an offset of at least one monomer (red stars) in the protofilaments 3 and 4 of S2, although larger holes of an odd number of subunits could be present. Black dotted lines highlight the seams in each segment.
Figure 5 with 2 supplements

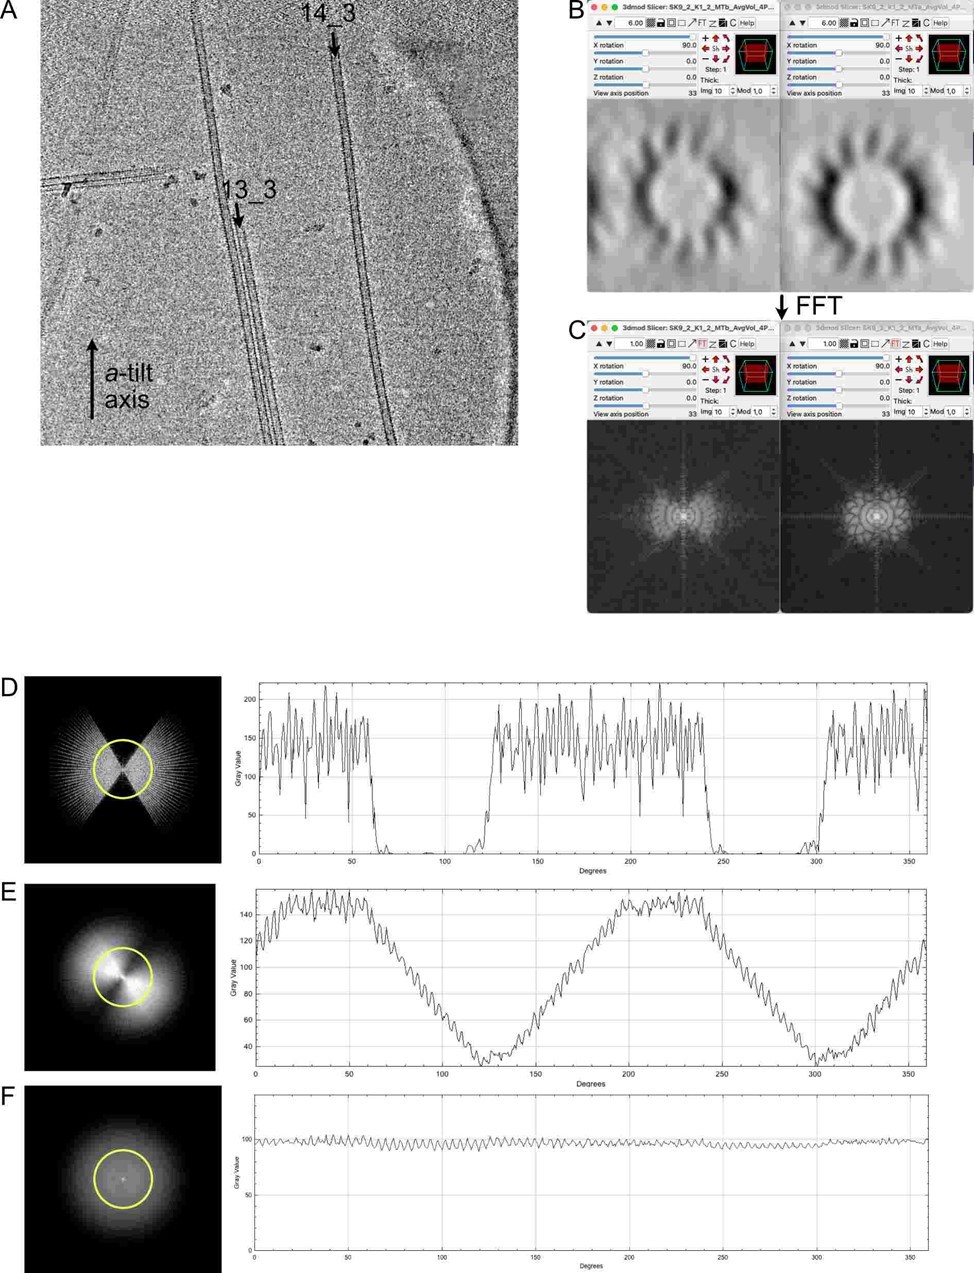
Direct visualization of holes within microtubules.
(A) Sub-tomogram average segments before (S1) and after (S2) a lattice-type transition in a GMPCPP-microtubule. For each segment, the isosurface of the full volume (left) and a slice through the sub-tomogram average (right) are displayed. The contrast has been inverted to represent protein density as white. S1 and S2 contain 1 and 3 seams, respectively. (B) Z-projection of 20 slices at the surface of the microtubule that encompasses S1 and S2 (top) with their associated Fourier transforms (middle) and filtered versions of the corresponding regions after selection of the equatorial and 8 nm–1 layer lines (bottom). The three protofilaments in S1 and S2 are organized according to a B- and an A-lattice, respectively. (C) Enlarged central region of the microtubule in (B). Yellow open circles have been placed on the kinesin densities (left), showing a gap of one subunit in protofilament 2, and possibly of a dimer in protofilament 1, although an absence of kinesin-motor domain at this location cannot be excluded. Tubulin heterodimers have been placed at the corresponding location (right) to highlight their change in organization at the transition region.
Figure 5—figure supplement 1
Lattice organization of microtubules assembled in vitro from purified porcine brain tubulin in the presence of GMPCPP.
Figure 5—figure supplement 2
Lattice organization of microtubules assembled in vitro from purified porcine brain tubulin in the presence of GMPCPP.
31 microtubules (35.1 µm in total length) was analyzed on six tomograms acquired on two independent samples. Number of microtubule segments: 238; number of lateral interactions: 3236 (A type: 261;B type: 2937; ND: 38); lattice type (LT) transitions: 37; protofilament/helical-start (N/S) number transitions: 12.
Figure 6
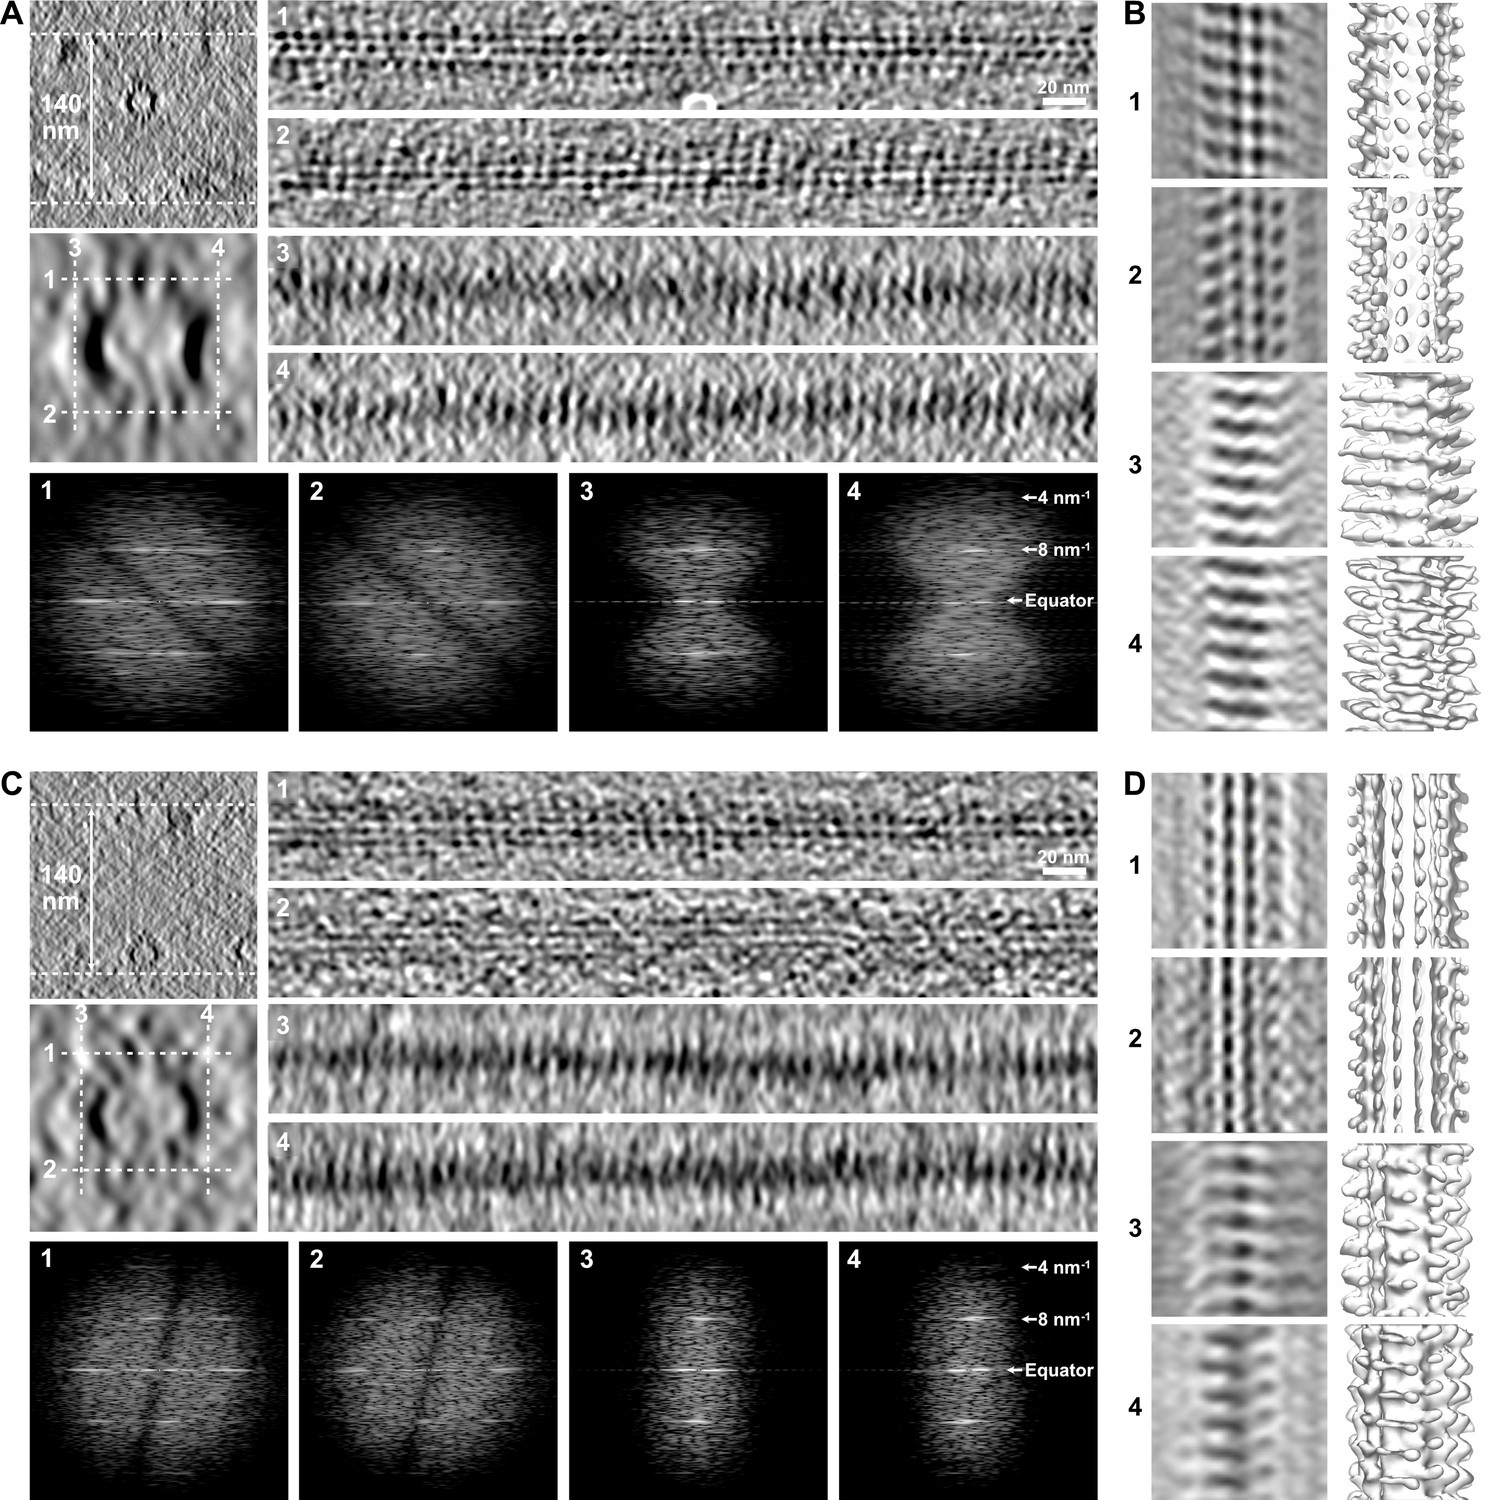
Limitations in the visualization of holes in raw tomograms.
(A) Microtubule embedded in an ~140-nm-thick ice layer (top left). Longitudinal sections (averages of 20 slices, right) were performed at the top (1), bottom (2), left (3), and right (4) of the microtubule at positions indicated by white dotted lines in the enlarged view of the microtubule (middle left, average of 50 slices). Kinesin-motor domain densities can be individualized on the top (1) and bottom (2) sections, but not on the edges of the microtubules (3, 4) due to the elongation of densities in Z as a consequence of missing data at high angle. The Fourier transforms of the corresponding segments (bottom) show that the 8 nm–1 periodicity of the kinesin-motor domains remains present in all views. (B) Sub-tomogram average of the microtubule in (A) over 18 kinesin-motor domain repeats. Sections (left) and isosurfaces (right) of the microtubule are displayed in correspondence to the longitudinal sections in (A). The kinesin-motor domain position is clearly observed on the top (1) and bottom (2) surfaces, and can be recovered on the microtubule edges after segmented sub-tomogram averaging (SSTA) (3, 4). (C) Microtubule in the same tomogram as in (A) interacting with the air–water interface (top left). Kinesin-motor domain densities can be well discerned on the longitudinal sections (right) of the top surface facing the solution (1), but are almost indiscernible on the bottom surface that interacts with the air–water interface (2) and on the edges (3, 4). Fourier transforms (bottom) of the corresponding segments show that the periodicity of the kinesin-motor domains is still present, even on the damaged surface (2). (D) Sub-tomogram average of the microtubule in (C) over 18 kinesin-motor domain repeats. SSTA allows recovery of the kinesin-motor domain densities in all surfaces, including the one that interacts with the air–water interface (2).
Figure 7 with 1 supplement
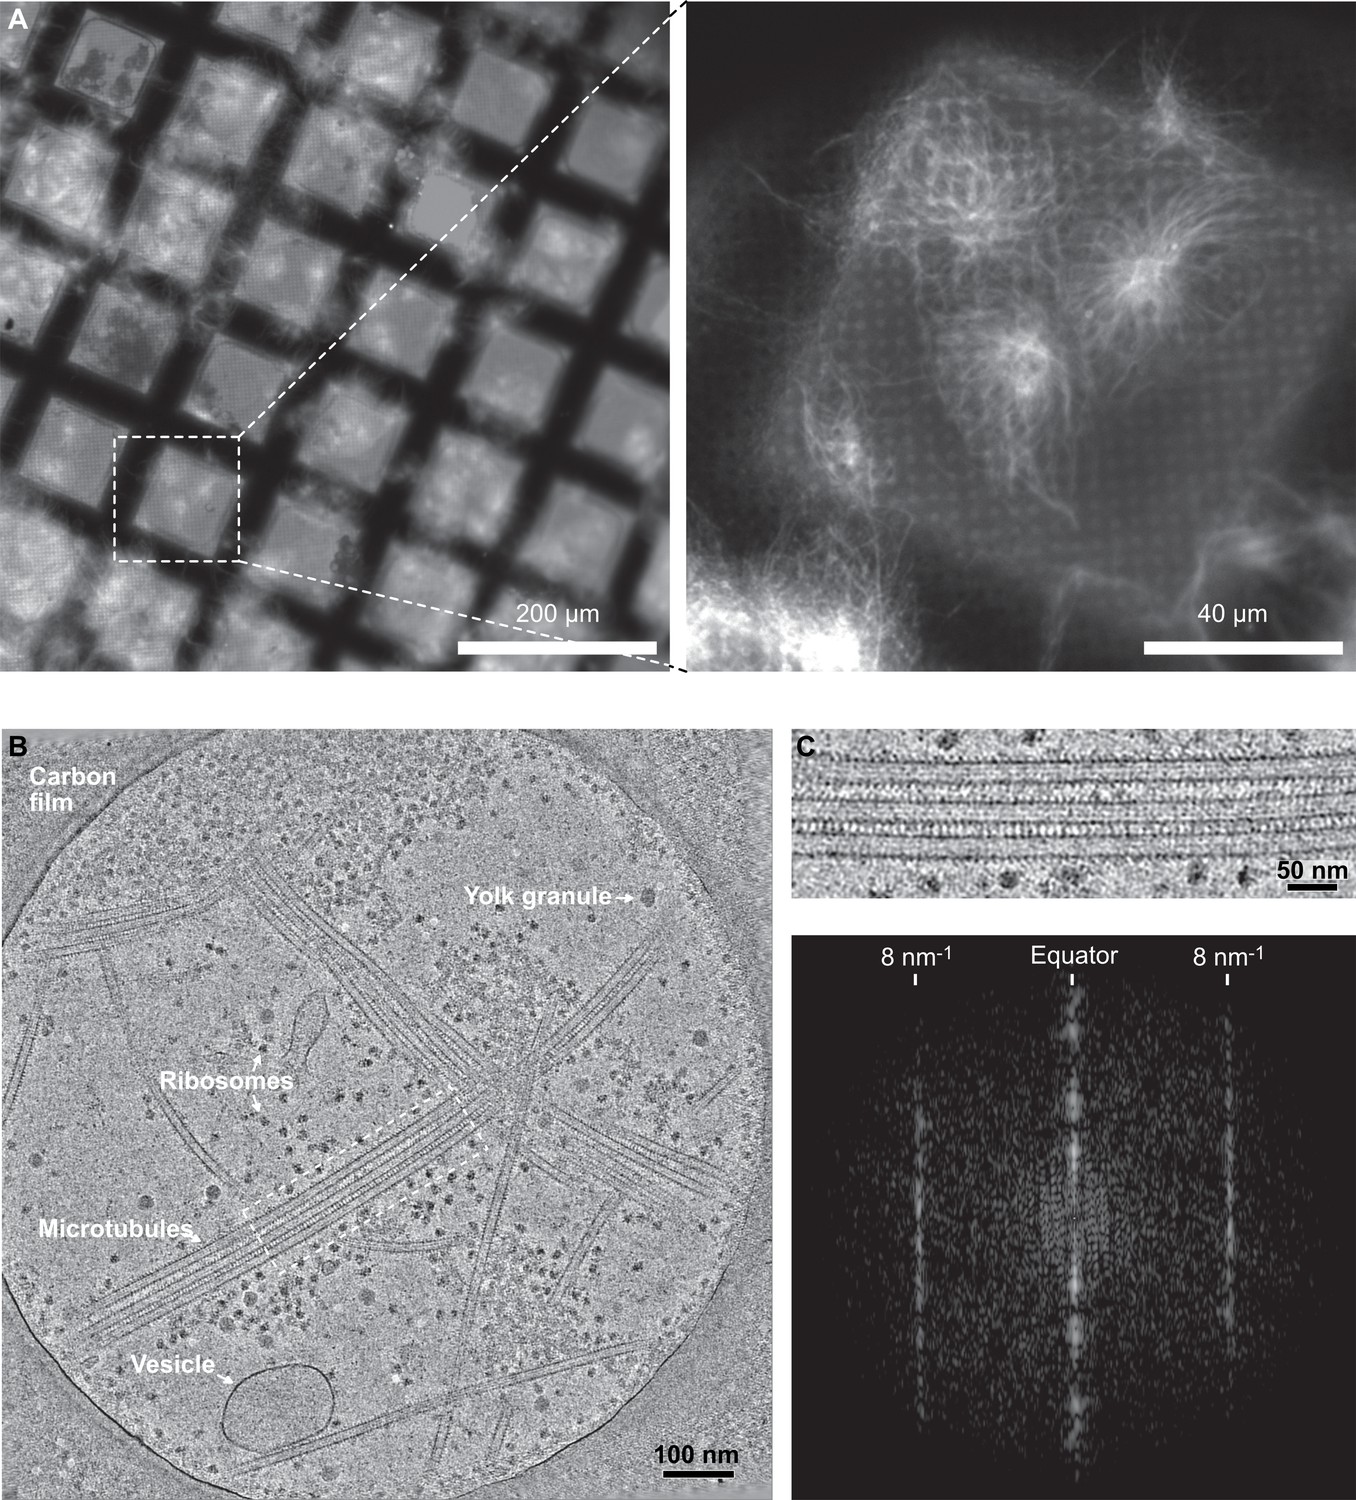
Cryo-electron tomography of microtubules decorated by kinesin-motor domains in Xenopus egg cytoplasmic extracts.
(A) Cryo-fluorescence images of microtubules assembled in a cytoplasmic extract prepared from Xenopus eggs. Microtubules assembled in the presence of rhodamine-tubulin and plunge-frozen on an EM grid were imaged using fluorescence microscopy at liquid nitrogen temperature. Left: ×10 objective; right: ×50 objective. The white dashed square on the ×10 image indicates the field of view of the ×50 image. (B) Average of 30 slices in Z through a cryo-electron tomogram. The thin layer of cytoplasm spans a 2 µm diameter hole of the carbon film. The main visible features are ribosomes, vesicles, yolk granules, and microtubules decorated by kinesin-motor domains. (C) Top: enlargement of the dotted rectangular region in (B) (Figure 7—video 1). Bottom: Fourier transform of the top image showing strong layer lines at 8 nm–1 corresponding to the kinesin-motor domain repeat along the microtubules.
Figure 7—video 1
Cytoplasmic extract microtubules decorated with kinesin-motor domains.
Slices through a cryo-electron tomogram of Xenopus egg cytoplasm showing microtubules decorated with kinesin-motor domains.
Figure 8 with 6 supplements

Segmented sub-tomogram averaging (SSTA) of microtubules decorated by kinesin-motor domains in Xenopus egg cytoplasmic extracts.
(A) Sub-tomogram averages of five 400.5-nm-long segments of a 13_3 microtubule (top). S4 contains an aberrant protofilament (*), and the seam (arrow) moves laterally to the left by one protofilament from S3 to S5. The microtubule has been segmented into eleven 178-nm-long segments (bottom, Figure 8—figure supplement 1: MT2). Only S7 to S10 are shown, corresponding to a region that encompass S3 to S5 in the 310.8 nm segmentation (Figure 8—video 1). The lattice-type transition occurs from S8 to S9, and no aberrant protofilament is observed in this finer segmentation. (B) 3D models of the tubulin lattice before (top), during (middle), and after (bottom) the transition. The lateral offset in seam position requires a longitudinal offset of a minimum of one tubulin subunit to account for the lattice-type transition observed in (A).
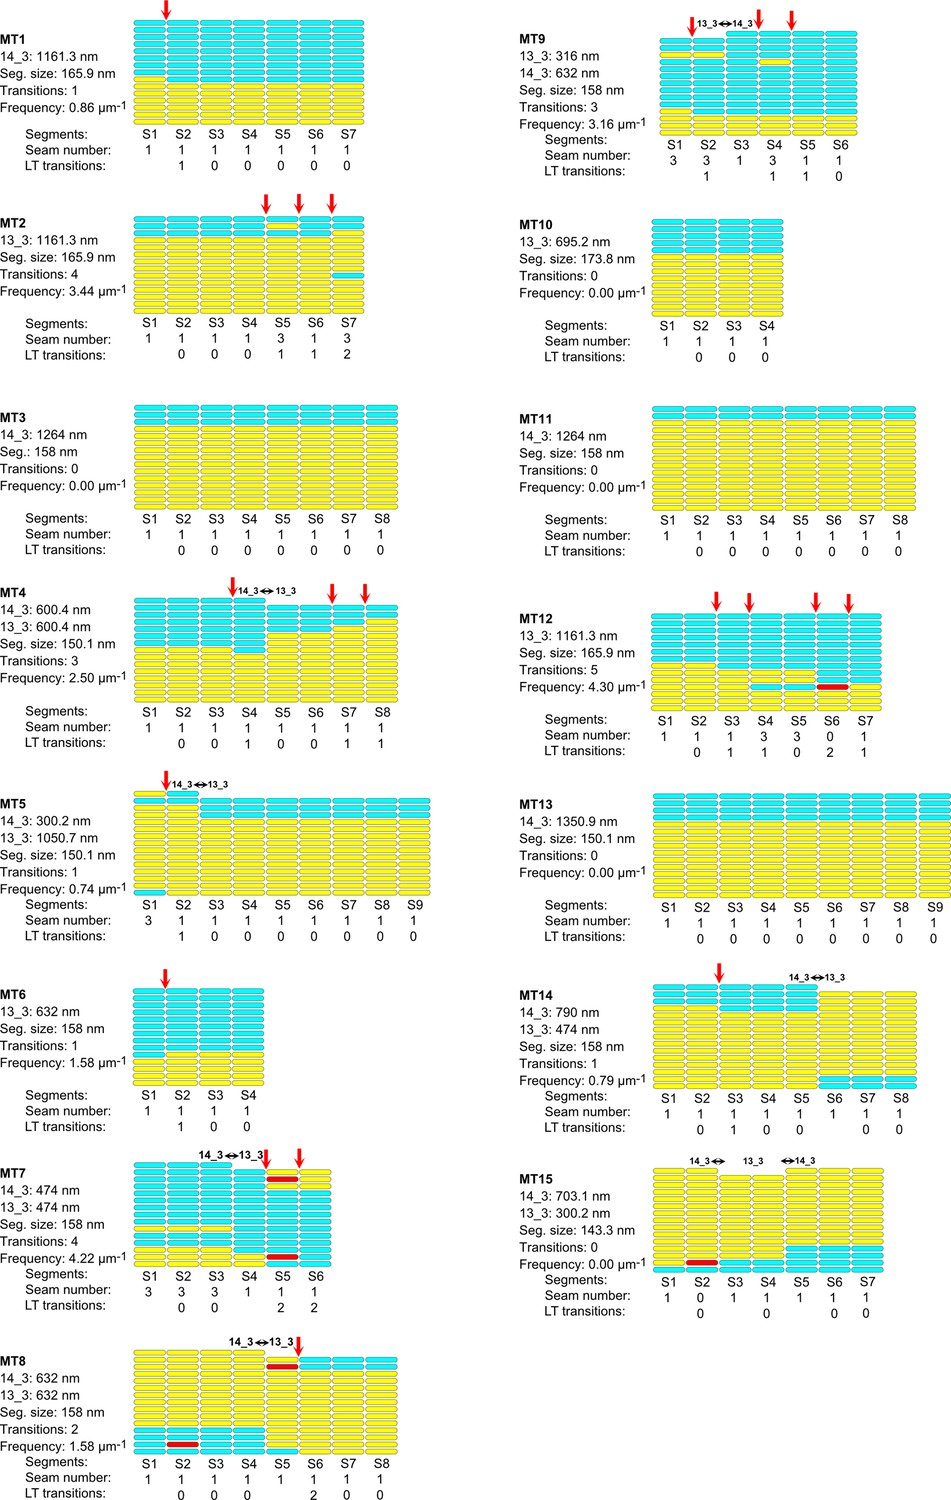
Figure 8—figure supplement 1
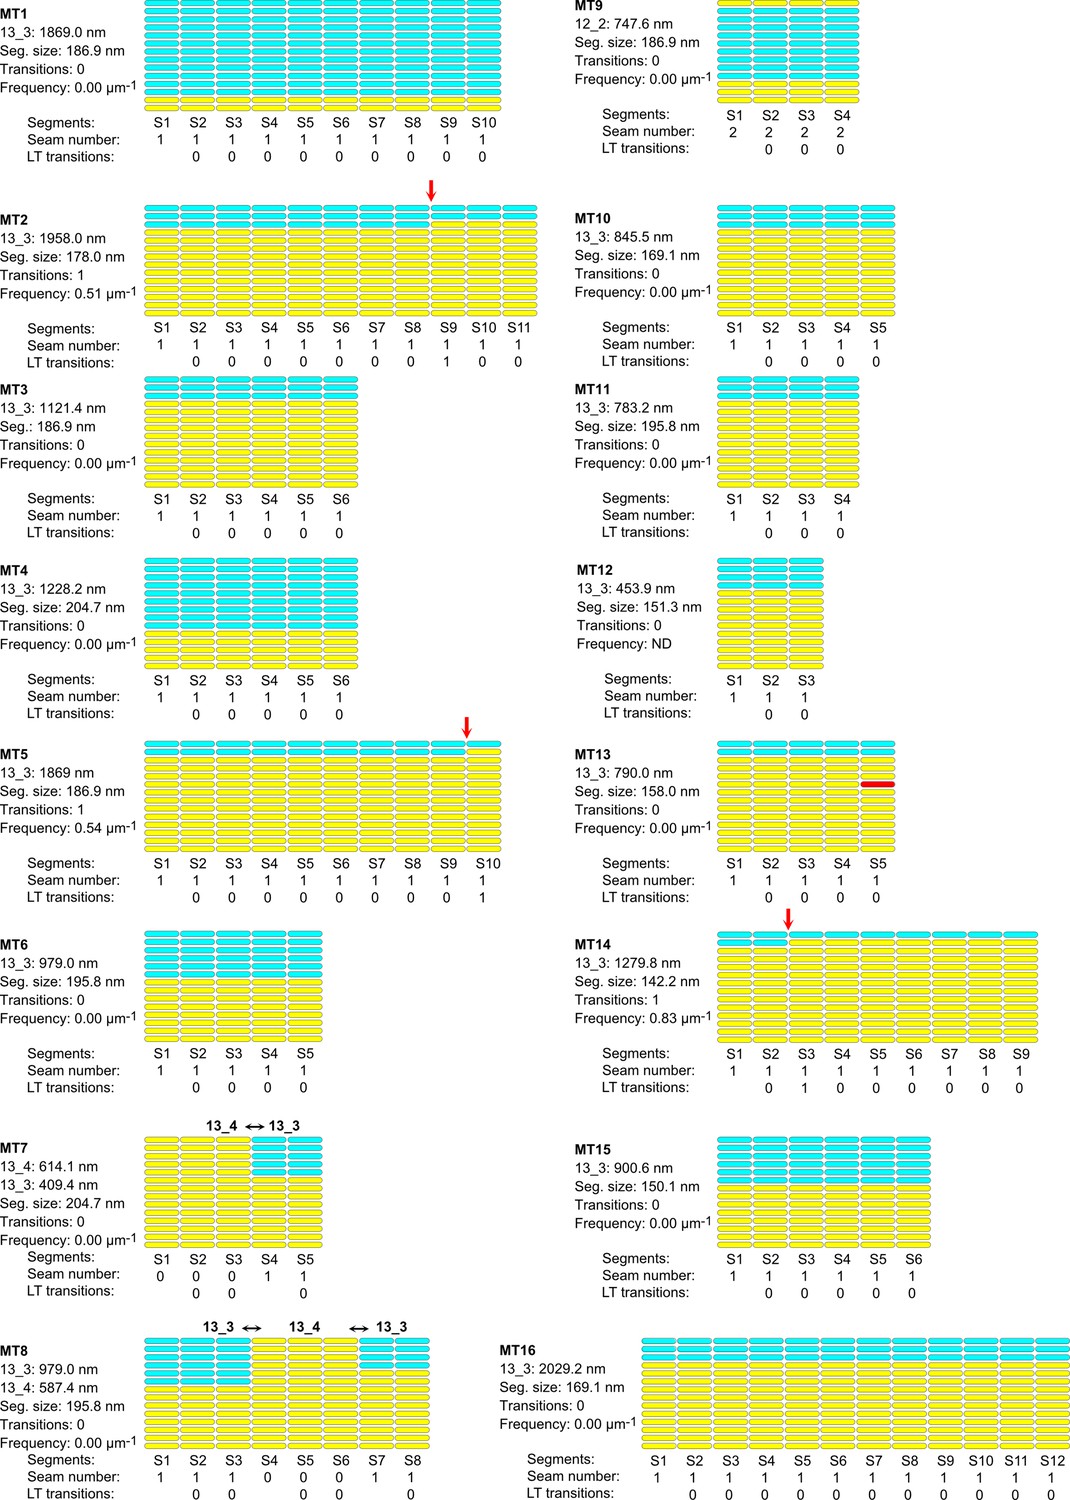
Lattice organization of microtubules assembled in cytoplasmic Xenopus egg extracts in the presence of 5% DMSO.
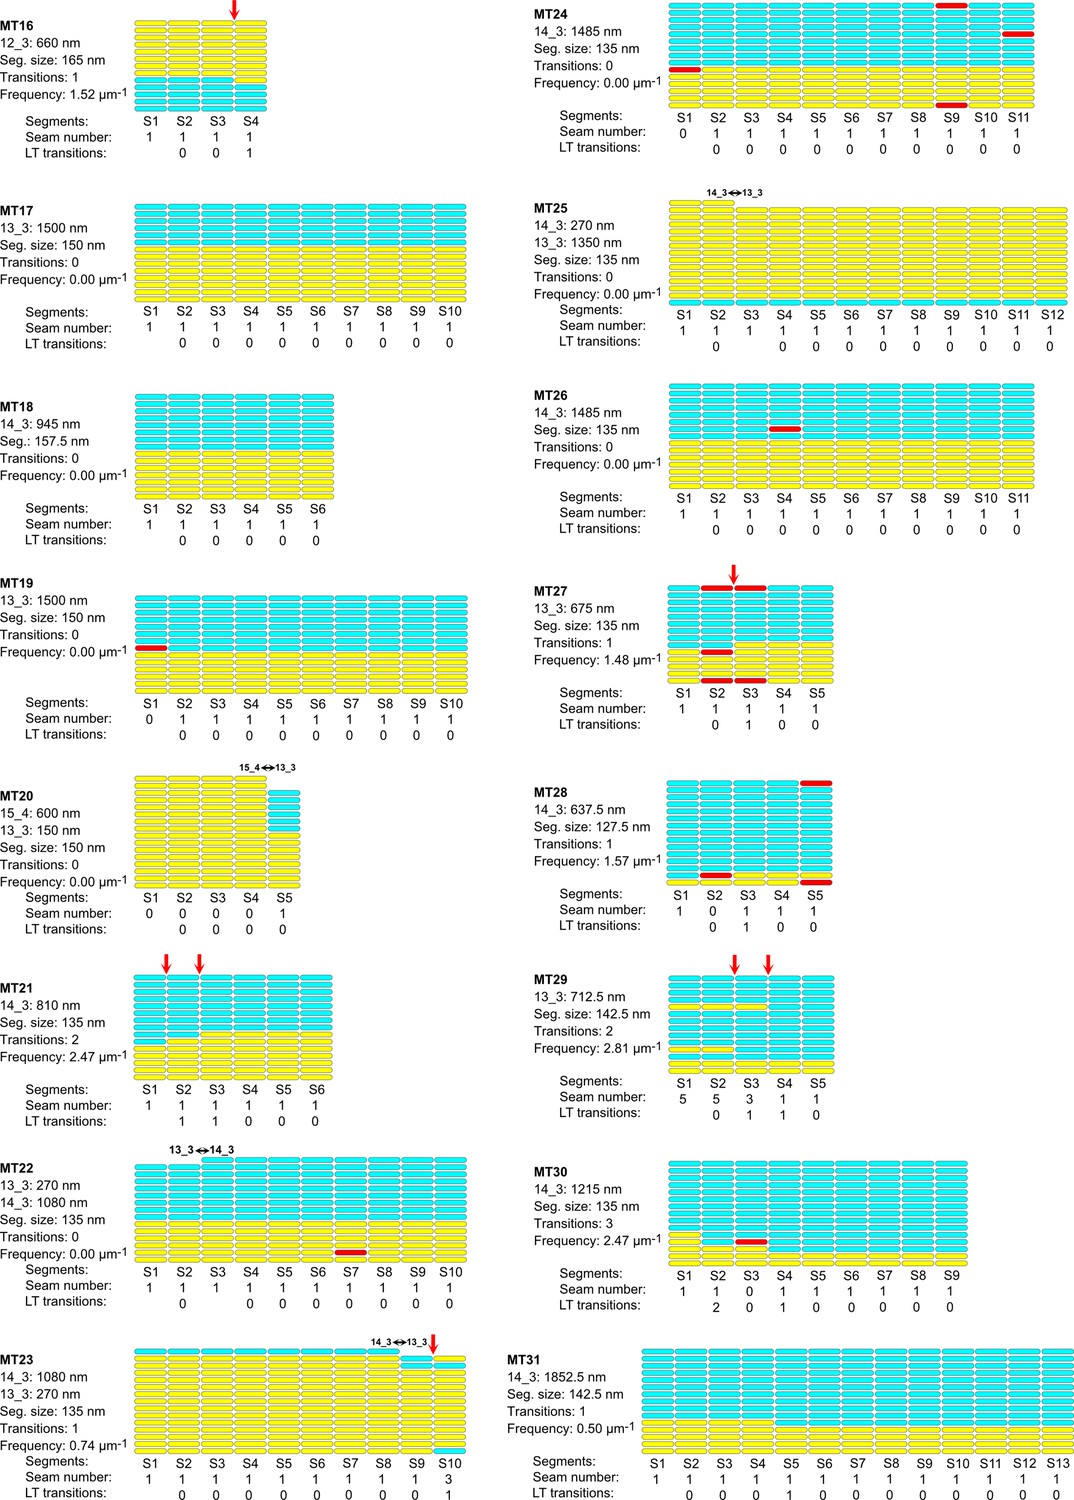
Figure 8—figure supplement 2
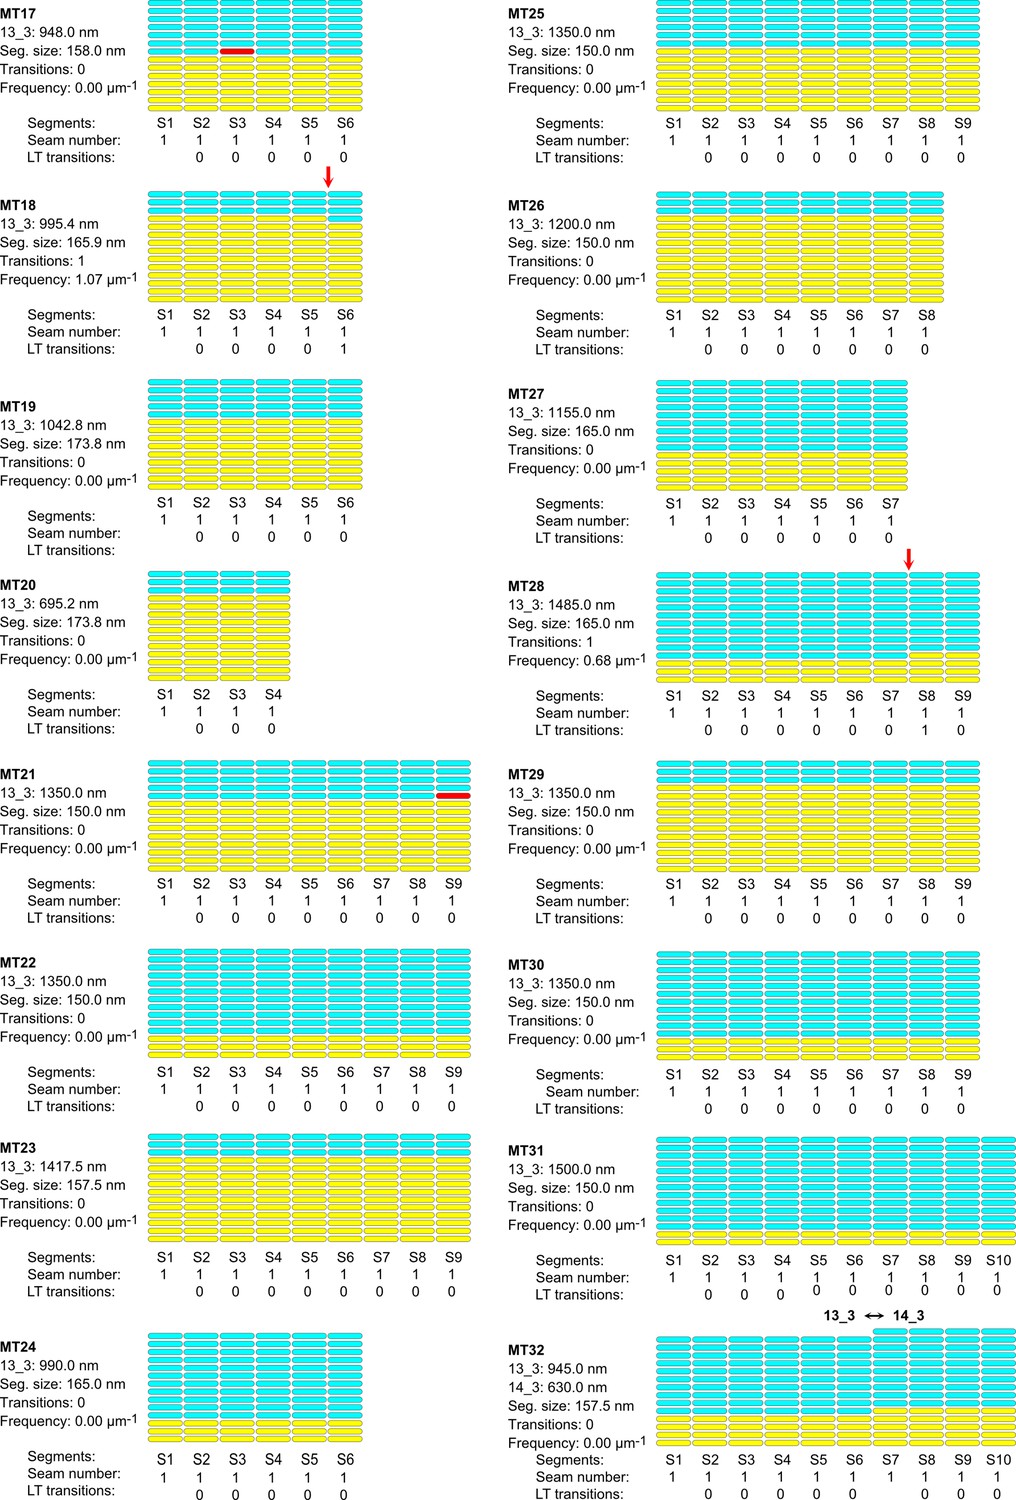
Lattice organization of microtubules assembled in cytoplasmic Xenopus egg extracts in the presence of 5% DMSO.
Figure 8—figure supplement 3
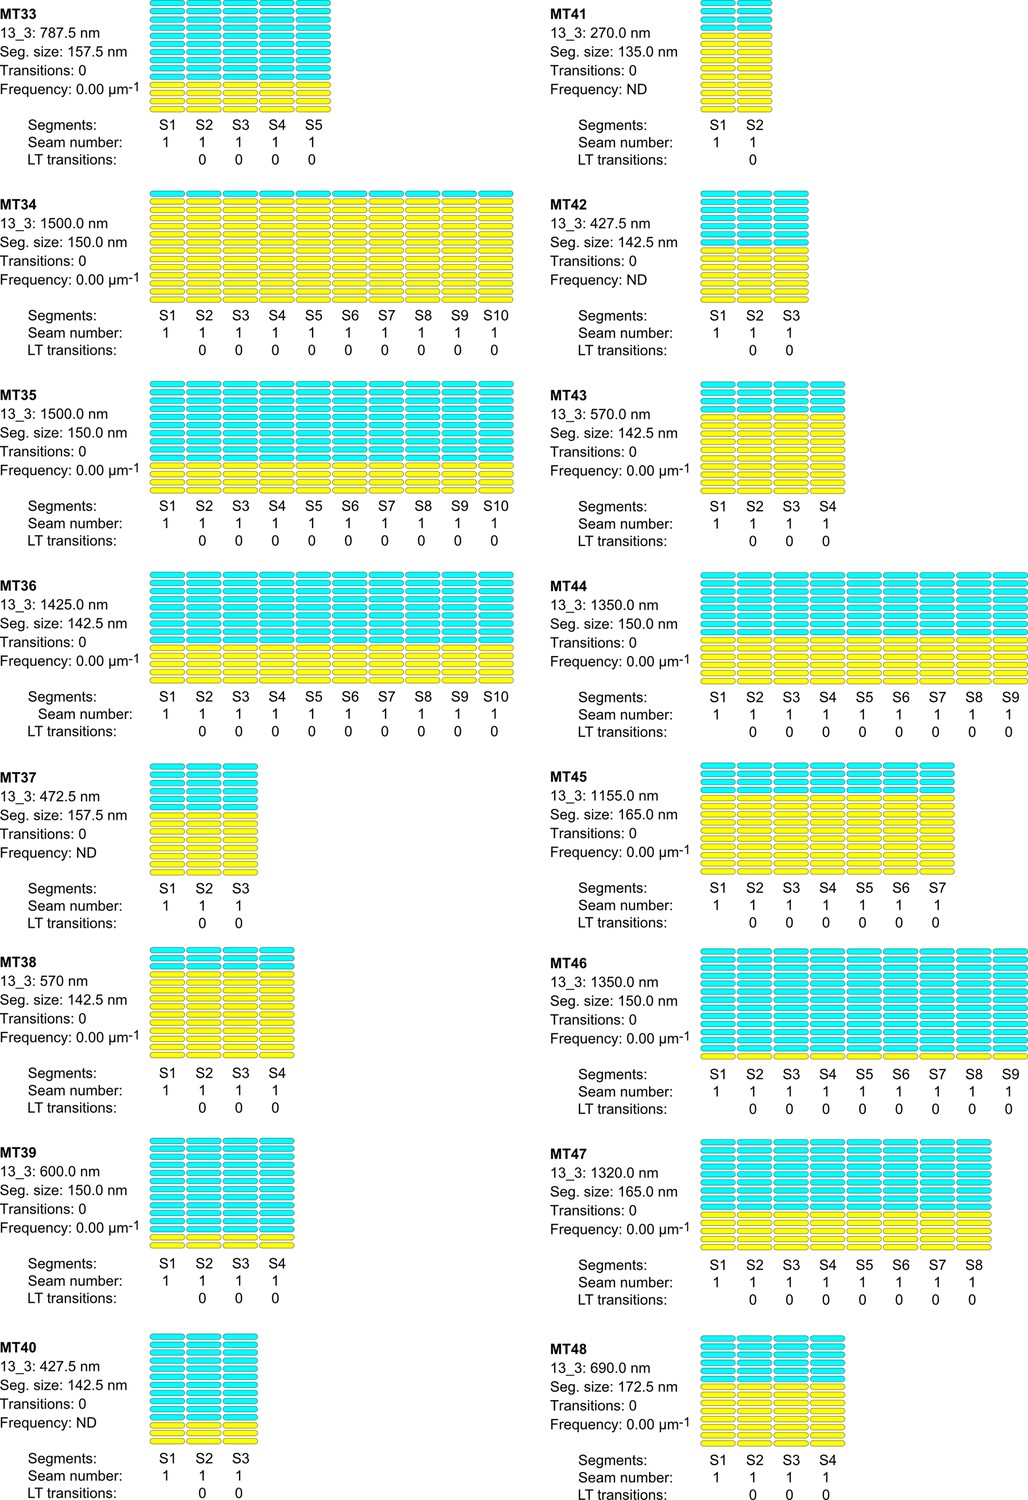
Lattice organization of microtubules assembled in cytoplasmic Xenopus egg extracts in the presence of 5% DMSO.
Figure 8—figure supplement 4

Lattice organization of microtubules assembled in cytoplasmic Xenopus egg extracts in the presence of 5% DMSO.
64 microtubules (67.4 µm in total length) were analyzed on five tomograms acquired on one sample. Number of microtubule segments: 419; number of lateral interactions: 5446 (A type: 415; B type: 5025; ND: 6); lattice-type (LT) transitions: 6; protofilament/helical-start (N/S) number transitions: 6. Red arrows indicate LT transitions in MT2, MT5, MT14, MT18, MT28, and MT56.
Figure 8—figure supplement 5

Lattice organization of microtubules assembled in cytoplasmic Xenopus egg extracts in the presence of RanQ69L.
15 microtubules (19.9 µm in total length) were analyzed on one tomogram acquired on one sample. Number of microtubule segments: 86; number of lateral interactions: 1118 (A type: 84; B type: 1018; ND: 16); lattice-type (LT) transitions: 2. Red arrows indicate LT transitions in MT4 and MT10.
Figure 8—video 1
Segmented sub-tomogram averaging (SSTA) of a 13_3 microtubule assembled in a cytoplasmic extract.
Figure 9 with 1 supplement
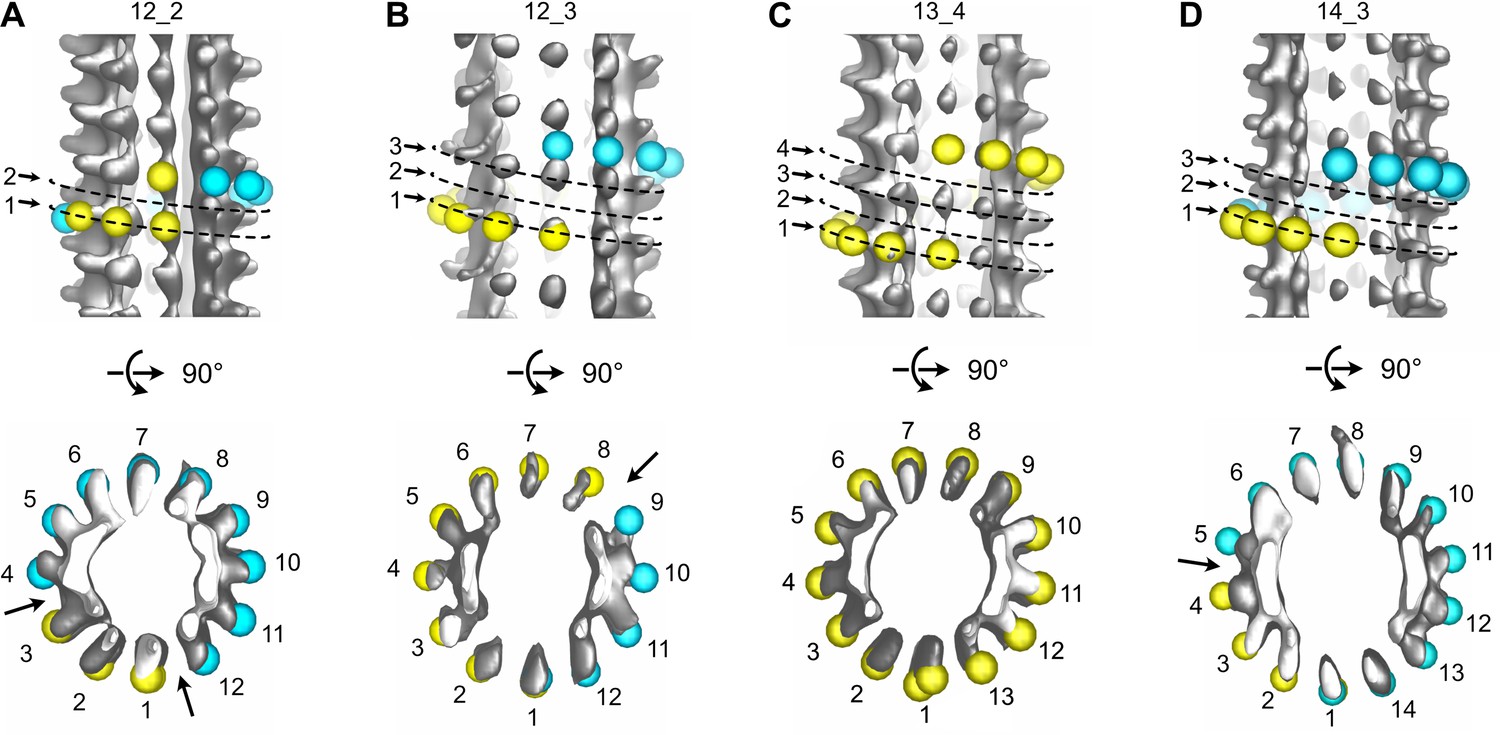
Variations in protofilament and helix-start numbers in microtubules assembled in Xenopus egg cytoplasmic extracts.
(A) 12_2 microtubule with two seams (Figure 8—figure supplement 1: MT9). (B) 12_3 microtubule with a unique seam. This microtubule transitioned to a 13_3 configuration (Figure 8—figure supplement 4: MT62). (C) 13_4 microtubule with no seam. This microtubule transitioned to a 13_3 configuration (Figure 8—figure supplement 1: MT7). (D) 14_3 microtubule with one seam. This microtubule transitioned to a 13_3 configuration (Figure 8—figure supplement 2 MT32).
Figure 9—video 1
Sub-tomogram averages of microtubules with different protofilament and/or helix-start numbers.
Sub-tomogram averages of the 12_2, 12_3, 13_4, and 14_3 microtubules in Figure 9. Arrows point to local dislocations in the 12_2 and 13_4 microtubules.
Figure 10
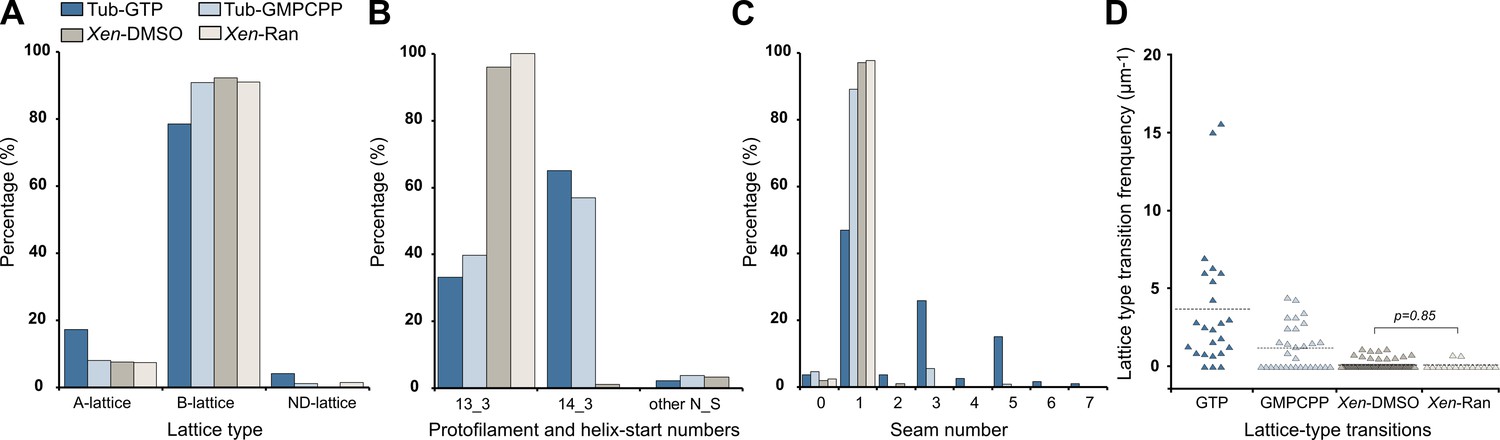
Characterization of microtubule lattices.
(A) Percentage of lattice types. (B) Percentage of protofilament (N) and helix-start (S) numbers. (C) Percentage of seam number. (D) Lattice-type transition frequency. Microtubules assembled in Xenopus egg cytoplasmic extracts in the presence of 5% DMSO (Xen-DMSO) and RanQ69L (Xen-Ran) were compared using the Wilcoxon–Mann–Whitney rank-sum test. Tub-GTP: microtubules assembled at 40 µM tubulin concentration in the presence of 1 mM GTP. Tub-GMPCPP: microtubules assembled at 10 µM tubulin concentration in the presence of 0.1 mM GMPCPP.
Figure 11 with 1 supplement
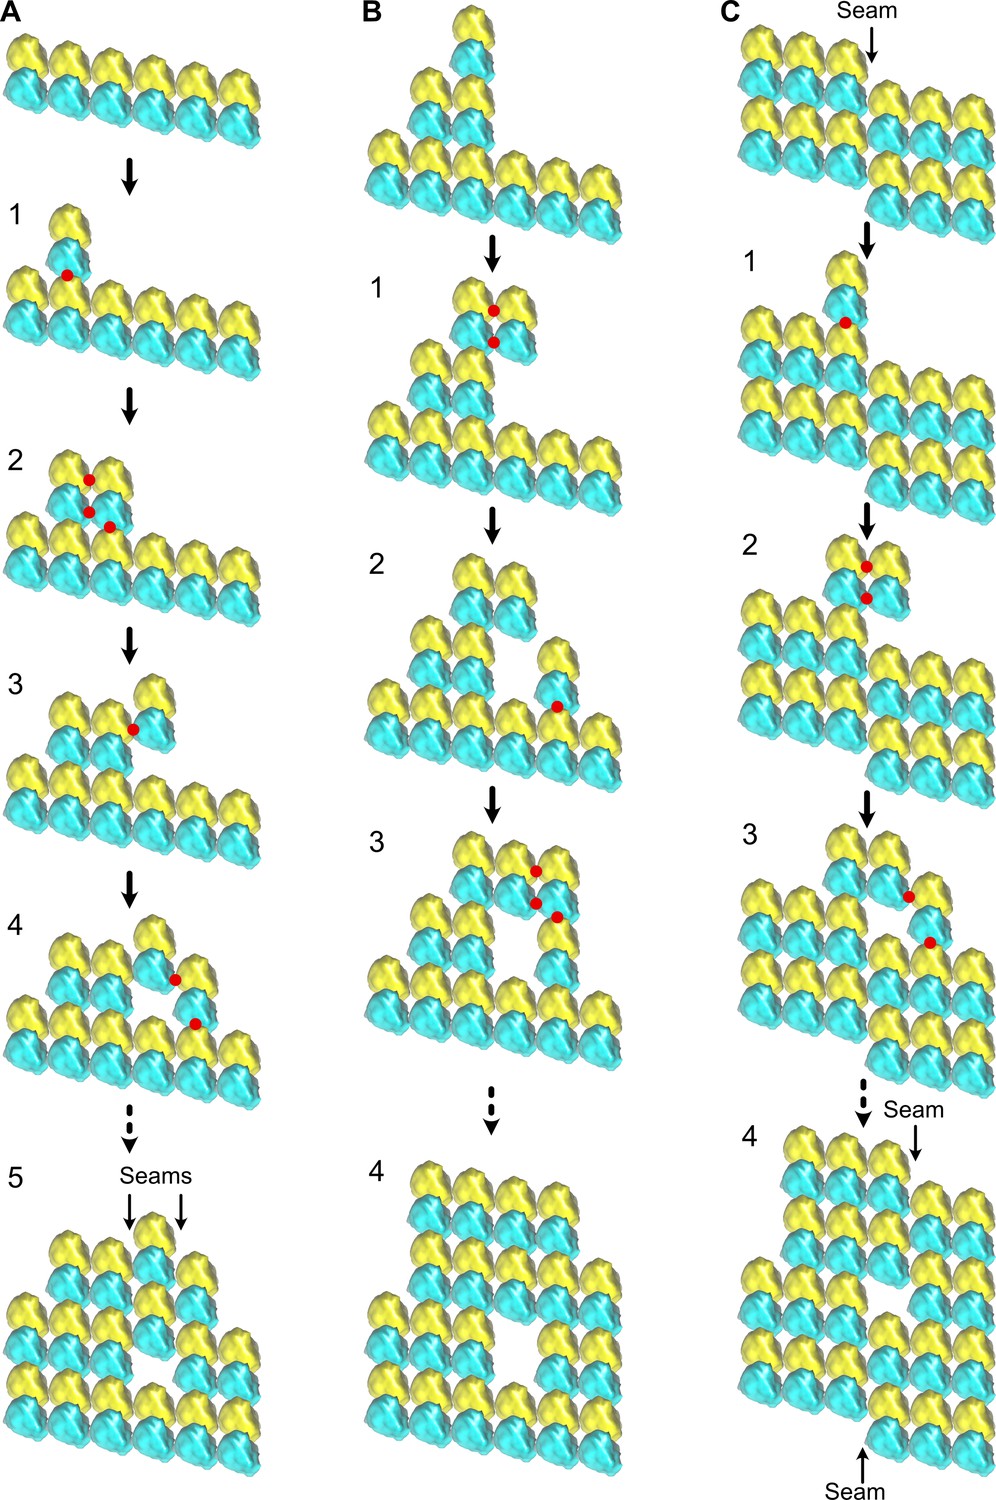
Formation of holes within microtubules during assembly.
(A) Formation of multiple seams; red dots indicate new interactions. (1) Unique longitudinal interaction. (2) Combined lateral and longitudinal interactions. (3) Unique lateral interaction between one α-tubulin subunit of an incoming tubulin dimer and a β-tubulin subunit at the tip of the growing microtubule. (4–5) Incorporation of a hole within the microtubule lattice. Two A-lattice seams have been formed (arrows). (B) Incorporation of a tubulin dimer gap without change in lattice type organization. (1) Homotypic lateral interaction of an incoming tubulin dimer without longitudinal interaction. (2–5) Incorporation of a tubulin dimer gap inside the microtubule lattice. (C) Lateral offset of the seam by one protofilament during elongation. (1) Unique longitudinal interaction. (2) Homotypic interaction of an incoming dimer at the seam region without longitudinal contact. (3–4) Incorporation of a lattice-type transition inside the microtubule lattice. The seam has moved laterally by one protofilament (4), a situation systematically encountered in cytoplasmic extract microtubules.
Figure 11—video 1
Microtubule growth-induced mechanism of lattice heterogeneity.
This video depicts how holes of an odd or even number of subunits arise during microtubule polymerization, with the formation of lateral interactions without longitudinal ones at the tip of the growing microtubule.
Author response image 1
Author response image 2

Tables
Table 1
Characterization of microtubule lattice structure by cryo-electron tomography and segmented sub-tomogram averaging.
| Assembly conditions | GTP | GMPCPP | Xenopus DMSO | Xenopus RanQ69L |
|---|---|---|---|---|
| Tomograms | 4 | 6 | 5 | 1 |
| Samples | 2 | 2 | 1 | 1 |
| Microtubules | 24 | 31 | 64 | 15 |
| Total length (µm) | 31.7 | 35.1 | 67.4 | 19.9 |
| Segments | 195 | 238 | 419 | 86 |
| Lateral interactions | 2663 | 3236 | 5446 | 1118 |
| A-type | 460 | 261 | 415 | 84 |
| B-type | 2091 | 2937 | 5025 | 1018 |
| ND | 112 | 38 | 6 | 16 |
| Lattice-type transitions | 119 | 37 | 6 | 2 |
| Frequency (µm–1) | 3.69 ± 4.20 | 1.25 ± 1.41 | 0.09 ± 0.30 | 0.10 ± 0.29 |
Table 2
Protofilament (N) and helix-start number (S).
| N_S | 12_2 | 12_3 | 13_3 | 13_4 | 14_3 | 15_3 | 15_4 |
|---|---|---|---|---|---|---|---|
| GTP (%) | - | 1.00 | 32.99 | - | 64.97 | 1.04 | - |
| GMPCPP (%) | - | 1.88 | 39.65 | - | 56.76 | - | 1.71 |
| Xen. DMSO (%) | 1.11 | 0.21 | 95.97 | 1.78 | 0.93 | - | - |
| Xen. RanQ69L (%) | - | - | 100 | - | - | - | - |
-
Xen.: Xenopus.
Key resources table
| Reagent type (species) or resource | Designation | Source or reference | Identifiers | Additional information |
|---|---|---|---|---|
| Strain, strain background (Escherichia coli) | Rosetta 2(DE3) | Merck | Cat# 71397-3 | Thermo-competent cells, used for kinesin-motor domain purification |
| Strain, strain background (E. coli) | One Shot BL21(DE3) | Thermo Fisher Scientific | Cat# C6000-03 | Used for the purification of GTPase-deficient mutant RanQ69L |
| Recombinant DNA reagent | KIF5B | Steinmetz laboratory (PSI Villigen, Switzerland) | ||
| Recombinant DNA reagent | RanQ69L | Heald laboratory (UC Berkley, USA) | ||
| Peptide, recombinant protein | Tubulin-Rhodamine | Cytoskeleton, Inc. | Cat# TL590M | Rhodamine labeled porcine brain tubulin |
| Chemical compound, drug | Chorulon 1500 | MSD Animal Health | GTIN: 08713184057587 | |
| Software, algorithm | ImageJ software | ImageJ (https://imagej.net/) | RRID:SCR_003070 | v1.53 |
| Software, algorithm | KaleidaGraph software | KaleidaGraph (https://www.synergy.com) | RRID:SCR_014980 | v5.01 |
| Software, algorithm | UCSF Chimera software | UCSF Chimera (https://www.cgl.ucsf.edu/chimera/) | RRID:SCR_004097 | v1.14 |
| Software, algorithm | IMOD software | IMOD (https://bio3d.colorado.edu/imod/) | RRID:SCR_003297 | v4.12.19 |
| Software, algorithm | PEET software | PEET (https://bio3d.colorado.edu/PEET/) | v1.16.0 |
Additional files
-
Supplementary file 1
EMDB deposition IDs.
Sub-tomogram averages and their corresponding models can be opened in Imod using the following command: 3dmod -V -E U emd_XXXX.map EMD-XXXX_helix.mod.
- https://cdn.elifesciences.org/articles/83021/elife-83021-supp1-v2.docx
-
Supplementary file 2
EMPIAR deposition IDs.
To reconstruct the volumes, follow the instructions in the SSTA.txt document.
- https://cdn.elifesciences.org/articles/83021/elife-83021-supp2-v2.docx
-
MDAR checklist
- https://cdn.elifesciences.org/articles/83021/elife-83021-mdarchecklist1-v2.docx
-
Source data 1
EMD_helix.zip: helix models associated with the sub-tomogram averages deposited on the EMDB (Supplementary file 1).
- https://cdn.elifesciences.org/articles/83021/elife-83021-data1-v2.zip
Download links
A two-part list of links to download the article, or parts of the article, in various formats.
Downloads (link to download the article as PDF)
Open citations (links to open the citations from this article in various online reference manager services)
Cite this article (links to download the citations from this article in formats compatible with various reference manager tools)
Changes in seam number and location induce holes within microtubules assembled from porcine brain tubulin and in Xenopus egg cytoplasmic extracts
eLife 11:e83021.
https://doi.org/10.7554/eLife.83021


