Mechanisms and functions of respiration-driven gamma oscillations in the primary olfactory cortex
- Departamento de Fisiología, Facultad de Medicina, Universidad de la República, Uruguay
- Brain Institute, Federal University of Rio Grande do Norte, Brazil
Figures
Figure 1 with 5 supplements
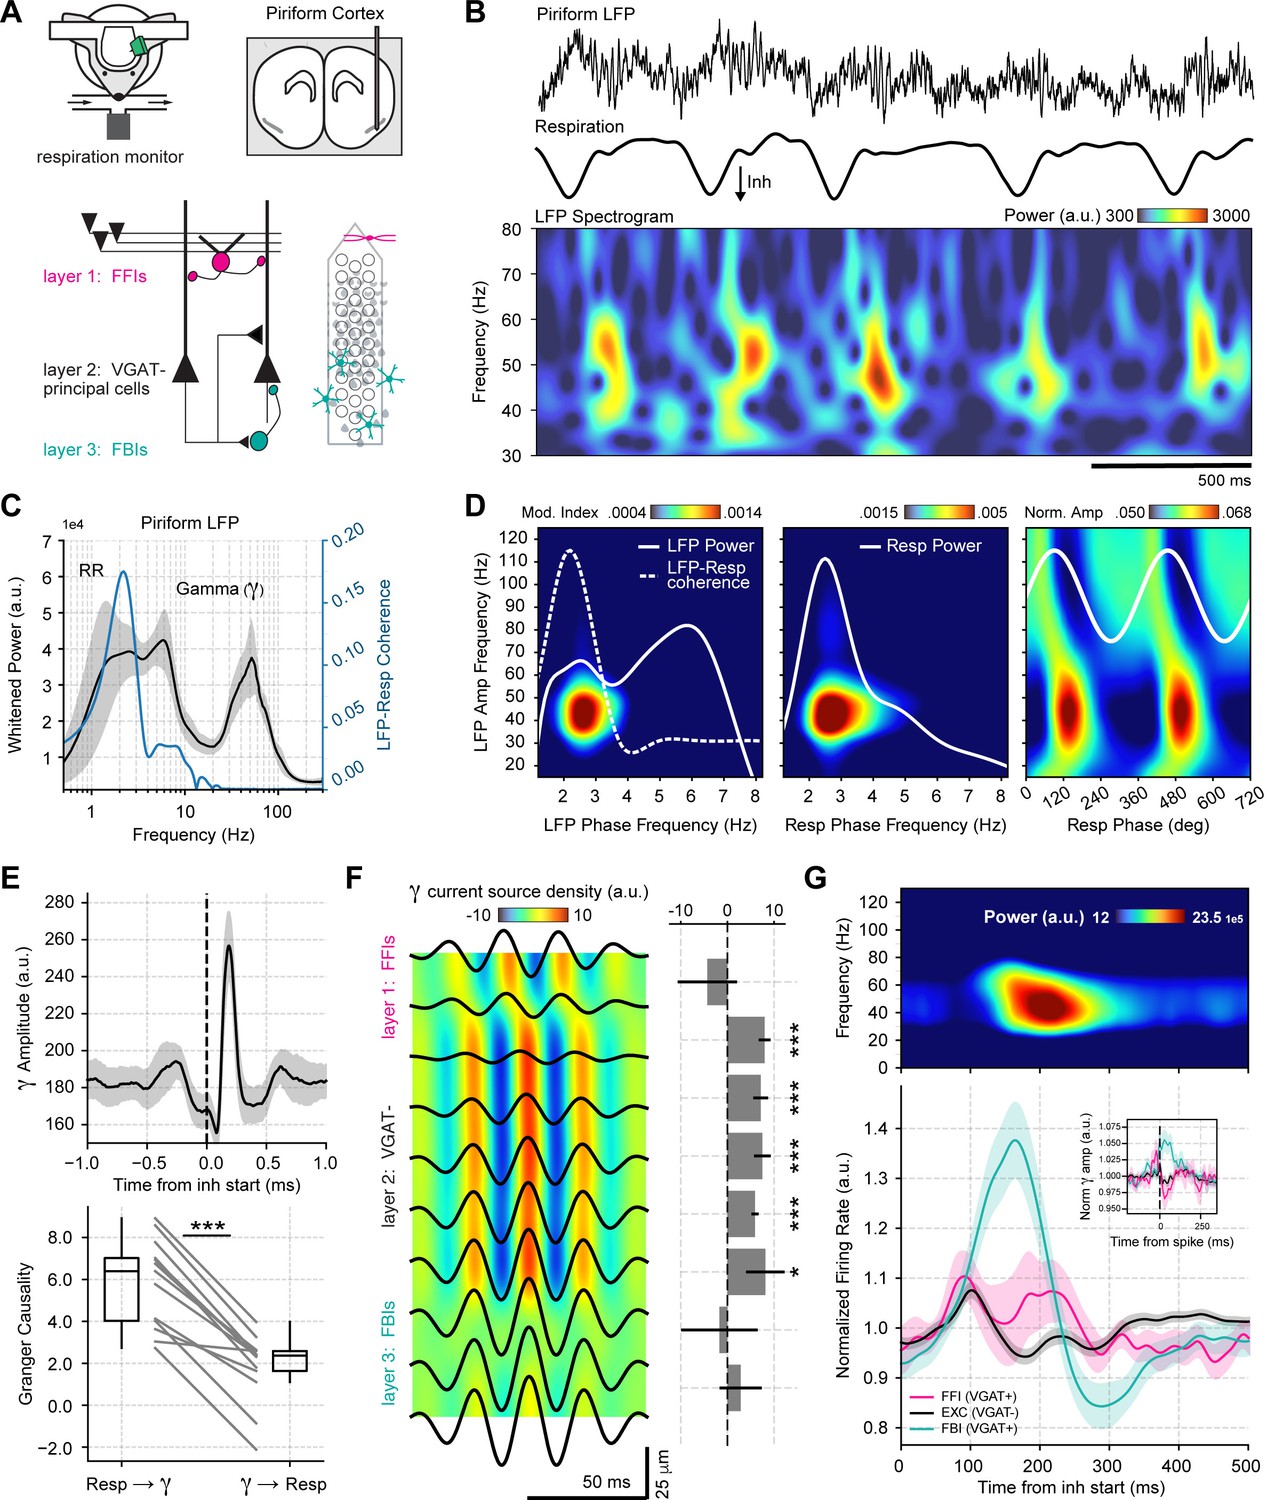
Respiration drives feedback inhibition-based gamma oscillations in the piriform cortex.
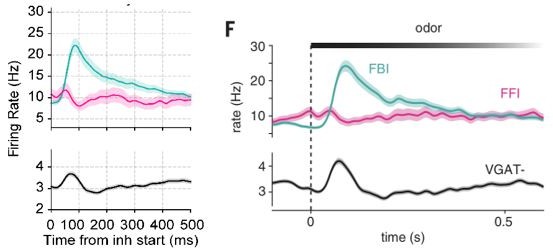
(A) Experimental scheme, probe localization, and diagram of the local piriform circuit (modified from Bolding and Franks, 2018a). (B) Example of simultaneously recorded local field potentials (LFP) (top) and respiration (middle) signals, along with the LFP wavelet spectrogram (bottom). Notice prominent rhythmical appearance of gamma oscillations. (C) Average LFP power spectrum (± 2*SEM; n=13 recording sessions from 12 mice). The spectrum was whitened by multiplying each value by the associated frequency. Average LFP-Respiration coherence is superimposed in blue. (D) Average phase-amplitude comodulogram using either the LFP (left) or the respiration (Resp; middle) phase. Superimposed white lines show the LFP or Resp power spectrum (solid) and the LFP-Resp coherence (dashed). The right panel shows the normalized amplitude for LFP-filtered frequency components as a function of the Resp phase (average over n=13 recording sessions from 12 mice). (E) Directionality analyses between Resp and the gamma envelope (30–60 Hz). Shown are the average (± SEM, n=13 recording sessions from 12 mice) gamma envelope triggered by inhalation start (top), and the Granger causality for the Resp→gamma and gamma→Resp directions (bottom; boxplots show the median, 1st, 3rd quartiles, and the distribution range; each dot shows an individual mouse). (F) Average current source density for the gamma band (n=13 recording sessions from 12 mice). Superimposed black lines show the average gamma waveforms for each recording site. Bar plots depict statistical comparisons against a zero-current distribution (mean ± SEM; n=13 recording sessions from 12 mice). (G) Respiration-evoked LFP responses. Top: average inhalation-triggered whitened spectrogram (n=15 recording sessions from nine mice). Bottom: Normalized spike rate (mean ± SEM) of excitatory (EXC; VGAT-, 858 neurons), feedback inhibitory (FBI; VGAT+, 40 neurons), and feedforward inhibitory (FFI; VGAT+, 13 neurons) neuronal populations triggered by inhalation. Inset shows the normalized spike-triggered gamma amplitude envelope for each neuronal subpopulation (mean ± SEM). Normalization consisted of dividing the triggered gamma amplitude values by the mean amplitude 500 ms before each spike.
Figure 1—figure supplement 1
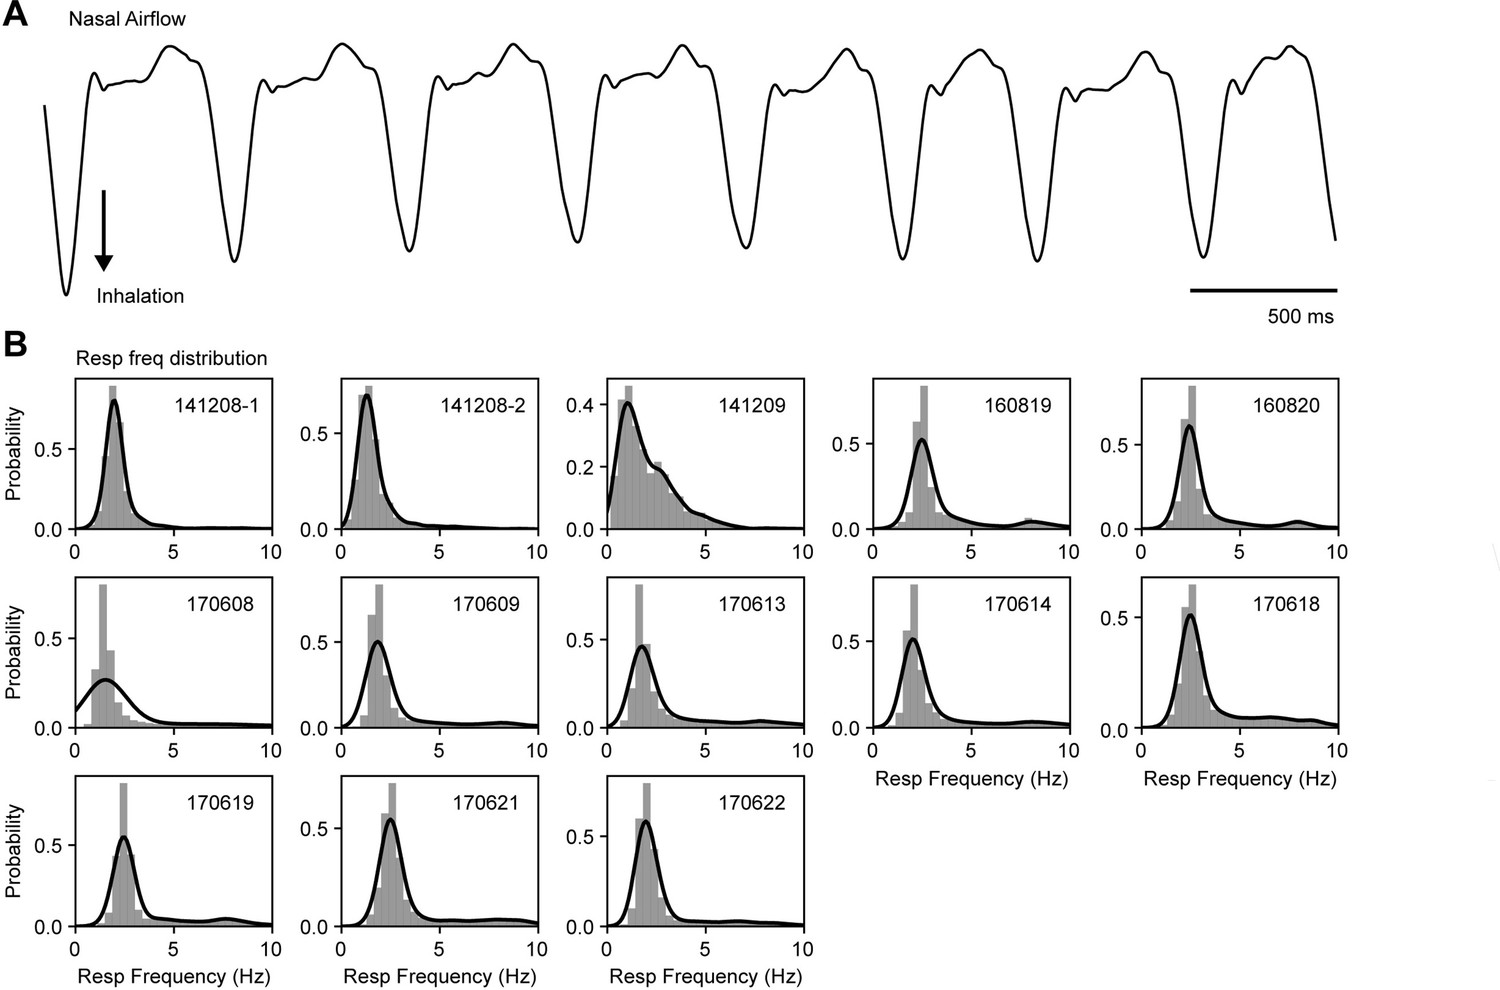
Similar respiratory frequency ranges across mice.
(A) Example of a respiration recording measured through nasal airflow. (B) Respiratory frequency distribution for each mouse (insets show the mouse identification number). The instantaneous breathing frequency was estimated as the inverse of the inhalation period; bars depict probabilities for binned frequency intervals; solid lines show the kde distribution fit.
Figure 1—figure supplement 2
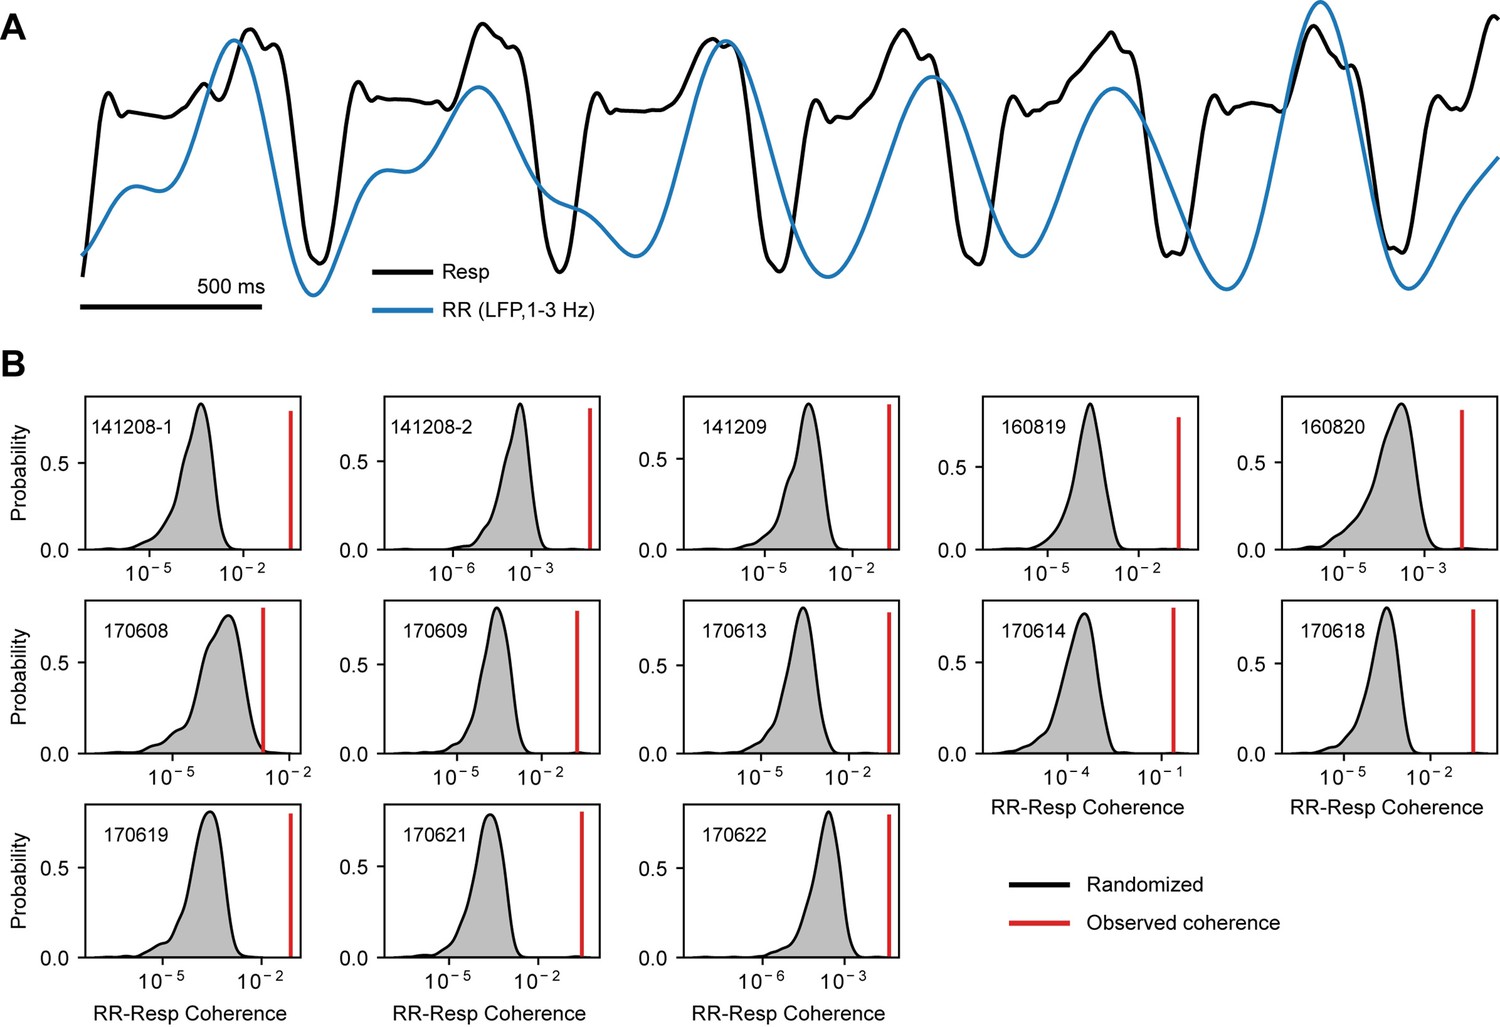
The 1–3 Hz local field potentials (LFP) band is entrained by respiration.
(A) Example of a respiration recording (Resp) along with the 1–3 Hz filtered LFP trace, which reflects the respiration-entrained rhythm (RR; see Tort et al., 2018). (B) Surrogate RR-Resp coherence distributions (insets show the mouse identification number). Each distribution was obtained by computing the RR-Resp coherence using randomly circularly shifted respiration phases (1000 randomizations per mouse). The red vertical lines indicate the actual coherence values. All mice showed significant RR-Resp coherence (p<0.01).
Figure 1—figure supplement 3
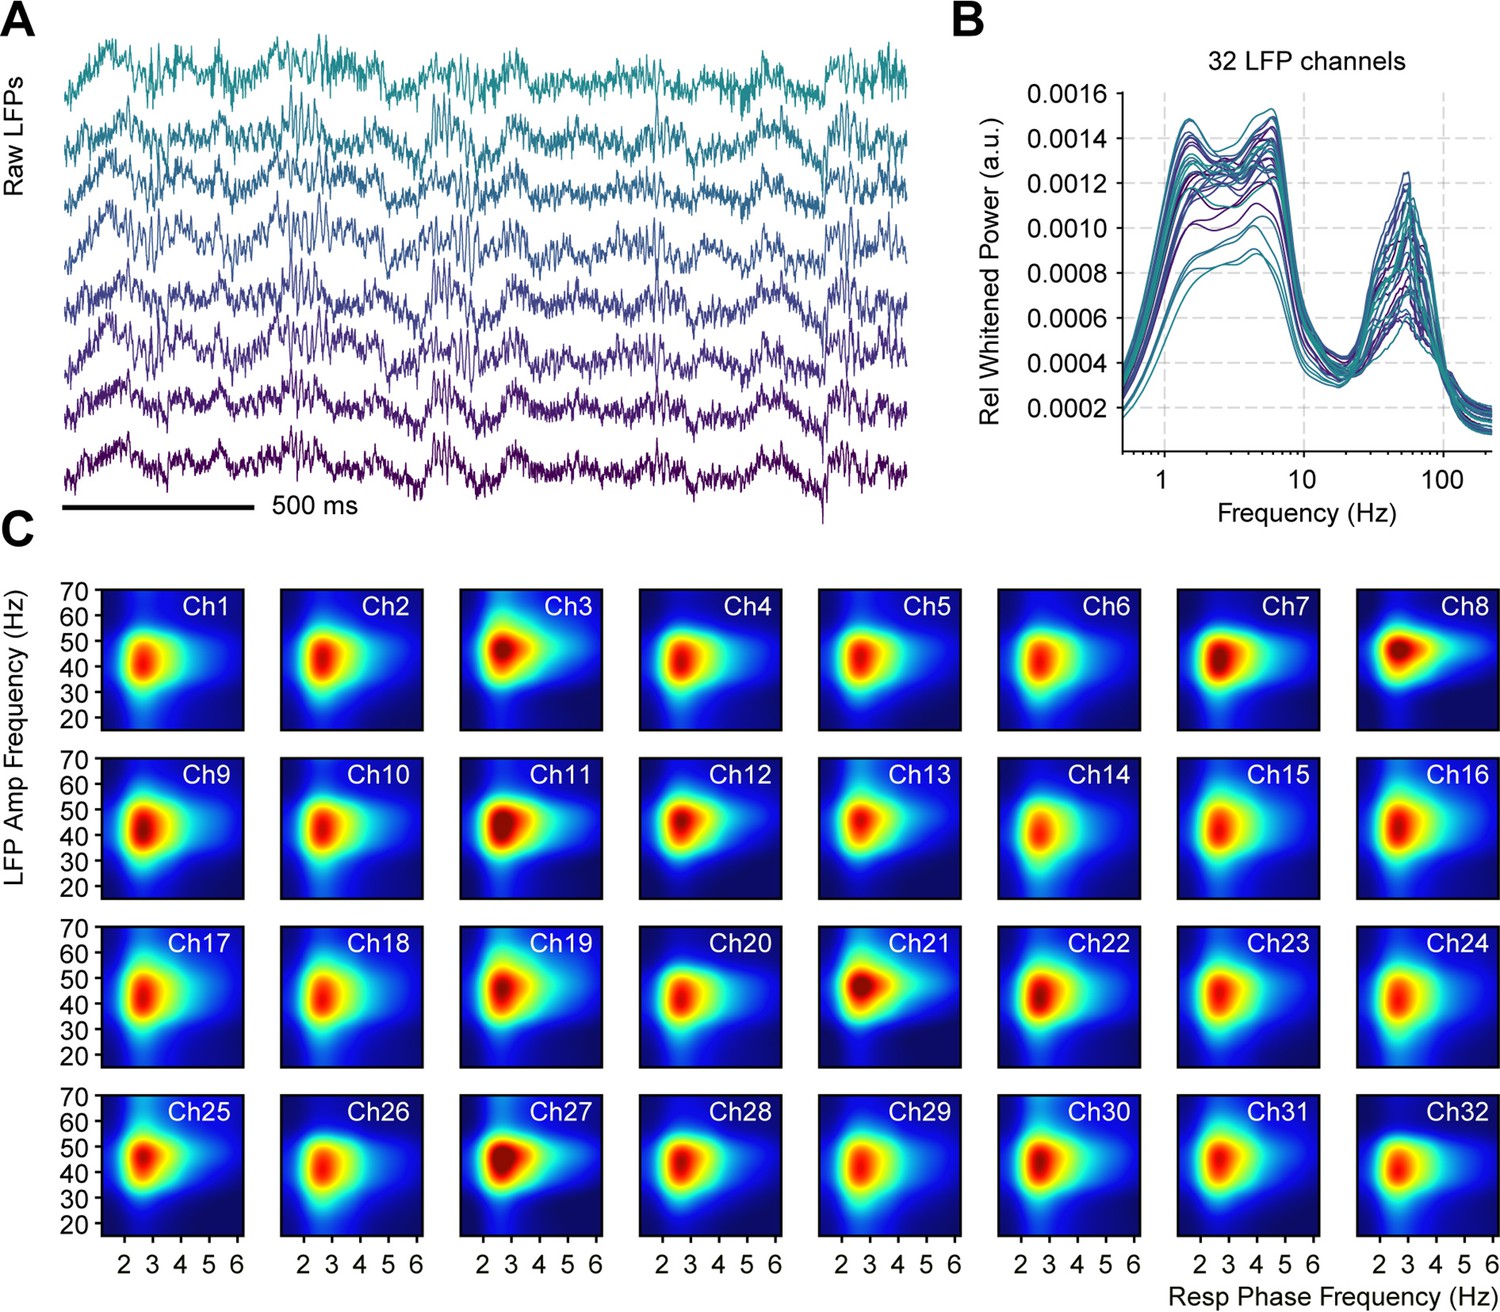
Respiration-driven gamma oscillations in the piriform cortex are evident across recording sites.
(A) Simultaneous local field potentials (LFP) recording examples from eight channels. (B) Whitened normalized LFP power spectra for all 32 recording sites during odorless cycles. The normalization consisted of dividing power values by the total power. Colors indicate the electrode number (from green to purple). (C) Phase-amplitude LFP comodulogram for each channel during odorless cycles (individual color scales were optimized to depict RR-gamma coupling).
Figure 1—figure supplement 4
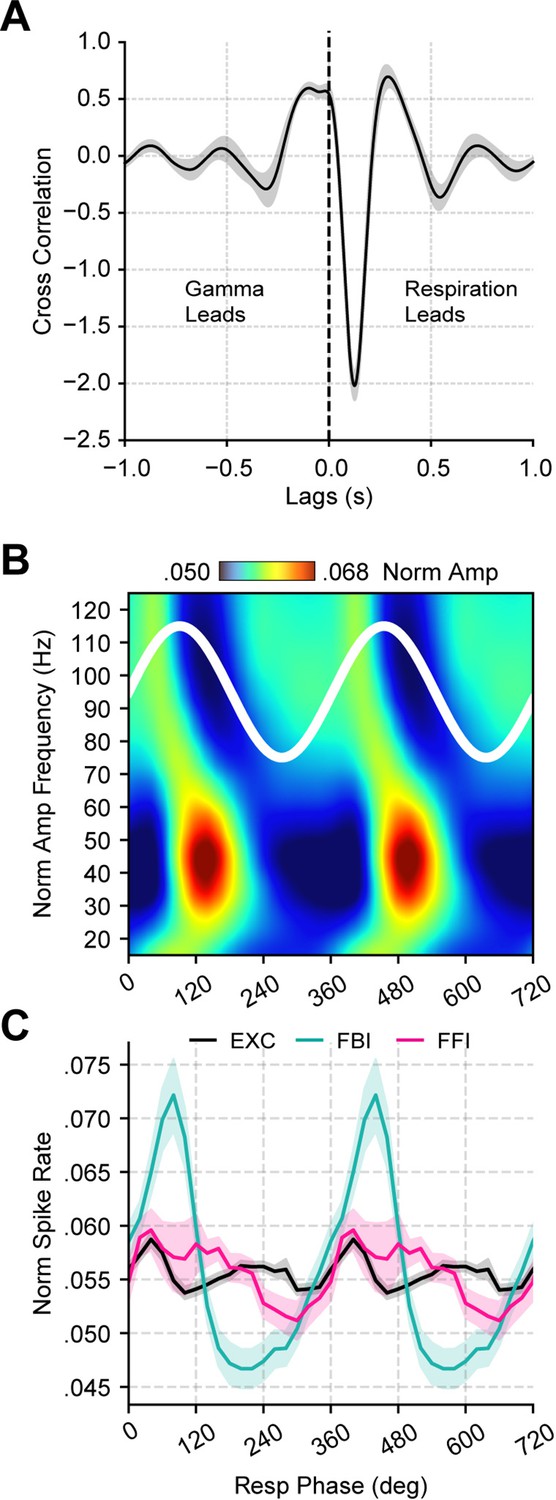
Respiration leads low-gamma oscillations in the piriform cortex.
(A) Average (± SEM) cross-correlation between respiration (Resp) and the gamma envelope (n=13 recording sessions from 12 mice). (B) Normalized amplitude for LFP-filtered frequency components as a function of the Resp phase (average over 13 recording session from 12 mice). (C) Spike rate (mean ± SEM) of excitatory (EXC; VGAT-, 858 neurons), feedback inhibitory (FBI; VGAT+, 40 neurons), and feedforward inhibitory (FFI; VGAT+, 13 neurons) neuronal populations binned by the Resp phase.
Figure 1—figure supplement 5
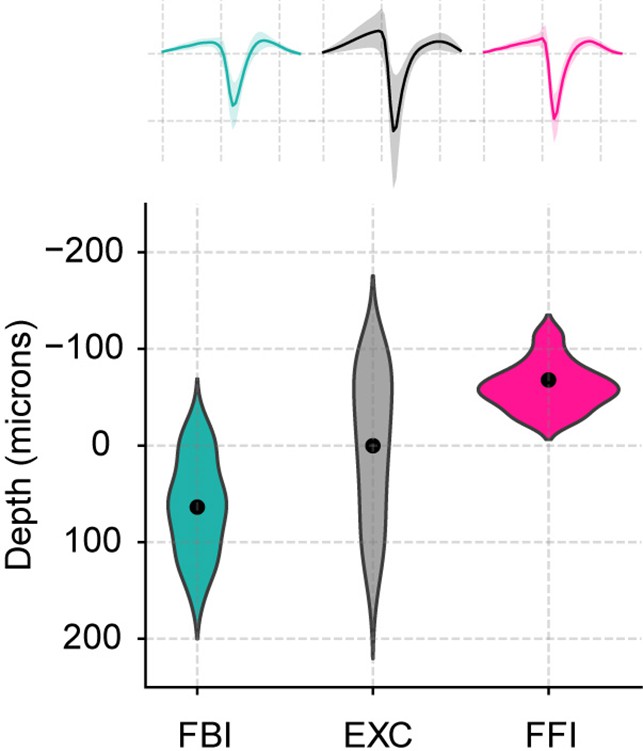
Position and average waveform of neuronal subtypes.
Top: Average waveforms for all three subtypes (mean ± SEM; n=40 FBI, 858 EXC, 13 FFI). Bottom: Positions of the recorded cells along the depth of the recording probe. Similar to the original publication (Bolding and Franks, 2018a), the average depth of excitatory neurons was subtracted from the estimated recording positions.
Figure 2 with 1 supplement
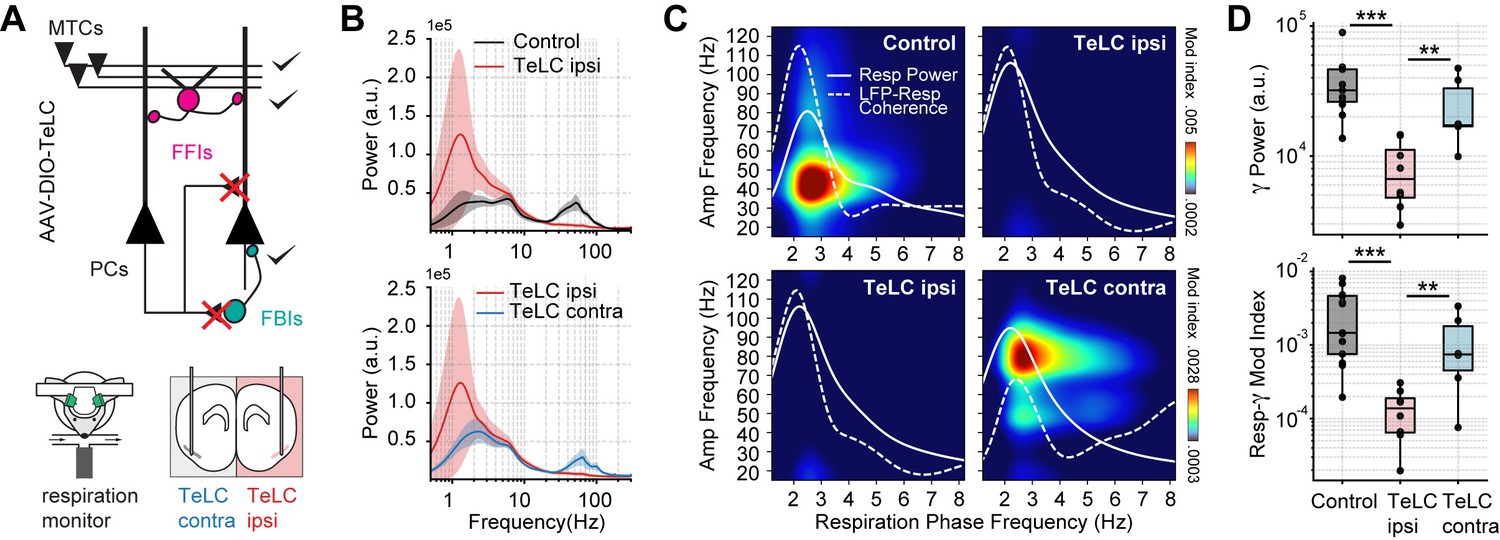
Respiration-driven gamma oscillations depend on recurrent connections within the piriform cortex.
(A) Schematic of circuit changes after TeLC expression in principal cells (PCs) of the piriform circuit (MTCs: mitral cells; FFIs: feedforward interneurons; FBIs: feedback interneurons). Recordings were made both ipsi- and contralaterally to the TeLC expression (modified from Bolding and Franks, 2018a). (B) Average (± 2*SEM) power spectra for control and TeLC-infected animals (Control, n=13 recording sessions from 12 mice; TeLC ipsi, n=8 recording sessions from eight mice; TeLC contra, n=6 recording sessions from 6 mice). Notice that local TeLC expression abolishes ipsilateral gamma oscillations in the PCx. (C) Average respiration-LFP comodulograms for control and TeLC-infected animals. Respiration power and LFP-respiration coherence are shown superimposed (same scale across plots). (D) Boxplots showing gamma power (top) and the Resp-low gamma modulation index (bottom) for control and TeLC-infected animals.
Figure 2—figure supplement 1
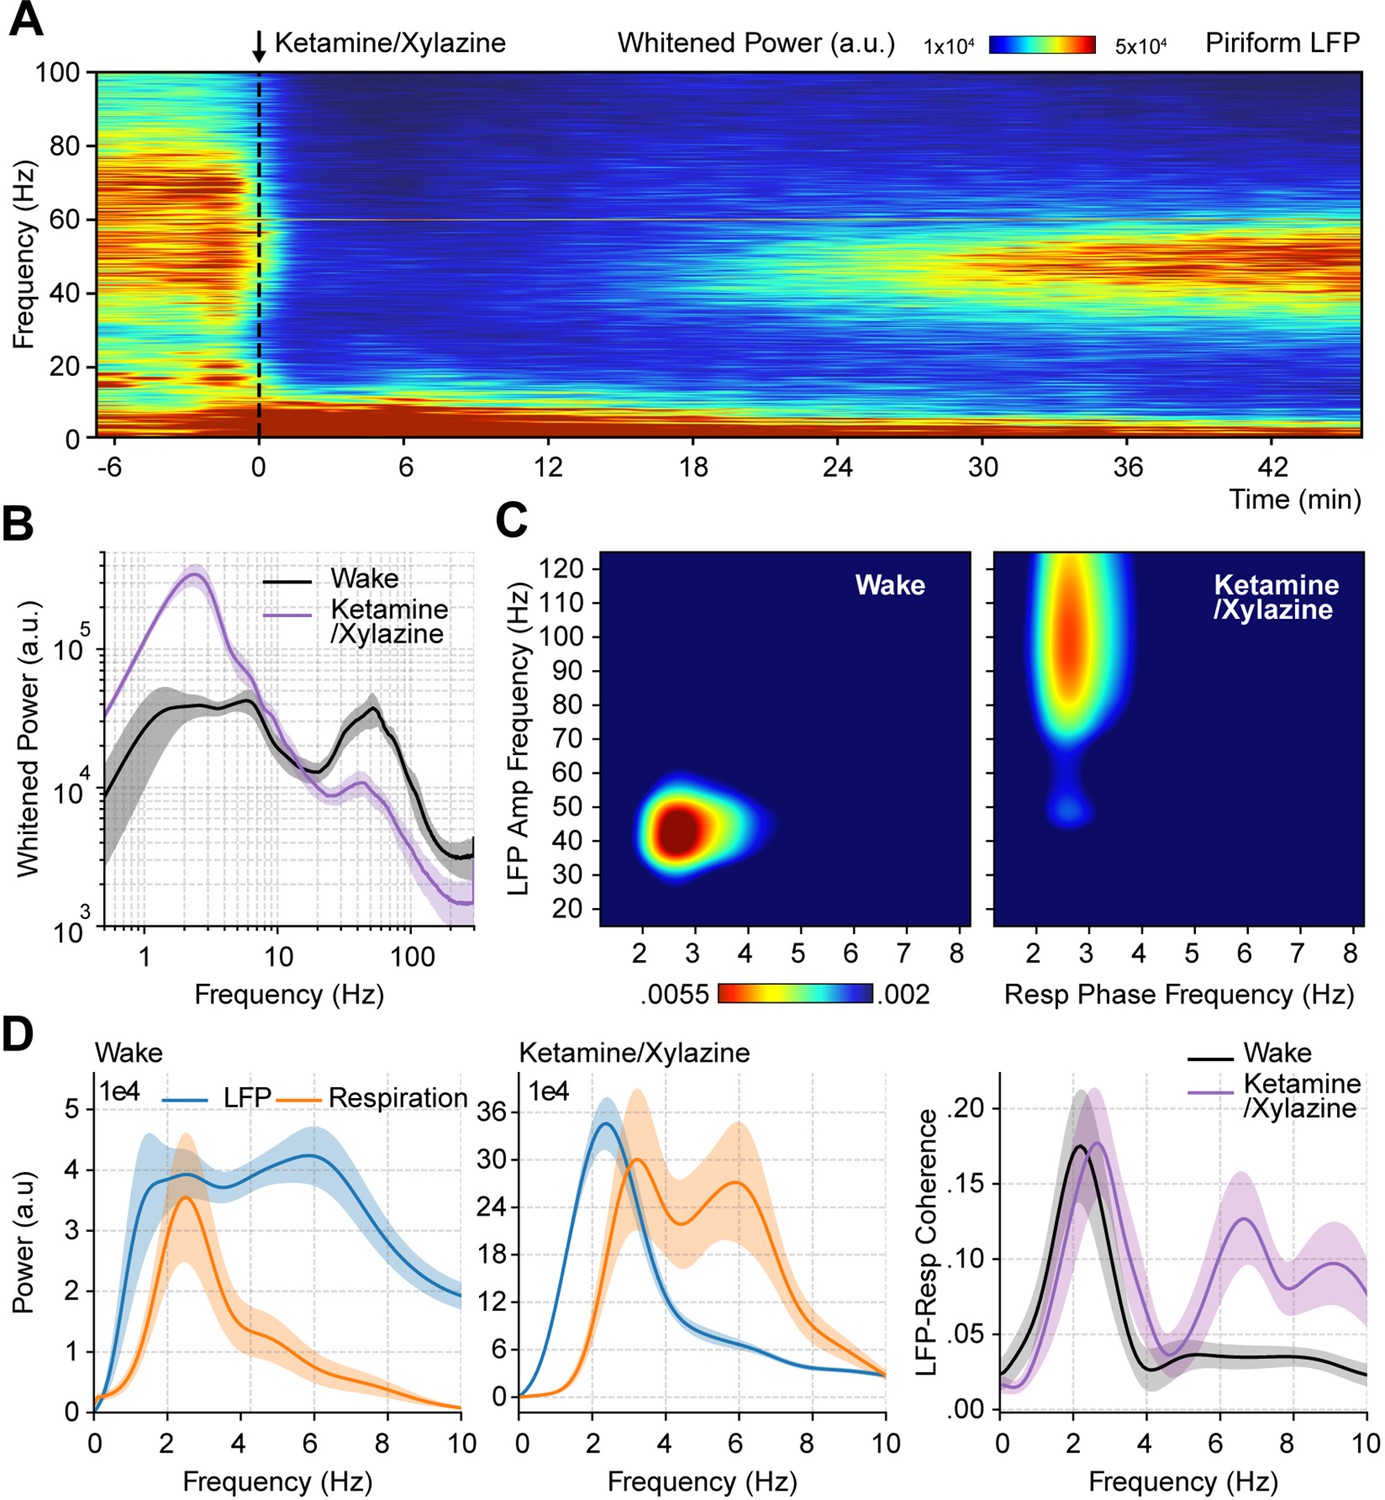
Ketamine/xylazine anesthesia abolishes spontaneous low-gamma oscillations in the piriform cortex.
(A) Spectrogram during ketamine/xylazine anesthesia in a representative animal (time of administration = 0 min). (B) Power spectra for awake and ketamine/xylazine-anesthetized animals (mean ± SEM; n=11 mice). (C) Average respiration-LFP comodulogram for either brain state. (D) Local field potentials (LFP) (blue) and respiration (orange) power spectra (mean ± SEM) during wakefulness (left) and ketamine/xylazine anesthesia (right). (E) LFP-Resp coherence for each state (mean ± SEM; n=10 mice).
Figure 3
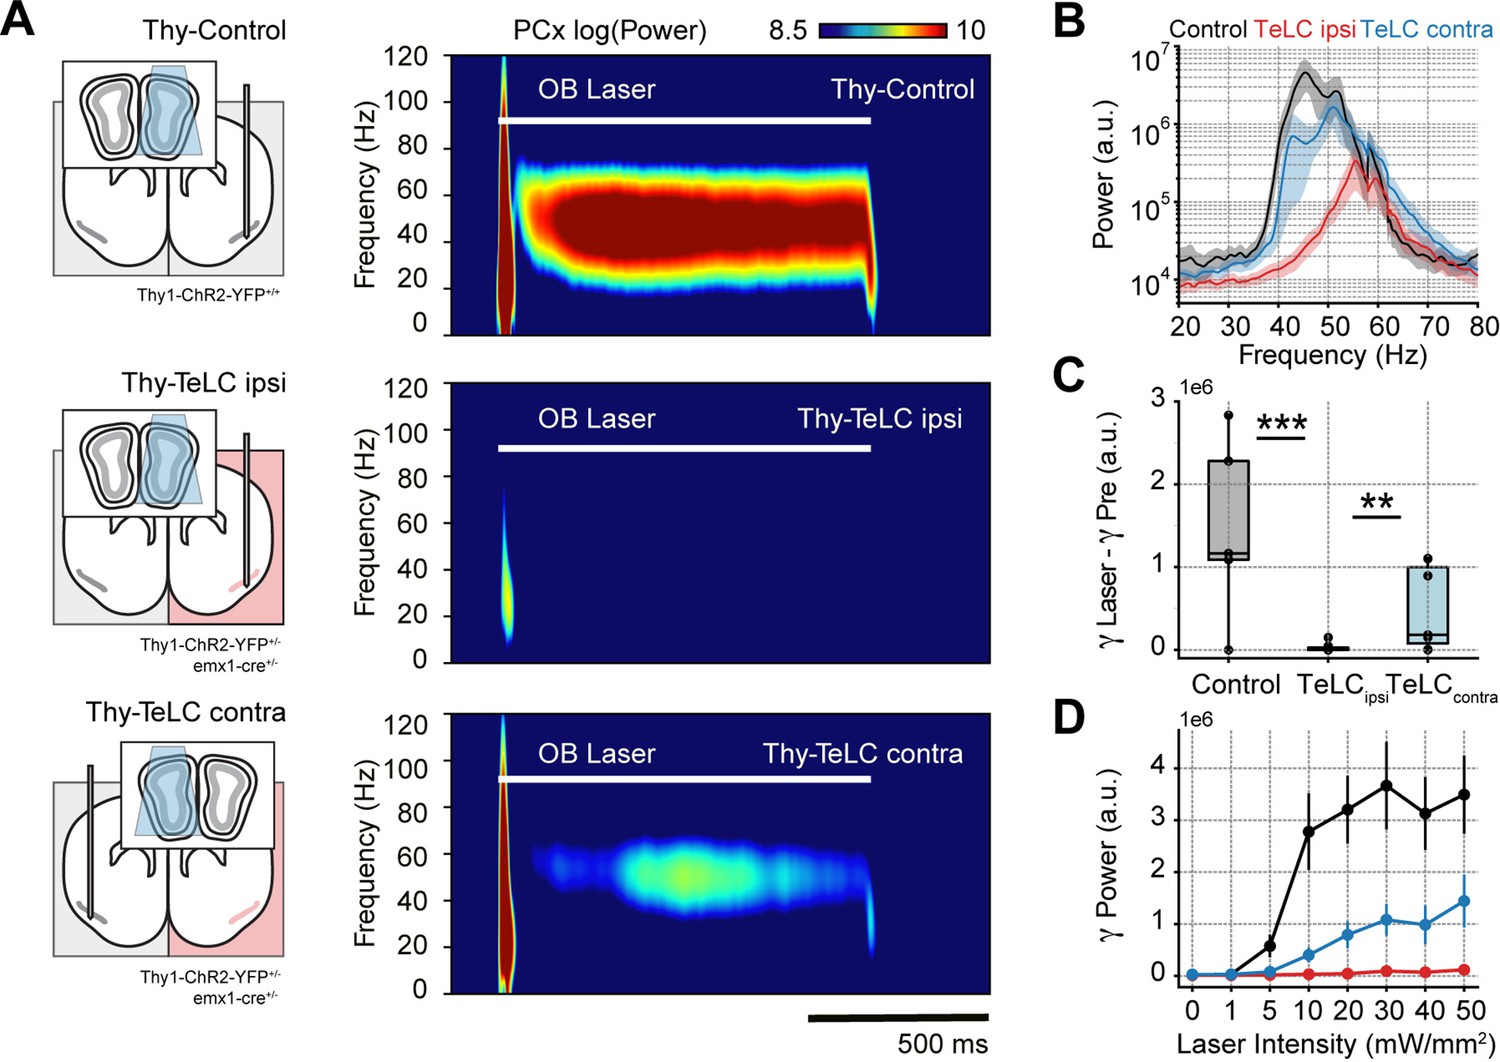
Piriform recurrent connections are necessary for olfactory bulb (OB) mitral/tufted cells to trigger low-gamma oscillations.
(A) Left: experimental conditions for each group. Right: Average piriform cortex (PCx) spectrograms during optogenetic stimulation of the olfactory bulb (OB). (B) Average gamma power during OB stimulation for the control (n=5 recording sessions from five mice), TeLC ipsi (n=14 recording sessions from eight mice) and contralateral recordings (n=7 recording sessions from five mice). Note that a logarithmic y-axis is employed here while subsequent plots use a linear scale. (C) Boxplots showing the gamma power difference between the laser and pre-laser periods. (D) Gamma power as a function of the laser intensity for each experimental condition (mean ± SEM).
Figure 4 with 1 supplement
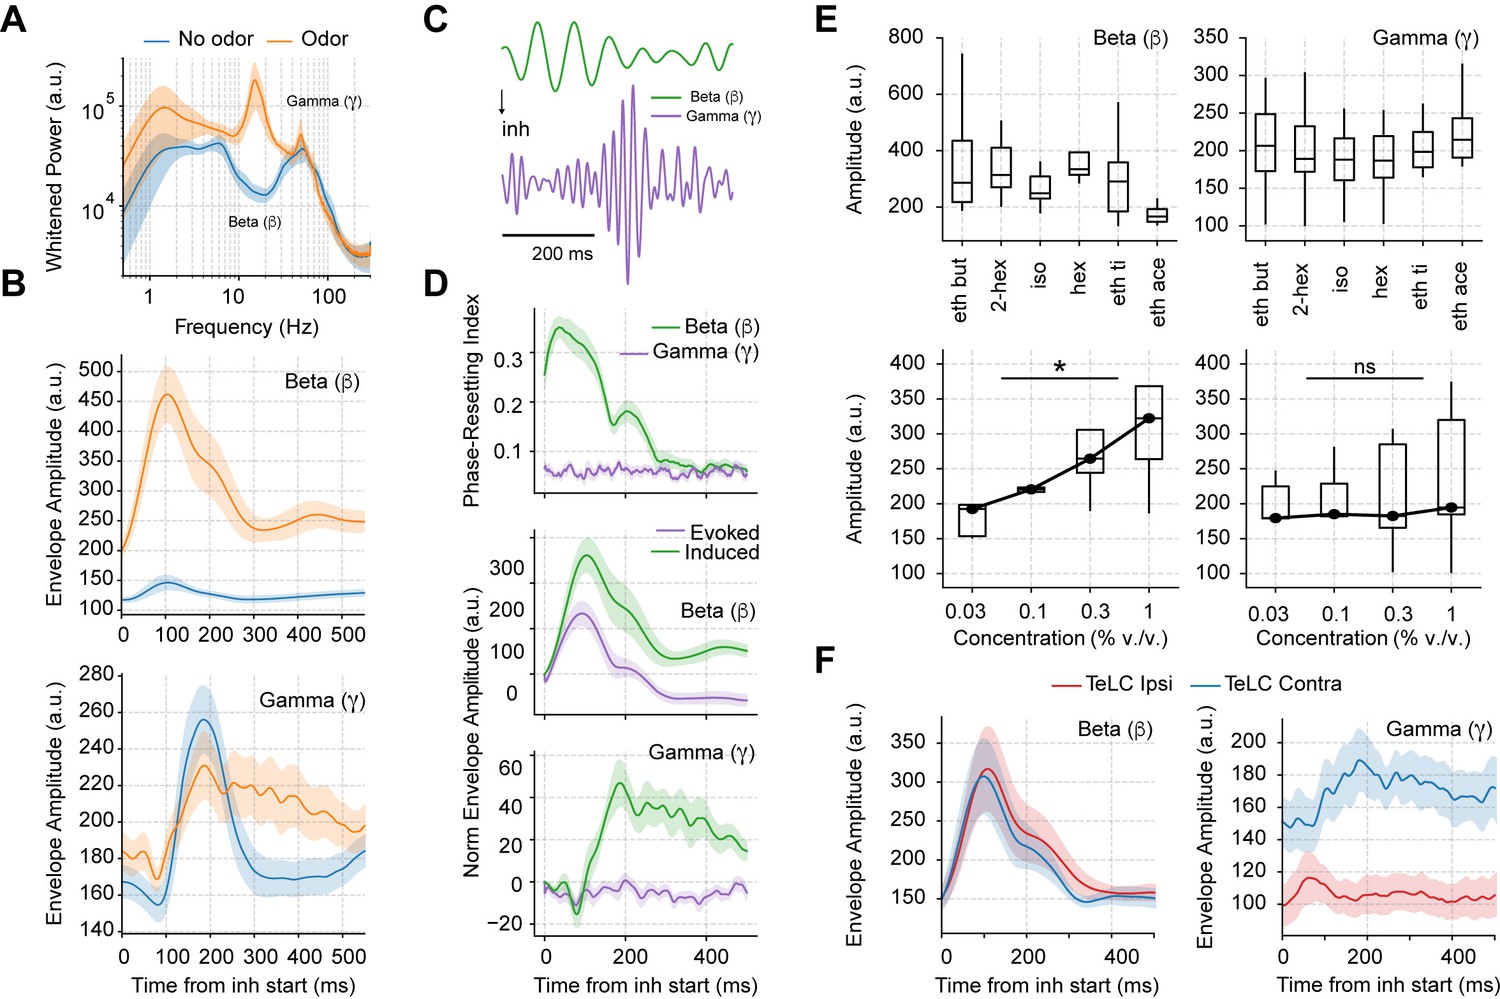
Odor delivery evokes beta and induces longer lasting gamma oscillations.
(A) Average whitened local field potentials (LFP) power spectrum for odor and odorless respiration cycles (± 2*SEM; n=13 recording sessions from 12 mice). (B) Top: Average beta (top) and gamma (bottom) amplitude for odorless respiratory cycles (blue) and for cycles with odor delivery (orange). (C) Filtered beta (10–20 Hz) and gamma (30–60 Hz) oscillations during odor delivery. (D) Top: Phase-resetting index for each oscillation. Middle: Normalized induced (green) and evoked (purple) beta (middle) and gamma (bottom) amplitude triggered by inhalation. The normalization consisted of removing the average amplitude across time. All results obtained during odor delivery. Traces show mean ± SEM. (E) Average beta (left) and gamma (right) amplitude during odor cycles. Top panels show the average amplitude for different odorants at the same concentration (0.3% v./v., n=13 recording sessions from 12 mice). Bottom panels show the response to increasing odor concentrations (amplitudes averaged for ethyl butyrate and hexanal odorants; n=5 recording sessions from fivemice). (F) Amplitude envelopes during odor cycles for beta (left) and gamma oscillations (right) in TeLC experiments. Shades represent the mean ± SEM.
Figure 4—figure supplement 1
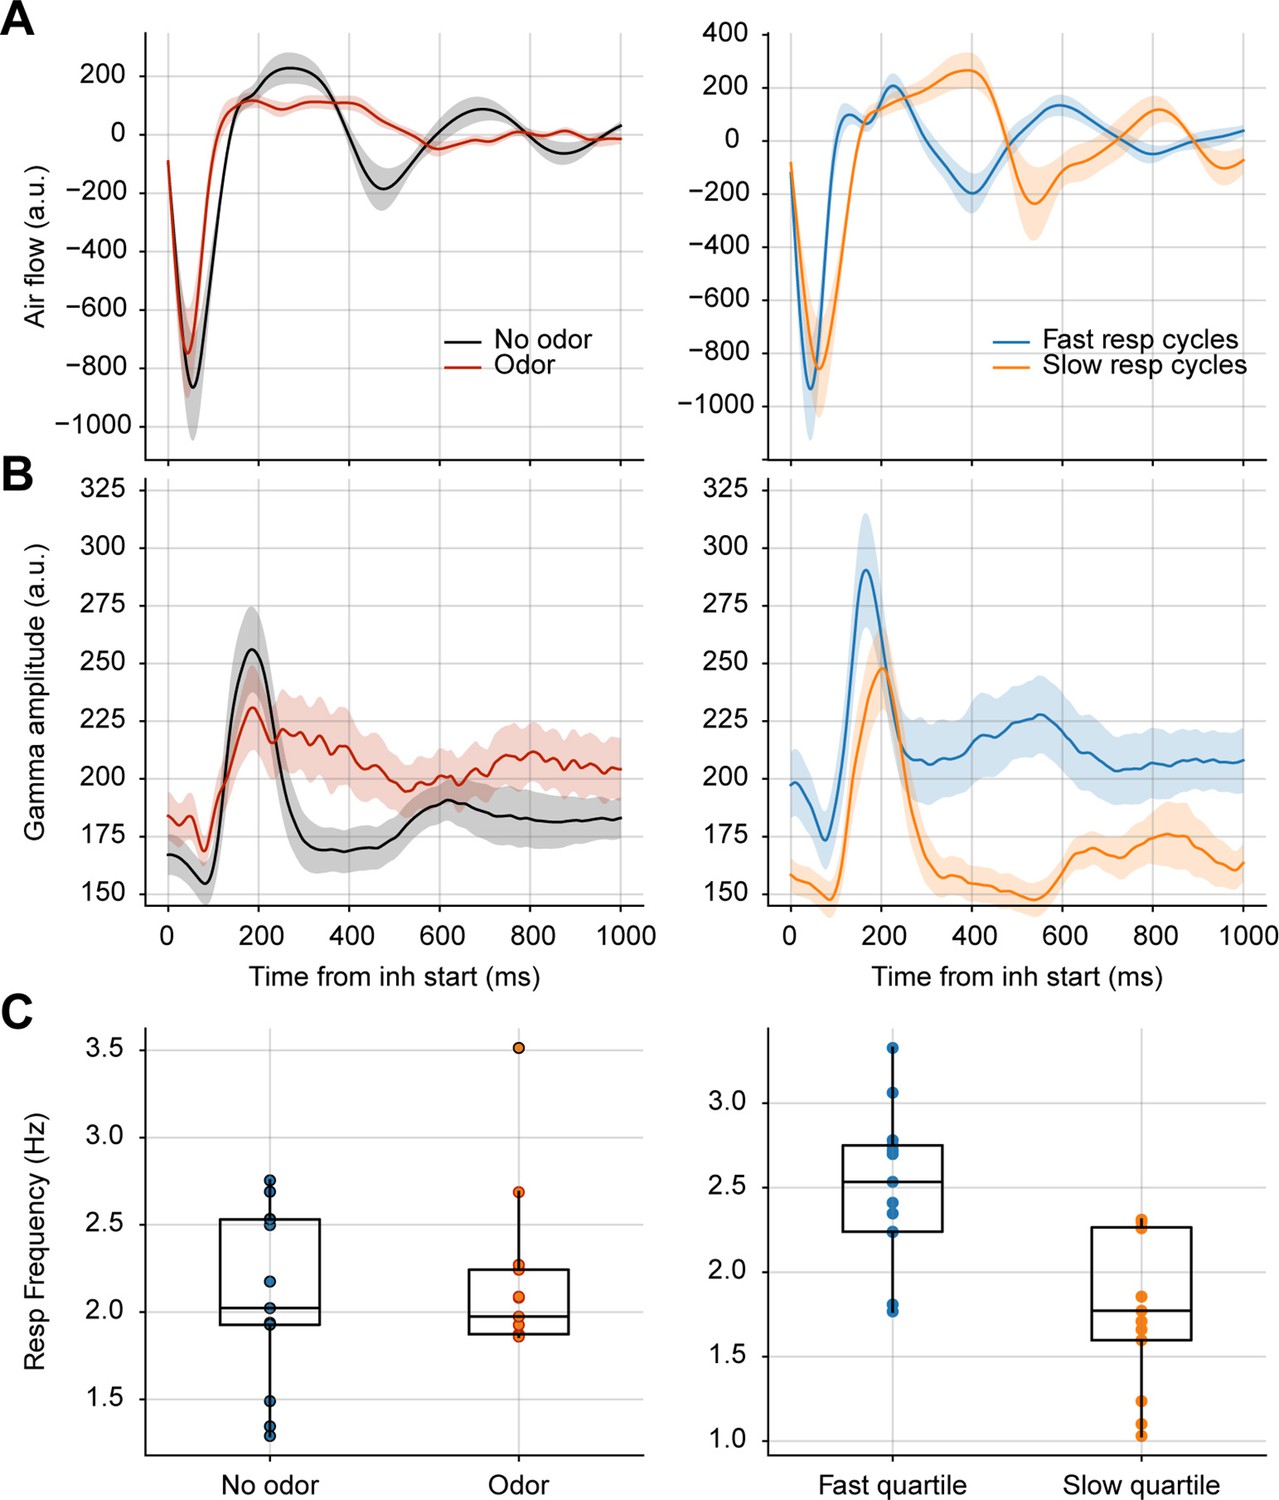
Longer breaths do not account for prolonged gamma activity in response to odors.
(A) Average respiration waveforms triggered by the inhalation start (mean ± SEM). Left: Average breathing cycle in the presence (red) and absence (black) of odors. Right: Average over all fast (blue) and slow (orange) respiratory cycles in the absence of odors. Fast breaths were defined as those with an instantaneous frequency above the 75th percentile; slow breaths as cycles with an instantaneous frequency below the 25th percentile. (B) Average gamma amplitude triggered by inhalation start (mean ± SEM) for the same respiratory cycles as above. (C) Boxplots showing the average respiratory frequency during odor vs. no odor cycles (left), and fast vs slow no odor cycles (right). Dots show individual animal values (n=13 mice).
Figure 5
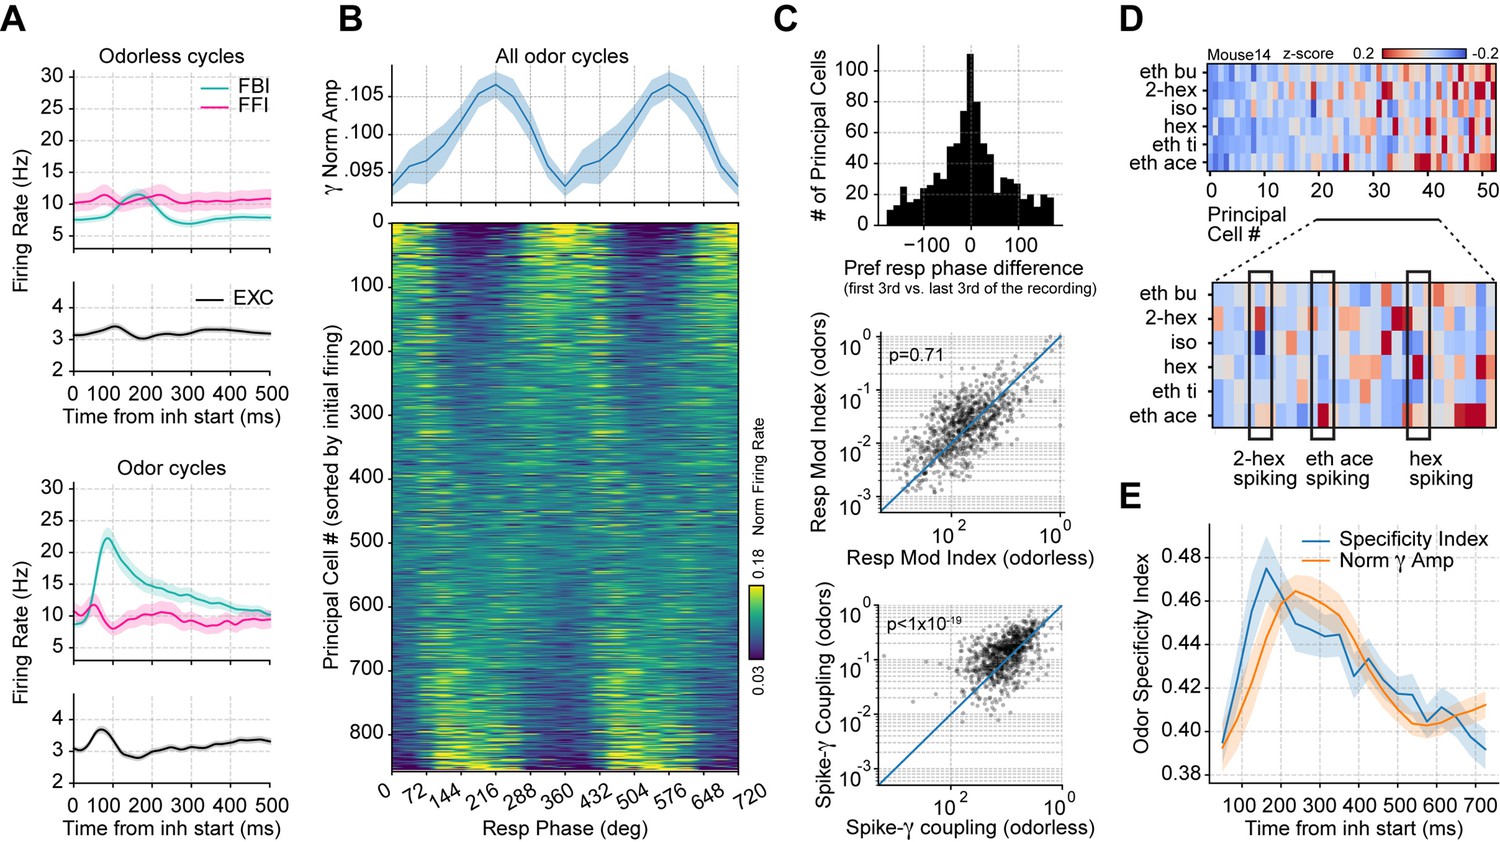
Respiration-driven gamma oscillations relate to single-cell spiking specificity to odors.
(A) Neuronal firing rates (mean ± 0.5*SEM, n=858 EXC, 40 FBI, 13 FFI) during odorless (top) and odor cycles (bottom). (B) Principal cell spiking during each phase bin of the respiration cycle (bottom; 0 degree corresponds to the start of the inhalation); neurons are sorted according to the normalized firing rate in the first bin. Gamma power is shown on top (mean ± SEM, n=15 recording sessions from nine mice). (C) Top: preferred respiratory phase differences between the first and last thirds of the recording session (n=858 neurons). Middle: Spike-Resp coupling during odor and odorless cycles (n=858 neurons). Bottom: Spike-gamma coupling during odor and odorless cycles (n=858 neurons). (D) Z-scored firing rate at the gamma peak in response to different odors for a representative mouse. Columns show the firing rates of each principal cell. The bottom panel shows a zoom-in view of the differential spiking activity across odors. (E) Odor specificity index and normalized gamma amplitude following inhalation start (mean ± SEM, n=15 recording sessions from nine mice exposed to six different odorants at 0.3% v./v. concentration; gamma traces were rescaled to fit the plot).
Figure 6 with 1 supplement
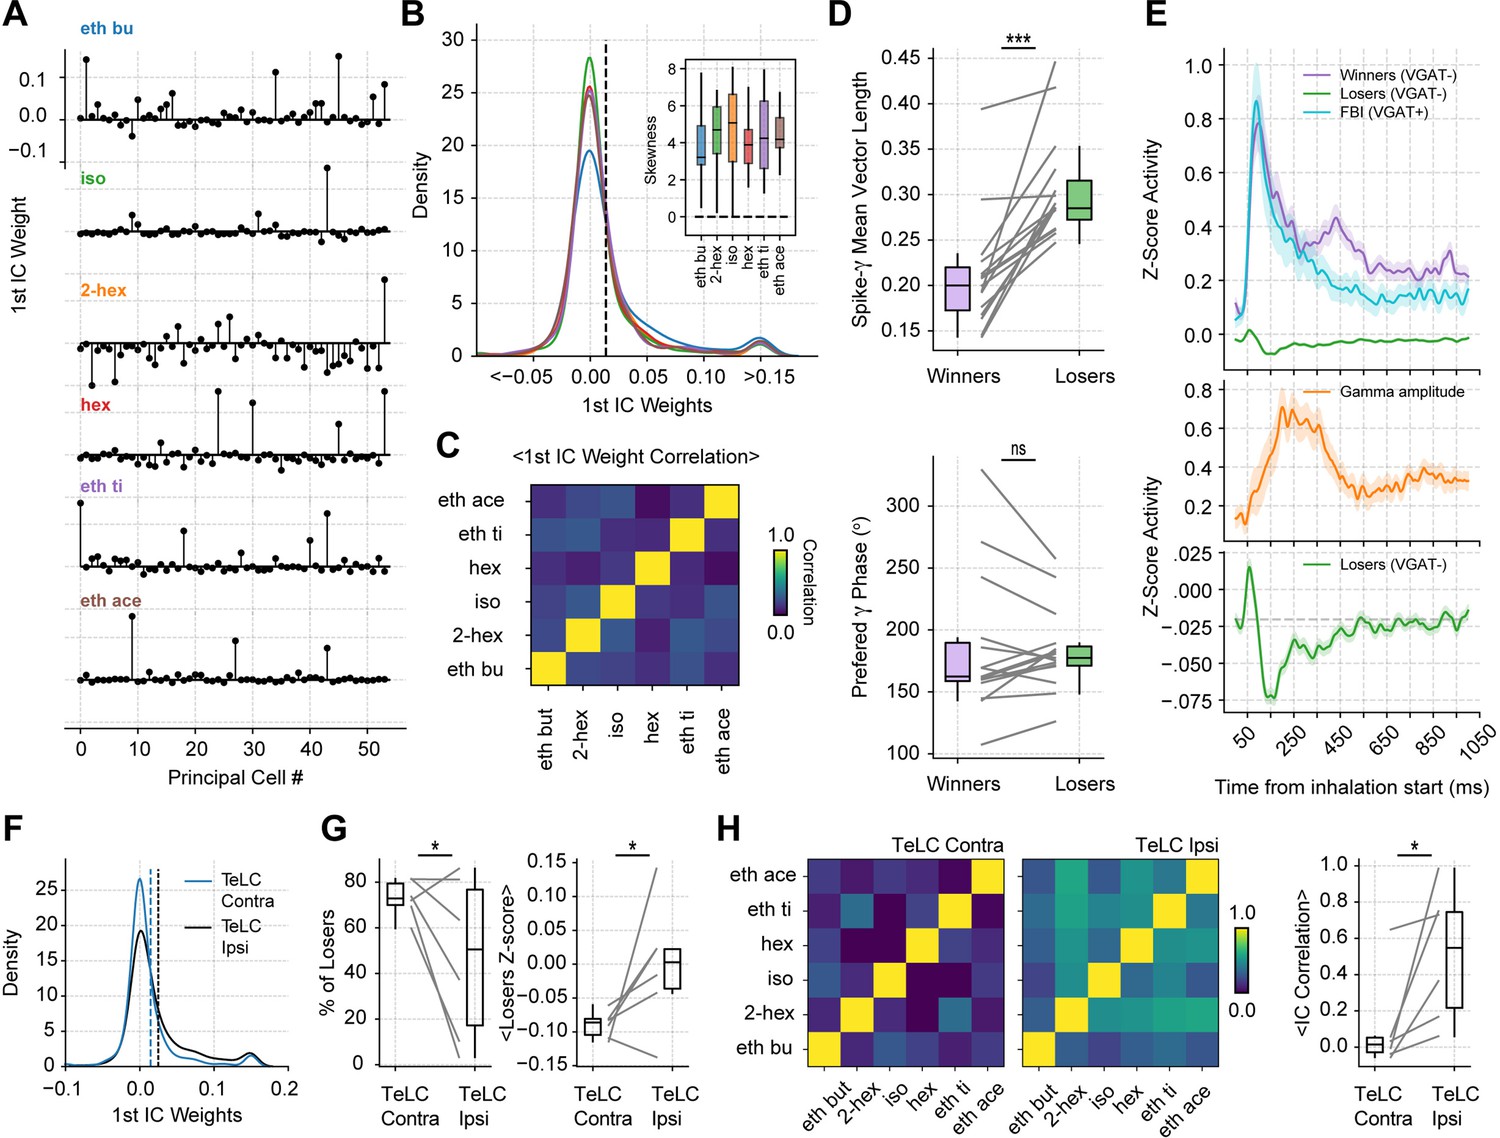
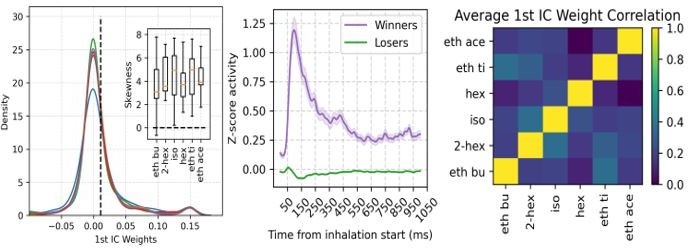
Gamma inhibition determines sparse odor-assembly representations through a winner-take-all computation.
(A) Assembly weights for the 1st independent component (1st IC) in a representative mouse during the presentation of odorants. Notice different assembly compositions for the different odors. (B) Distribution of assembly weights for the 1st IC of each odor (all principal cell weights across sessions pooled together). Inset: Boxplots showing the distribution skewness for each animal and odorant. (C) Correlation among 1st IC weights. No pairwise odorant combination was significantly above chance (corrected for multiple comparisons). (D) Boxplots showing the mean-vector length of the spiking gamma phase for winning and losing neurons (top) and their preferred gamma phase (bottom). (E) Average z-scored spiking activity for winners, losers, feedback inhibitory neurons (top), and average z-scored gamma amplitude envelope (middle). The bottom panel shows a y-axis zoom-in view of the spiking time course of the loser neurons. n=259 winner-odor pairs, 3875 loser-odor pairs, and 40 FBI; 15 recording sessions from nine mice. (F) Distribution of assembly weights for the 1st IC in TeLC experiments. Each line shows the distribution average across odorants. (G) Percentage of losers in the infected (TeLC ipsi) and contralateral hemisphere (TeLC contra). Thresholds for defining losers were the same as employed in control recordings. (H) Correlation among 1st IC weights in TeLC experiments.
Figure 6—figure supplement 1
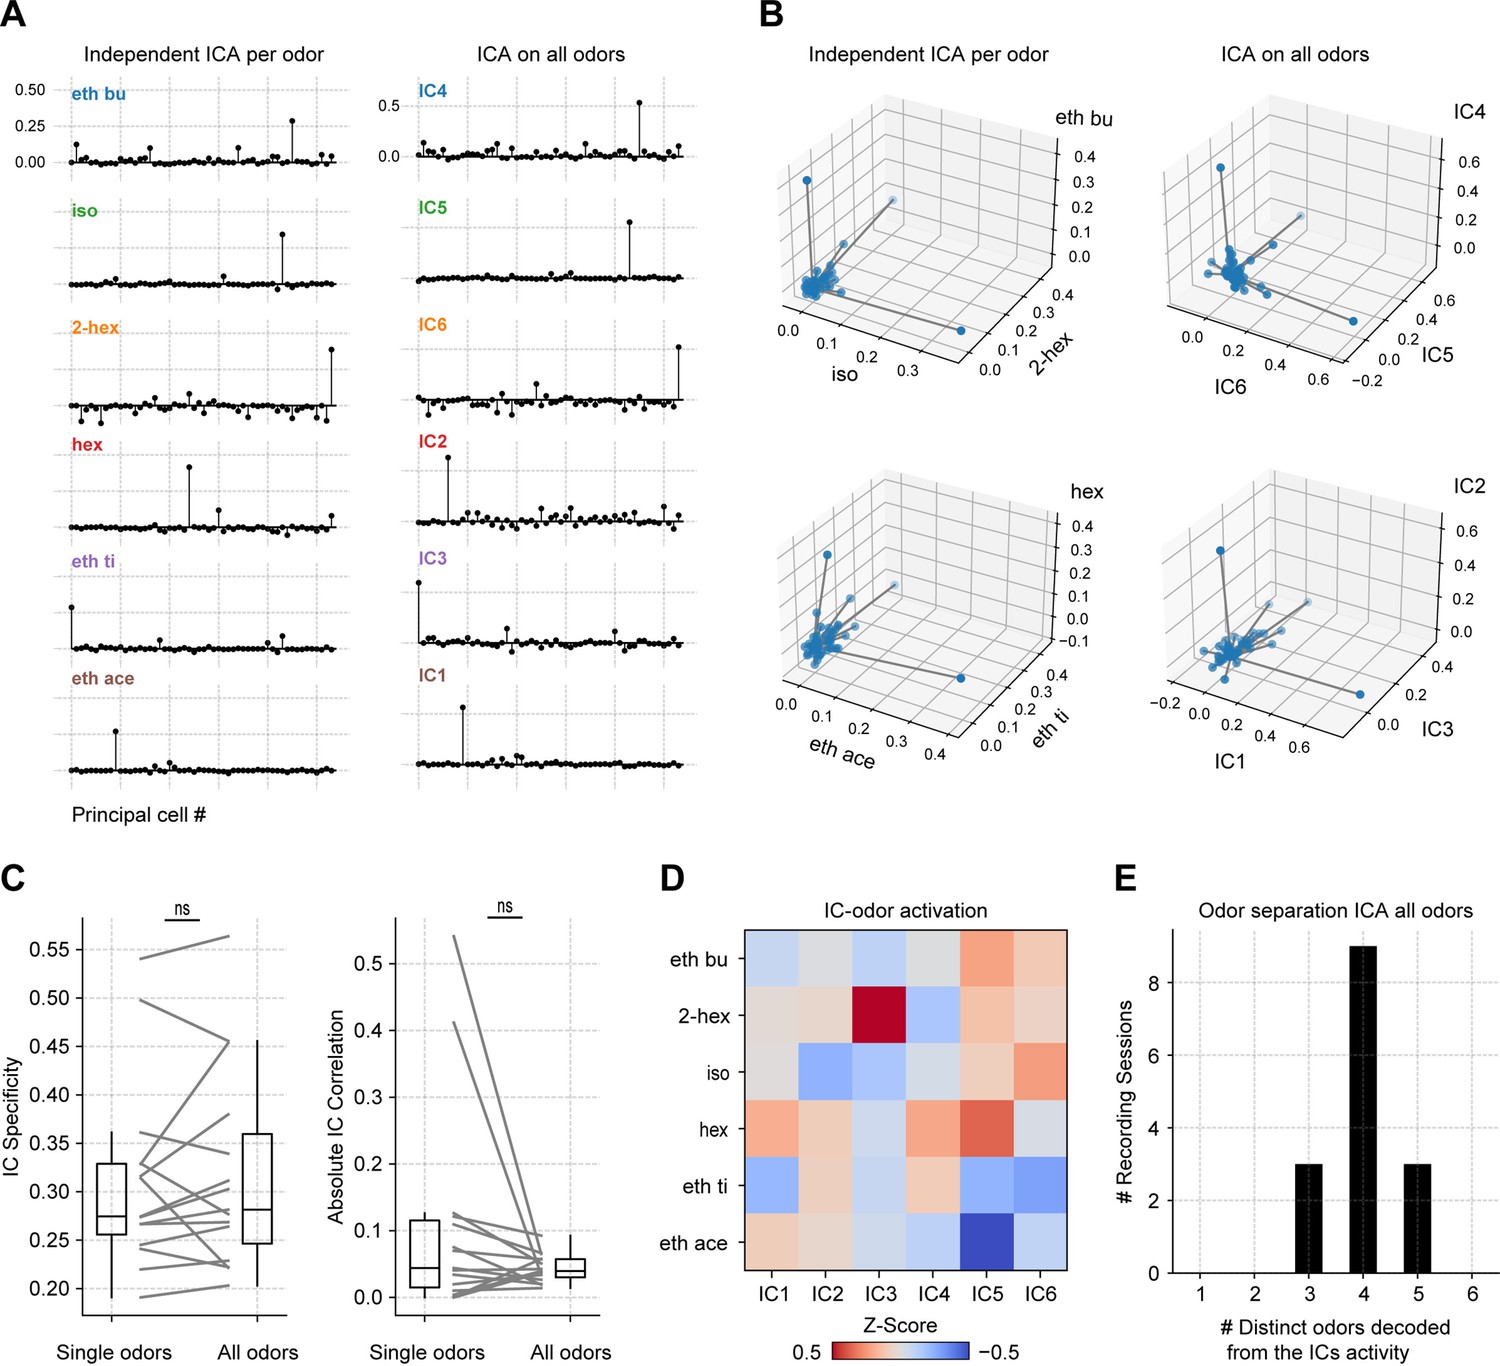
ICA performed on all odors simultaneously.
(A) Assembly weights in a representative mouse for the first independent component (IC) computed for all six odorants independently (left) and for the first six ICs computed for all six odorants together (right). (B) Neuronal weights in the subspace spanned by the first IC for three odors computed separately (top) and by the first three ICs computed from the pool of odor data (bottom). Notice high orthogonality across odors for each case. (C) Left: average IC specificity of the first IC for each odor computed independently (Single odors) and between the first six IC weights when ICA is computed for all odors together (All odors). The IC specificity was computed as the specificity index but employing the absolute IC weights instead of the firing rates. Right: correlation between IC weights comparing single vs. all odors. (D) Average IC z-score activity for each odor obtained when ICA is computed for all odors together. (E) Number of distinct odors encoded by each IC (all odors analysis), as defined by the largest average IC projection. Histogram shows session counts.
Figure 7 with 1 supplement
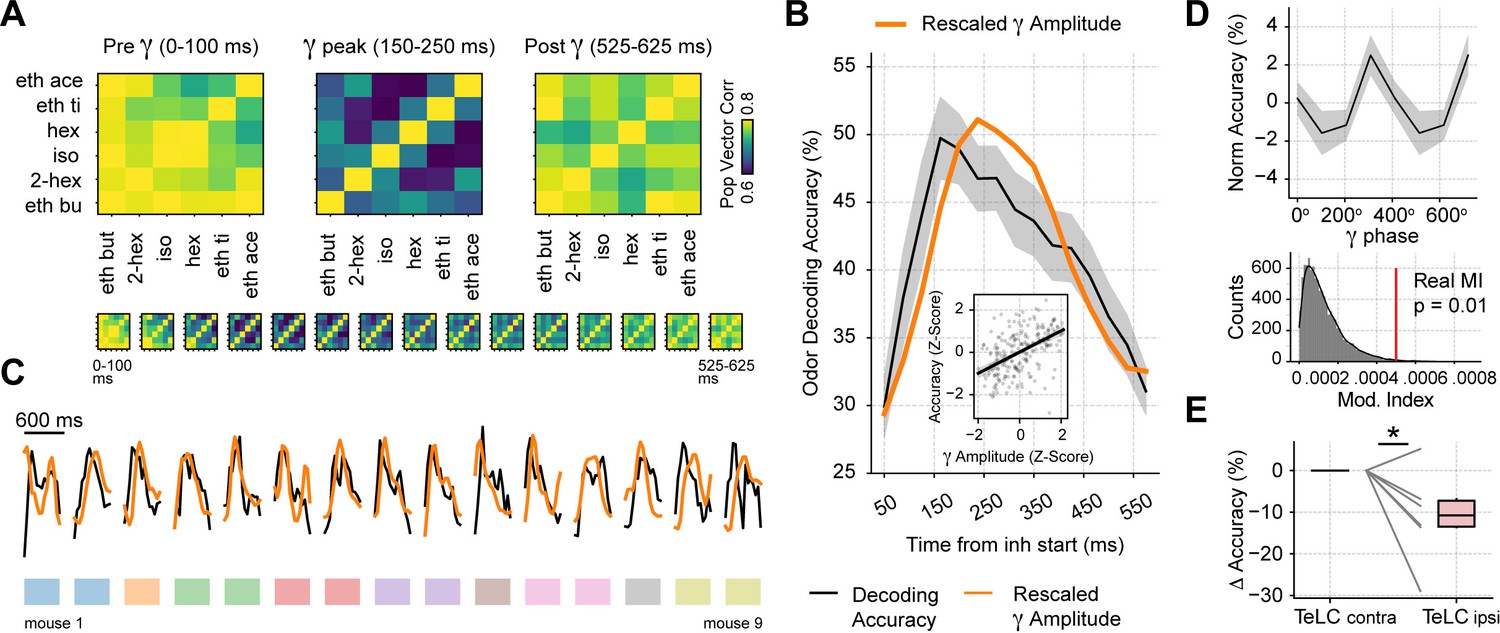
Gamma oscillations provide a privileged window for odor decoding.
(A) Population vector correlations between odor responses during 100 ms time windows before, during and after the gamma peak (the bottom panel shows results for overlapping time windows). Only principal cells were employed for this analysis. (B) Odor decoding accuracy following inhalation start employing 100 ms time bins (mean ± SEM, n=15 recording sessions from nine mice). The mean accuracy across mice is shown by the black line; for comparison, the orange line shows the average gamma amplitude (arbitrary scale). The inset plot shows the correlation between gamma amplitude and odor decoding accuracy. (C) Odor decoding accuracy (black) and gamma amplitude (orange) time courses for each mouse. The colored rectangles underneath the traces show mouse identity. (D) Top: normalized odor decoding accuracy as a function of the gamma phase (mean ± SEM; n=15 recording sessions from nine mice). For each session, the normalization was obtained by subtracting the mean accuracy. Bottom: modulation index of the average decoding accuracy within the gamma cycle (Real MI) compared to a surrogate distribution (Surr MI, obtained by circularly shifting the gamma phases within each session by a random amount; n=10,000 surrogate MI values). (E) Odor decoding accuracy during the 150–250 times window following inhalation start in TeLC experiments (n=5 recording sessions from five mice). Boxplots show the decoding difference (delta) to the contralateral hemisphere.
Figure 7—figure supplement 1
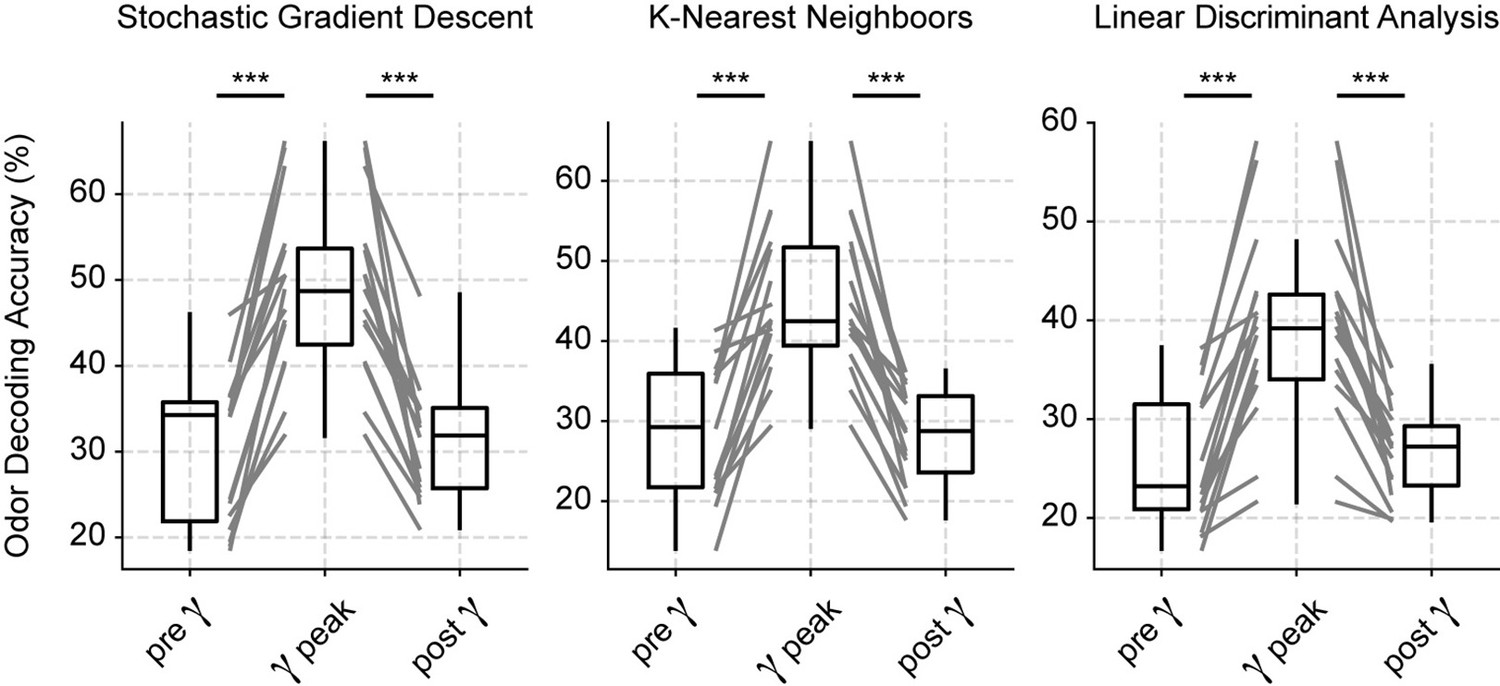
Odor decoding increases during the low-gamma peak.
Boxplots showing odor decoding accuracy based on spiking activity measured using 100 ms windows before (0–100 ms), during (150–250 ms), and after (525–625 ms) the respiration-driven gamma peak (see Materials and methods). Each panel shows results from a different classification model.
Author response image 1
Author response image 2
Additional files
Download links
A two-part list of links to download the article, or parts of the article, in various formats.
Downloads (link to download the article as PDF)
Open citations (links to open the citations from this article in various online reference manager services)
Cite this article (links to download the citations from this article in formats compatible with various reference manager tools)
Mechanisms and functions of respiration-driven gamma oscillations in the primary olfactory cortex
eLife 12:e83044.
https://doi.org/10.7554/eLife.83044


