Cell-intrinsic ceramides determine T cell function during melanoma progression
- Institute of Medical Microbiology, University Hospital Essen, University Duisburg-Essen, Germany
- Institute of Molecular Biology, University Hospital Essen, University Duisburg-Essen, Germany
- Institute of Pharmacy, Freie Universität Berlin, Germany
- Institute of Physiology, University Hospital Essen, University Duisburg-Essen, Germany
- Memorial Sloan Kettering Cancer Center, United States
Figures
Figure 1 with 1 supplement
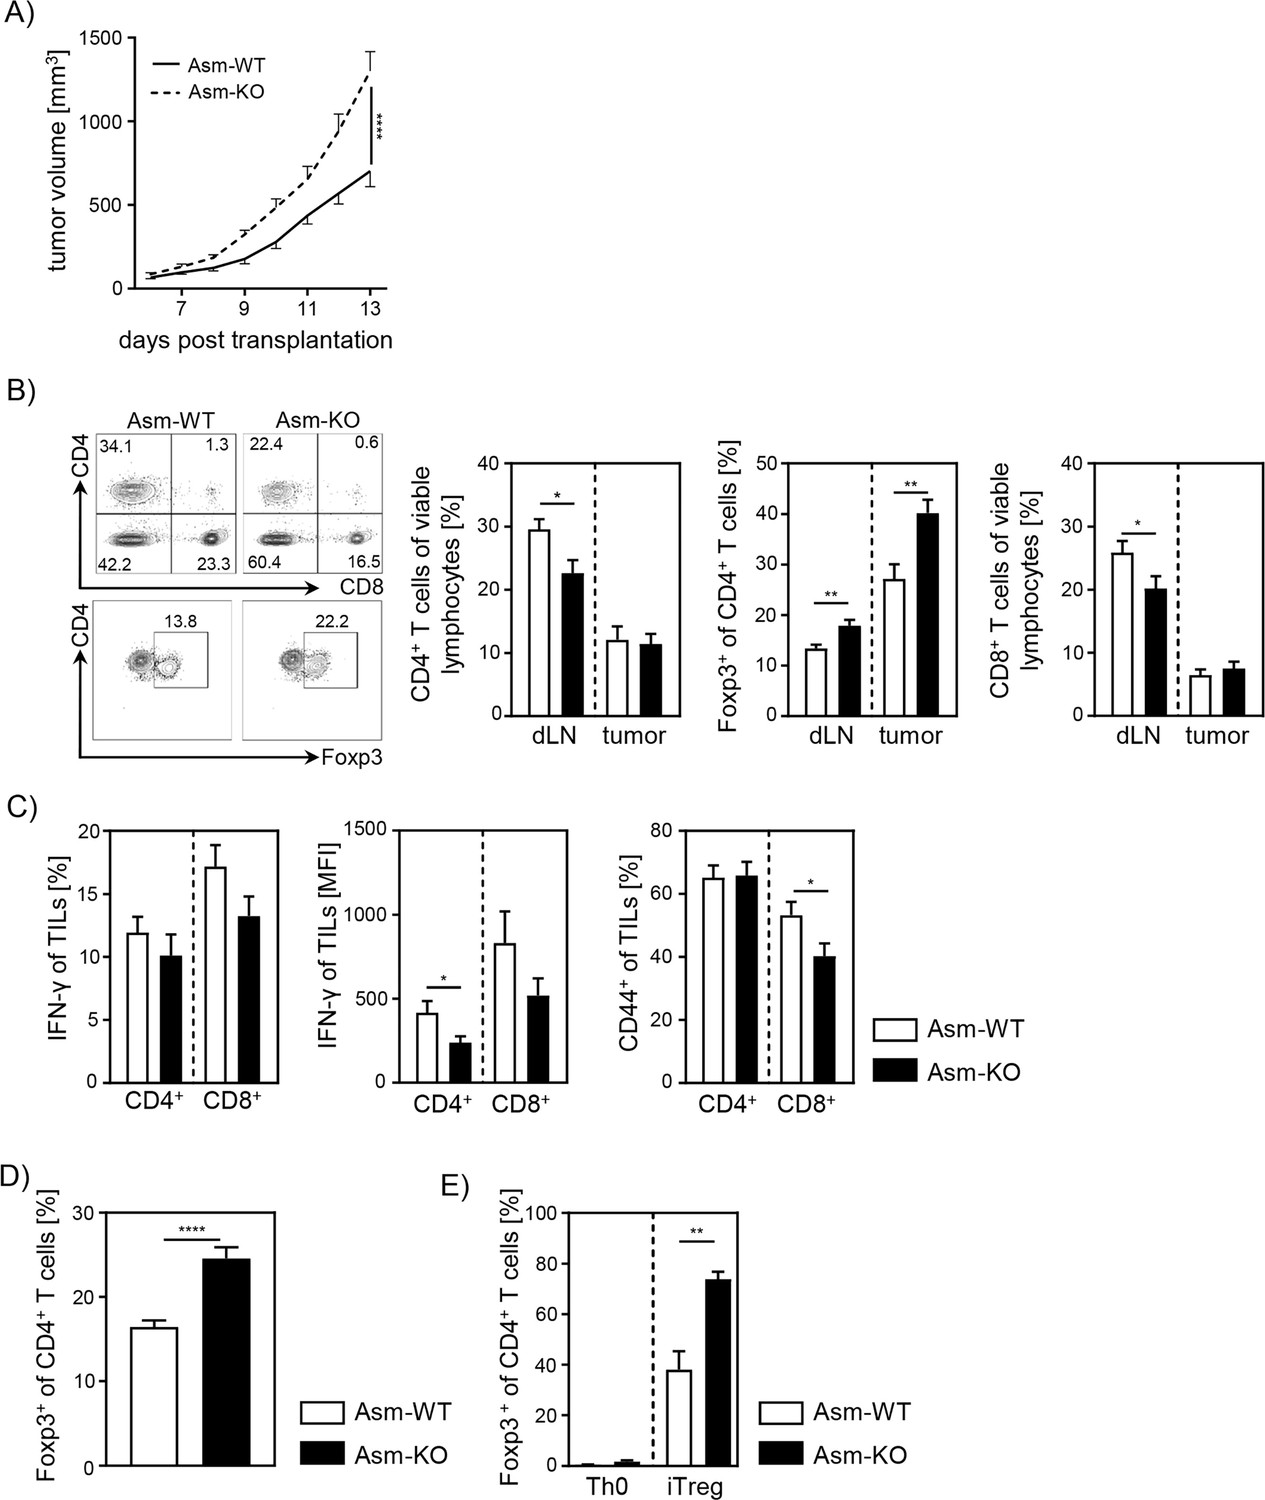
Ablation of acid sphingomyelinase (Asm) results in decreased T cell activation and enhanced tumor growth.
(A) B16-F1 melanoma cells were transplanted into Smpd1-deficient mice (Asm-KO) mice and control littermates (Asm-WT). Tumor volume was monitored daily once tumors were palpable (n=12–18). (B) Frequencies of CD4+ T cells, CD4+Foxp3+ Tregs, and CD8+ T cells within draining lymph nodes (dLN) and tumor of Asm-KO and Asm-WT mice were determined by flow cytometry. Representative contour plots (dLN) are shown in the left panel. (C) IFN-γ, and CD44 expression of CD4+ and CD8+ tumor-infiltrating lymphocytes (TILs) in tumor-bearing mice. (D) Percentages of Foxp3+ Tregs of CD4+ T cells within spleen of naive Asm-KO and Asm-WT mice were determined by flow cytometry (n=16–17). (E) Sorted CD4+CD25− T cells from Asm-KO and Asm-WT mice were stimulated with anti-CD3 and anti-CD28 in the presence of IL-2 and TGF-β1 (iTreg). Respective controls (Th0) were only stimulated with anti-CD3 and anti-CD28 antibodies. After 3 days, Treg differentiation was analyzed by Foxp3 expression (n=3–4). Results from 2 to 4 independent experiments are depicted as mean ± SEM. Statistical analysis was performed by two-way ANOVA with Sidak’s multiple comparisons or Student’s t-test. (*p<0.05, **p<0.01, ****p<0.0001).
-
Figure 1—source data 1
Ablation of Asm results in decreased T cell activation and enhanced tumor growth.
- https://cdn.elifesciences.org/articles/83073/elife-83073-fig1-data1-v1.zip
Figure 1—figure supplement 1
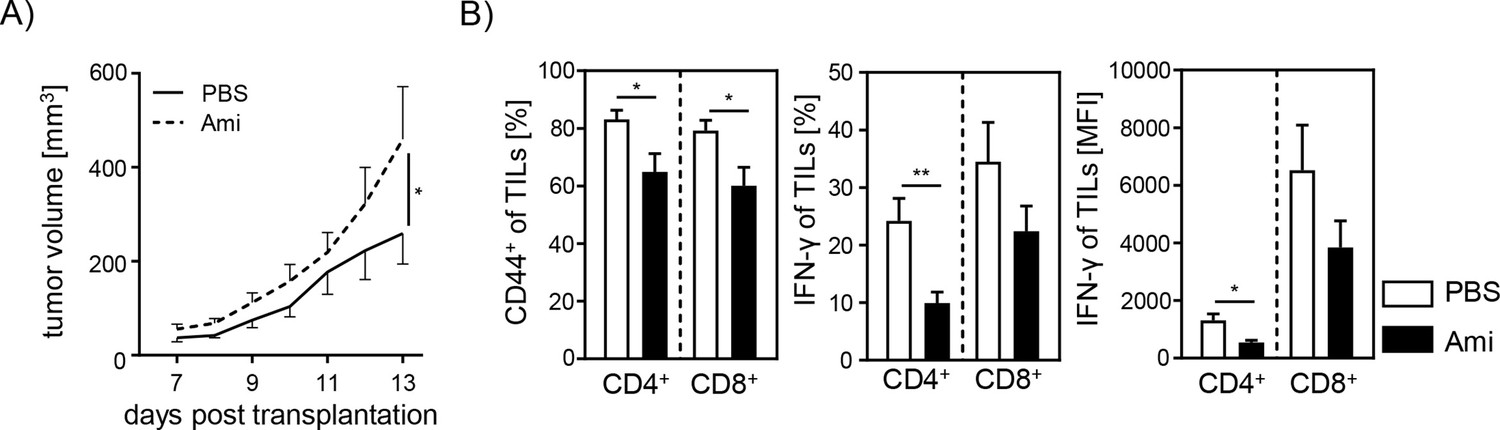
Tumor growth and T cell response in amitriptyline-treated mice.
(A) B16-F1 melanoma cells were injected into amitriptyline-treated mice, and tumor growth was monitored once tumors have been established (n=8–9). (B) CD44 and IFN-γ expression of tumor-infiltrating lymphocytes (TILs) were analyzed by flow cytometry. Results from two independent experiments are depicted as mean ± SEM. Statistical analysis was performed by two-way ANOVA with Sidak’s multiple comparisons or Student’s t-test. (*p<0.05, **p<0.01, ****p<0.0001).
Figure 2
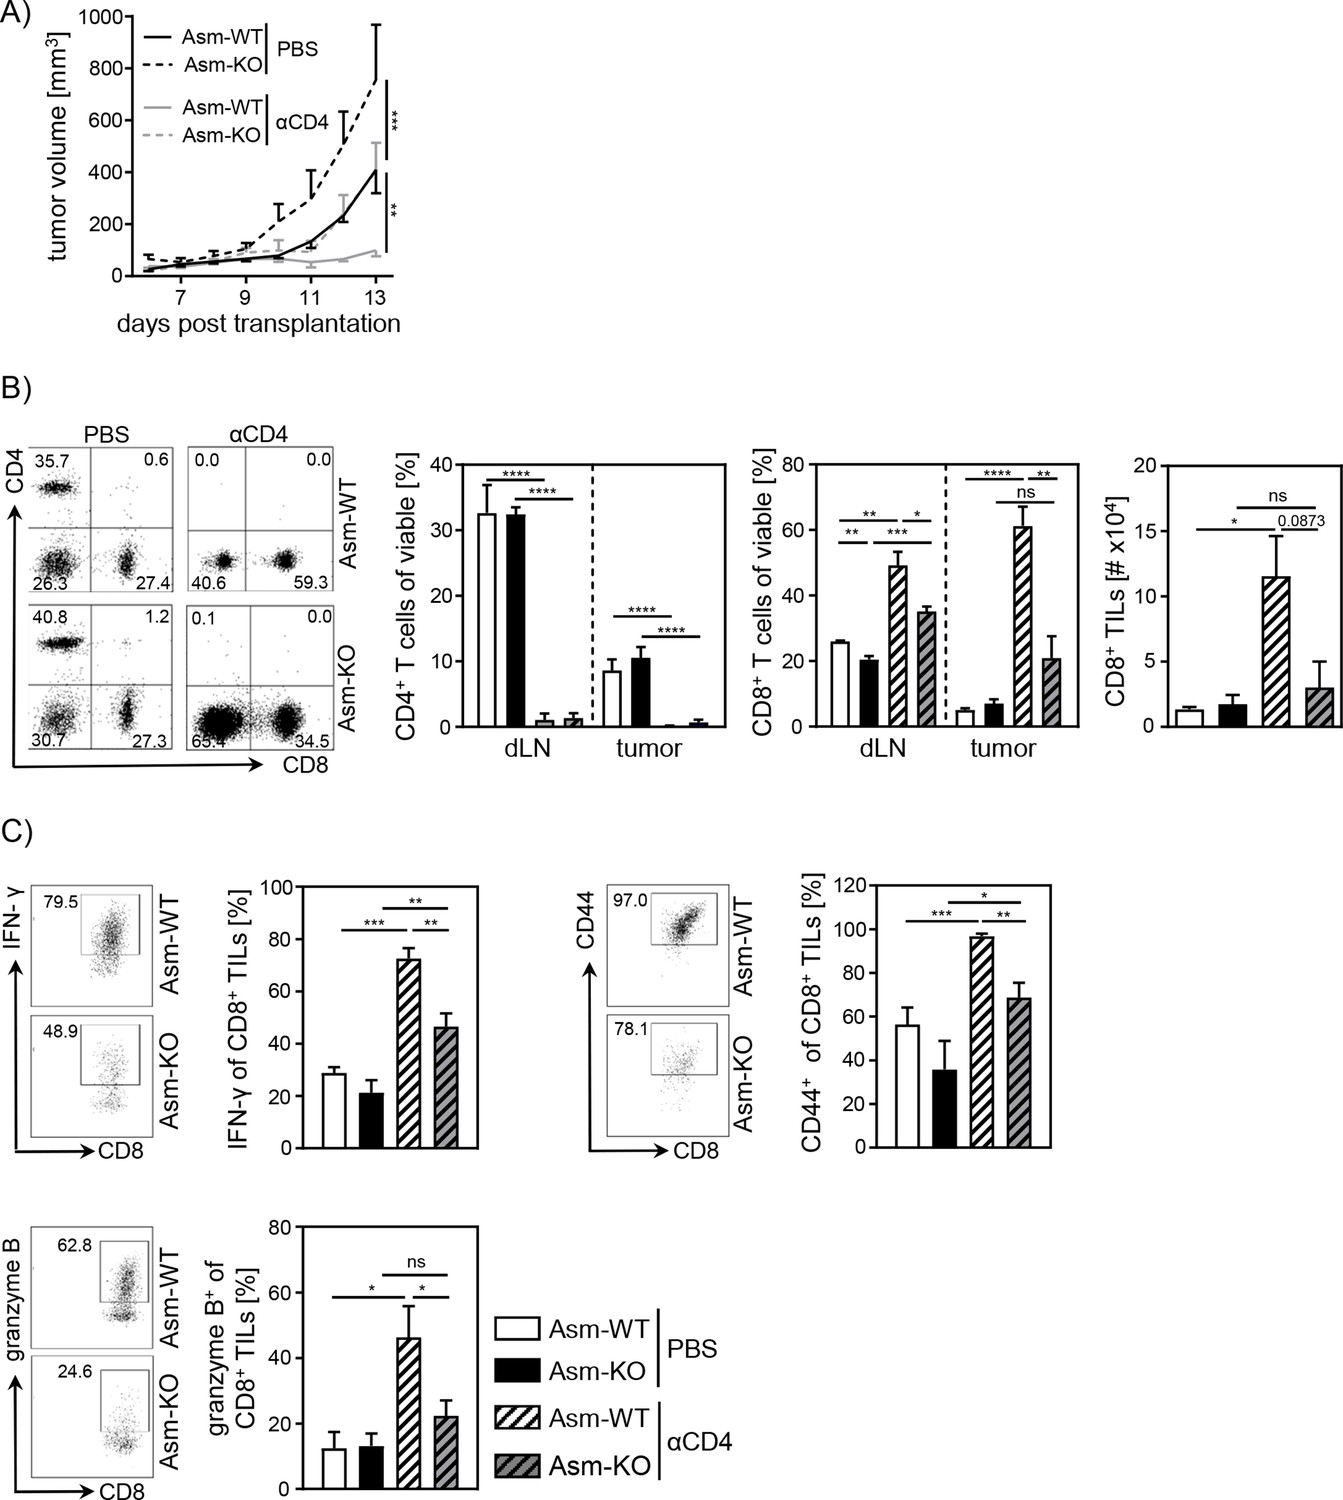
Impaired CD8+ T cell function in acid sphingomyelinase (Asm)-deficient tumor-bearing mice upon CD4+ T cell depletion.
CD4+ T cells were depleted from Asm-WT and Asm-KO mice by repeated i.p. injection of anti-CD4 depleting antibody. Control groups received PBS. B16-F1 tumor cells were transplanted 1 day later subcutaneously. (A) Tumor volume was determined after tumor establishment based on caliper measurements (n=3–7). (B) Frequencies of CD4+ and CD8+ T cells in dLN and tumor and (C) expression of IFN-γ, CD44, and granzyme B of CD8+ tumor-infiltrating lymphocytes (TILs) were analyzed using flow cytometry. Representative dot plots are shown in the left panel. Results from two independent experiments are depicted as mean ± SEM. Statistical analysis was performed by two-way ANOVA with Sidak’s multiple comparisons or Student’s t-test. (*p<0.05, **p<0.01, ***p<0.001, ****p<0.0001).
-
Figure 2—source data 1
Impaired CD8+ T cell function in Asm-deficient tumor-bearing mice upon CD4+ T cell depletion.
- https://cdn.elifesciences.org/articles/83073/elife-83073-fig2-data1-v1.xlsx
Figure 3 with 1 supplement
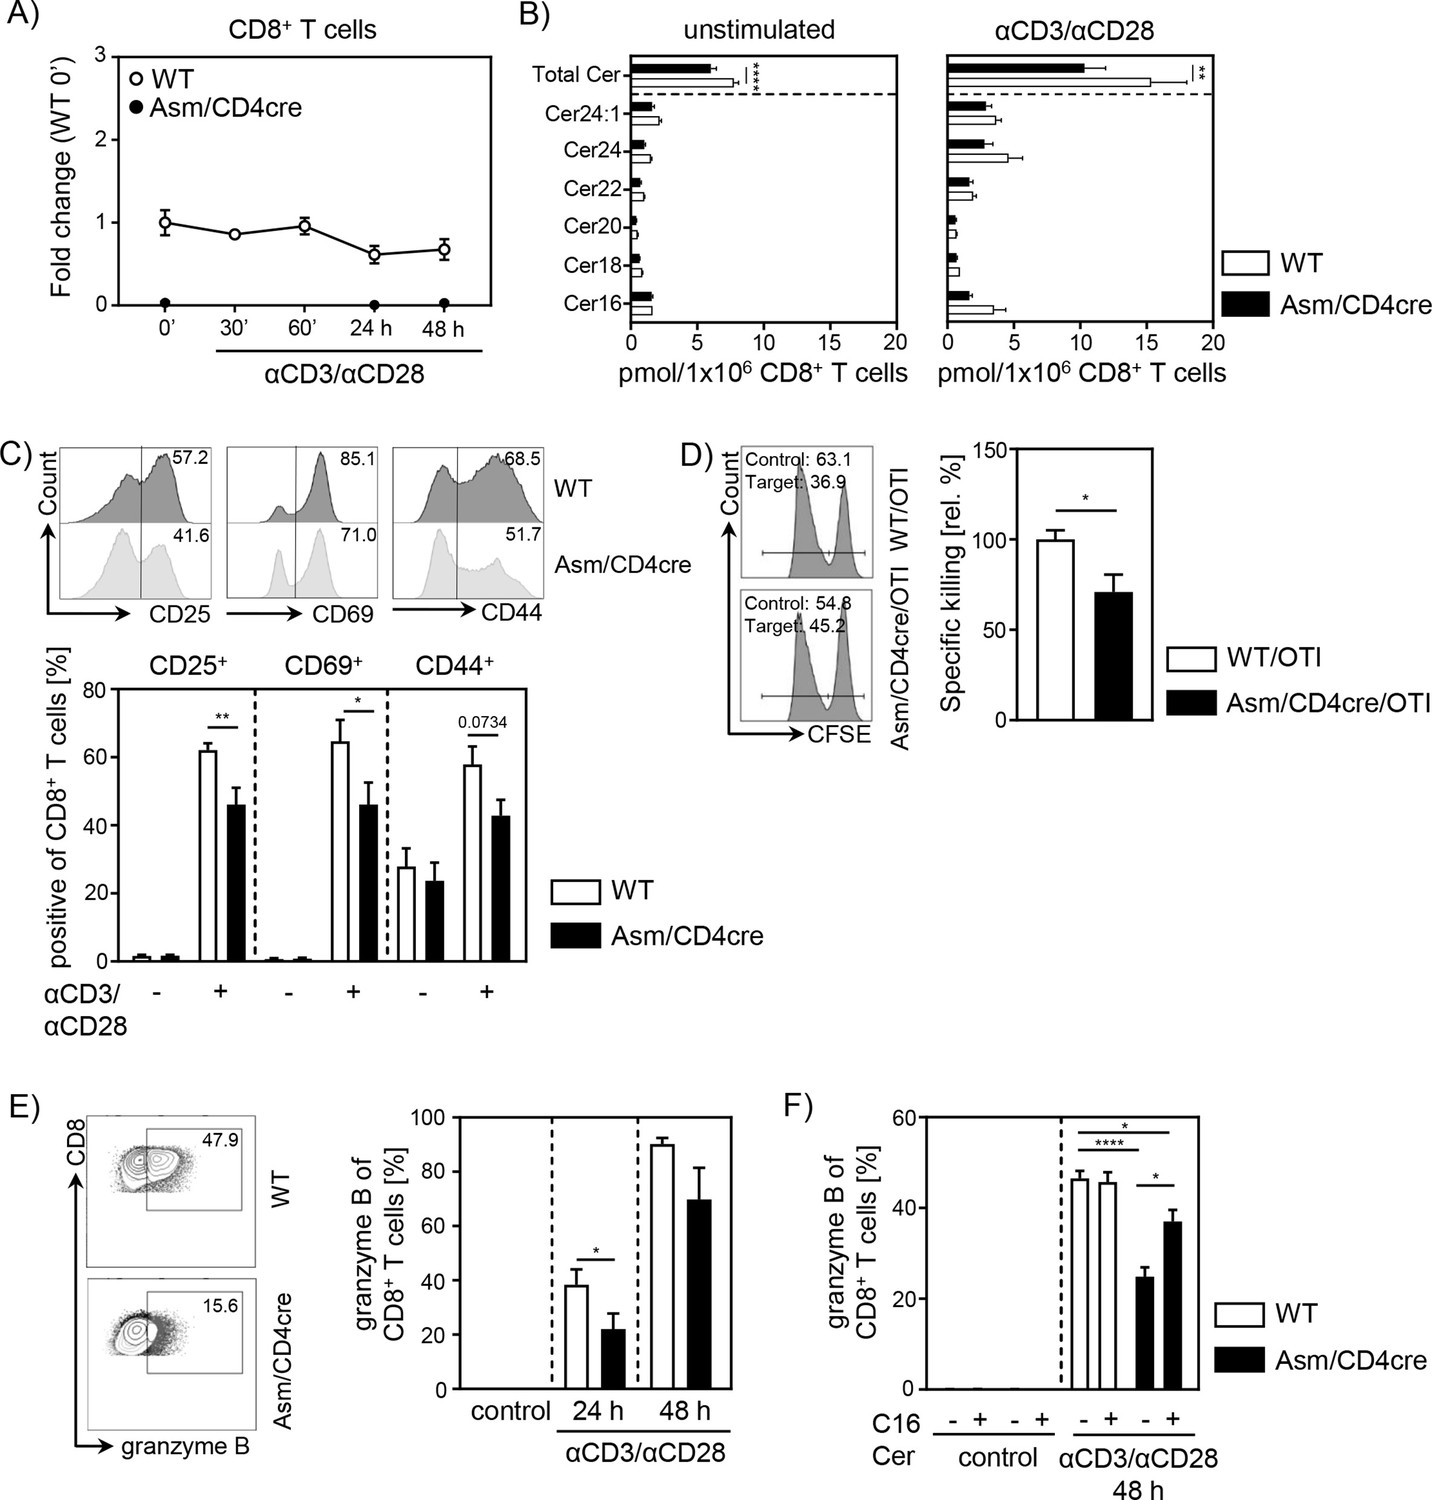
T cell-specific acid sphingomyelinase (Asm) deficiency leads to reduced CD8+ T cell activation in vitro.
Isolated CD8+ T cells from Smpd1fl/fl/Cd4cre/+ mice (Asm/CD4cre) and Smpd1fl/fl/Cd4+/+ littermates (wildtype [WT]) where either left unstimulated or stimulated with anti-CD3 and anti-CD28 for indicated time points. (A) mRNA expression of Asm (Smpd1) following activation was analyzed by RT-qPCR (n=4–8). (B) Ceramide levels of CD8+ T cells were determined by mass spectrometry (n=4). (C) Expression of CD25, CD69, and CD44 was analyzed by flow cytometry (n=6–7). Representative histograms are shown in the upper panel. (D) OVA-specific cytotoxic lymphocytes were generated and incubated with OVA-peptide 257–264 loaded CFSEhigh-labeled target and unloaded CFSElow-labeled control cells. Specific killing was evaluated by frequencies of target and control populations determined by flow cytometry (n=6–7). Representative histograms are shown in the left panel. (E) Frequencies of granzyme B-expressing CD8+ T cells from Asm/CD4cre mice and WT littermates without and (F) in the presence of C16 ceramide were analyzed by flow cytometry (n=4–8). Representative contour plots are shown in the left panel. Results from two to four independent experiments are depicted as mean ± SEM. Statistical analysis was performed by two-way ANOVA with Sidak’s multiple comparisons, Mann-Whitney U-test, or Student’s t-test. (*p<0.05, **p<0.01, ****p<0.0001).
-
Figure 3—source data 1
T cell-specific Asm deficiency leads to reduced CD8+ T cell activation in vitro.
- https://cdn.elifesciences.org/articles/83073/elife-83073-fig3-data1-v1.zip
Figure 3—figure supplement 1
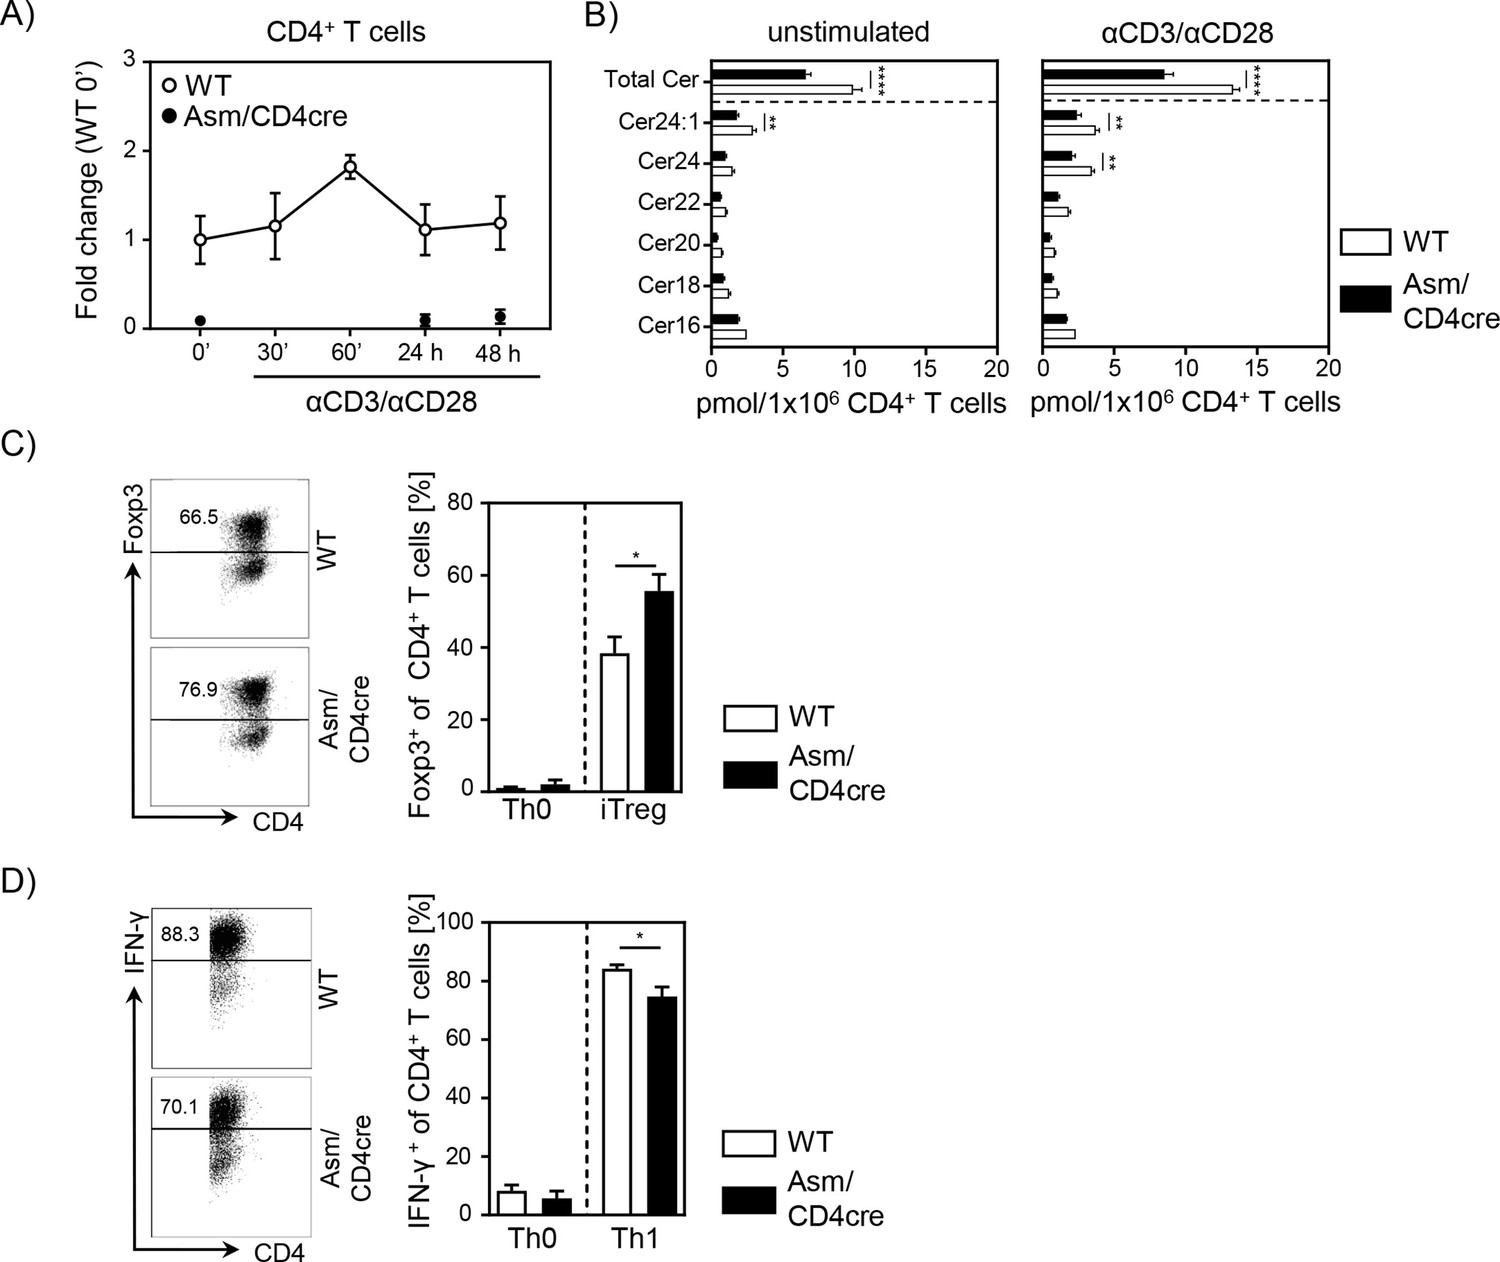
In vitro characterization of acid sphingomyelinase (Asm)-deficient CD4+ T cells.
(A) Isolated CD4+ T cells from Asm/CD4cre mice and wildtype (WT) littermates were either left unstimulated or stimulated with anti-CD3 and anti-CD28 antibodies for indicated time points. mRNA expression of Asm (Smpd1) was analyzed by RT-qPCR (n=6–8). (B) Ceramide levels of unstimulated or anti-CD3/anti-CD28 stimulated (24 hr) CD4+ T cells from Asm/CD4cre mice and WT littermates were determined by mass spectrometry (n=4). (C) Sorted CD4+CD25− T cells from Asm/CD4cre and WT mice were stimulated with anti-CD3 and anti-CD28 antibodies in the presence of IL-2 and TGF-β1 (iTreg). Respective controls (Th0) were only stimulated with anti-CD3 and anti-CD28 antibodies. After 3 days, Treg differentiation was analyzed by Foxp3 expression (n=6–7). Representative dot plots are depicted in the left panel. (D) In order to differentiate naïve CD4+CD25− T cells into Th1 cells, isolated cells were cultured in the presence of anti-CD3, anti-CD28, anti-IL-4, and IL-12 (Th1), or only stimulated with anti-CD3 and anti-CD28 (Th0). After 6 days, Th1 differentiation was assessed by IFN-γ expression (n=5–6). Representative dot plots are shown in the left panel. Results from two to three independent experiments are depicted as mean ± SEM. Statistical analysis was performed by two-way ANOVA with Sidak’s multiple comparisons or Student’s t-test. (*p<0.05, **p<0.01, ****p<0.0001).
Figure 4

Cell-intrinsic acid sphingomyelinase (Asm) activity determines CD8+ T cell activation in vivo.
(A) B16-F1 melanoma cells were transplanted into Asm/CD4cre mice and wildtype (WT) littermates, and tumor growth was monitored when tumors reached a detectable size (n=12–16). (B) Percentages of CD4+ T cells, Foxp3+ Tregs, and CD8+ T cells within dLN and tumor were determined by flow cytometry, and absolute cell numbers were calculated. Representative dot plots are shown in the upper panel. (C) Expression of IFN-γ, TNF-α, and granzyme B of tumor-infiltrating lymphocytes (TILs) was determined by flow cytometry. Results from four independent experiments are depicted as mean ± SEM. Statistical analysis was performed by two-way ANOVA with Sidak’s multiple comparisons, Mann-Whitney U-test, or Student’s t-test. (*p<0.05, **p<0.01, ***p<0.001).
-
Figure 4—source data 1
Cell-intrinsic Asm activity determines CD8+ T cell activation in vivo.
- https://cdn.elifesciences.org/articles/83073/elife-83073-fig4-data1-v1.xlsx
Figure 5

Ceramide co-localizes with CD3 and T cell receptor (TCR).
CD8+ T cells were isolated and stimulated with CD3/CD28 MACSiBead particles for 2 hr and stained for ceramide (red) and (A) CD3 or (B) TCR beta (green). Cells were visualized using a Biorevo BZ-9000 fluorescence microscope.
Figure 6 with 1 supplement
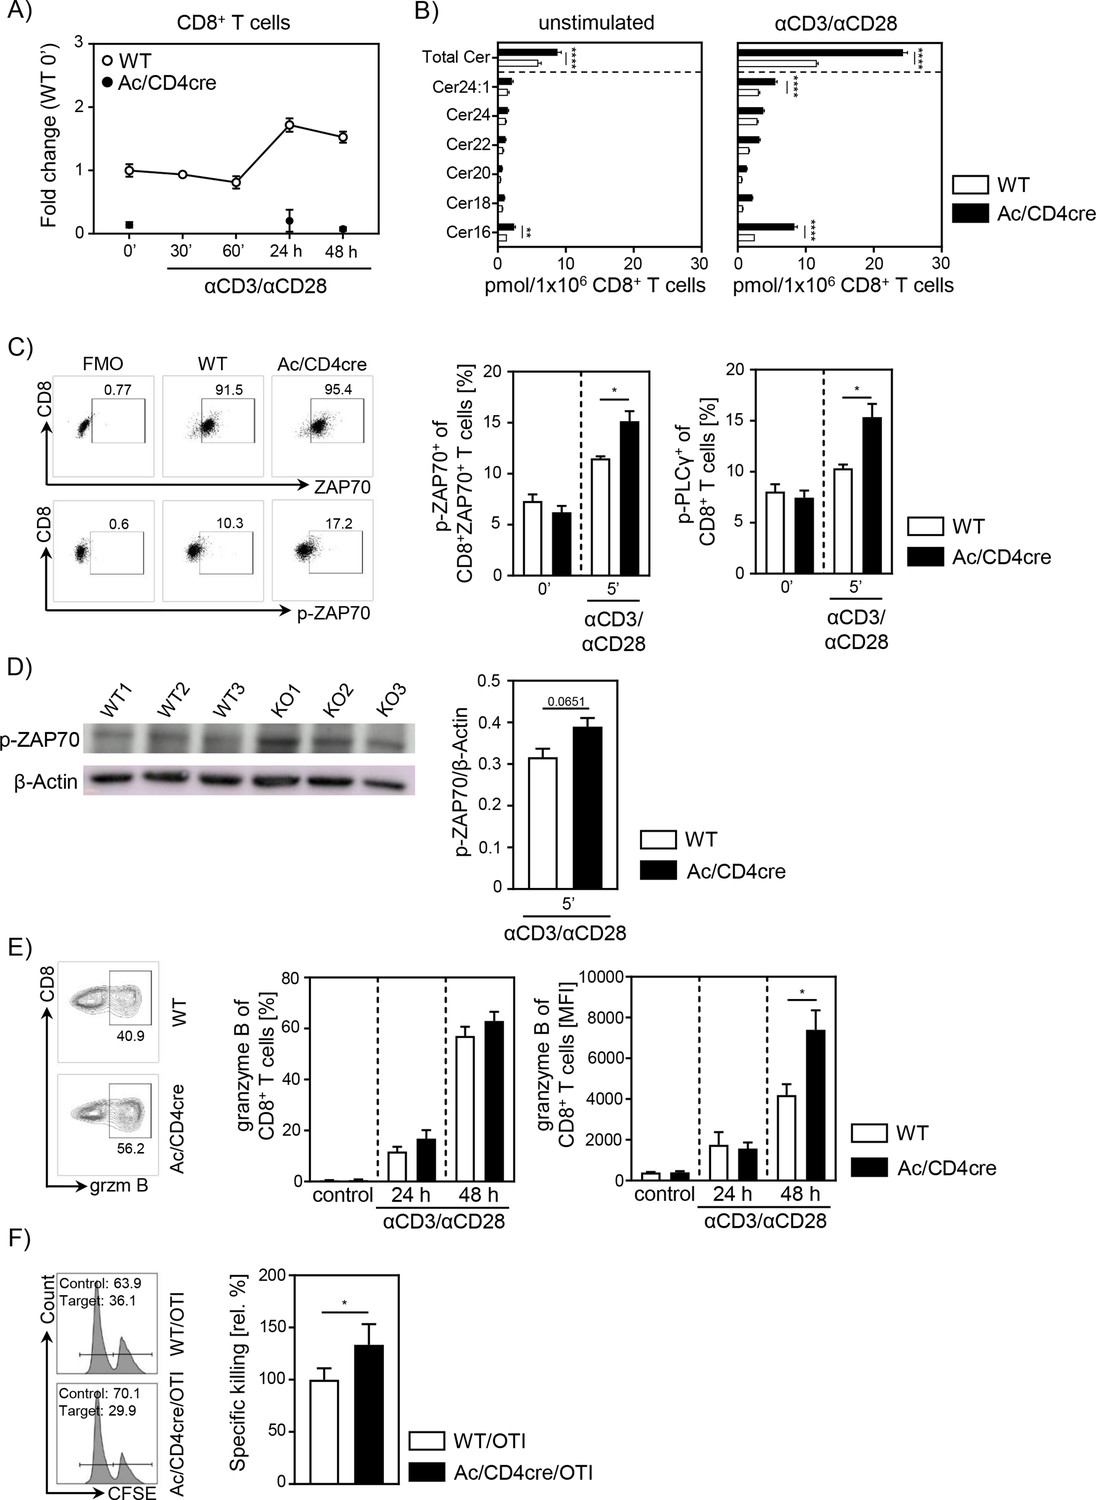
Acid ceramidase (Ac)-deficient CD8+ T cells have elevated ceramide levels and show increased activation in vitro.
(A) Isolated CD8+ T cells from Asah1fl/fl/Cd4cre/+ mice (Ac/CD4cre) and Asah1fl/fl/Cd4+/+ littermates (wildtype [WT]) where either left unstimulated or stimulated with anti-CD3 and anti-CD28 for indicated time points. mRNA expression of Ac (Asah1) following activation was analyzed by RT-qPCR (n=3–4). (B) Ceramide levels of CD8+ T cells were determined by mass spectrometry (n=4). (C) For T cell receptor signaling analysis, splenocytes from Ac/CD4cre and WT mice were left unstimulated (0’) or stimulated with anti-CD3 and anti-CD28 for 5 (5’) min. Afterward, samples were analyzed for phospho-ZAP70 of gated ZAP70+CD8+ T cells and phospho-PLCγ of gated CD8+ T cells by flow cytometry (n=4). Representative dot plots and fluorescence minus one (FMOs) for phospho-ZAP70 are shown in the left panel. (D) Western blot analysis of phospho-ZAP70 expression of CD8+ T cells from Ac/CD4cre and WT mice after 5 min of stimulation with anti-CD3 and anti-CD28 (n=3). (E) CD8+ T cells were left untreated as control or stimulated for 24 or 48 hr and analyzed for granzyme B expression by flow cytometry (n=5–8). Representative contour plots are shown in the left panel. (F) Specific killing of antigen-specific cytotoxic lymphocytes from Ac/CD4cre/OTI mice and WT controls was assessed (n=8–9). Representative histograms are shown in the left panel. Data are depicted as mean ± SEM. Statistical analysis was performed by two-way ANOVA with Sidak’s multiple comparisons, Mann-Whitney U-test, or Student’s t-test. (*p<0.05, **p<0.01, ****p<0.0001).
-
Figure 6—source data 1
Ac-deficient CD8+ T cells have elevated ceramide levels and show increased activation in vitro.
- https://cdn.elifesciences.org/articles/83073/elife-83073-fig6-data1-v1.zip
Figure 6—figure supplement 1
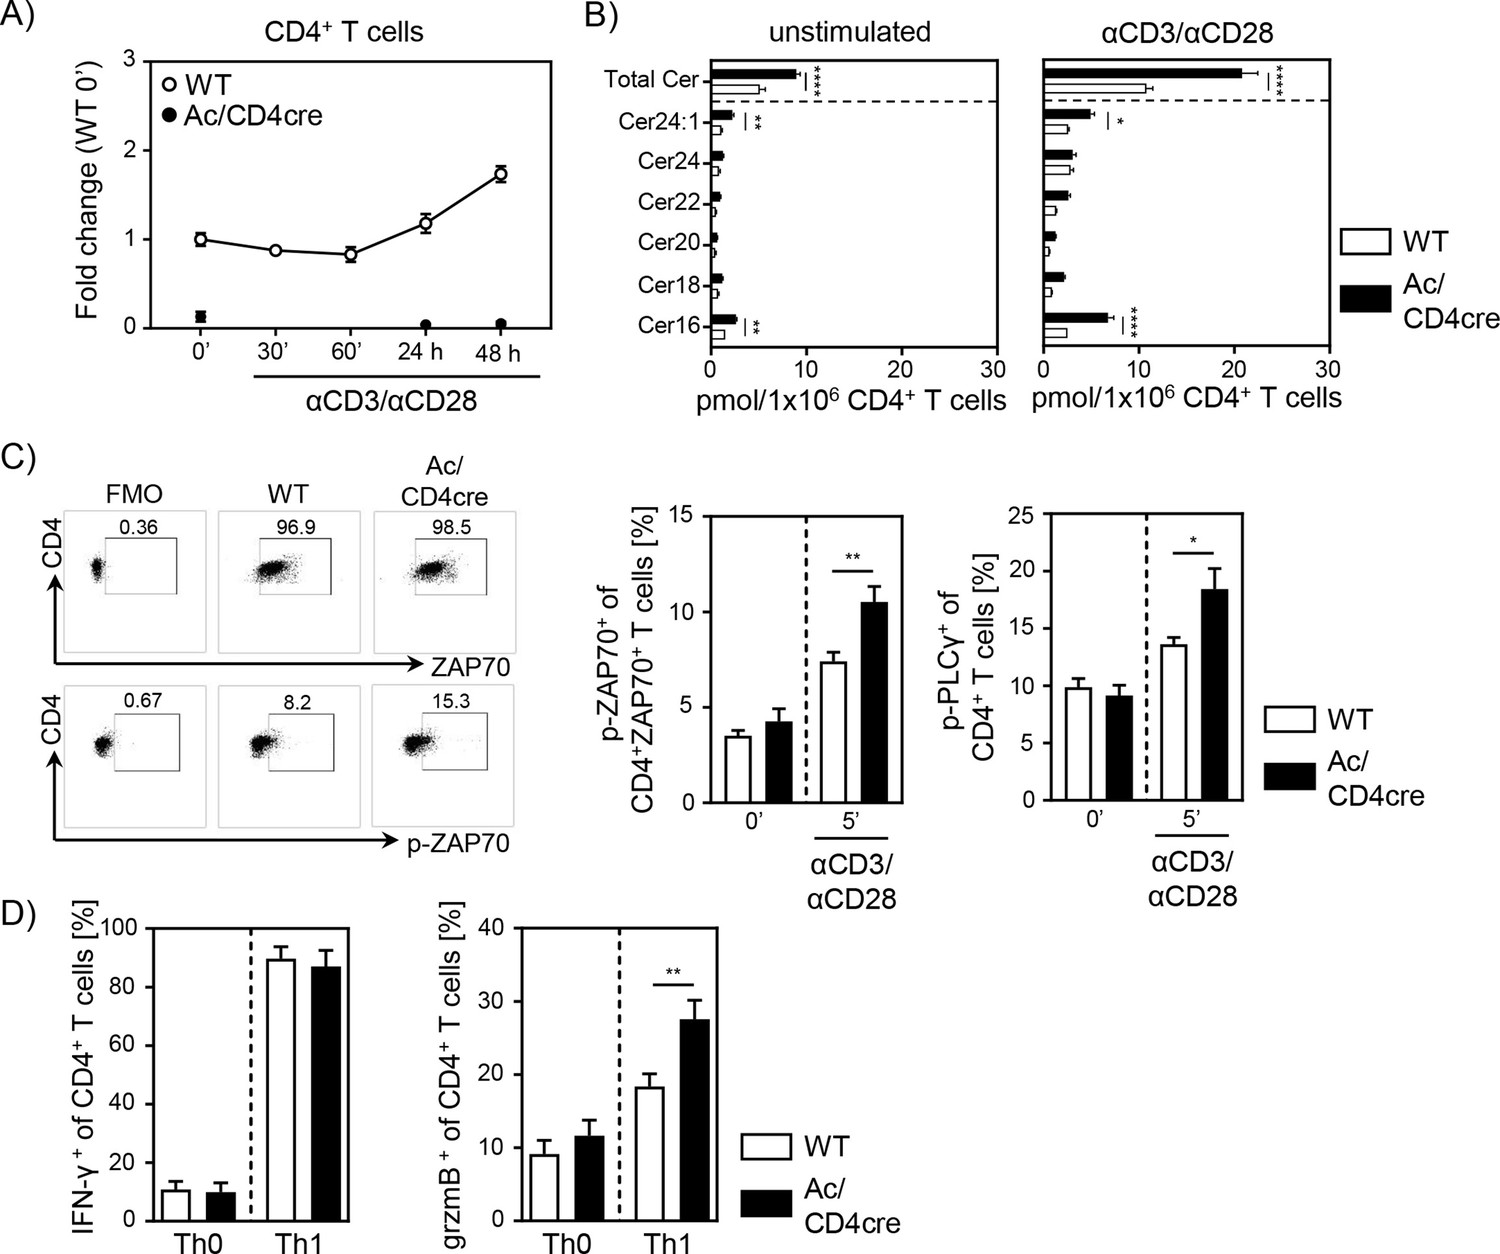
In vitro characterization of acid ceramidase (Ac)-deficient CD4+ T cells.
(A) Isolated CD4+ T cells from Ac/CD4cre and wildtype (WT) mice were either left unstimulated or stimulated with anti-CD3 and anti-CD28 antibodies for indicated time points. mRNA expression of Ac (Asah1) was analyzed by RT-qPCR (n=3–4). (B) Ceramide levels of unstimulated and anti-CD3/anti-CD28 stimulated (24 hr) CD4+ T cells from Ac/CD4cre and WT mice were determined by mass spectrometry (n=4). (C) For T cell receptor signaling analysis, splenocytes from Ac/CD4cre and WT mice were left unstimulated (0‘) or stimulated with anti-CD3 and anti-CD28 antibodies for 5 (5’) min. Afterward, samples were analyzed for phospho-ZAP70 of gated ZAP70+CD4+ T cells and phospho-PLCγ of gated CD4+ T cells by flow cytometry (n=4–7). Representative dot plots and FMOs are shown in the left panel. (D) In order to differentiate naïve CD4+CD25− T cells from Acflox/flox/CD4cre and WT mice into Th1 cells, isolated cells were cultured in the presence of anti-CD3, anti-CD28, anti-IL-4, and IL-12 (Th1), or only stimulated with anti-CD3 and anti-CD28 antibodies (Th0). After 6 days, cells were analyzed for IFN-γ and granzyme B expression by flow cytometry (n=9). Results from two to three independent experiments are depicted as mean ± SEM. Statistical analysis was performed by two-way ANOVA with Sidak’s multiple comparisons or Student’s t-test. (*p<0.05, **p<0.01, ****p<0.0001).
Figure 7
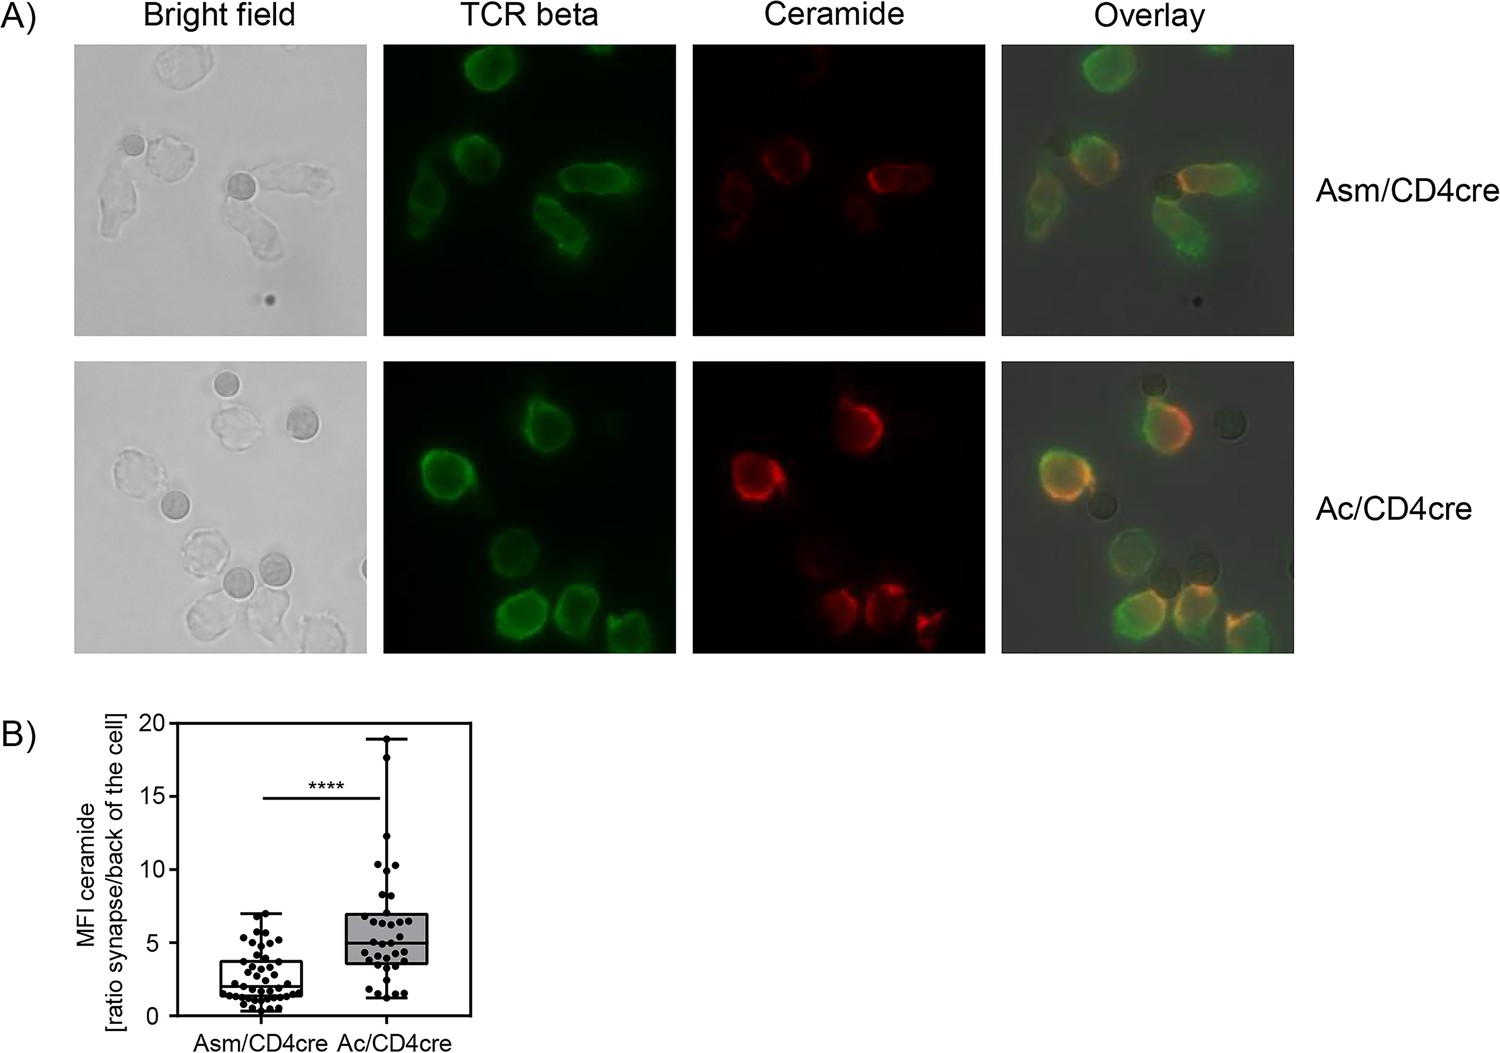
Synaptic ceramide is elevated in acid ceramidase (Ac)-deficient T cells compared to acid sphingomyelinase (Asm)-deficient T cells.
(A) CD8+ T cells were isolated from Asm/CD4cre or Ac/CD4cre mice and stimulated with CD3/CD28 MACSiBead particles for 2 hr and stained for ceramide (red) and T cell receptor beta (green). Cells were visualized using a Biorevo BZ-9000 fluorescence microscope. (B) The ceramide signal was quantified in the synapse and in the back of cell, and the ratio of the signals was calculated (n=35–45). Data are depicted as boxplot with min/max whiskers. Statistical analysis was performed by Student’s t-test. (****p<0.0001).
-
Figure 7—source data 1
Synaptic ceramide is elevated in Ac-deficient T cells compared to Asm-deficient T cells.
- https://cdn.elifesciences.org/articles/83073/elife-83073-fig7-data1-v1.xlsx
Figure 8
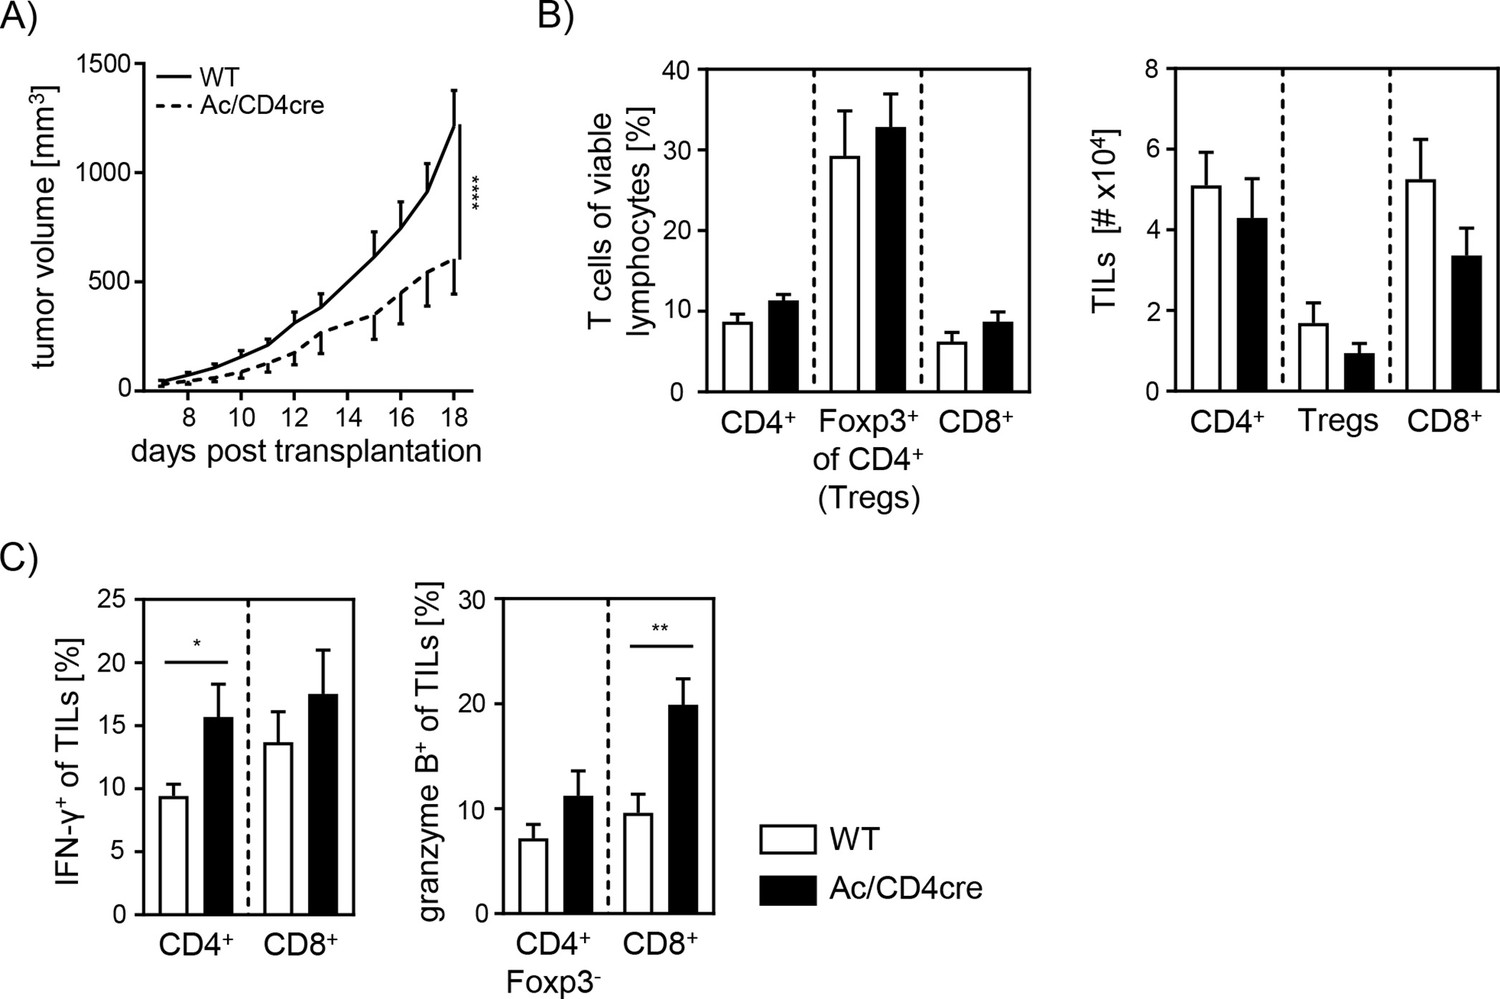
Elevated anti-tumor immune response in T cell-specific acid ceramidase (Ac)-deficient mice.
(A) B16-F1 melanoma cells were transplanted into Ac/CD4cre mice and wildtype (WT) littermates. Tumor volume was monitored once tumors have been established (n=8–10). (B) Percentages of CD4+ T cells, Foxp3+ Tregs, and CD8+ T cells were determined by flow cytometry, and absolute cell numbers were calculated. (C) Frequencies of IFN-γ+ and granzyme B+ tumor-infiltrating lymphocytes (TILs) were determined by flow cytometry. Results from two independent experiments are depicted as mean ± SEM. Statistical analysis was performed by two-way ANOVA with Sidak’s multiple comparisons or Student’s t-test. (*p<0.05, **p<0.01, ****p<0.0001).
-
Figure 8—source data 1
Figure 8 Elevated anti-tumor immune response in T cell-specific Ac-deficient mice.
- https://cdn.elifesciences.org/articles/83073/elife-83073-fig8-data1-v1.xlsx
Additional files
Download links
A two-part list of links to download the article, or parts of the article, in various formats.
Downloads (link to download the article as PDF)
Open citations (links to open the citations from this article in various online reference manager services)
Cite this article (links to download the citations from this article in formats compatible with various reference manager tools)
Cell-intrinsic ceramides determine T cell function during melanoma progression
eLife 11:e83073.
https://doi.org/10.7554/eLife.83073


