Resolving the origins of secretory products and anthelmintic responses in a human parasitic nematode at single-cell resolution
- Department of Pathobiological Sciences, University of Wisconsin-Madison, United States
- Pathology and Laboratory Medicine, School of Medicine and Public Health, University of Wisconsin-Madison, United States
Figures
Figure 1 with 1 supplement
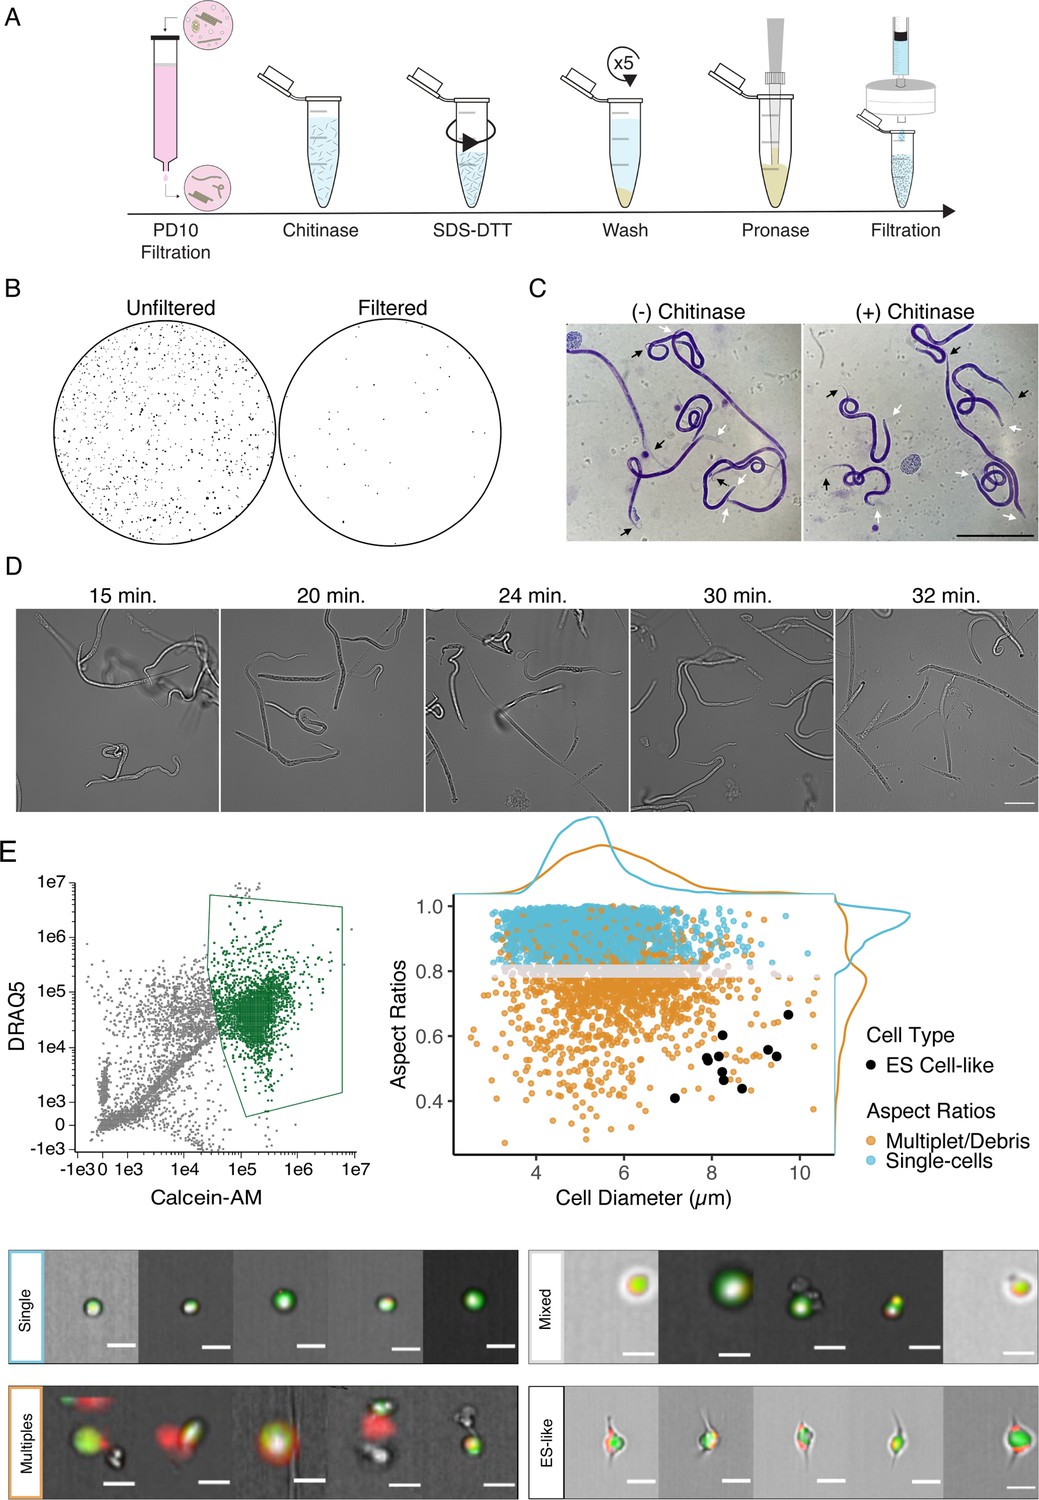
Optimization of single-cell dissociation in B. malayi microfilariae.
(A) Schematic of dissociation protocol using 1 million B. malayi microfilariae as input. (B) Images of 96-well plate wells containing pre- and post- PD-10 filtration of microfilariae-containing peritoneal lavage. Unfiltered solutions (left) contain a plethora of host cell and tissue contamination and parasite embryos. Filtered solutions (right) minimize host contamination carryover prior to cell dissociation and downstream applications. (C) Representative Giemsa stained microfilariae pre-chitinase (left) and post-chitinase (right) treatment. Chitinase disrupts sheath integrity visible in the head (white arrows) and tail spaces (black arrows). Scale bar = 100 µm. (D) Cell dissociation timelapse during pronase digestion and mechanical disruption. Scale bar = 50 µm. (E) High-content imaging flow cytometry of single-cell suspensions. Left: gating scheme to identify objects based on nucleation (DRAQ5+ stain) and high viability (Calcein-AM+ stain). Objects colored in green indicate highly viable, nucleated objects carried forward in the downstream analysis. Right: single-cell objects were segregated by IDEAS software and objects with aspect ratios ≥ 0.8 for brightfield and DRAQ5 channels were counted as single-cells (blue). A mixed population (gray) included objects belonging to doublets/multiples/debris (orange). All captured images were scanned by eye for cells with excretory-secretory (ES)-like morphology (black) and included as single cells. Bottom: representative images of cells belonging to the identified single-cell (blue), mixed (gray), ES-like (black), and multiplet/debris (orange) populations. Scale bars = 10 µm.
-
Figure 1—source data 1
Comparison of cell counting methods by hemocytometer, flow cytometry, and automated cell counting instrument.
Determining the total cell count in the suspension was difficult due to remnants of debris and small and variable sized cells within the suspension. The recommended tabletop automated cell counting system Countess II (Thermo Fisher, Waltham, MA) was unreliable in confirming total and viable cell counts, likely due to cell sizes below the lower threshold of the instrument and because the cells are in multiple focal planes within the chip. Fluorescent-activated cell sorting (FACS) was also used to estimate cell count and attempt enrichment of viable cells prior to loading the 10x Genomics. The majority of cells did not survive the FACS process and could not be recovered for input into the 10x Genomics Chromium controller. Estimating cell concentration was most reliable using a hemocytometer. Bpa, Brugia pahangi; Bma, Brugia malayi; mf, microfilariae.
- https://cdn.elifesciences.org/articles/83100/elife-83100-fig1-data1-v2.docx
Figure 1—figure supplement 1
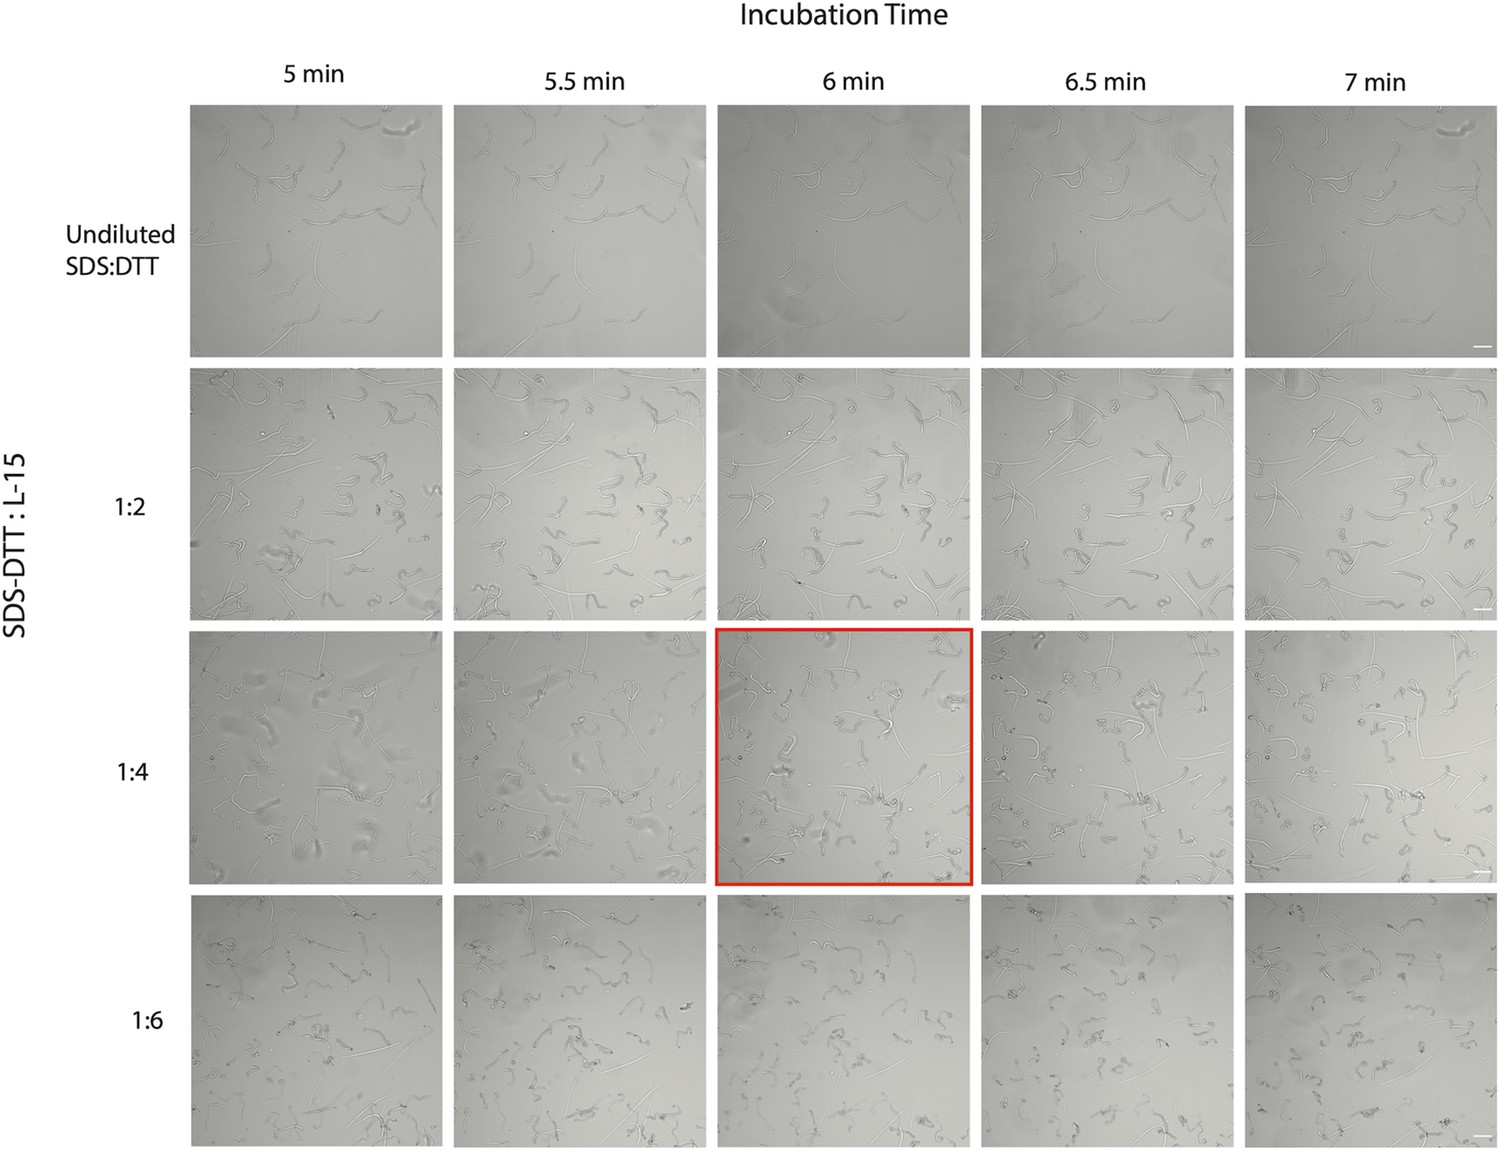
Optimization of SDS-DTT incubation by time and concentration.
Scale bar = 50 µm.
Figure 2 with 6 supplements
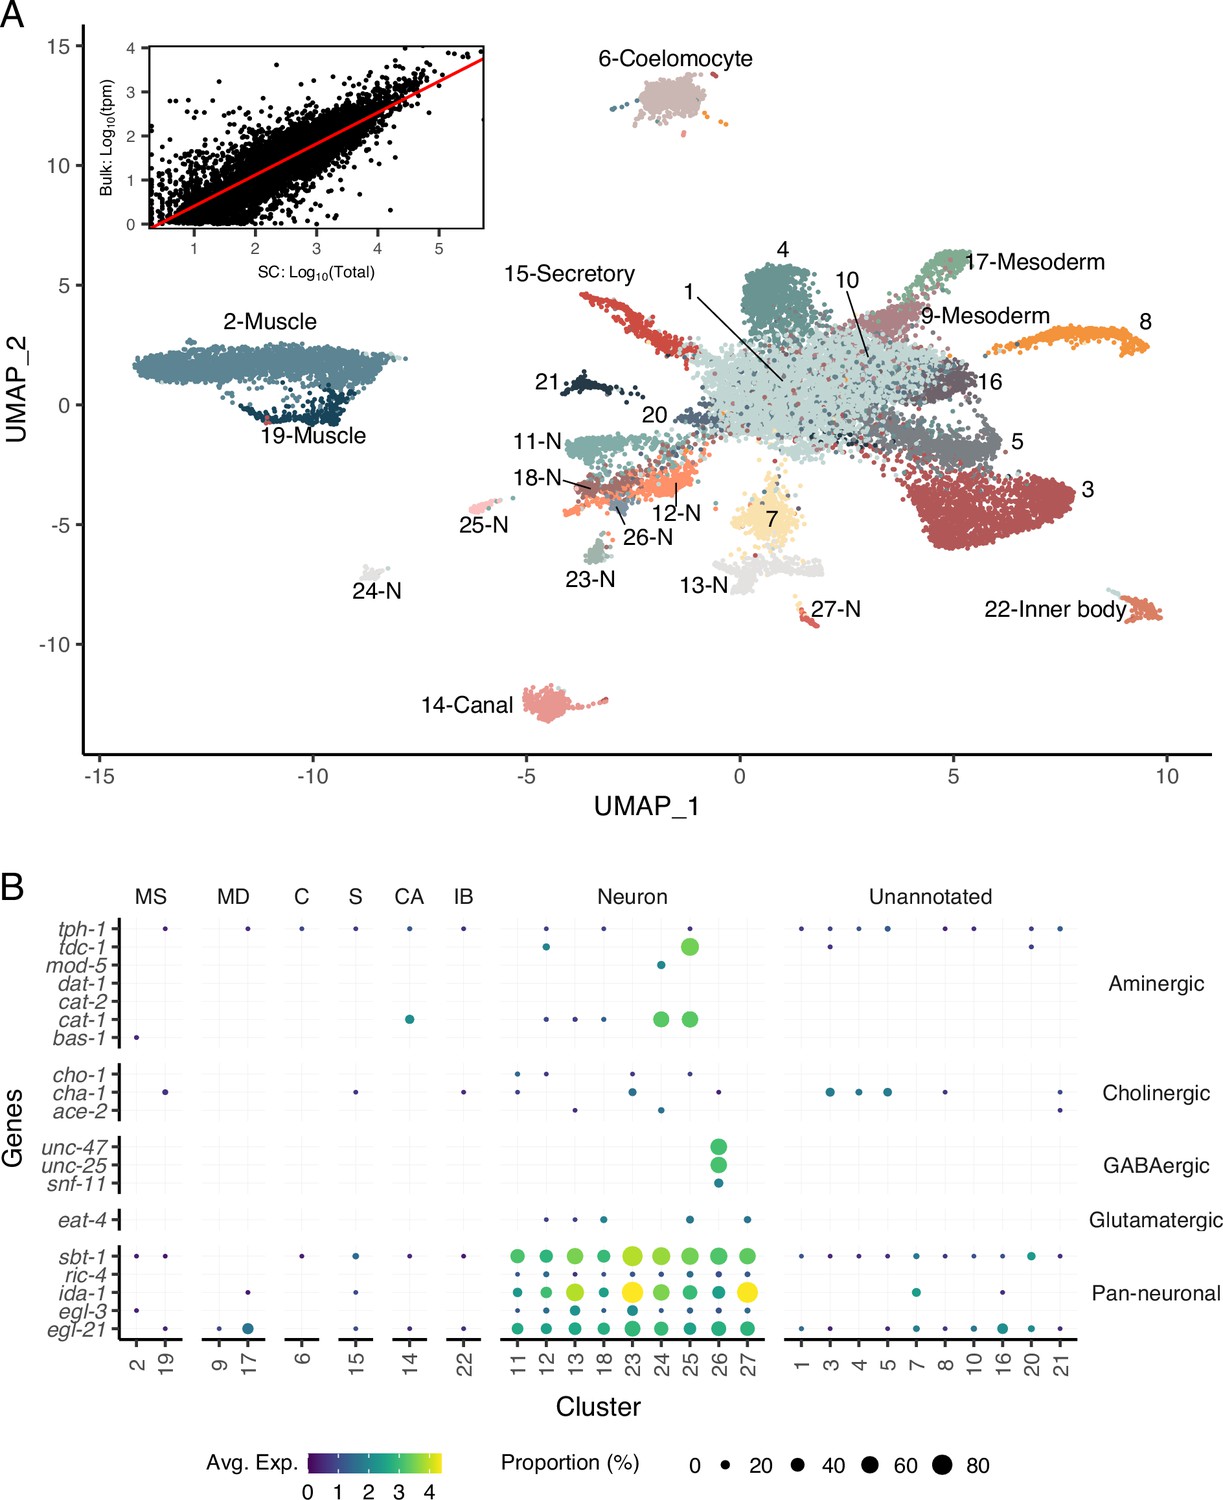
A single-cell transcriptomic atlas of B. malayi microfilariae cell types.
(A) Global Uniform Manifold Approximation and Projection (UMAP) transcriptome clustering of 46,621 cells with cell-type annotations. Inset: comparison of bulk transcript per million counts (tpm) (bulk: Log10(tpm)) and single-cell RNA-seq total read counts (SC: Log10(Total)) indicates the transcriptomic profile of the single-cell atlas largely recapitulates the gene expression profile of bulk tissue RNA-sequencing. Correlation between the bulk and single-cell RNA-seq datasets was assessed using Pearson correlation coefficient. Linear model regression line is indicated in red. (B) Gene expression distribution (color) and proportion of cells per cluster (size) expressing neurotransmitter-specific genes. Clusters 24 and 25 are aminergic and cluster 26 is GABAergic. Glutamatergic and cholinergic neurons are unresolved. MS, muscle; MD, msoderm; C, coelomocyte; S, secretory; CA, canal-associated; IB, inner body.
Figure 2—figure supplement 1
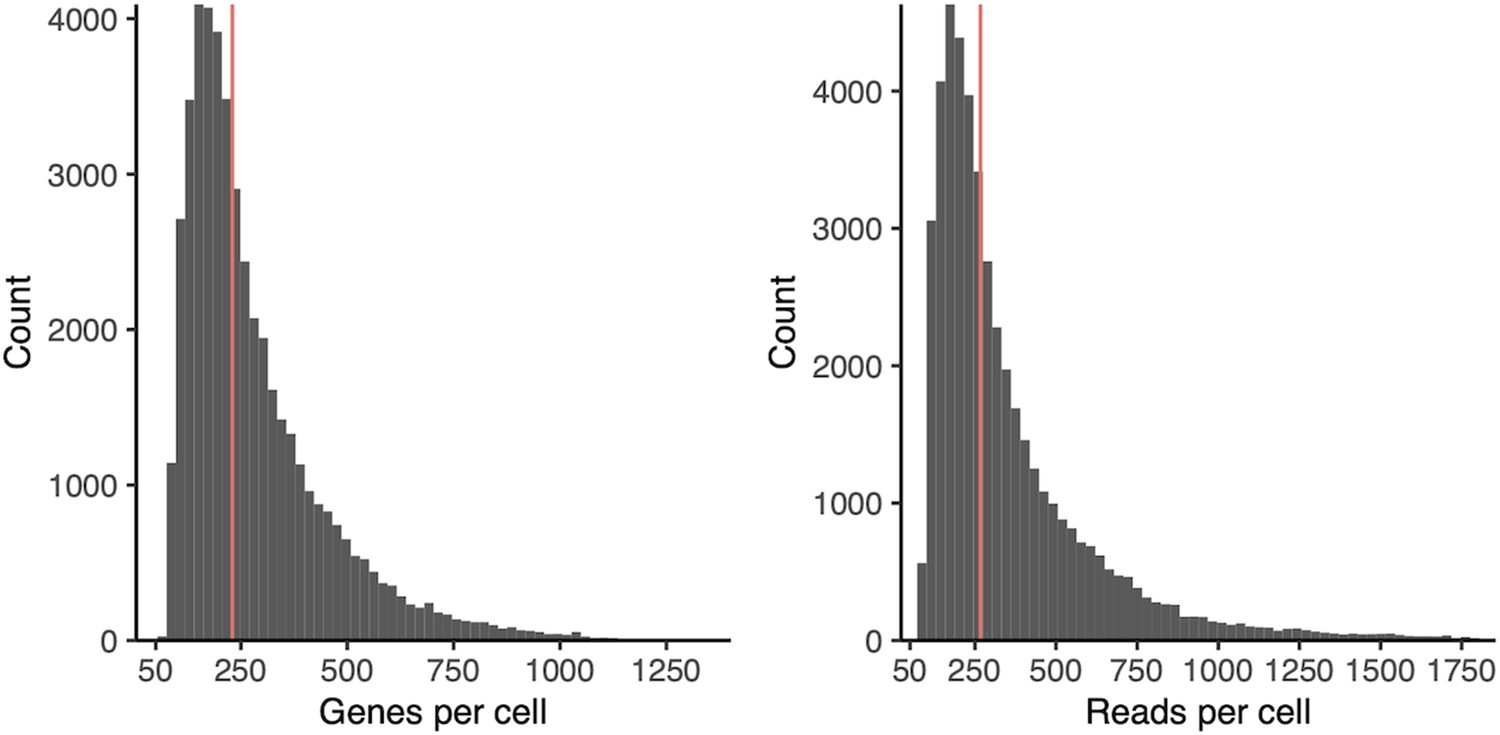
Histograms of genes (left) and UMIs (right) per cell across all clustered cells.
Red line indicates the mean.
Figure 2—figure supplement 2
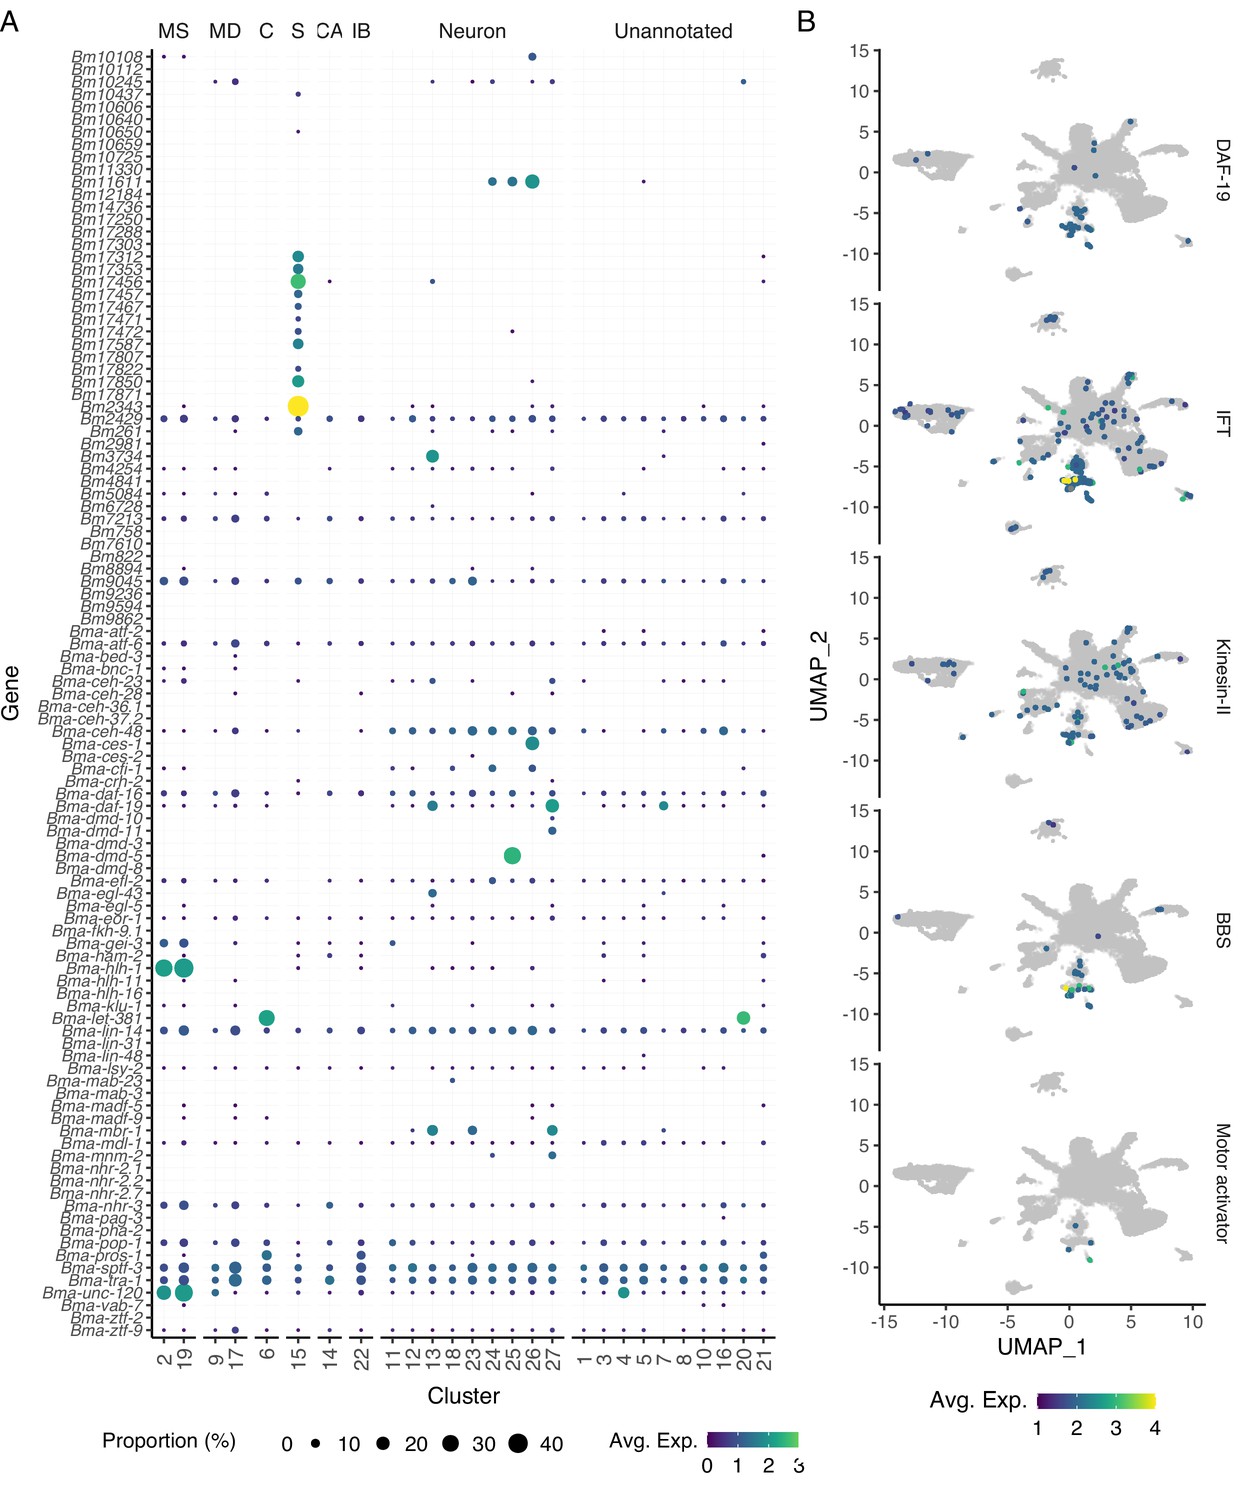
Distribution of transcription factors by cell type.
(A) Dot plot of orthologous B. malayi transcription factors based on C. elegans transcription factors confirmed through direct evidence as indicated in the CIS-BP database. Dot size indicates the proportion of cells within the corresponding cluster expressing the gene, and the color represents the average level of expression across the expressing cells in the cluster. MS, muscle; MD, mesoderm; C, coelomocyte; S, secretory; CA, canal-associated; IB, inner body (B) Uniform Manifold Approximation and Projection (UMAP) representation of ciliated sensory neuron-specific transcription factor Bma-daf-19 and genes that contribute to ciliogenesis. Intraflagellar transport (IFT) represented by Bma-che-3.1, Bma-che-3.2, Bma-xbx-1, Bma-dylt-2, Bma-che-11, Bma-daf-10, Bma-osm-5, Bma-ift-81, Bma-ift-74, Bma-osm-6, Bma-osm-1, Bma-che-2, and Bma-che-13. Kinesin-II IFT motors represented by Bma-klp-11, Bma-klp-20, and Bma-kap-1. Bardet–Biedl syndrome (BBS) stabilizing proteins represented by Bma-bb-1, Bma-bbs-2.1, Bma-bbs-2.2, Bm4542, Bma-bbs-5, Bma-osm-12, Bma-bbs-8, and Bma-bbs-9.
Figure 2—figure supplement 3
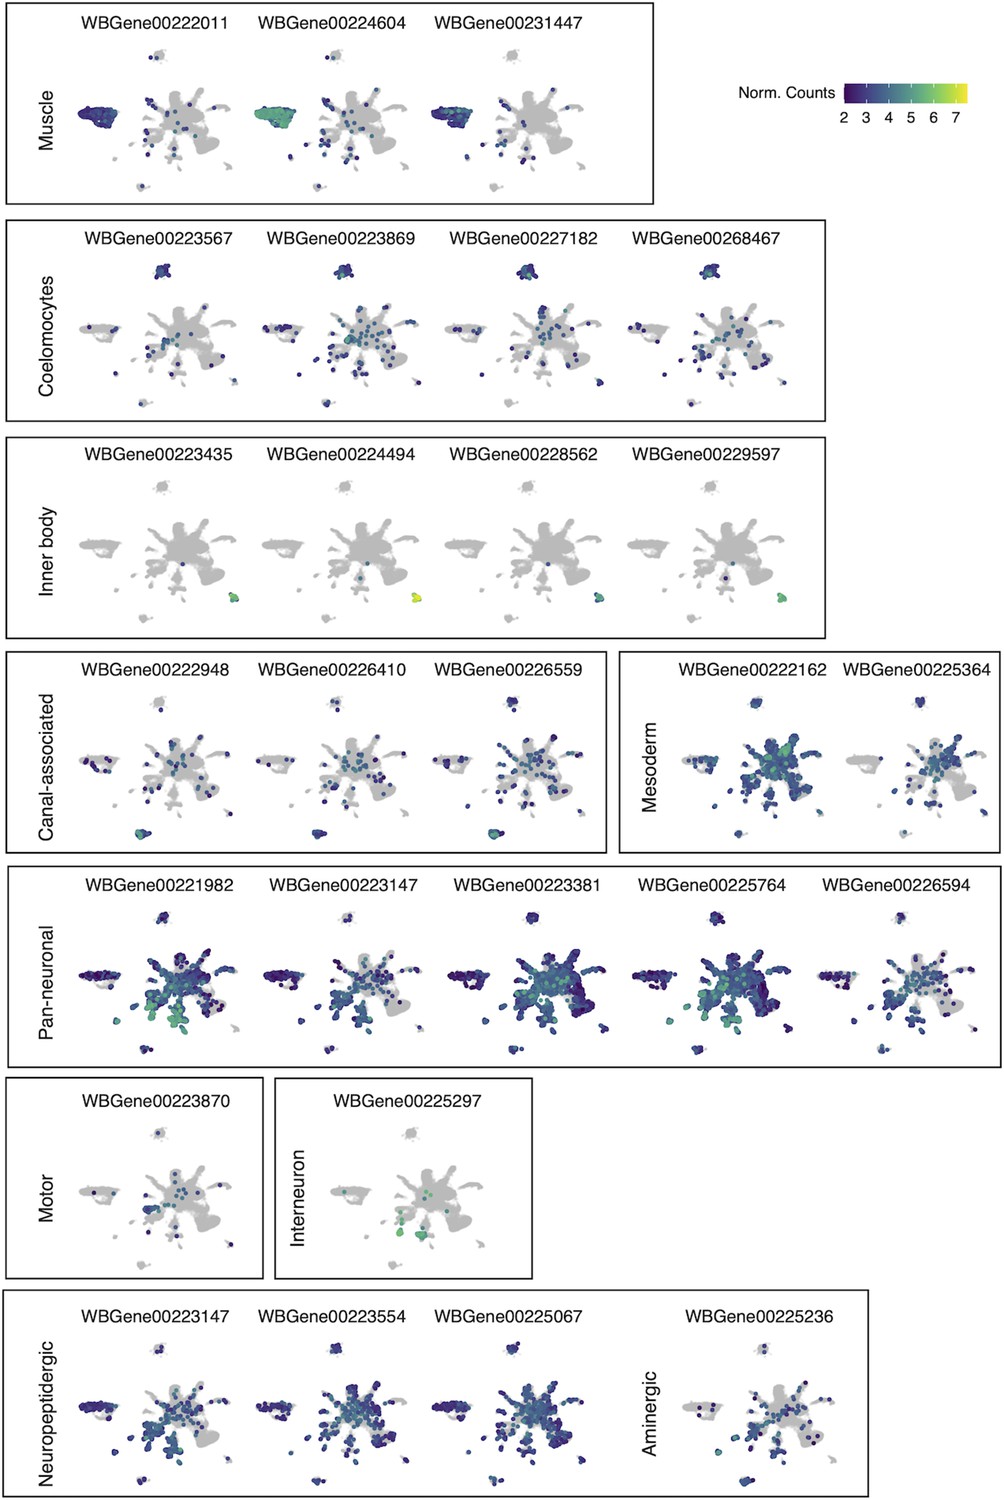
Uniform Manifold Approximation and Projection (UMAP) visualization of marker genes used to annotate cell-type clusters.
Figure 2—figure supplement 4
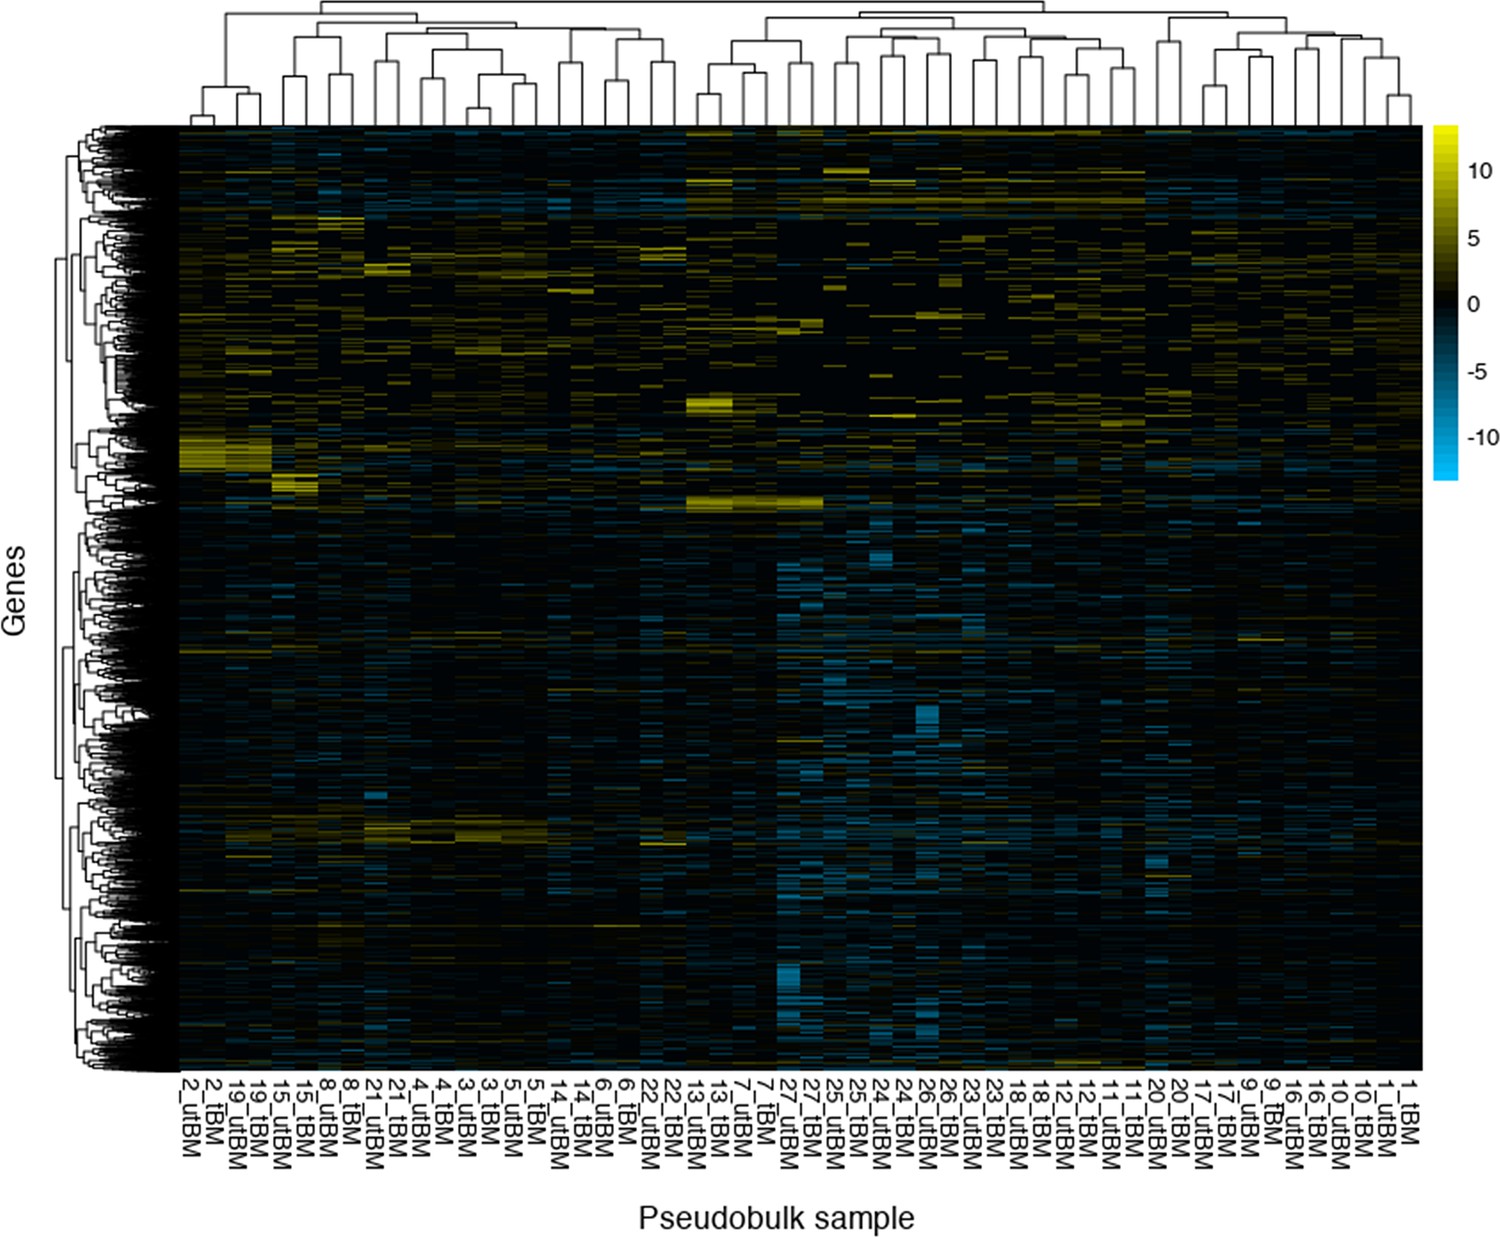
Pseudobulk analysis of scRNA-seq transcriptomic data.
The raw counts for each cluster based on treatment (untreated or ivermectin [IVM]-treated) were aggregated to simulate a bulk transcriptomic library sample. Samples and B. malayi genes are hierarchically clustered to show samples that represent similar cell types and differentially expressed genes across cell types.
Figure 2—figure supplement 5
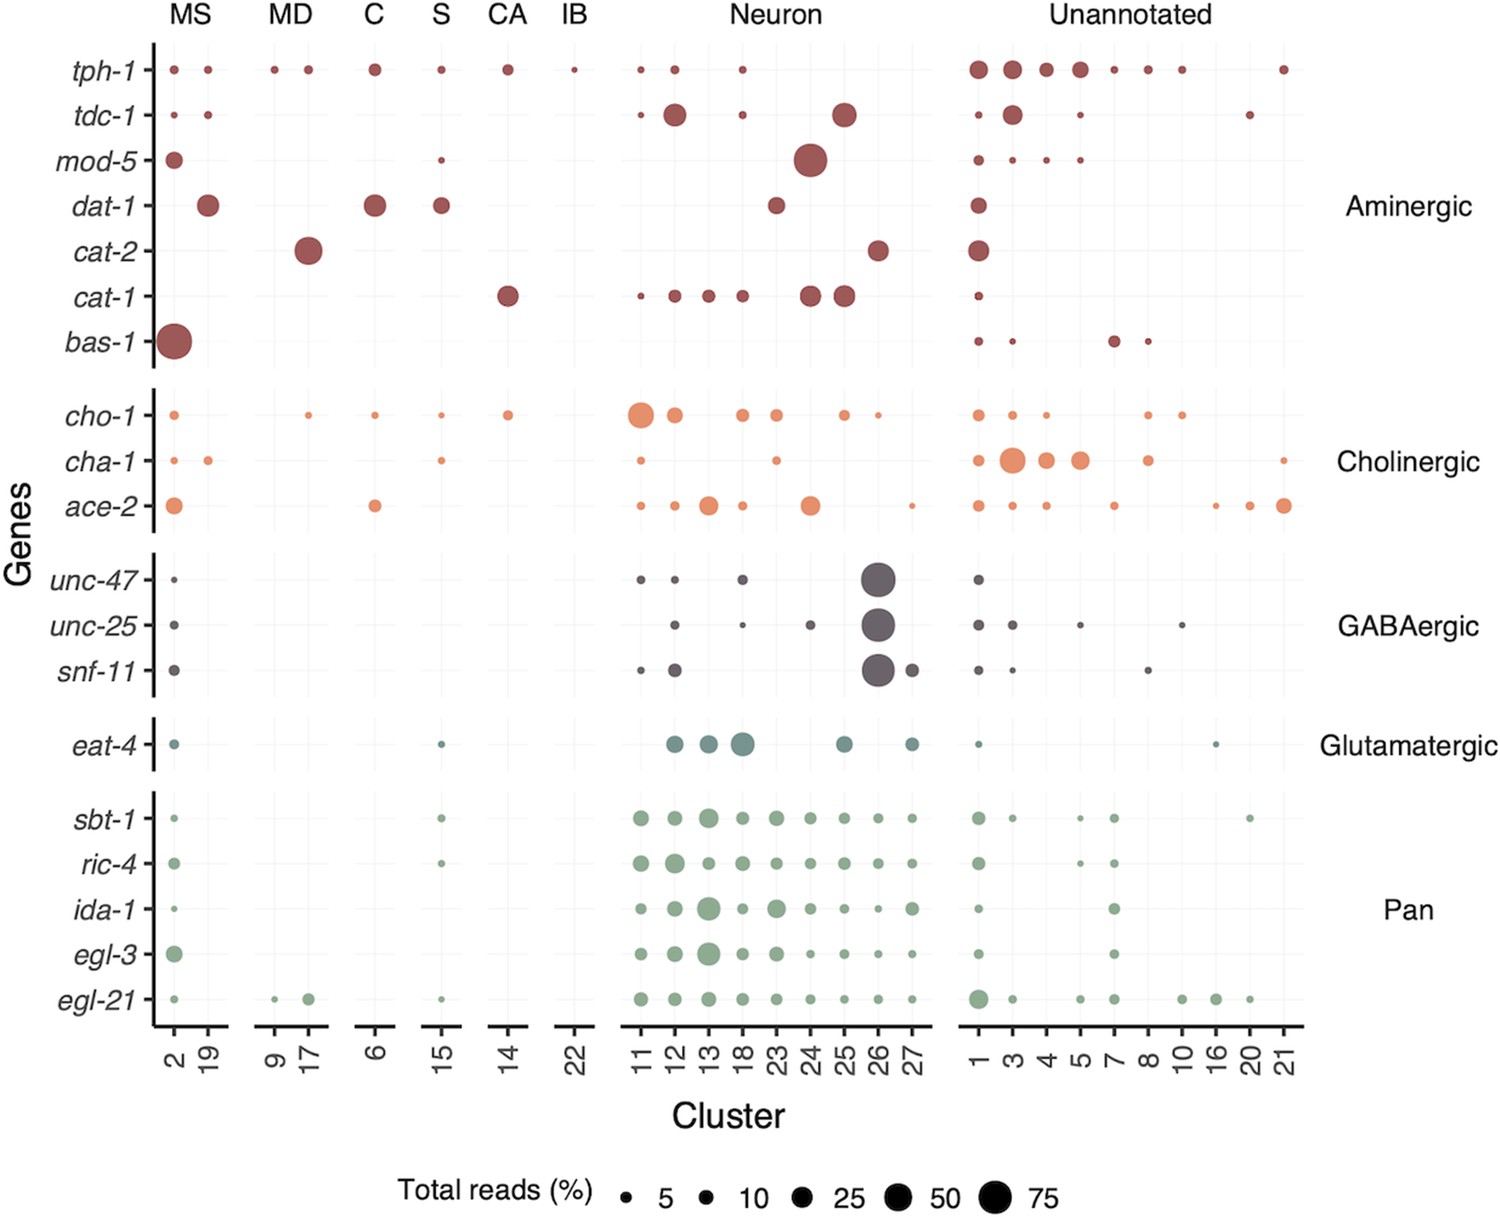
Distribution of neuronal gene transcripts across all clusters.
Circle size (Total reads [%]) represents the proportion of total reads for each gene located in that cluster. Color indicates neuronal class. MS, muscle; MD, mesoderm; C, coelomocyte; S, secretory; CA, canal-associated; IB, inner body.
Figure 2—figure supplement 6
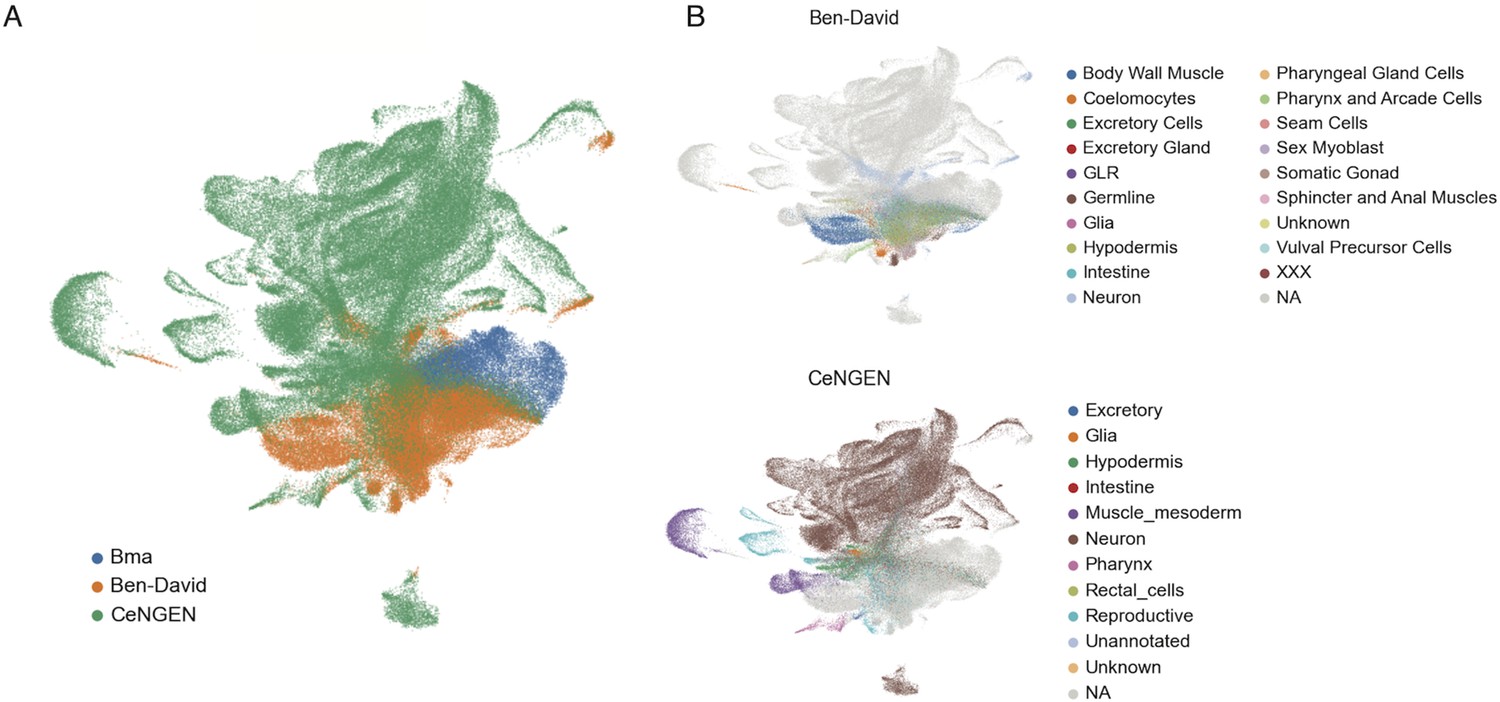
Integration of single-cell datasets using Scanorama algorithm.
Bma, B. malayi mf. Ben-David, C. elegans L2 stage dataset from Ben-David et al., 2020. CeNGEN, C. elegans L4 stage from Taylor et al., 2021. Integration of the three datasets using the Scanorama algorithm is colored by dataset (A) and annotated cell type (B).
Figure 3 with 3 supplements
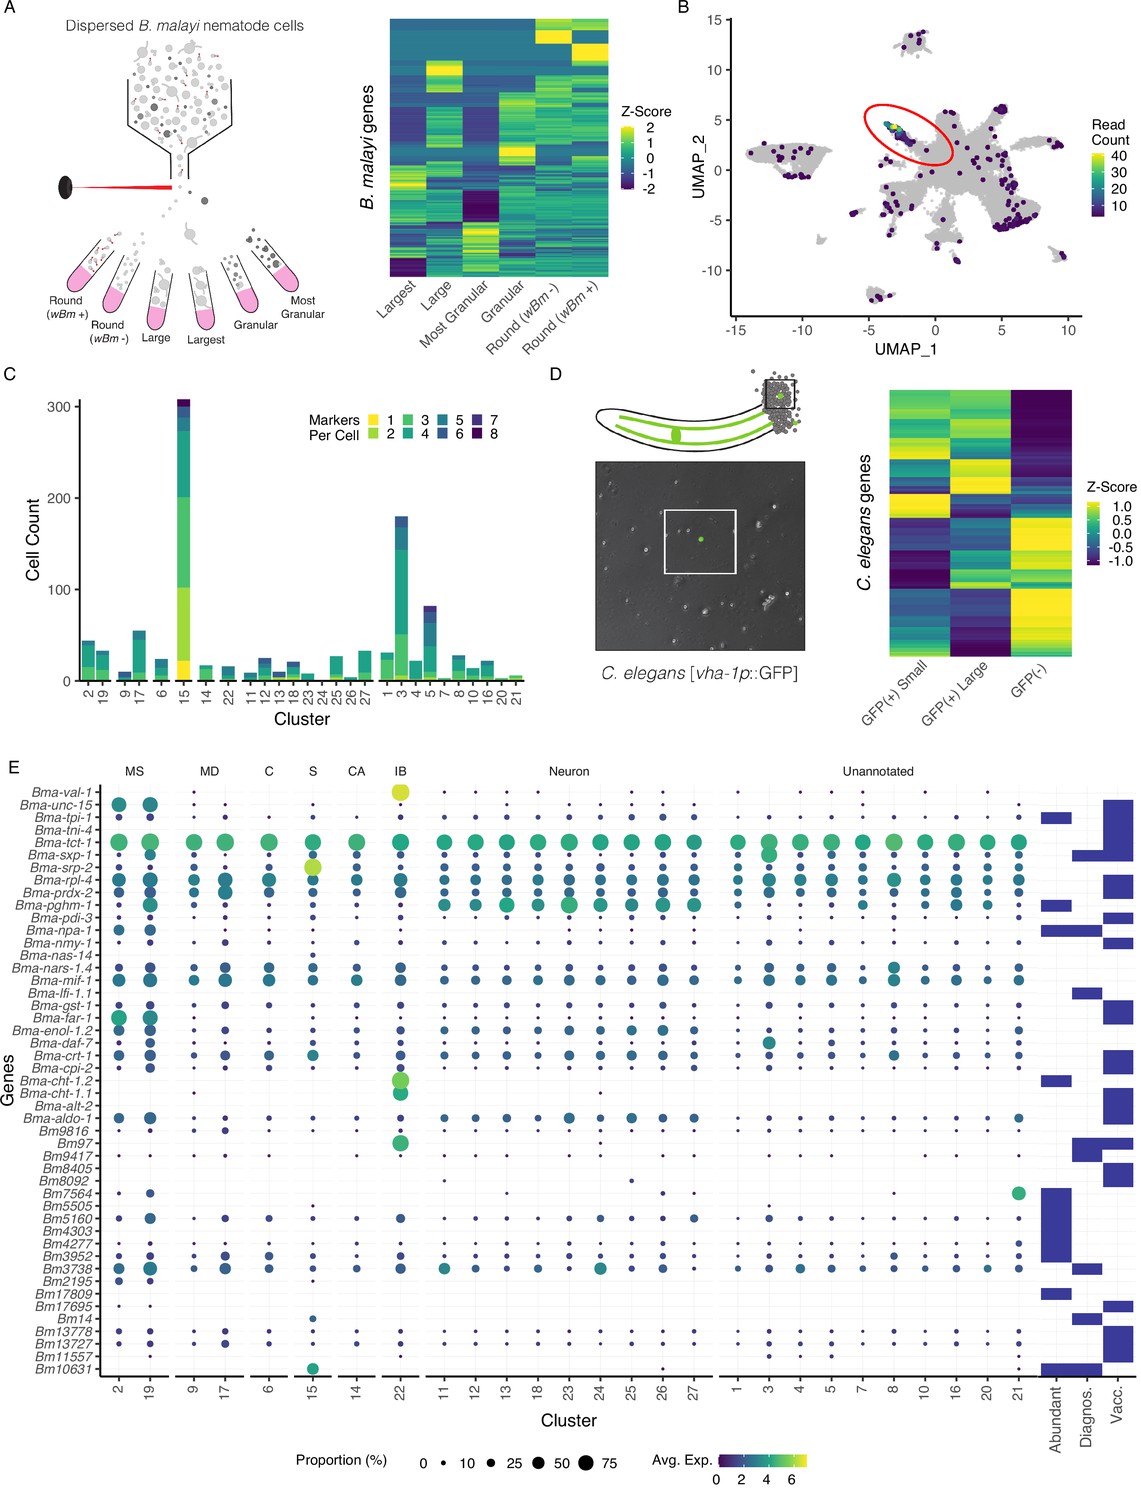
Annotation of the Brugia secretory cell and localization of secretory-related antigens indicates broad distribution of antigen transcriptic origins.
(A) Schematic of fluorescent-activated cell sorting (FACS) enrichment approach for isolating cell populations in B. malayi microfilariae (mf) single-cell dispersions. Viable cells were sorted by size, granularity, and the presence or absence of anti-Wolbachia fluorescent antibodies and collected directly into TRIzol LS for RNA isolation and sequencing. (B) Differentially expressed genes (DEGs) in the ‘Largest’ cells sample, the population hypothesized to contain the secretory cell, were projected on the mf single-cell atlas and indicated expression enrichment in cluster 15. Read count represents summed reads across mapped genes in the single-cell atlas. (C) Cell and marker coexpression quantification in cells belonging to cluster 15 using the DEGs identified in (A). Cluster 15 includes the majority of cells expressing DEGs and contains the most cells coexpressing two or more markers. (D) Single-cell suspension of C. elegans strain BK36 with the excretory canal cytoplasm labeled with GFP. Heatmap representing differential gene expression from sorted cell populations by FACS based on size and GFP(+/-) expression. (E) Dot plot of secreted, diagnostic, and vaccine antigens grouped by annotated cell type. Color indicates average gene expression per cluster. Circle diameter denotes proportion of cells in each cluster expressing the indicated gene. Presence of a blue box indicates whether the resultant protein from the gene is considered an abundant secretory antigen, a diagnostic antigen (Diagnos.) or whether the resulting protein has been investigated as a vaccine target (Vacc.). MS, muscle; MD, mesoderm; C, coelomocyte; S, secretory; CA, canal-associated; IB, inner body.
-
Figure 3—source data 1
List of differentially expressed genes identified in the B. malayi microfilariae (mf) ‘largest’ cell population collected via fluorescent-activated cell sorting (FACS) and bulk RNA-seq.
- https://cdn.elifesciences.org/articles/83100/elife-83100-fig3-data1-v2.csv
-
Figure 3—source data 2
List of differentially expressed genes in secretory cells (cluster 15).
- https://cdn.elifesciences.org/articles/83100/elife-83100-fig3-data2-v2.csv
-
Figure 3—source data 3
List of differentially expressed genes identified in C. elegans large and GFP(+) cells collected via fluorescent-activated cell sorting (FACS) and bulk RNA-seq.
- https://cdn.elifesciences.org/articles/83100/elife-83100-fig3-data3-v2.csv
-
Figure 3—source data 4
Comprehensive table of major antigens, vaccine targets, diagnostic markers, and notable secreted proteins.
- https://cdn.elifesciences.org/articles/83100/elife-83100-fig3-data4-v2.csv
Figure 3—figure supplement 1
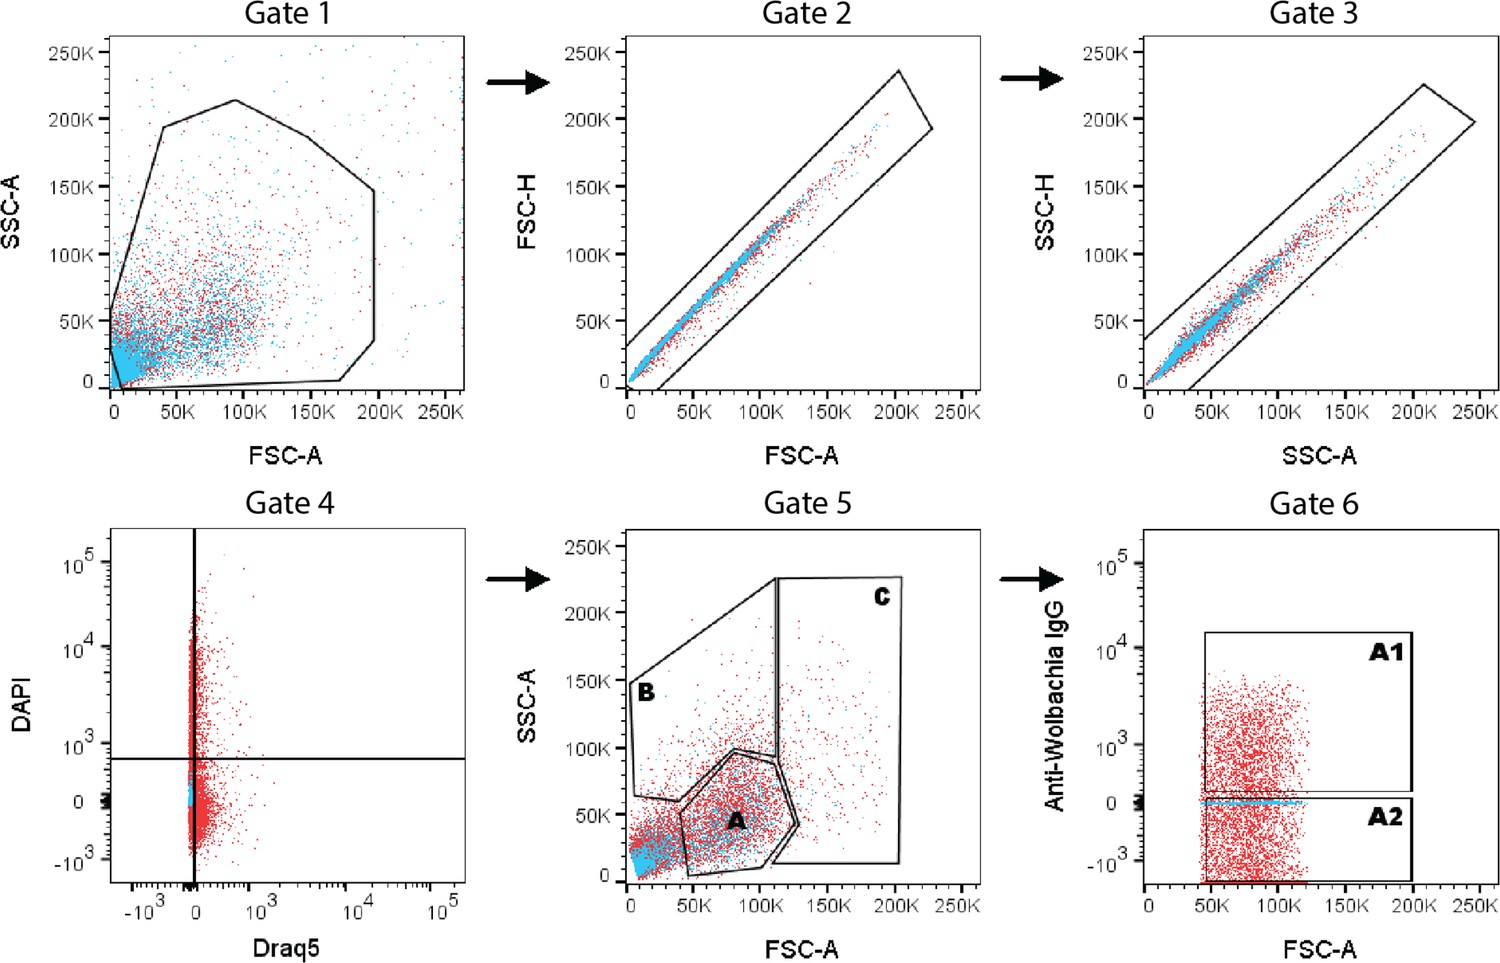
Representative fluorescent-activated cell sorting (FACS) gating scheme for collecting B. malayi single-cells based on size, granularity, and presence or absence of anti-Wolbachia IgG antibody.
Cells were separated from debris (Gate 1) and live single cells were differentiated from doublets using forward scatter, side scatter, and DAPI/DRAQ5 staining (Gates 2–4). Cells were further separated based on increased granularity (Gate 5B), increased cell size (Gate 5C), or small, round cells (Gate 5A). Small, round cells were further separated by the presence or absence of anti-Wolbachia IgG antibody binding (Gate 6A1 and Gate 6A2, respectively).
Figure 3—figure supplement 2
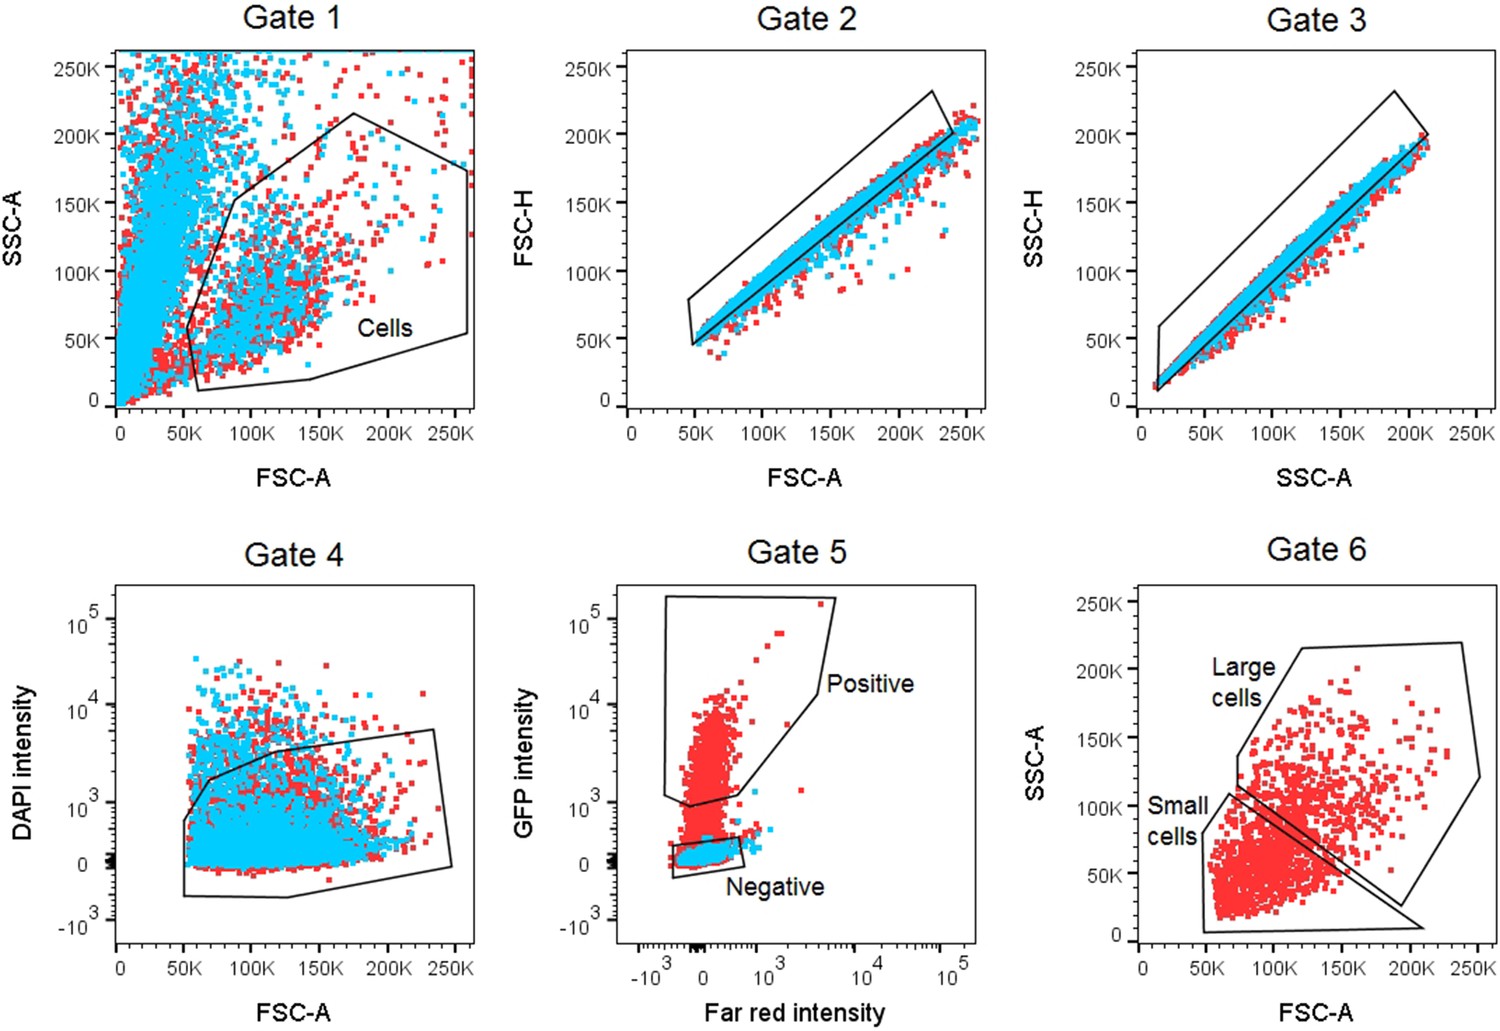
Representative fluorescent-activated cell sorting (FACS) gating scheme for collecting C. elegans strain BK36 cell populations.
Cells were separated from debris (Gate 1) and live single cells differentiated from doublets using forward scatter, side scatter, and DAPI intensity (Gates 2–4). GFP(-) cells were separated for collection (Gate 5), and GFP(+) cells were further separated by size based on forward scatter and collected as small and large cell populations (Gate 6).
Figure 3—figure supplement 3
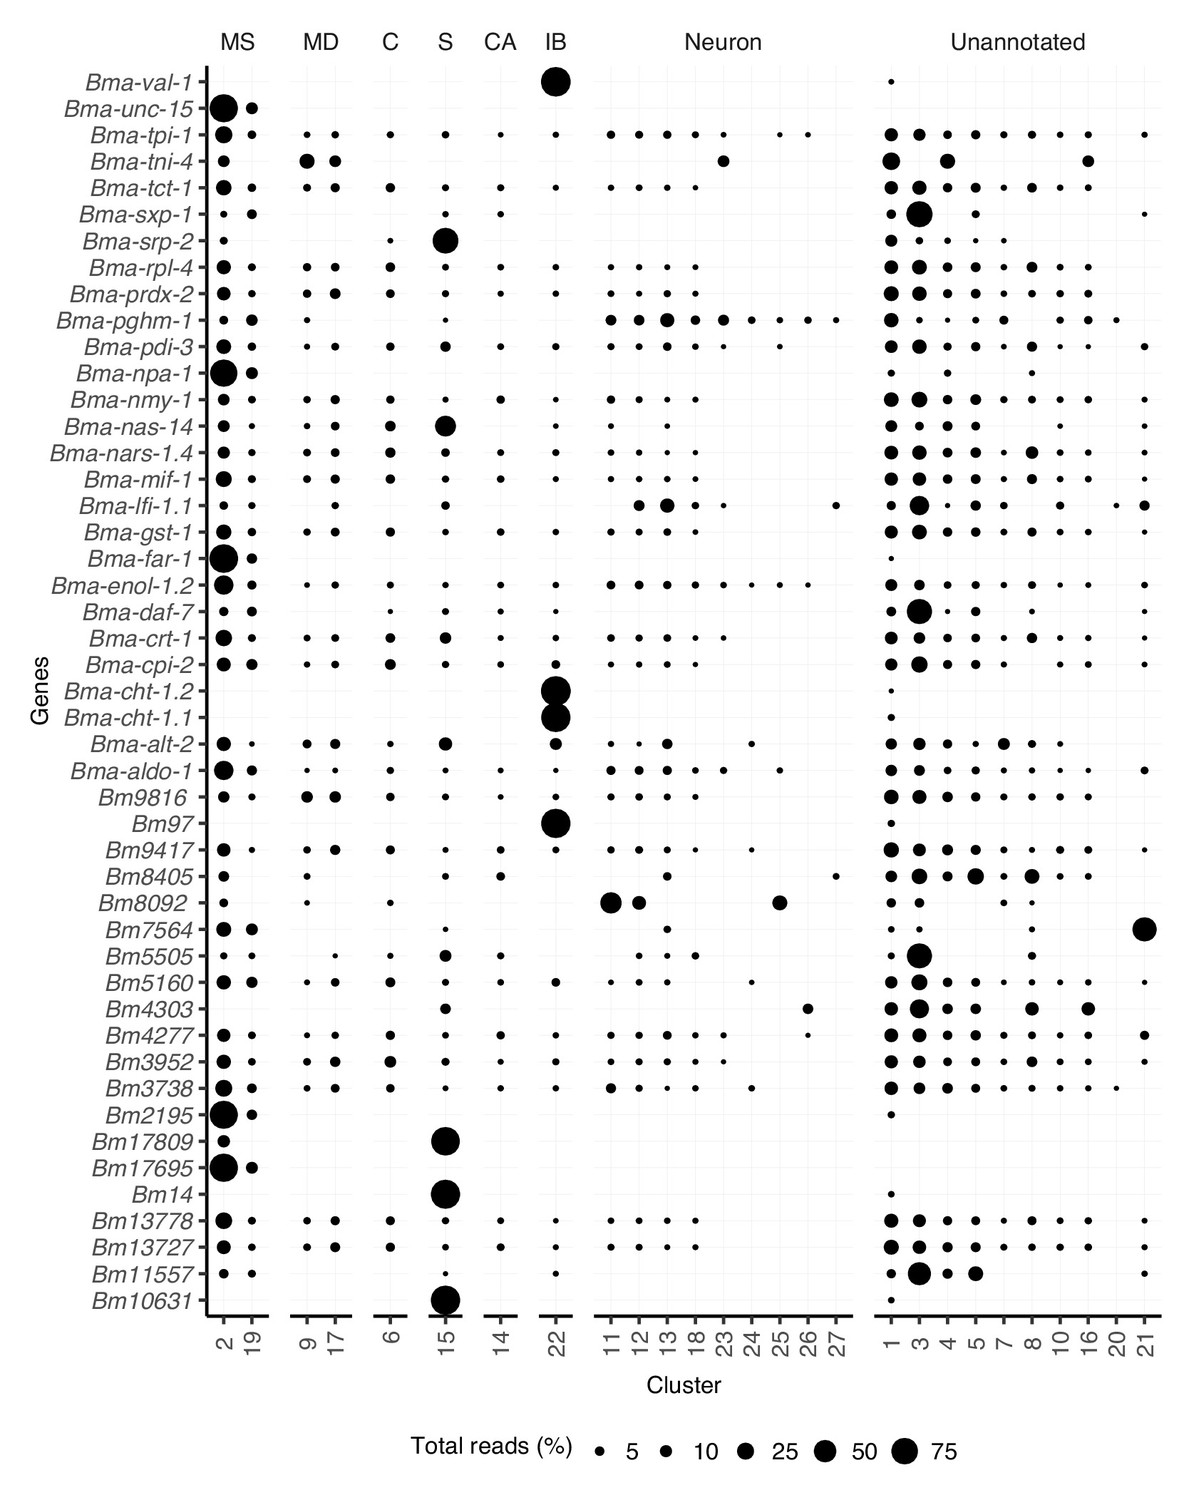
Distribution of gene transcripts across all clusters.
Circle size (Total reads [%]) represents the proportion of total reads for each gene located in the specified cluster. Transcript abundance distribution across cell types for prominent antigens. MS, muscle; MD, mesoderm; C, coelomocyte; S, secretory; CA, canal-associated; IB, inner body.
Figure 4 with 1 supplement
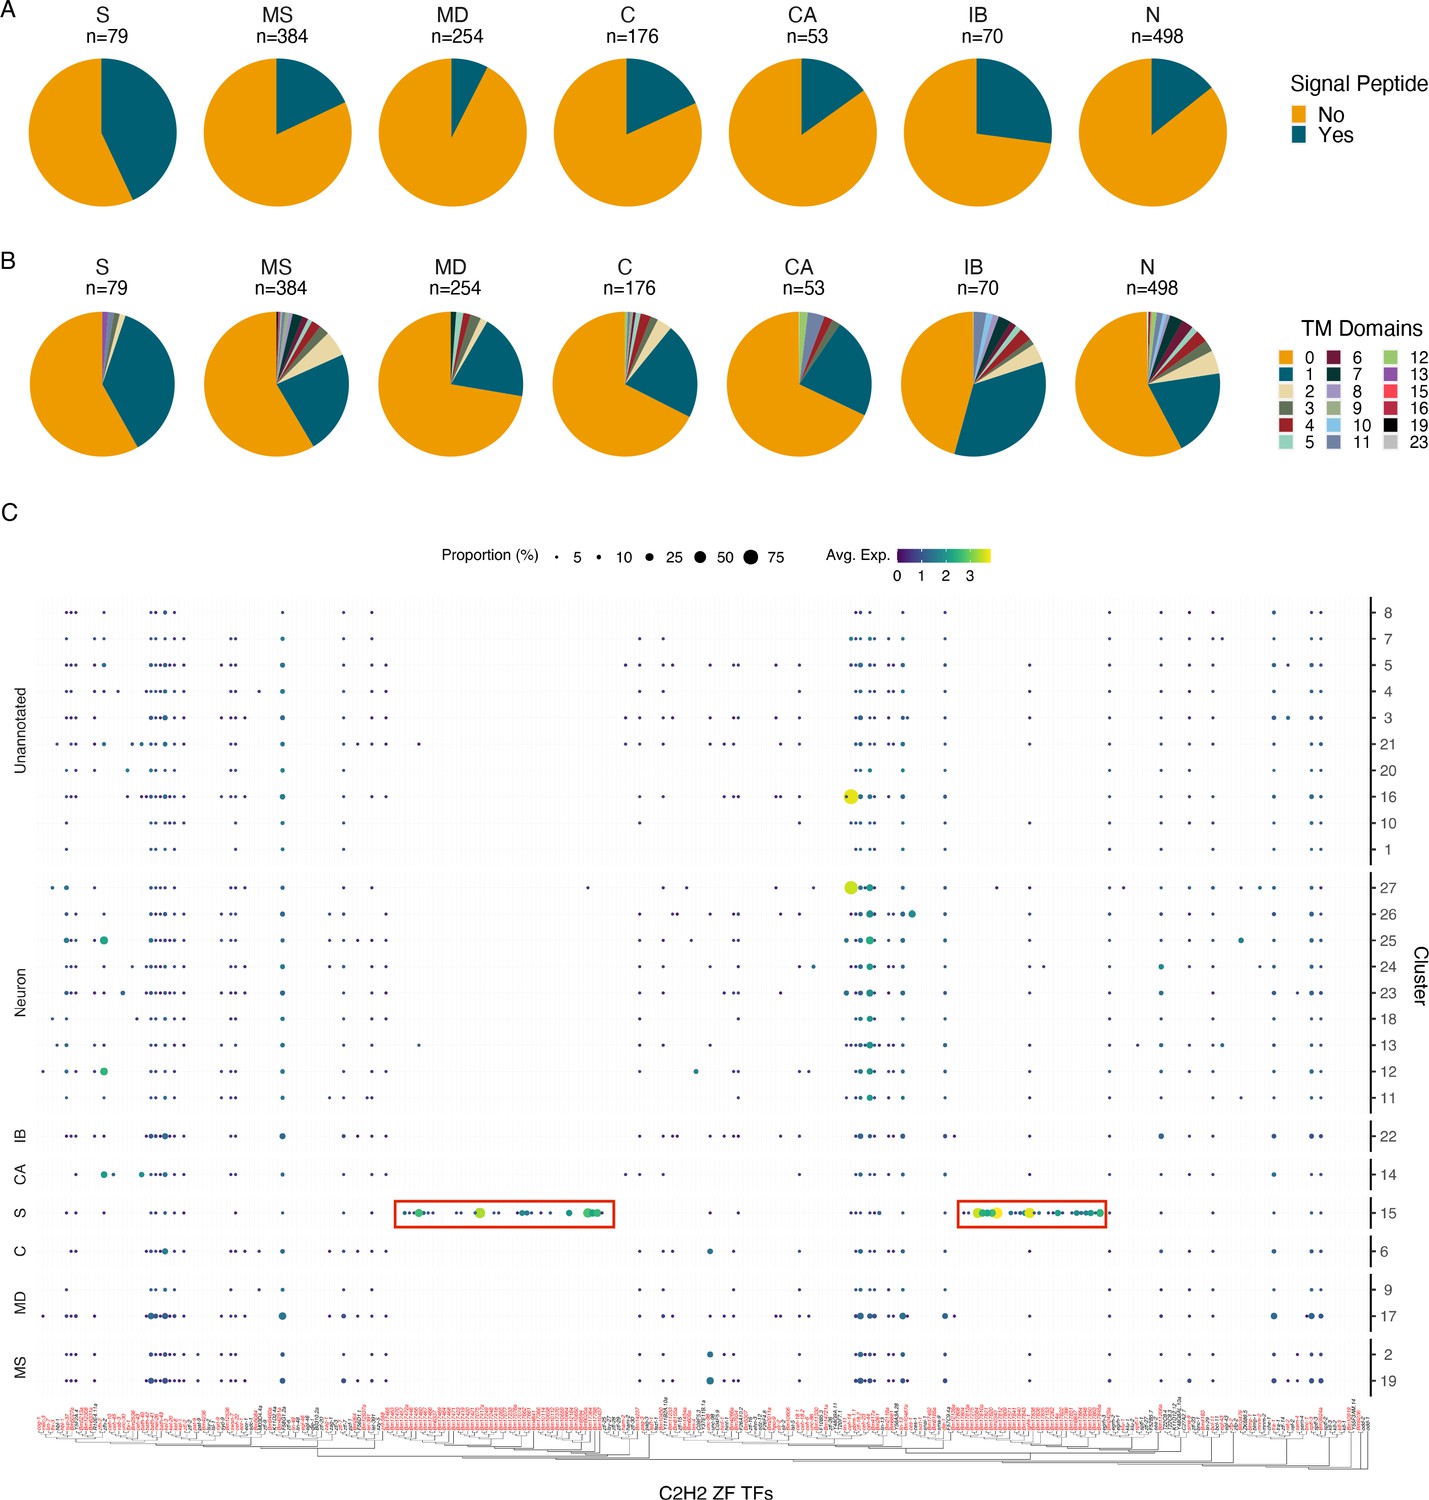
Characterization of the secretory cell indicates an enrichment in signal peptide containing proteins and C2H2 zinc finger transcription factors.
(A) Quantification of signal peptide-containing sequences among all differentially expressed genes (DEGs) (p≤0.05) across major annotated cell types. Differentially expressed transcripts in the secretory cell show an enrichment for signal peptide sequences. S, secretory; MS, muscle; MD, mesoderm; C, coelomocyte; CA, canal-associated; IB, inner body; N, neurons. (B) Quantification of transmembrane domains of differentially expressed transcripts in the secretory cell. Secretory cells contain several genes with a single predicted transmembrane domain but very few proteins contain more than one domain. (C) Phylogenetic and expression analysis of C2H2 zinc finger transcription factors in B. malayi (red) based on orthologous C2H2-ZF TFs confirmed through direct evidence in C. elegans (black). Paralogous expansion (red boxes) of these transcription factors is observed with nearly exclusive expression in the secretory cell. A summary of Gene Ontology (GO) enrichment for DEGs of the secretory cell can be found in Figure 4—figure supplement 1.
-
Figure 4—source data 1
Summary table of signal peptide sequence predictions in differentially expressed transcripts across major annotated cell types.
S, secretory; MS, muscle; MD, mesoderm; C, coelomocyte; CA, canal-associated; IB, inner body; N, neurons.
- https://cdn.elifesciences.org/articles/83100/elife-83100-fig4-data1-v2.csv
-
Figure 4—source data 2
Summary of transmembrane domain prediction in differentially expressed transcripts across major annotated cell types.
S, secretory; MS, muscle; MD, mesoderm; C, coelomocyte; CA, canal-associated; IB, inner body; N, neurons.
- https://cdn.elifesciences.org/articles/83100/elife-83100-fig4-data2-v2.csv
Figure 4—figure supplement 1
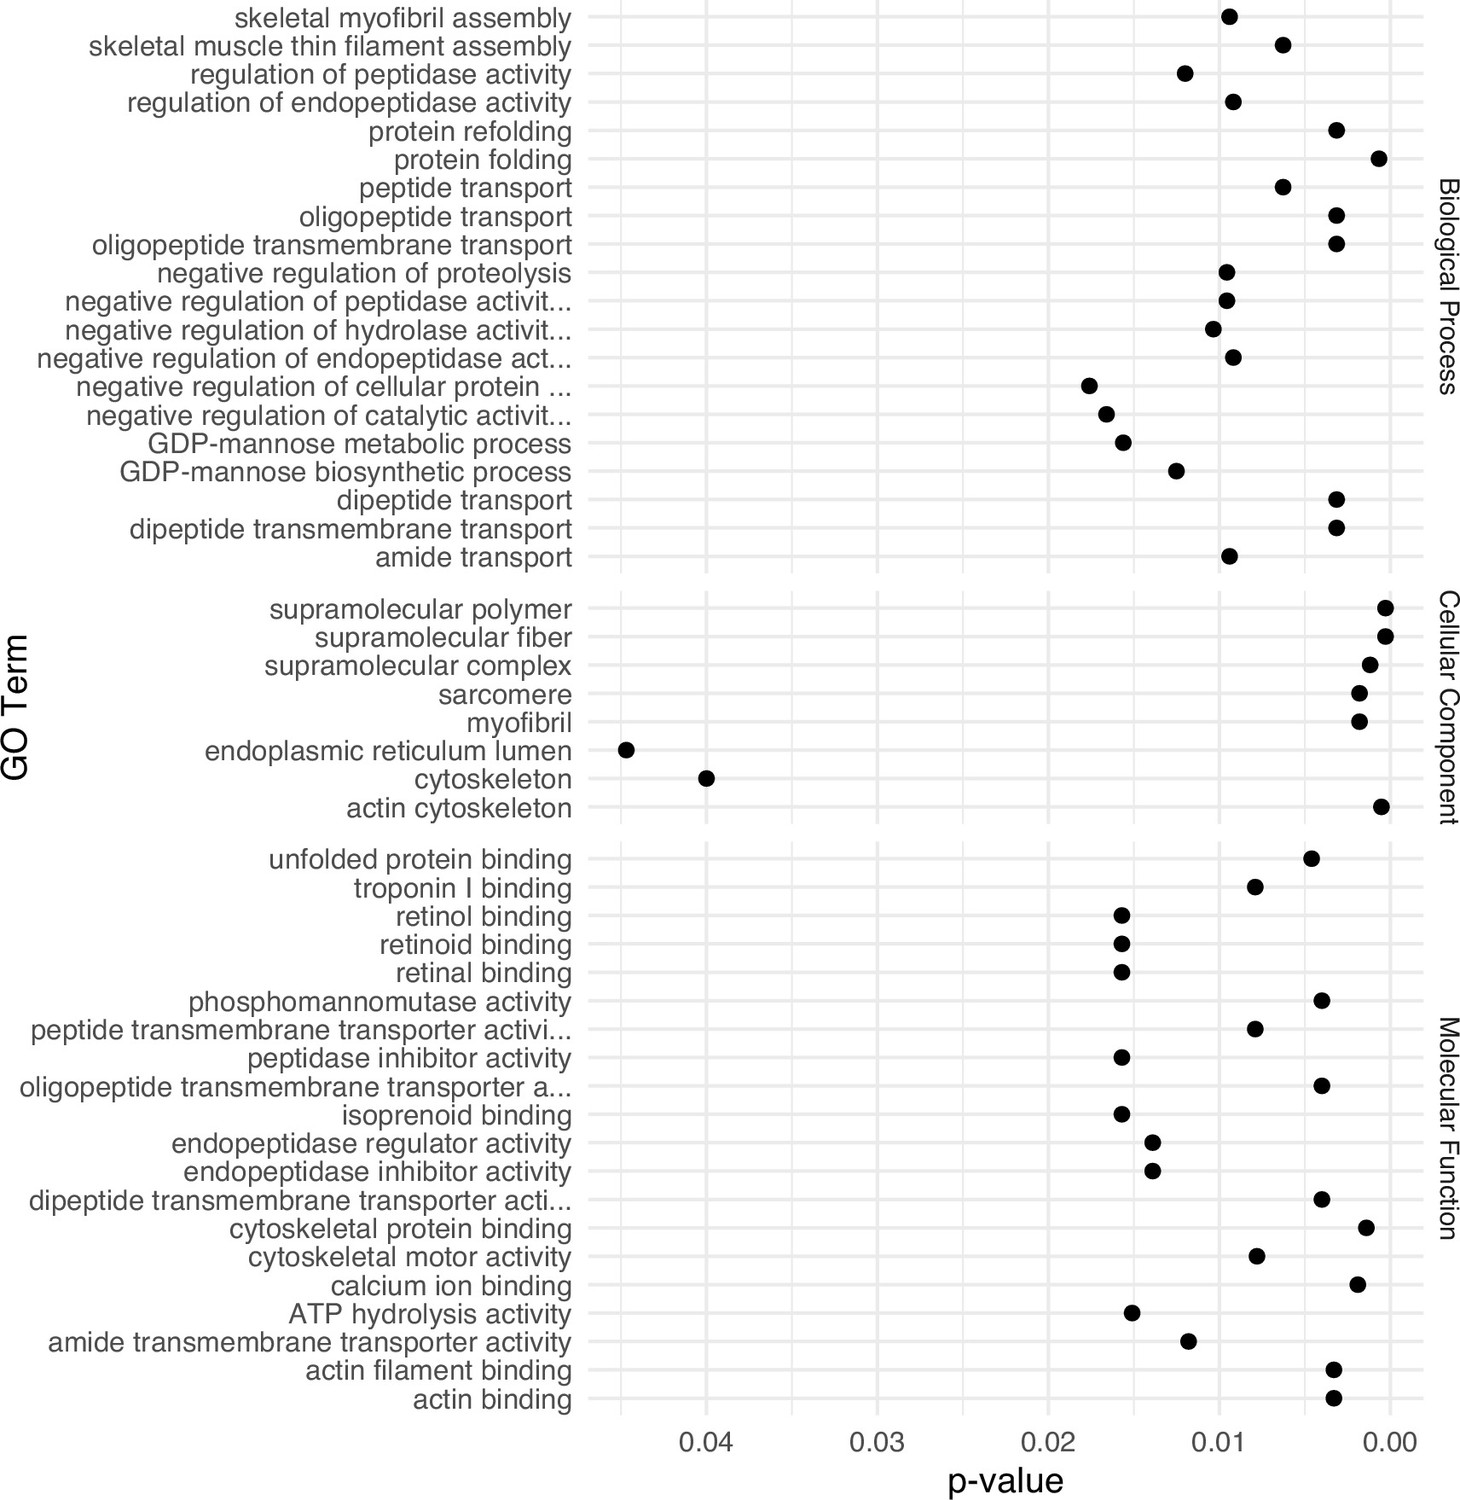
Gene Ontology (GO) term enrichment analysis for differentially expressed genes identified in the secretory cell.
Figure 5 with 1 supplement
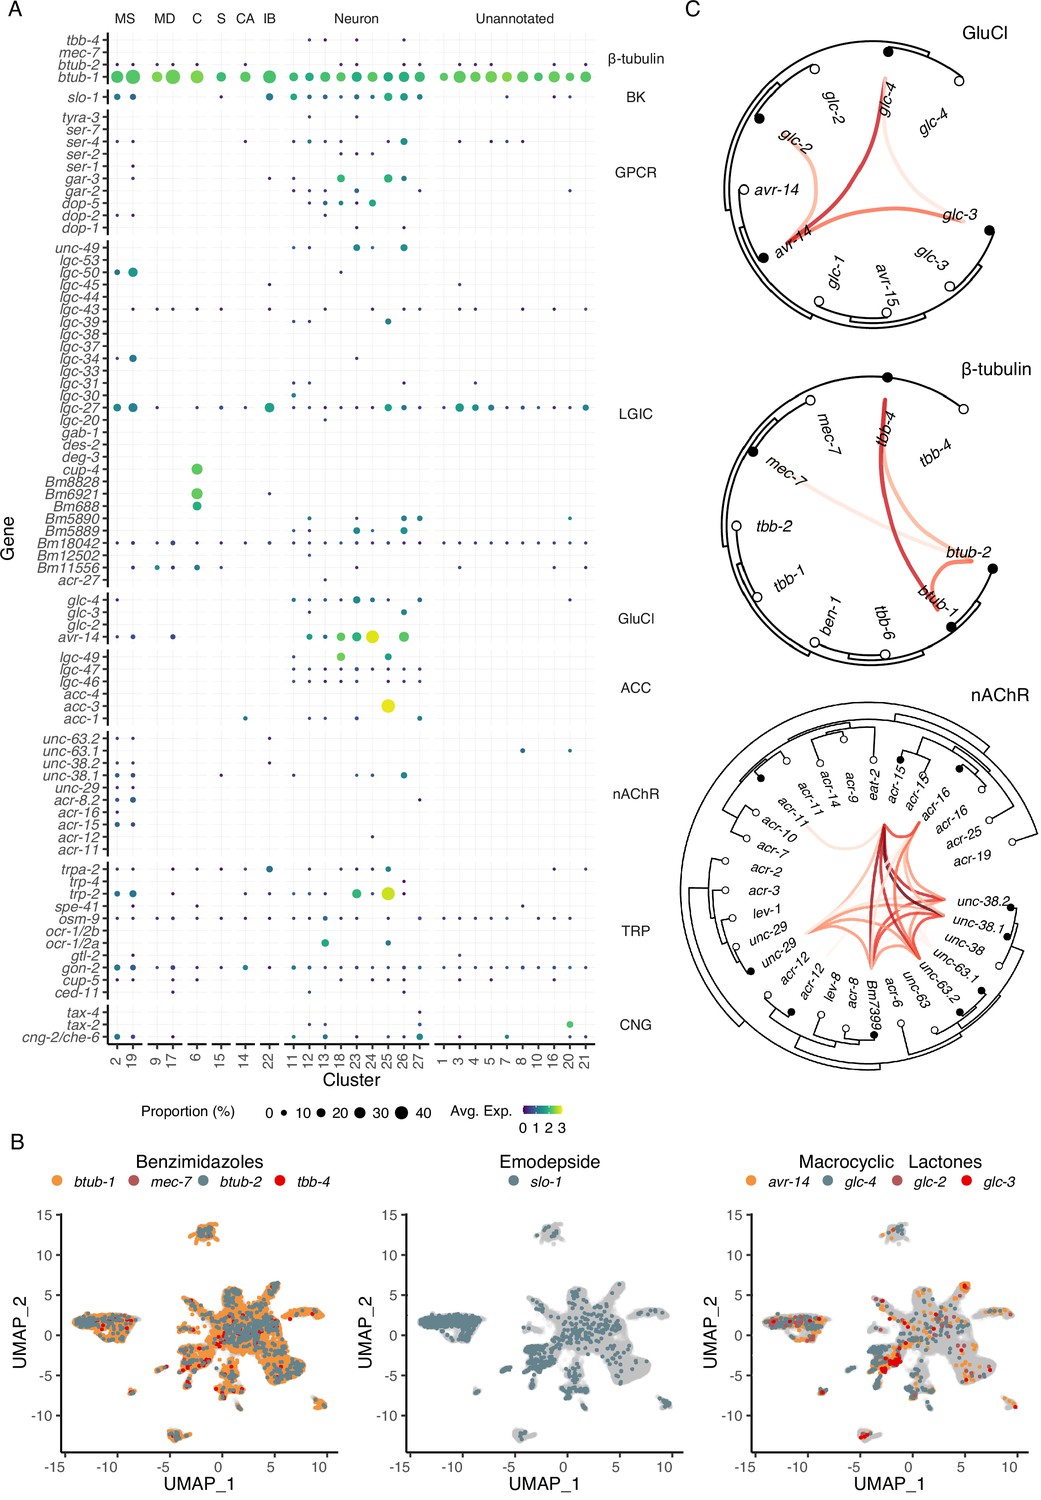
Distribution of putative anthelmintic targets and ligand-gated ion channel subunit colocalization.
(A) Transcriptomic and gene expression profiles of major anthelmintic targets in microfilarial cell types. Targets include β-tubulins and cys-loop ligand-gated ion channel (LGIC) subunits corresponding to the following subfamilies: big potassium (BK), G protein-coupled receptor (GPCR), glutamate-gated chloride channel (GluCl), acetylcholine-gated channel (ACC), nicotinic acetylcholine receptor (nAChR), transient receptor potential channel (TRP), and cyclic nucleotide-gated ion channels (CNG). (B) Uniform Manifold Approximation and Projection (UMAP) depiction of cells expressing putative targets of benzimidazoles (β-tubulins), emodepside (slo-1), and macrocyclic lactones (GluCls). (C) Phylogenetic trees showing single-cell correlations between subunits belonging to GluCl and nAChR LGIC subfamilies and β-tubulins. Empty circles represent C. elegans and filled circles represent B. malayi. Red links indicate positive Pearson correlation coefficients calculated using the log normalized count values. S, secretory; MS, muscle; MD, mesoderm; C, coelomocyte; CA, canal-associated; IB, inner body.
Figure 5—figure supplement 1
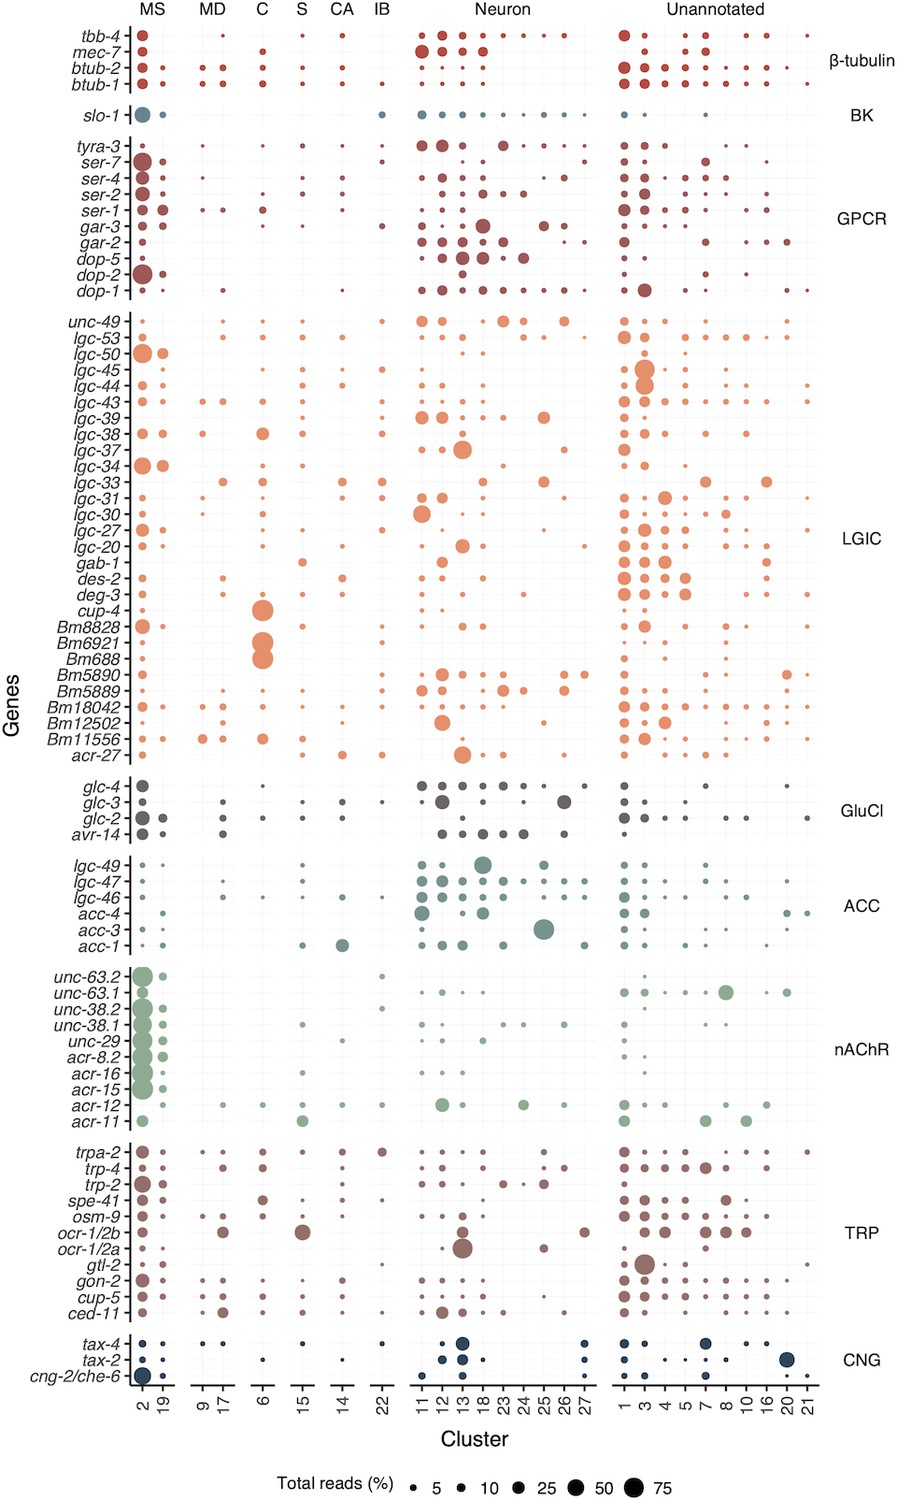
Distribution of gene transcripts associated with anthelmintic targets across all cell clusters.
Circle size (Total reads [%]) represents the proportion of total reads for each gene located in the specified cluster. S, secretory; MS, muscle; MD, mesoderm; C, coelomocyte; CA, canal-associated; IB, inner body;.
Figure 6
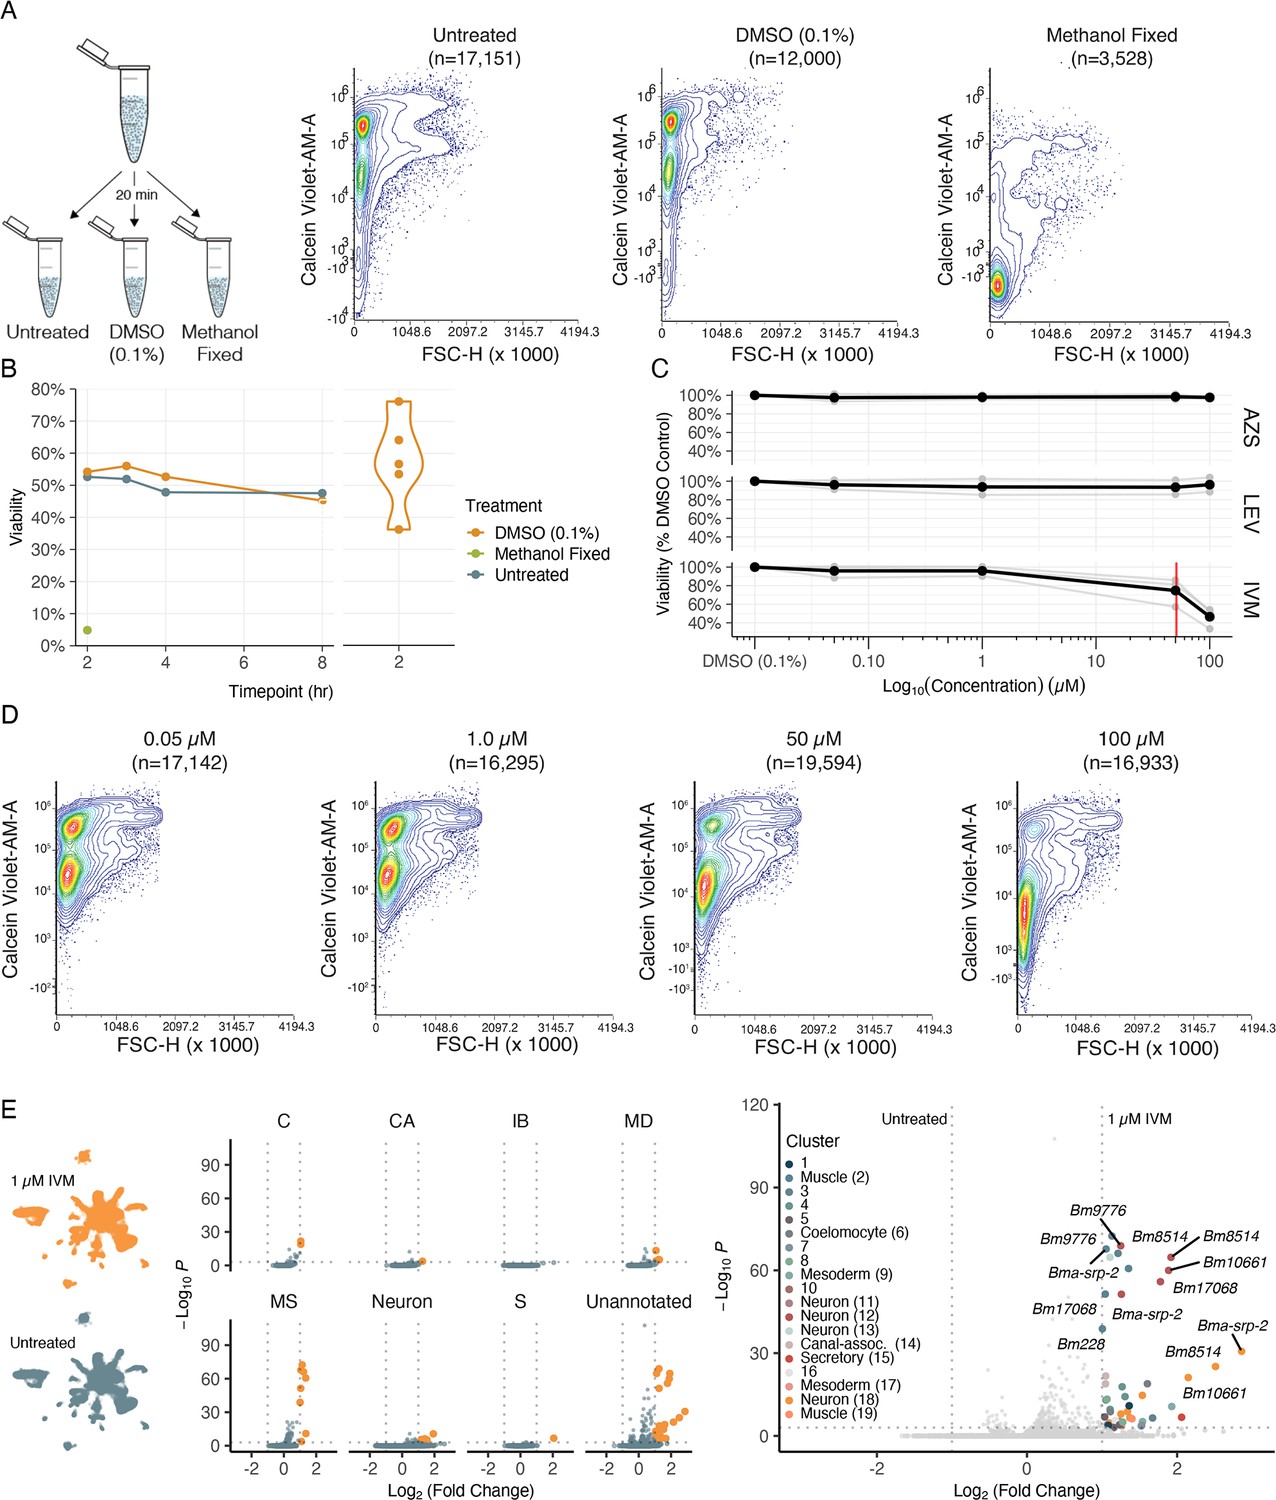
Cell viability and transcriptional shifts in response to anthelmintics.
(A) Schematic and representative flow cytometry contour plots depicting Calcein Violet-AM (viable) fluorescence in control samples (untreated, 0.1% DMSO, and methanol fixed). Methanol fixed cells show no retention of Calcein Violet-AM indicated by decreased fluorescence in the violet channel. (B) Viability of dispersed cell suspensions incubated on ice for 8 hr. Significant variation in the percent viability of cell populations after dissociation was observed and attributed to the variation in mf health prior to dispersion as well as small nuances in pronase digestion. (C) Drug dose–response curves on dispersed single-cell suspensions at 50 nM, 1 µM, 50 µM, 100 µM, and a DMSO-only (0.1%) control. Viability was normalized to the percent DMSO control. AZS, albendazole sulfoxide; LEV, levamisole; IVM, ivermectin. Black line indicates the average of three biological replicates for IVM and two biological replicates for LEV and AZS. Red line indicates the EC50 value for IVM at 51 ± 5.16 µM. (D) Representative flow cytometry contour plots of cell viability in response to IVM treatment. A decrease in Calcein Violet-AM fluorescence at 50 µM and nearly total cell death at 100 µM. (E) Left: single-cell transcriptomic response to IVM treatment (1 µM for 20 min, 1% DMSO). Uniform Manifold Approximation and Projection (UMAP) plot showing treated (top) and untreated (bottom) clustering of cell types. Middle: volcano plots depicting differentially expressed genes (DEGs) in treated and untreated groups by cell-type annotations. DEGs were calculated using Seurat’s FindMarkers() function and comparing treated vs. untreated clusters. Orange color indicates upregulation in IVM-treated cells. Right: volcano plot of DEGs colored by cluster.
-
Figure 6—source data 1
Differential gene expression analysis between untreated and ivermectin (IVM) (1 µM)-treated single-cell suspensions.
Positive average log2 fold-change (avg_log2FC) values indicate the gene is more highly expressed in cells exposed to IVM. Pct.1 and pct.2 correspond to the percentage of cells expressing the gene in the treated and untreated cell populations, respectively. p-Values were adjusted (p_val_adj) using a Bonferroni p-value correction approach.
- https://cdn.elifesciences.org/articles/83100/elife-83100-fig6-data1-v2.csv
Figure 7 with 2 supplements
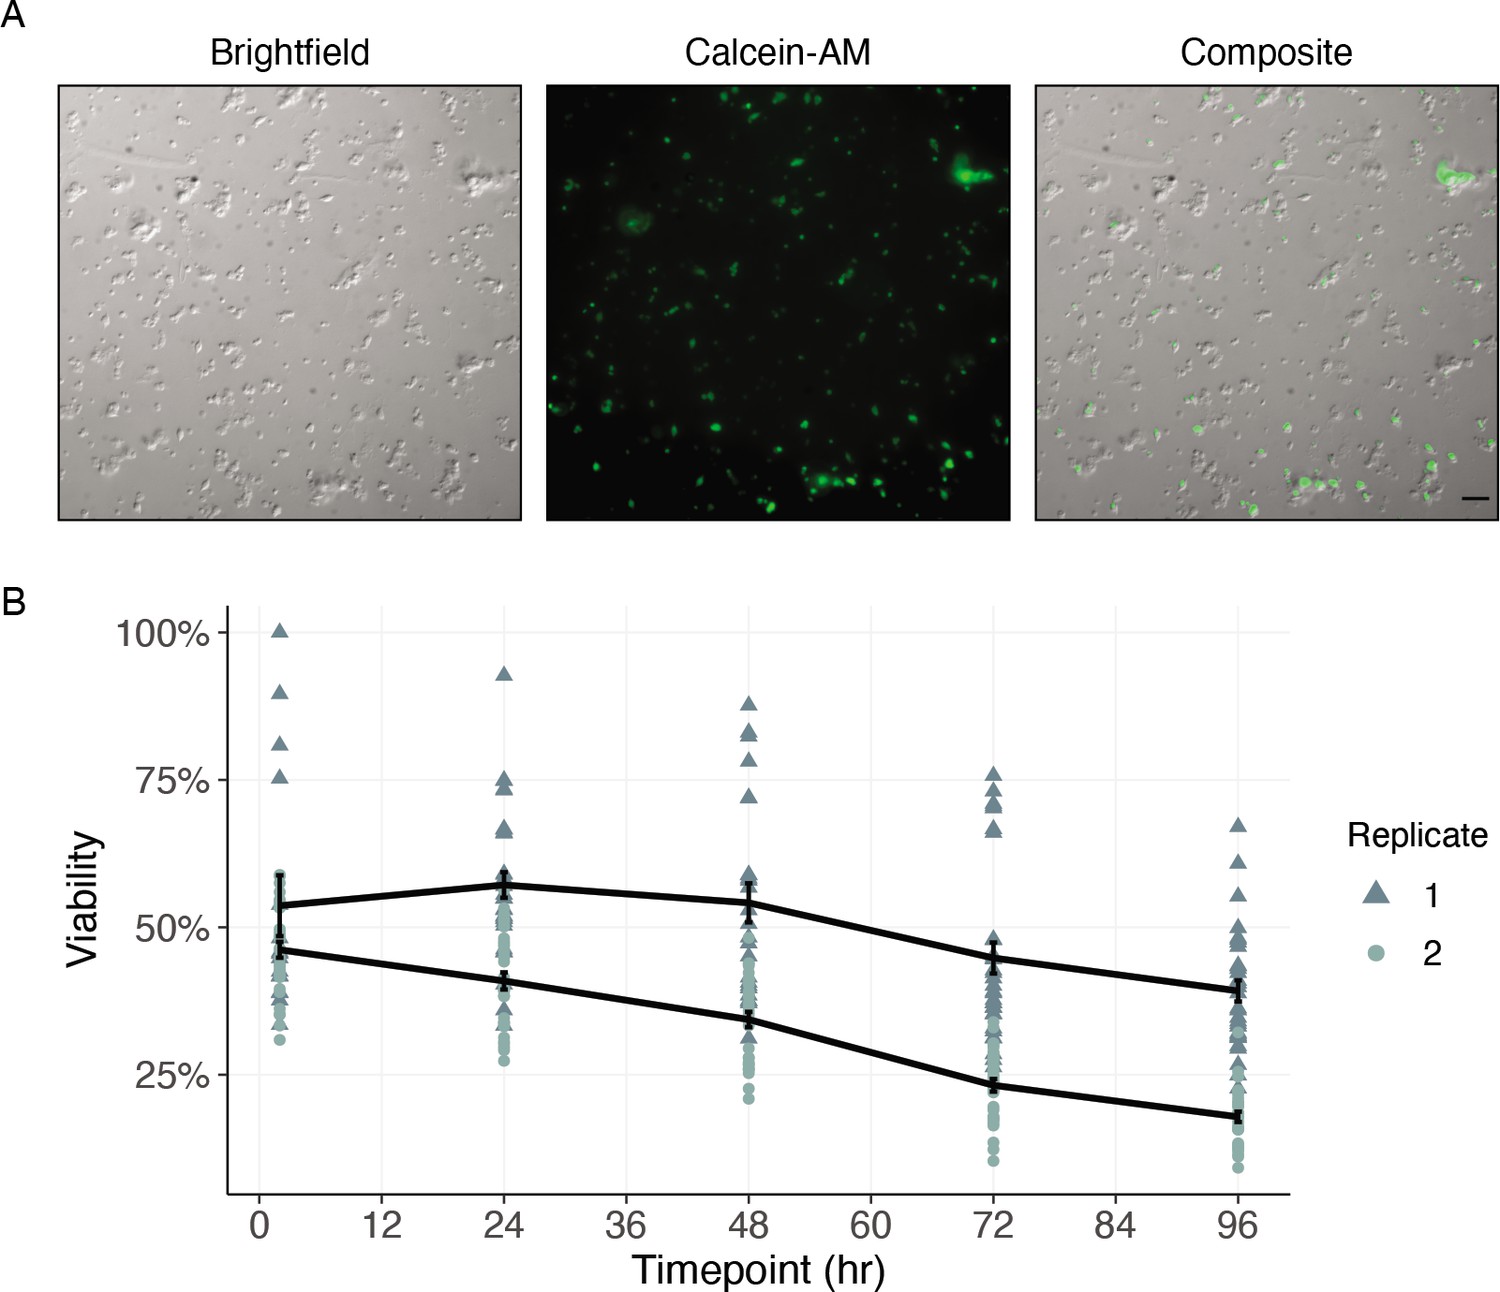
Cells of dispersed microfilaria are viable in culture 96 hr after dissociation.
(A) Differential interference contrast (DIC) and fluorescence microscopy of cells from microfilarial stage B. malayi parasites on peanut-lectin-coated slides after 24 hr incubation in culture medium. The cell population contains a range of cell sizes including single-cells and clustered cells and a subset of the cell population have protrusions indicating a muscle or neuronal cell type. Calcein fluorescence (live) with varying intensities of brightness indicates a range of viability among the cell population. Scale bar = 20 µm. (B) Quantification of cell viability over a period of 96 hr using DRAQ5 and Calcein-AM viability dyes. Black line represents the mean and standard error of viability per replicate.
Figure 7—figure supplement 1
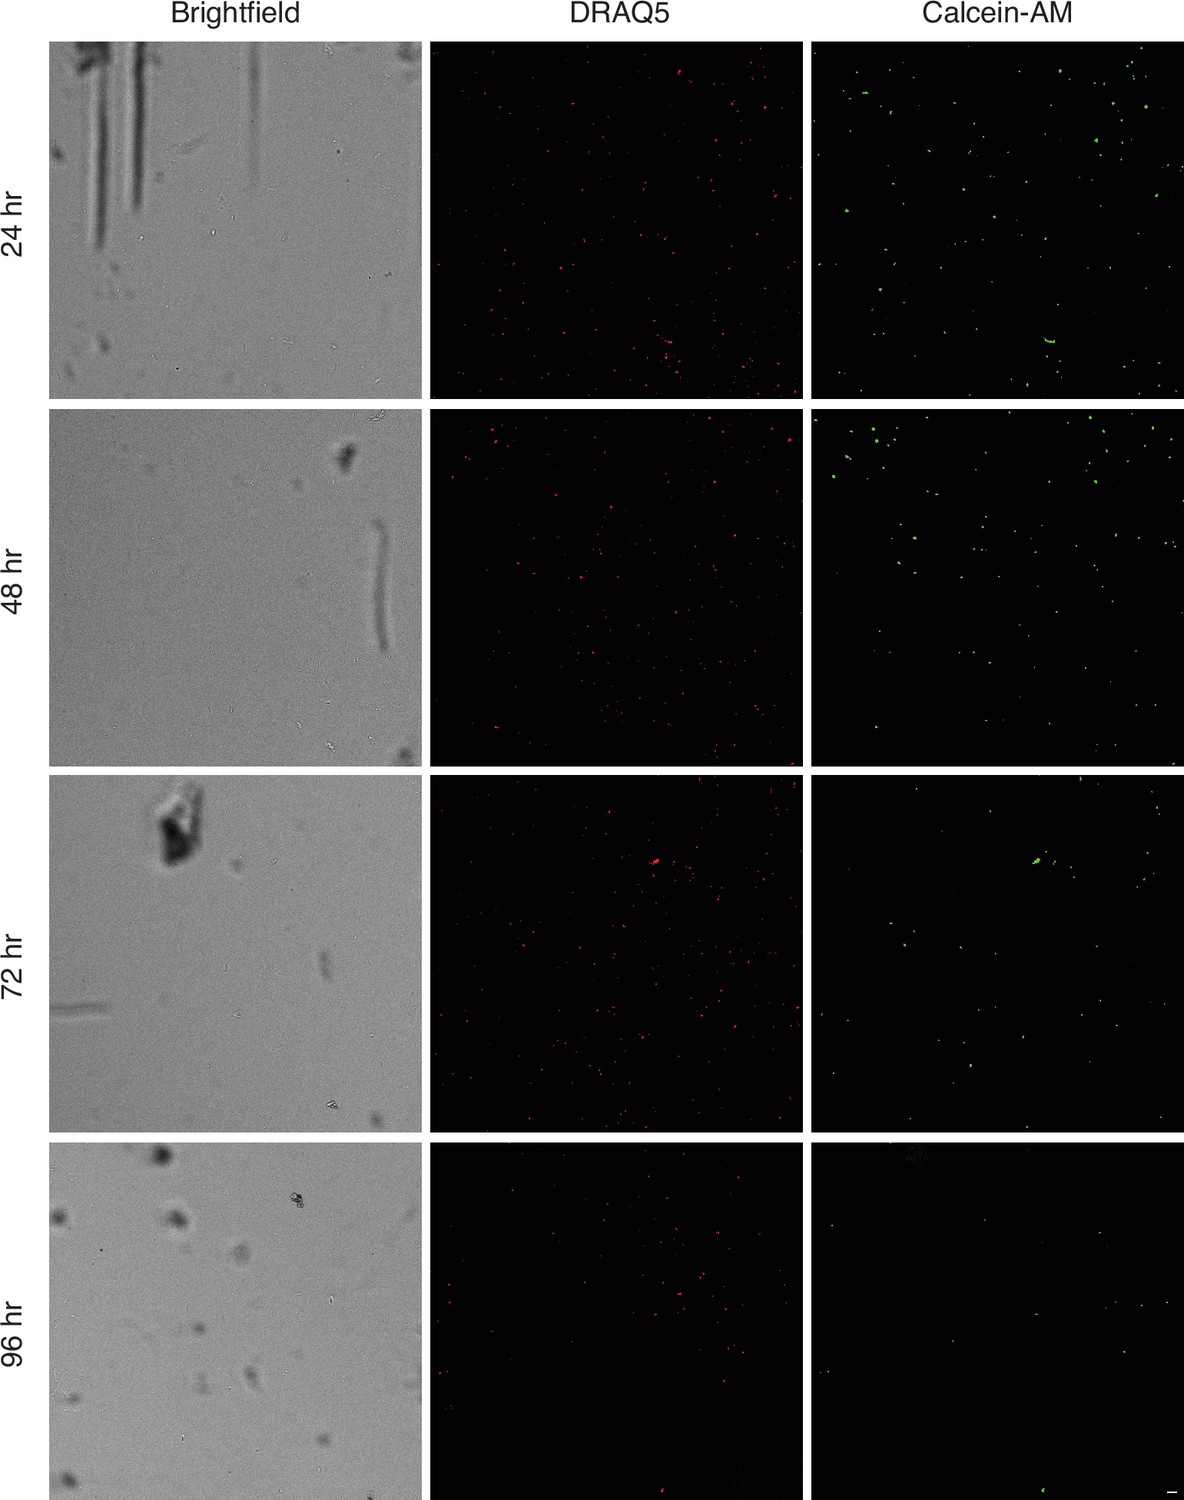
Representative images of cell viability over 96 hr.
DRAQ5 (red) indicates nucleated objects and Calcein-AM (green) fluorescence indicates viable cells. Scale bar = 20 µm.
Figure 7—figure supplement 2
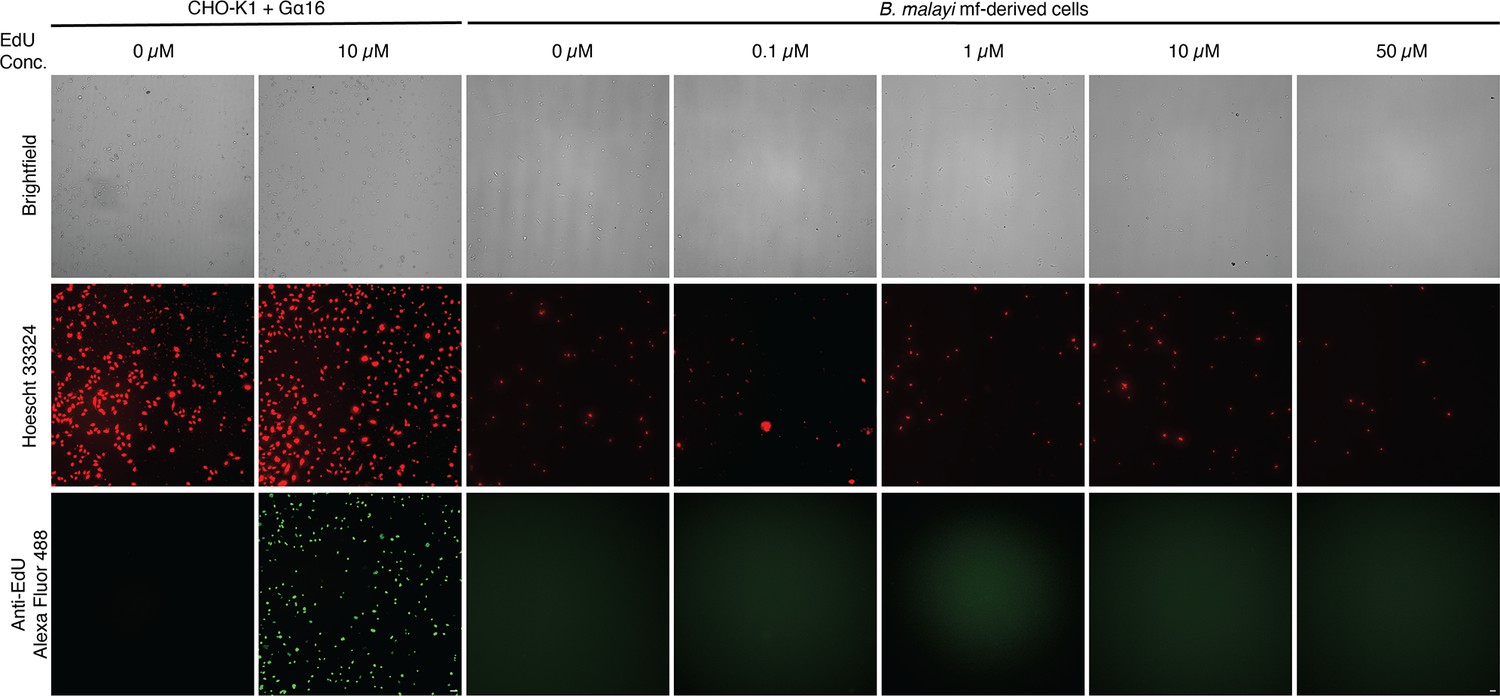
EdU cell proliferation assay of B.
malayi mf-derived cells and CHO-K1+Gα16 cells as a proliferating cell positive control. B. malayi cells were incubated with different EdU concentrations and EdU was detected using an anti-EdU Alexa Fluor 488 azide. No EdU incorporation is detected in the B. malayi cells indicating the dissociated cell suspensions are not proliferative in culture. Scale bars are 50 µm and 10 µm for CHO-K1+Gα16 and B. malayi cells, respectively.
Tables
Author response table 1
| Paper | Stage | UMIs/cell | genes/cell |
|---|---|---|---|
| Preston et al., 2019 | embryo | 156 | 52 |
| This study | mf | 267 (median) | 230 (median) |
| Cao et al., 2017 | L2 | 575 (median) 1,121 (mean) | 431 (mean) |
| Taylor et al., 2021 | L4 | 893 (median) | 321 (median) |
| Roux et al., 2022 | Adult | 2,175 | 644 |
Additional files
Download links
A two-part list of links to download the article, or parts of the article, in various formats.
Downloads (link to download the article as PDF)
Open citations (links to open the citations from this article in various online reference manager services)
Cite this article (links to download the citations from this article in formats compatible with various reference manager tools)
Resolving the origins of secretory products and anthelmintic responses in a human parasitic nematode at single-cell resolution
eLife 12:e83100.
https://doi.org/10.7554/eLife.83100


