Cerebrospinal fluid-contacting neuron tracing reveals structural and functional connectivity for locomotion in the mouse spinal cord
- Department of System Pathology for Neurological Disorders, Brain Research Institute, Niigata University, Japan
- Division of Anesthesiology, Niigata University Graduate School of Medical and Dental Sciences, Japan
- Section of Electron Microscopy, Supportive Center for Brain Research, National Institute for Physiological Sciences, Japan
- Department of Developmental and Regenerative Neurobiology, Institute of Brain Science, Nagoya City University Graduate School of Medical Sciences, Japan
- Center for Advanced Medicine and Clinical Research, Kashiwaba Neurosurgical Hospital, Japan
- Center for Integrated Human Brain Science, Niigata University, Japan
- Department of Anatomy, Division of Histology and Cell Biology, Jichi Medical University, School of Medicine, Japan
- Division of Ultrastructural Research, National Institute for Physiological Sciences, Japan
Figures
Figure 1 with 1 supplement
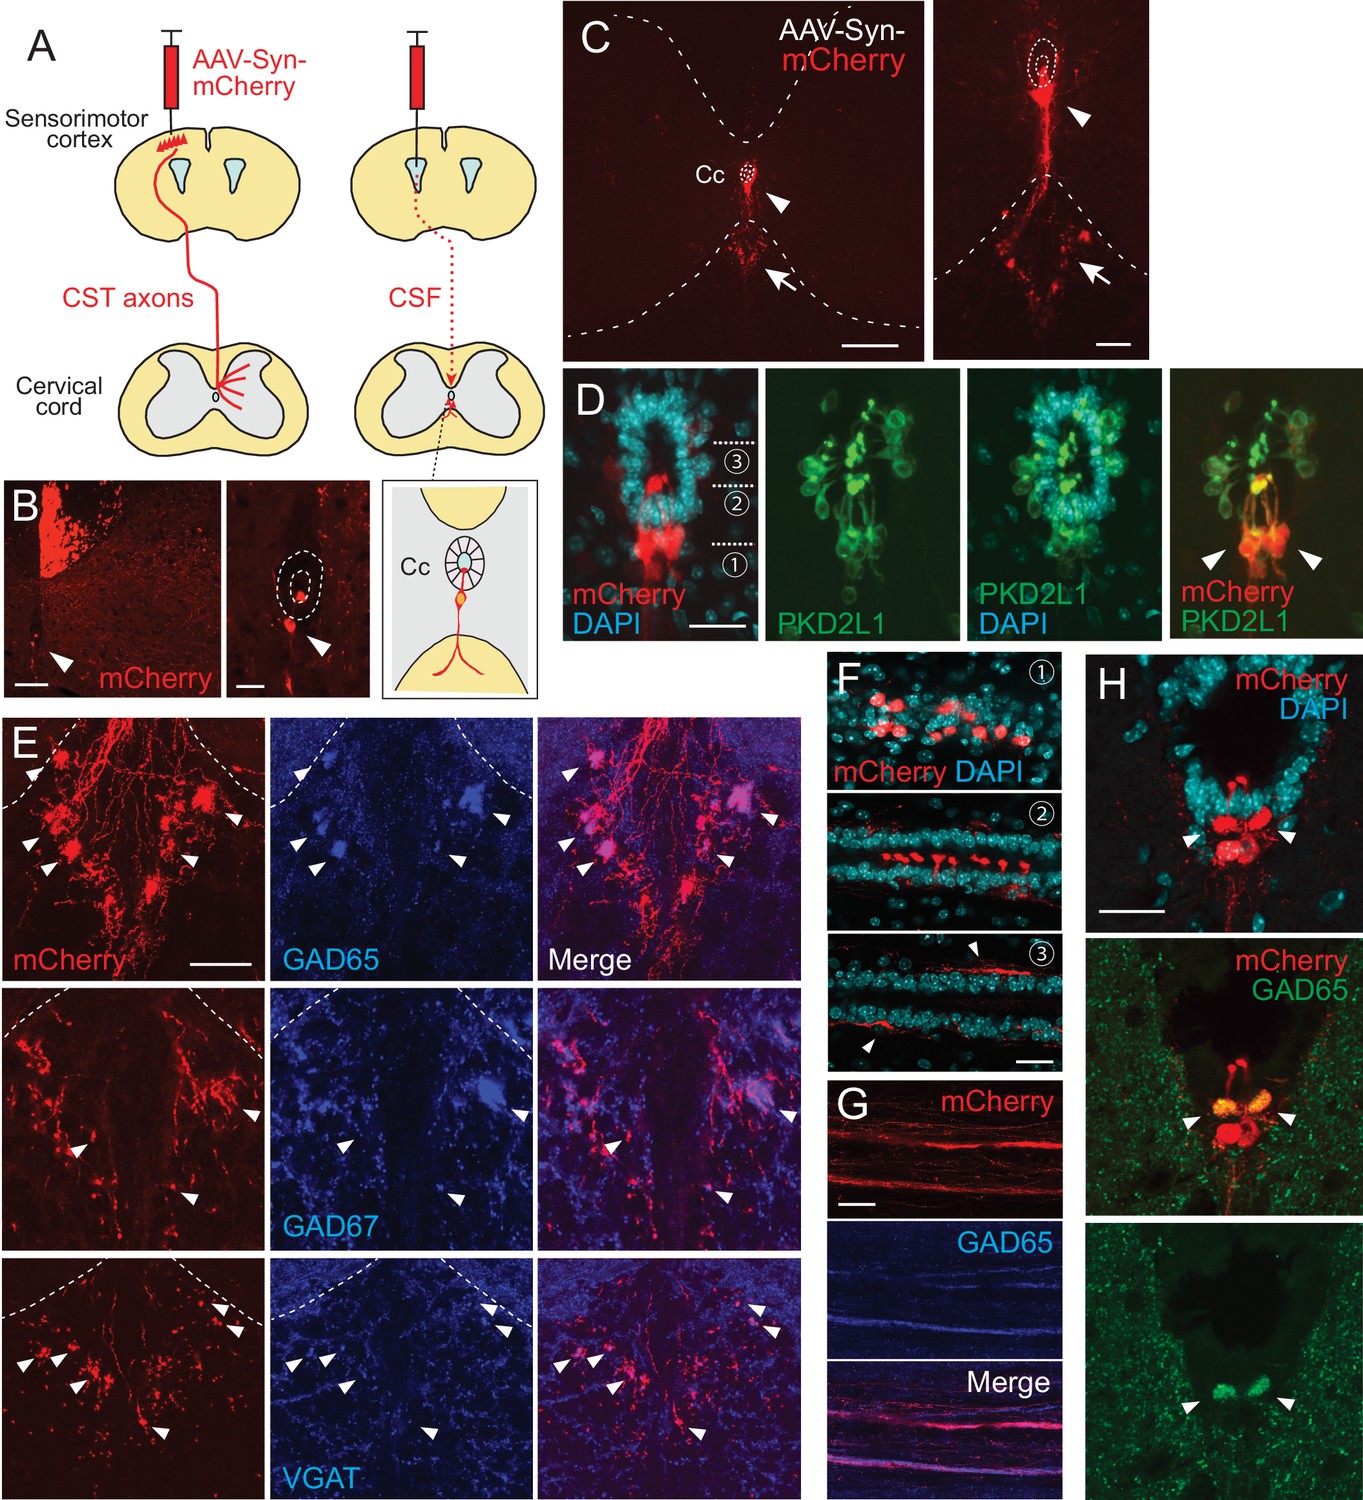
Intracerebroventricular injection of adeno-associated virus (AAV) with a neuron-specific promoter specifically labels cerebrospinal fluid-contacting neurons (CSF-cNs).
(A) Schema of AAV-Syn-mCherry injections into the sensorimotor cortex (left) or lateral ventricle (right). (B) mCherry-labeled neurons around the central canal (Cc) occasionally observed after cortical AAV injections, which were putatively labeled by AAV leaking into CSF (red, arrowhead). The right panel is a magnified view around the Cc (dotted lines). Note that abundant corticospinal tract (CST) axons are also labeled. (C) Representative transverse images of mCherry-labeled neurons around the Cc at the cervical level after an AAV injection into the lateral ventricle (red, arrowheads). The right panel is a magnified view around the Cc. Arrows represent mCherry+ fibers extending to the ventral funiculus. Dotted lines indicate Cc and the border between the gray and white matter. (D) Confocal views of mCherry-labeled neurons (red) around the Cc, co-expressing PKD2L1 (green), a marker of CSF-cNs (arrowheads). 4′,6-diamidino-2-phenylindole (DAPI), blue. (E) mCherry+ axon bundles extending into the ventral funiculus (red) with GAD65, GAD67, and VGAT signals (blue, arrowheads). Dotted lines indicate the border between the gray and white matter. (F) Horizontal views of mCherry+ CSF-cNs (red) in different planes of depths (1–3), which are indicated in (D). Confocal analyses. Arrowheads, subependymal fibers. (G) Horizontal views of mCherry+ axon bundles in the ventral funiculus (red), co-expressing GAD65 (blue). (H) Transverse images of mCherry+ axon bundles in the subependymal area, co-labeled with GAD65 (green, arrowheads). Scale bars, 100 µm (left panel of B); 25 µm (right panel of B, D, F); 200 µm (left panel of C); 50 µm (right panel of C, E, H).
Figure 1—figure supplement 1
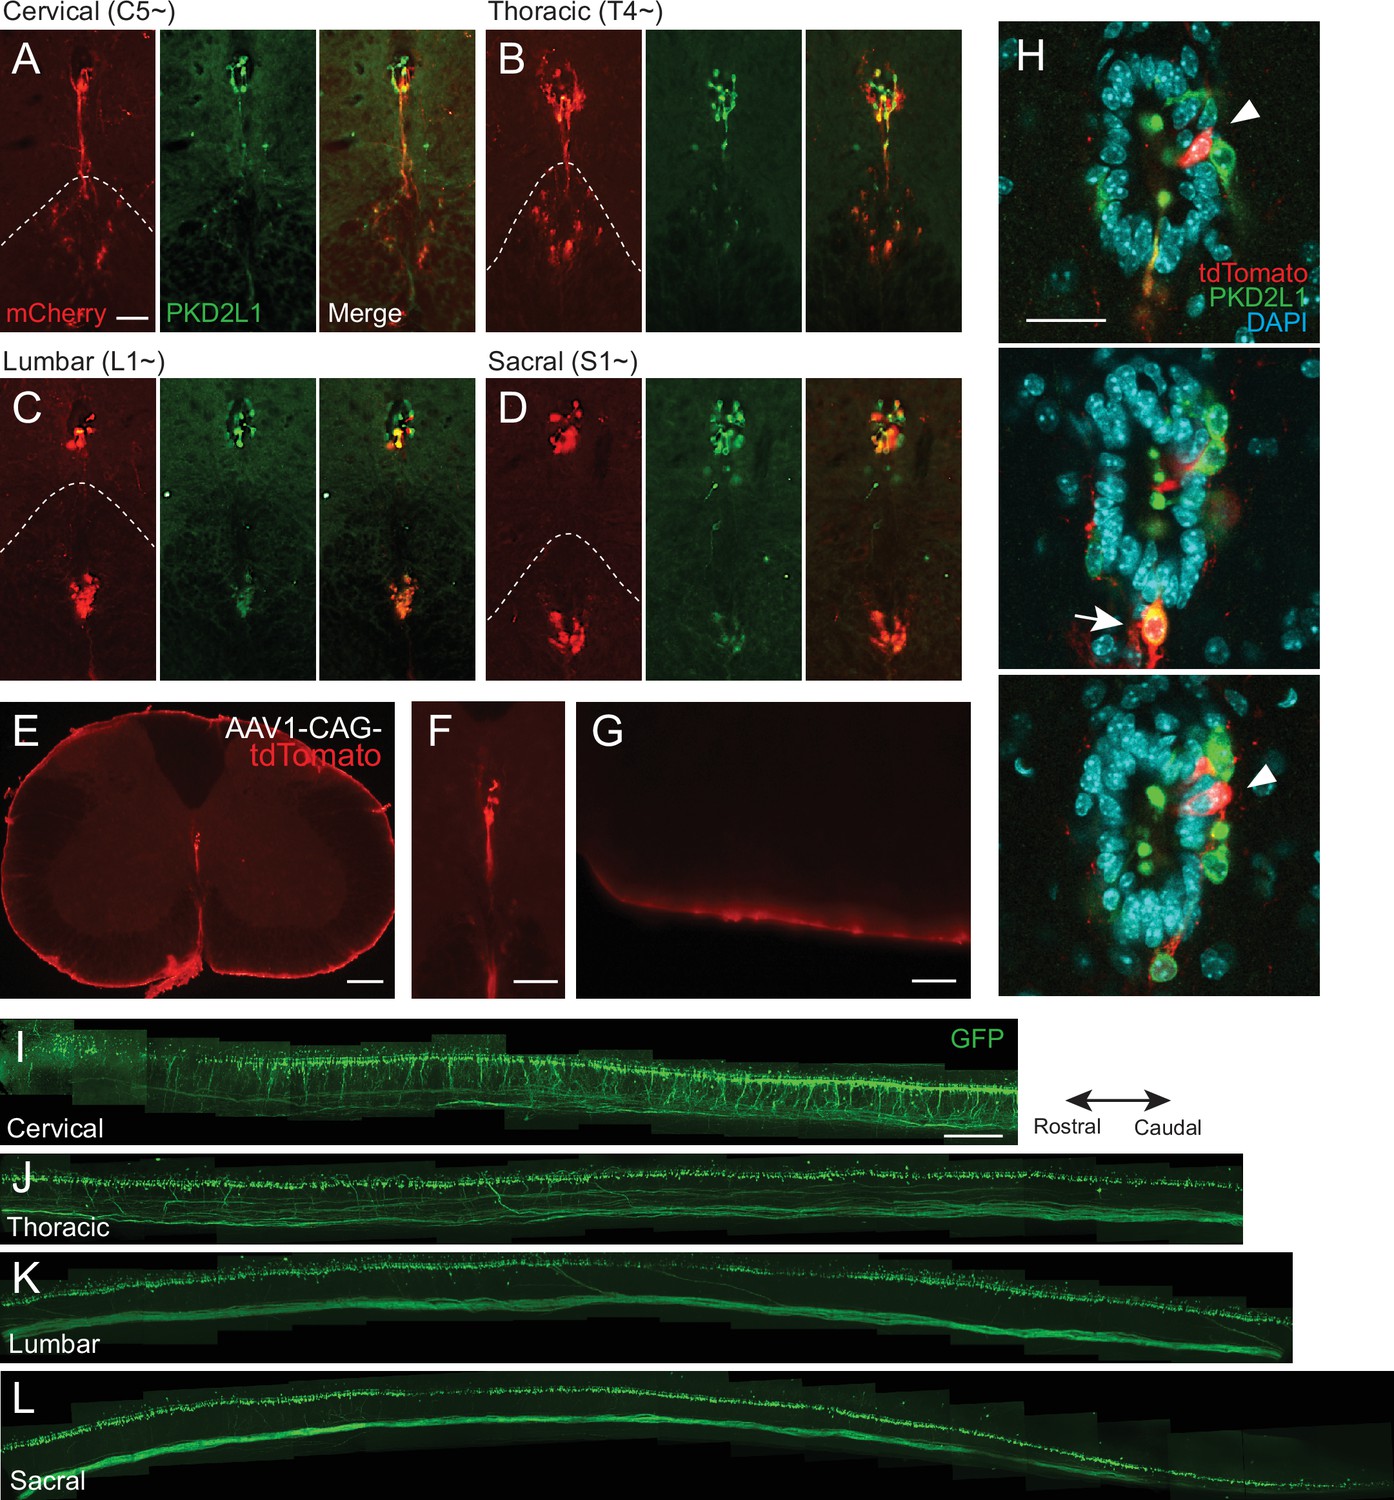
Specific labeling of cerebrospinal fluid-contacting neurons (CSF-cNs) by intracerebroventricular injections of adeno-associated virus (AAV).
(A–D) Representative images of AAV-Syn-mCherry labeled CSF-cNs and their fibers (red) in the ventral funiculus at the cervical (A), thoracic (B), lumbar (C), and sacral levels (D). PKD2L1, green. Dotted lines, the borders of gray and white matter. (E–H) Images of tdTomato+ cells (red) labeled by intracerebroventricular injection of AAV-CAG-tdTomato, representing expressions in the ependymal (F) and meningeal cells (G), in addition to CSF-cNs. Cervical level. (H) shows serial confocal views of tdTomato-labeled ependymal cells (arrowheads), as well as a CSF-cN (an arrow). PKD2L1, green; 4′,6-diamidino-2-phenylindole (DAPI), blue. (I–L) Representative images of GFP+ CSF-cNs and axon bundles (green) in the cervical (I), thoracic (J), lumbar (K), and sacral cord (L). Sagittal z-stack images of cleared spinal cord tissue of AAV-Syn-EGFP-injected mice, which were obtained by confocal microscopy. Scale bars, 50 µm (A–D, F, G); 200 µm (E); 25 µm (H); and 500 µm (I–L).
Figure 2 with 1 supplement
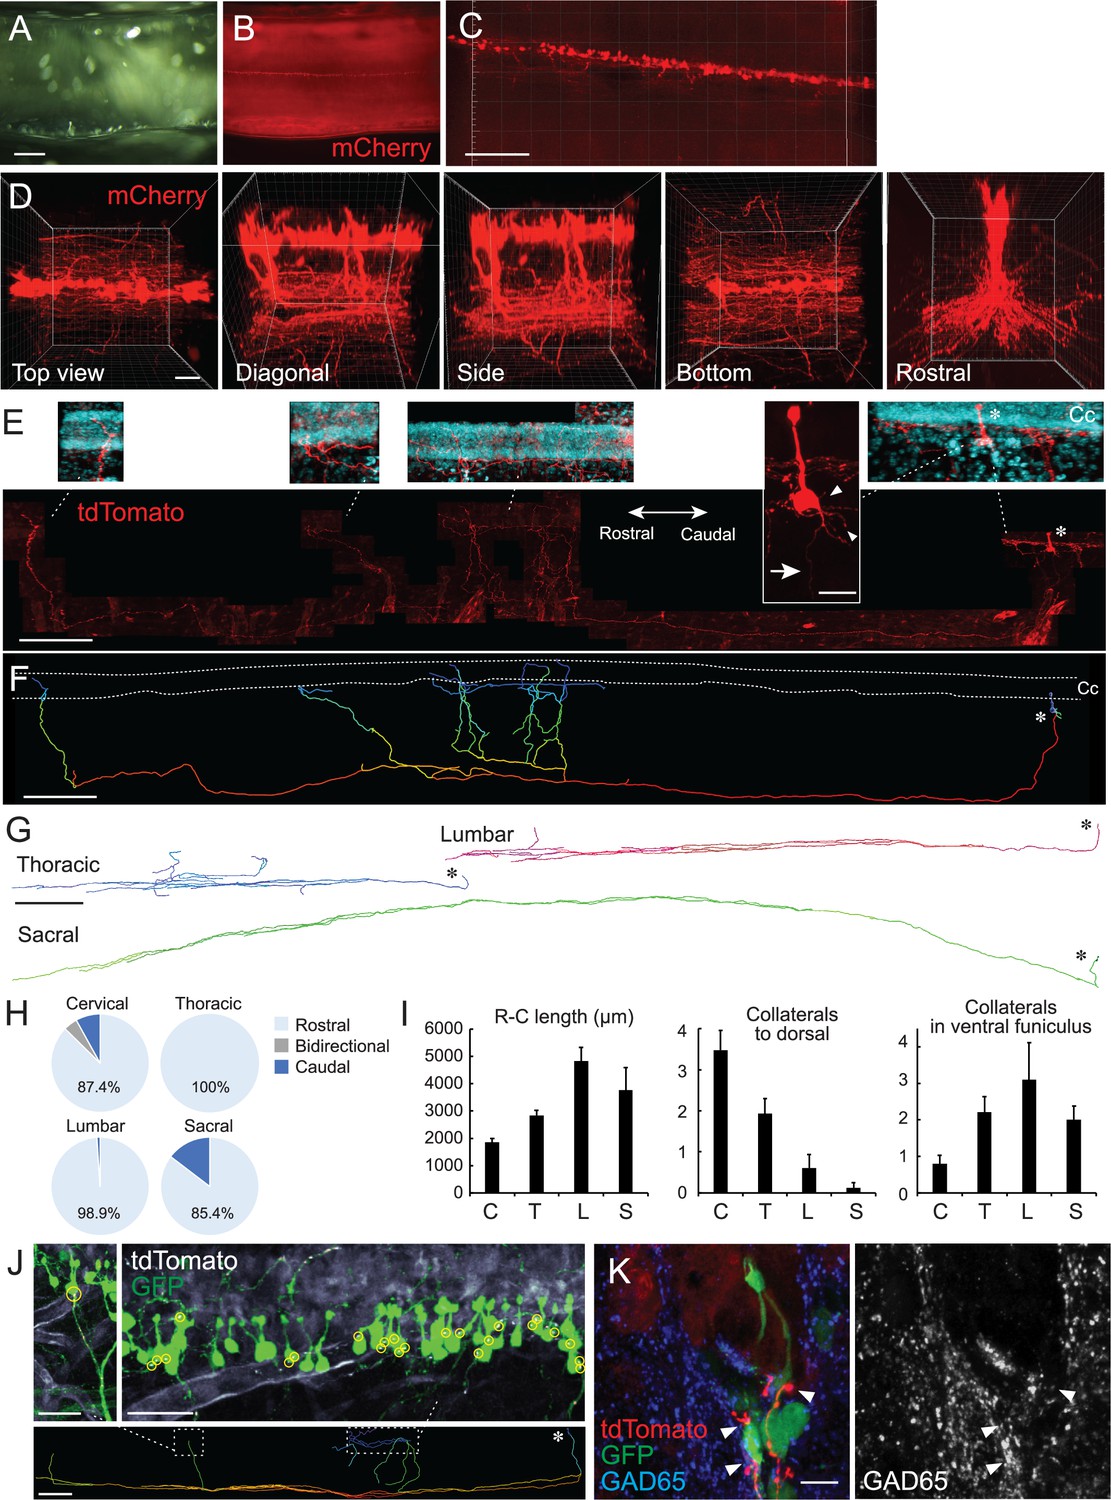
Single-cell tracing in a cleared spinal cord reveals structures and projection patterns of cerebrospinal fluid-contacting neurons (CSF-cNs).
(A, B) Clearing of adeno-associated virus (AAV)-Syn-mCherry-injected cervical cord with CUBIC. Cleared cervical cord (A) and a fluorescent image (B) shown in a side view under a stereomicroscope. (C, D) Z-stack confocal images of mCherry+ CSF-cNs (C), red, and higher magnification views from the top, diagonal, side, bottom, and rostral sides (D), representing aligned soma and their ventral to rostrocaudal axon projections. (E) Representative images of a single-cell traced tdTomato+ CSF-cN and its projections (red). A side view at the cervical level of Rosa26lsl-tdTomato mice injected with a low dose of AAV-Syn-Cre. Top panels depict higher magnification views of the tdTomato+ cell and its projections around the central canal (Cc). 4′,6-diamidino-2-phenylindole (DAPI; blue). Arrow, axon; arrowheads, basal dendrites; asterisks, cell bodies. Left, rostral; right, caudal. (F) A reconstructed IMARIS image of the single-cell traced CSF-cN in (E). Dotted lines, Cc; asterisk, cell body. (G) Representative reconstructed images of single-cell traced CSF-cNs in the thoracic, lumbar, and sacral levels. Asterisks, cell bodies. (H) Pie charts representing the ratio of CSF-cNs comprising rostral, caudal, or bidirectional axon projections (cervical, n=87; thoracic, n=109; lumbar, n=95; sacral, n=41). (I) Rostrocaudal axonal lengths in the ventral funiculus and the number of collaterals projecting in dorsal and rostral directions in the ventral funiculus. Cervical (C), n=25; thoracic (T), n=28; lumbar (L), n=10; sacral (S), n=8; the mean ± standard error of the mean (SEM). (J) tdTomato+ axons of single-cell traced CSF-cNs (white) contacting onto other GFP+ CSF-cNs (green), labeled with a high-dose of AAV-Syn-EGFP injection. Contact areas are indicated in yellow circles. Images in the upper panels are of the dotted areas in the bottom IMARIS-reconstructed image. (K) tdTomato+ axons of single-cell traced CSF-cNs (red) contacting the soma of other GFP+ CSF-cNs (green) with a presynaptic marker GAD65 (blue, left; white, right; arrowheads). Scale bars, 500 µm (A, B); 200 µm (C), lower panel of (E), (F), lower panel of (J); 50 µm (D); 20 µm (upper panel of E); 500 µm (G); 50 µm (upper panels of J); 10 µm (K).
-
Figure 2—source data 1
Raw data for direction, length, and collaterals of CSF-cN projections.
- https://cdn.elifesciences.org/articles/83108/elife-83108-fig2-data1-v1.xlsx
Figure 2—figure supplement 1

Projections of single-cell traced cerebrospinal fluid-contacting neurons (CSF-cNs).
(A) Representative images of single-cell traced tdTomato+ CSF-cNs (white) at the cervical level of Rosa26lsl-tdTomato mice injected with a low dose of adeno-associated virus-Syn-Cre. 4′,6-diamidino-2-phenylindole (DAPI), blue. Projections of four CSF-cNs were traced by IMARIS software (indicated in different colors) and are shown in the lower panels. Asterisks indicate cell bodies. Left, rostral; right, caudal. (B–E) Examples of projections of single-cell traced CSF-cNs in the cervical (B), thoracic (C), lumbar (D), and sacral cords (E). (F) Examples of single-cell tracing in IMARIS reconstructed images, showing that most of the CSF-cNs project rostrally. A minor population of CSF-cNs project bidirectionally (orange) or caudally (green). Note that axons could not be traced until the terminals in the samples were labeled in relatively dense numbers, but the direction of projections could be assessed. Two representative samples of the cervical, thoracic, and lumbar levels and one sample of the sacral level are shown. Scale bars, 500 µm (A–E); 1500 µm (F).
Figure 3 with 1 supplement
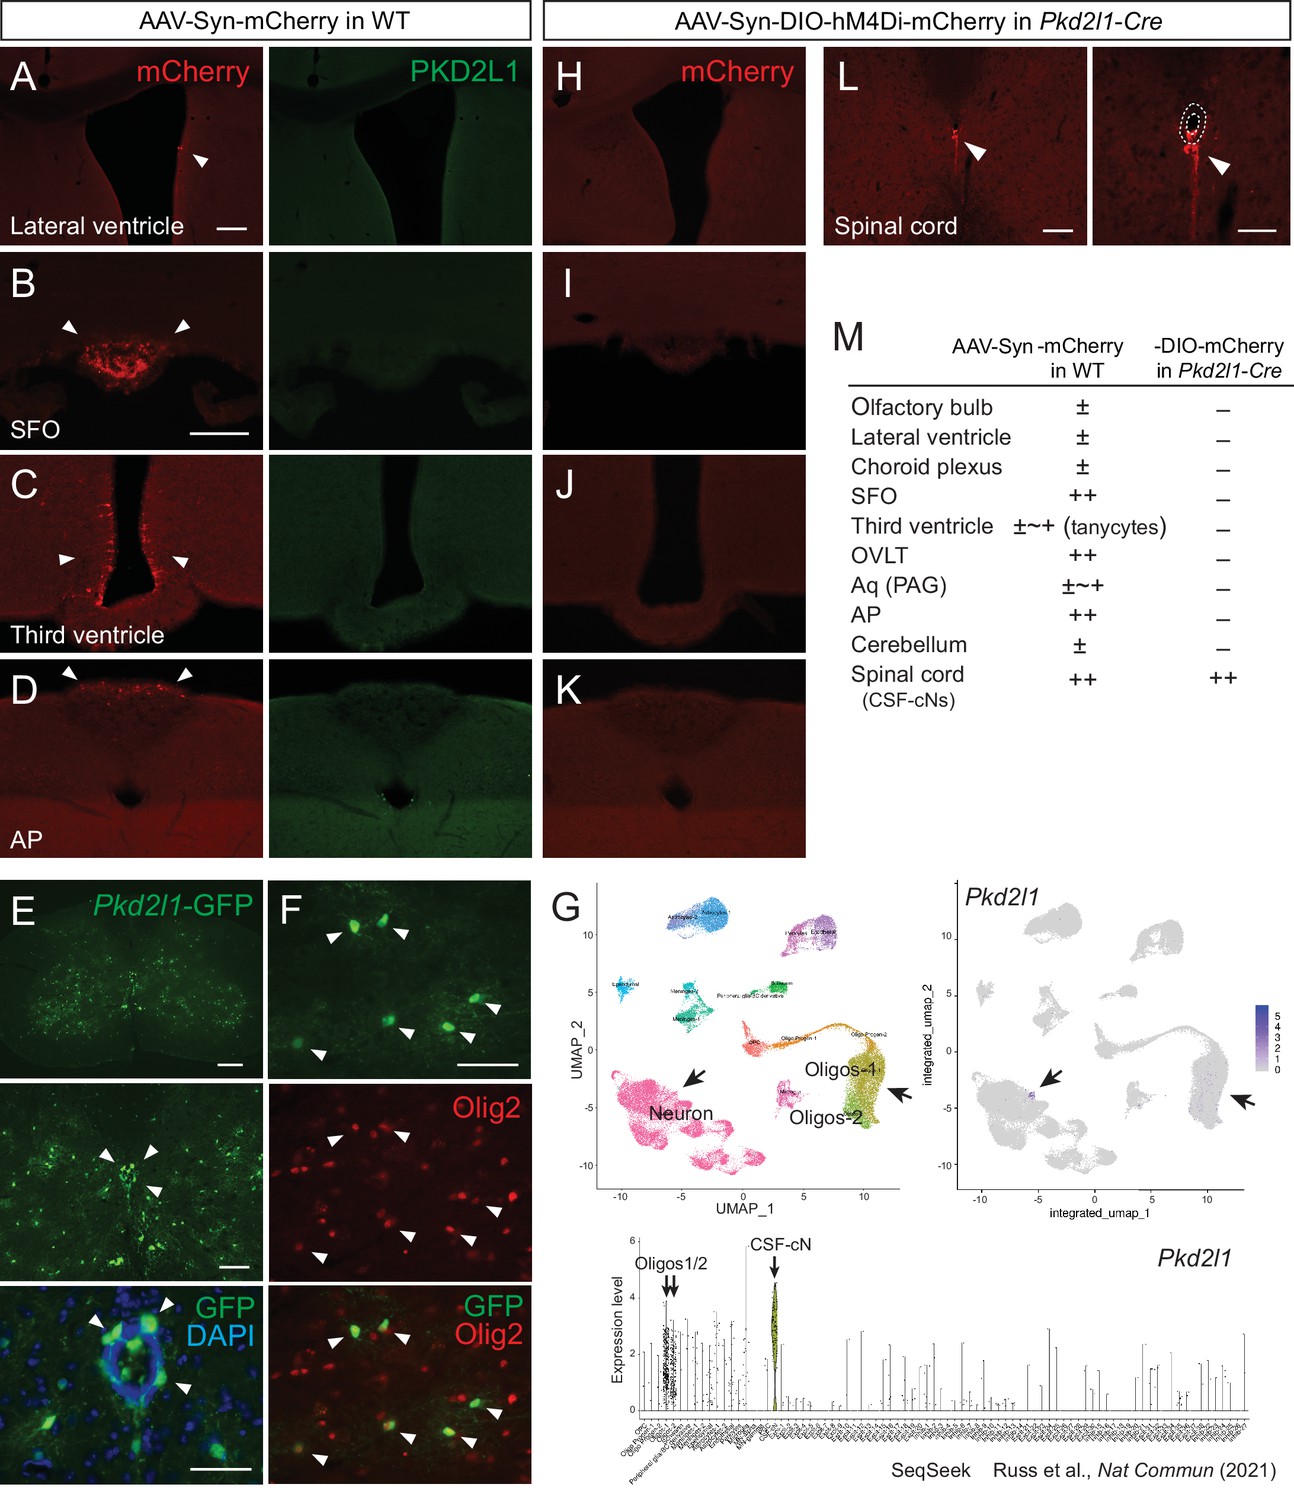
Injection of adeno-associated virus (AAV)-Syn-DIO construct into Pkd2l1-Cre mice increases labeling specificity of cerebrospinal fluid-contacting neurons (CSF-cNs).
(A–D) mCherry labeled cells (red, arrowheads) in the lateral ventricle (A), SFO (B), third ventricle (C), and AP (D) following AAV-Syn-mCherry intracerebroventricular injection into wild-type (WT) mice. No PKD2L1 expression (green) was observed in these regions. (E, F) GFP+ signals in the CSF-cNs (E), green, arrowheads and Olig2+ oligodendrocytes (F), red, arrowheads in the spinal cord of an adult Pkd2l1-Cre;CAG-lcl-EGFP mouse. 4′,6-diamidino-2-phenylindole (DAPI), blue. (G) Single-cell/nucleus RNA-seq data in SeqSeek database (https://seqseek.ninds.nih.gov/home, Russ et al., 2021) represent Pkd2l1 mRNA expression in CSF-cNs and a subpopulation of oligodendrocytes. Upper panels show a uniform manifold approximation and projection (UMAP) plot of spinal cord single-cell/nucleus RNA-seq data (left), and feature plots highlight Pkd2l1 expression in spinal cells (violet, right). The bottom panel depicts violin plots representing Pkd2l1 expression levels in spinal cell types. (H–K) mCherry-labeled cells (red, arrowheads) in the lateral ventricle (H), SFO (I), third ventricle (J), AP (K), and cervical cord (L) following AAV-Syn-DIO-hM4Di-mCherry intracerebroventricular injection into Pkd2l1-Cre mice. The right image of (L) is a higher magnification view around the central canal (dotted lines). (M) Summary of AAV-Syn-mCherry and -DIO-hM4Di-mCherry-labeled cells in the brain and spinal cord of WT and Pkd2l1-Cre mice, respectively. Scale bars, 100 µm (A, B); 200, 100, 50 µm (upper to bottom in E); 50 µm (F); 100, 50 µm (left, right in L). AP, area postrema; Aq, cerebral aqueduct; OVLT, vascular organ of the lamina terminalis; PAG, periaqueductal gray; SFO, subfornical organ.
-
Figure 3—source data 1
Summary of adeno-associated virus-Syn-mCherry and -DIO-hM4Di-mCherry-labeled cells in the brain and spinal cord of wild-type and Pkd2l1-Cre mice (related to Figure 3M).
- https://cdn.elifesciences.org/articles/83108/elife-83108-fig3-data1-v1.xlsx
Figure 3—figure supplement 1

Adeno-associated virus (AAV)-Syn-DIO injections into Pkd2l1-Cre mice do not label ventricular cells in the brain.
(A–D) mCherry-labeled cells (red, arrowheads) in the third ventricle (A), OVLT (B), Aq (PAG) (C), and cerebellum (D) following intracerebroventricular AAV-Syn-mCherry injection into wild-type (WT) mice. No PKD2L1 (green) expression was observed in these regions. (E–H) Absence of mCherry-labeled cells in the third ventricle (E), OVLT (F), Aq (PAG) (G), and cerebellum (H) following intracerebroventricular AAV-Syn-DIO-hM4Di-mCherry injection into Pkd2l1-Cre mice. Scale bar, 100 µm (A). Aq, cerebral aqueduct; OVLT, vascular organ of the lamina terminalis; PAG, periaqueductal gray.
Figure 4 with 1 supplement
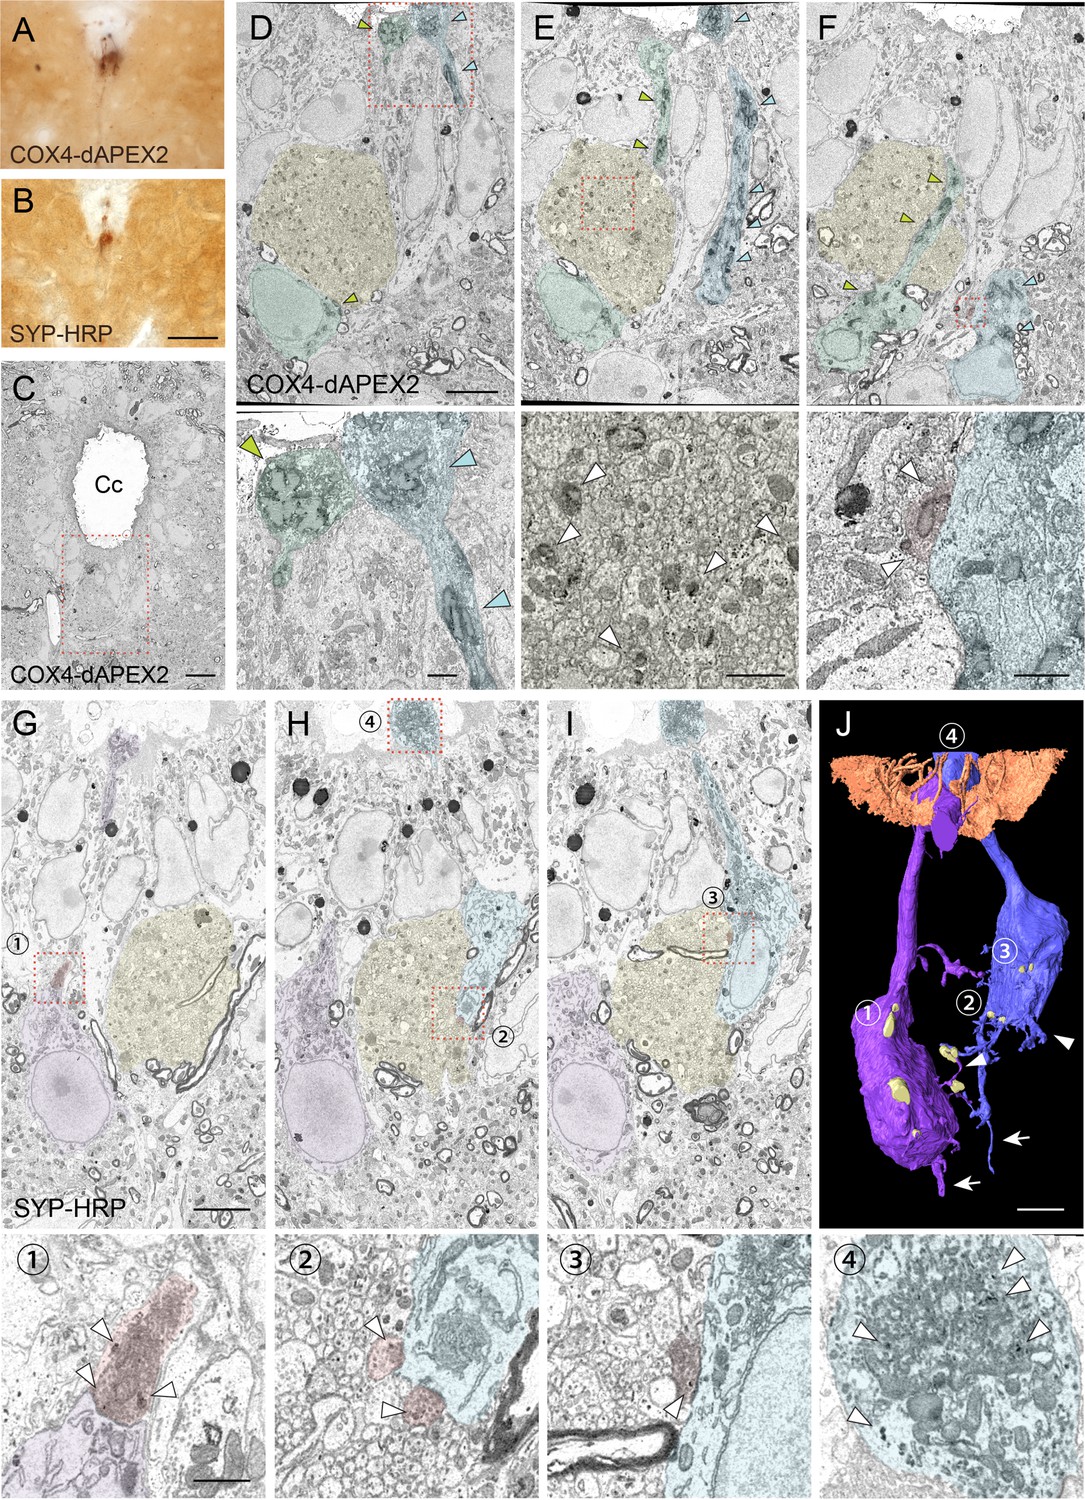
Serial block-face scanning electron microscopy (SBF-SEM) analyses with COX4-dAPEX2 and SYP-HRP labeling reveal structures and recurrent connections of cerebrospinal fluid-contacting neurons (CSF-cNs).
(A, B) Representative light microscopic images of 3, 3'-diaminobenzidine (DAB)-stained spinal cord sections of Pkd2l1-Cre mice with injection of adeno-associated virus (AAV)-Syn-DIO-COX4-dAPEX2 (A) or AAV-Syn-DIO-SYP-HRP (B). (C) A low-magnification electron microscopic image of the cervical cord around the central canal (Cc) in Pkd2l1-Cre mice injected with AAV-Syn-DIO-COX4-dAPEX2. The dotted area was subjected to SBF-SEM analyses and is shown in (D–F). (D–F) Representative serial (the 130th, 148th, and 186th) SBF-SEM images of the COX4-dAPEX2-labeled sample. High-magnification images of the dotted areas in the upper panels are shown in the bottom panels, which represent dendritic bulbs (D), subependymal axon bundles (E), and a synaptic contact (F) that include DAB-positive mitochondria. COX4-dAPEX2+ CSF-cNs are pseudo-colored in green and blue; the subependymal unmyelinated axon bundle in yellow; the presynaptic terminal in red. Arrowheads indicate DAB-positive mitochondria labeled with COX4-dAPEX2. (G–I) Representative serial SBF-SEM images (the 173th, 224th, and 249th) of the SYP-HRP-labeled sample in the ventral part of Cc in the cervical cord. High-magnification images of the dotted areas in the top panels are shown in the bottoms, which represent synaptic contacts (1–3), and a dendritic bulb (4) containing SYP-HRP+ vesicles. SYP-HRP+ CSF-cNs are pseudo-colored in purple and blue; the subependymal axon bundle in yellow; the presynaptic terminals in red. Arrowheads, SYP-HRP+ vesicles. (J) Three-dimensional reconstruction of SYP-HRP+ CSF-cNs and presynaptic terminals (yellow), represented in (G–I). The numbers 1–4 indicate the positions shown in (G–I). Microvilli and cilia of ependymal cells are represented in brown to show the surface of the Cc. Arrows, axons; arrowheads, basal dendrites. Scale bars, 50 µm (A, B); 10 µm (C); 5 µm (upper panels of D–J); 1 µm (bottom panels of D–I).
Figure 4—figure supplement 1
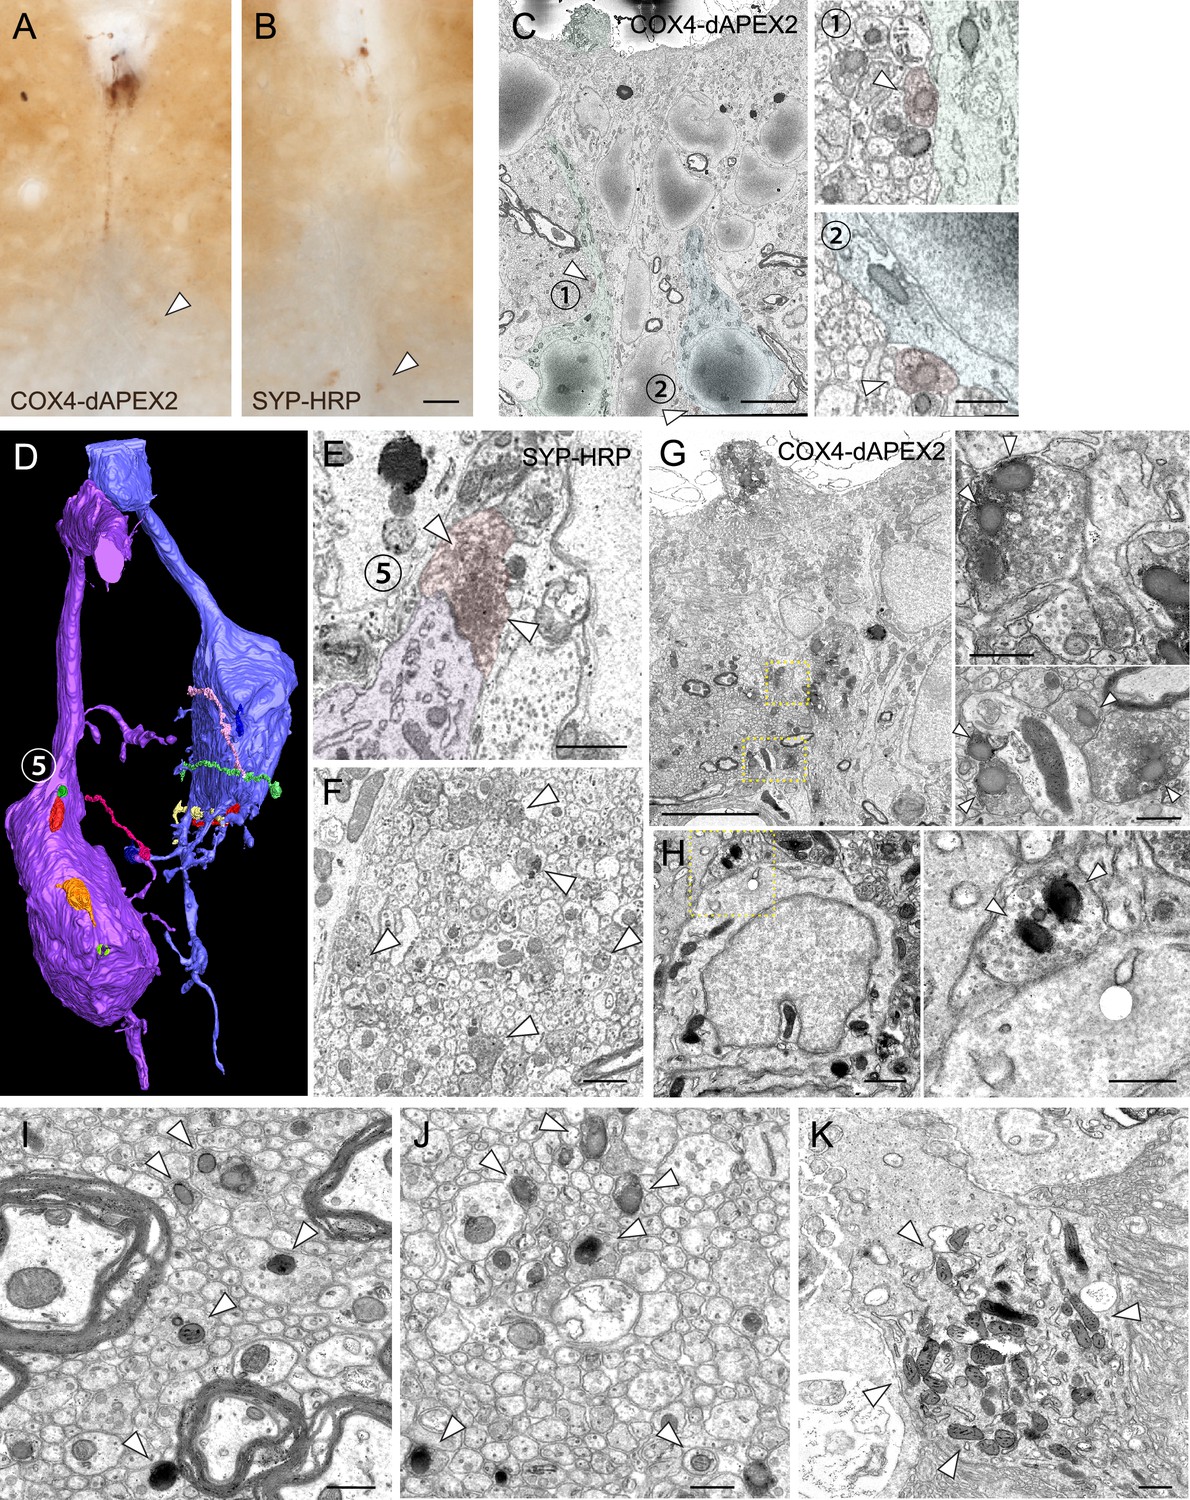
Serial block-face scanning electron microscopy (SBF-SEM) and transmission electron microscope (TEM) analyses in the spinal cord of Pkd2l1-Cre mice injected with adeno-associated virus (AAV)-Syn-DIO-COX4-dAPEX2 and SYP-HRP.
(A, B) Representative images of cerebrospinal fluid-contacting neurons (CSF-cNs) labeled with COX4-dAPEX2 (A) and SYP-HRP (B) following AAV-Syn-DIO-COX4-dAPEX2 and -DIO-SYP-HRP intracerebroventricular injection in Pkd2l1-Cre mice, respectively. 3, 3'-Diaminobenzidine-staining. Arrowheads indicate signals in the ventral bundle. (C) Other representative SBF-SEM images of the COX4-dAPEX2-labeled sample, representing presynaptic terminals containing COX4-dAPEX2+ mitochondria (red, arrowheads) onto COX4-dAPEX2+ CSF-cNs (green and blue) at the cervical level. Right panels (1, 2) are magnified views of the positions 1 and 2 in the left panel. (D) Three-dimensional reconstruction image of SYP-HRP+ CSF-cNs (modified from Figure 4J to illustrate axon innervations), indicating another synaptic contacts site (5). (E) SBF-SEM images of presynaptic terminals containing SYP-HRP+ vesicles onto CSF-cNs, at position 5 in (D). (F) Unmyelinated axons containing SYP-HRP+ vesicles in the subependymal bundle at the cervical level (arrowheads). (G, H) TEM analyses of COX4-dAPEX2-labeled cervical (G) and thoracic cord (H), representing synaptic terminals containing COX4-dAPEX2+ mitochondria (arrowheads) onto COX4-dAPEX2+ cell body. Right panels are magnified images of yellow dotted areas in the left panels. (I, J) TEM images of COX4-dAPEX2-labeled unmyelinated axons (arrowheads) in the bundle of ventral funiculus at the thoracic level (I) and subependymal bundle at the cervical level (J). (K) Representative TEM images of a COX4-dAPEX2-labeled dendritic bulb (arrowheads). Scale bars, 50 µm (A, B); 5 µm (left panel of C) and (G), 0.5 µm (left and right panel, (C); 1 µm (E), (F), left panel of H); 0.5 µm (right panels of G) and (H, I, J, K).
Figure 5
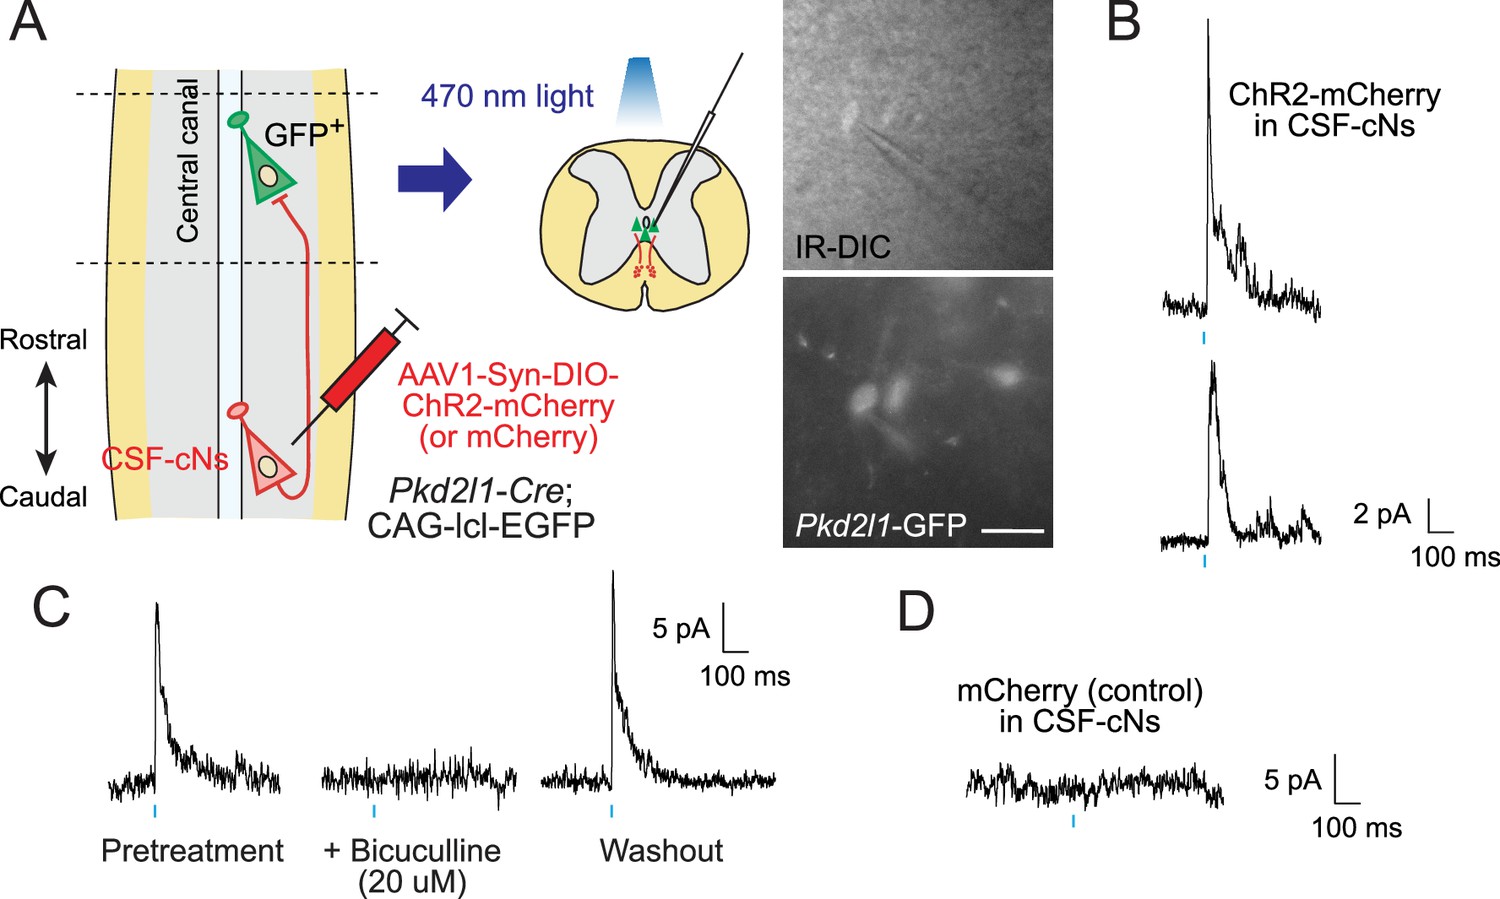
Electrophysiological recording with optogenetic stimulation reveals recurrent cerebrospinal fluid-contacting neuron (CSF-cN) connections.
(A) Diagram of electrophysiological recording of Pkd2l1-GFP+ CSF-cNs and blue light stimulation of ChR2-mCherry+ axons of caudally located CSF-cNs in spinal slices of Pkd2l1-Cre;CAG-lcl-EGFP mice. ChR2-mCherry was introduced by local injection of adeno-associated virus (AAV)-Syn-DIO-ChR2-mCherry (or AAV-Syn-DIO- mCherry for controls) into the caudal thoracic cord. The right panels are images of patched Pkd2l1-GFP+ CSF-cNs. Scale bar, 25 µm. (B) Representative inhibitory postsynaptic current (IPSC) responses of two recorded Pkd2l1-GFP+ CSF-cNs evoked by a blue light stimulation (10 ms, blue). (C) Representative IPSCs of Pkd2l1-GFP+ CSF-cN, blocked under 20 µM bicuculline treatment. (D) No IPSCs were evoked in the control spinal cord injected with AAV-Syn-DIO-mCherry. Blue bars indicate blue light pulses.
Figure 6 with 1 supplement
Cerebrospinal fluid-contacting neuron (CSF-cN) connections with premotor and motor neurons in the spinal cord.
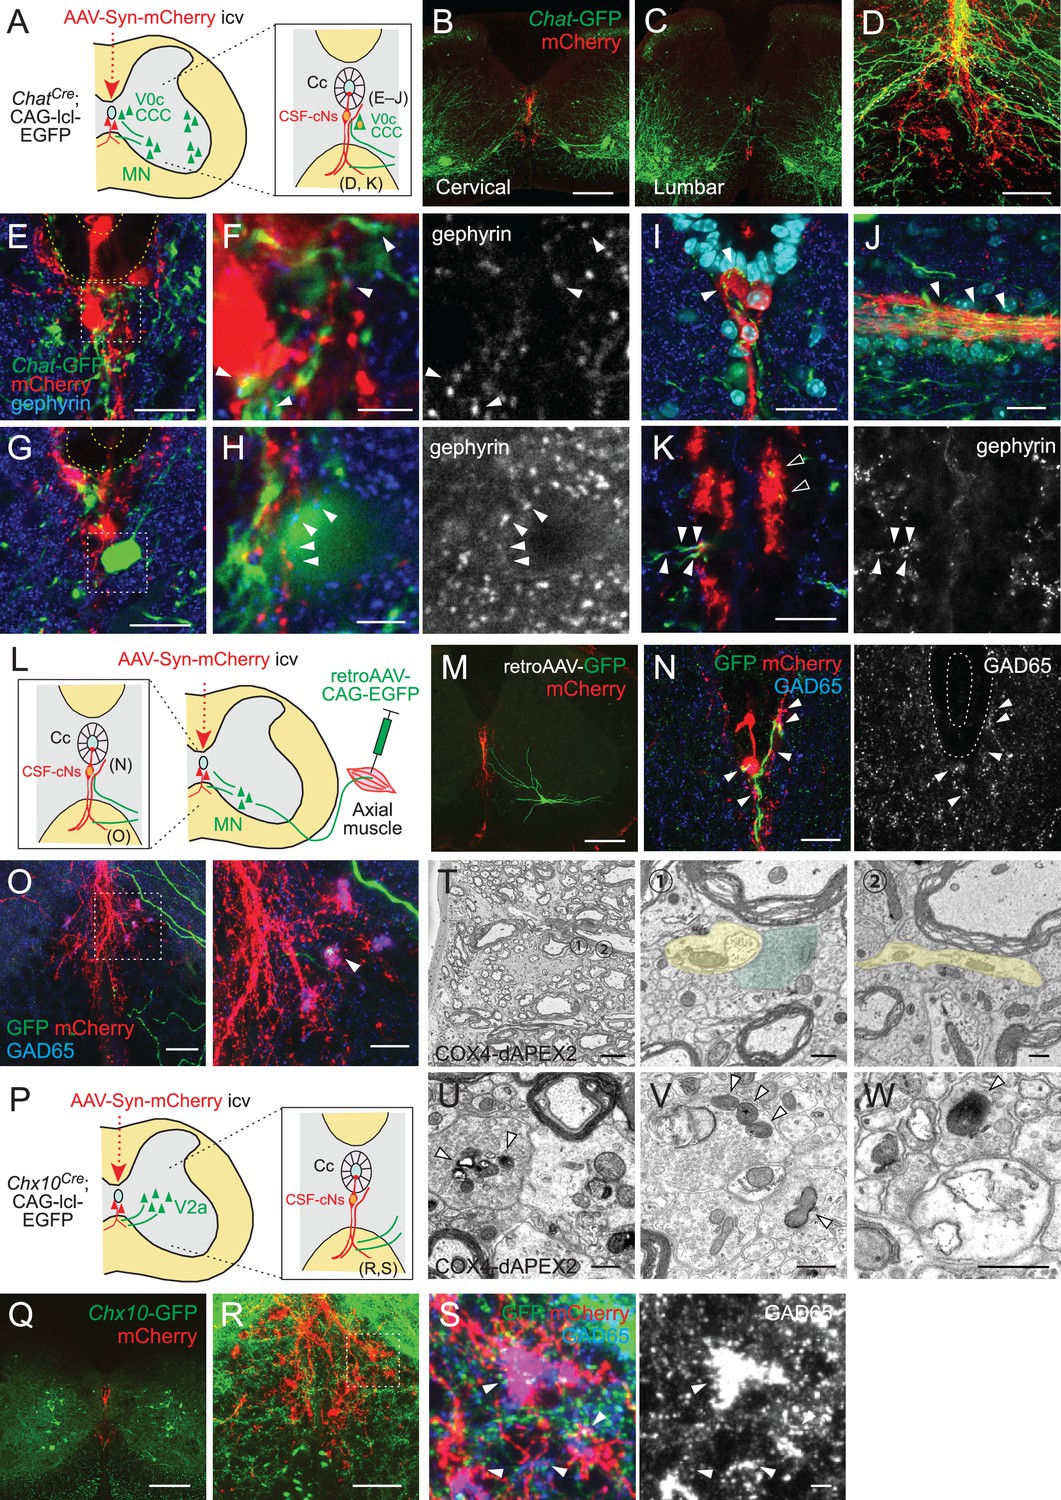
(A) Diagram of Chat-GFP+ cholinergic neurons and adeno-associated virus (AAV)-Syn-mCherry labeled CSF-cNs in ChatCre;CAG-lcl-EGFP mice. Cc, central canal; CCC, central canal cluster cells; MN, motor neuron. Image positions of (D–K) are indicated in the right panel. (B, C) Representative images of mCherry+ CSF-cNs (red) and Chat-GFP+ neurons (green) in the cervical (B) and lumbar cord (C) of ChatCre;CAG-lcl-EGFP mice. (D) A magnified image of Chat-GFP+ (green) and mCherry+ fibers (red), which are intermingled at the ventral midline and ventral funiculus of the cervical cord. The dotted line indicates the border between the gray and white matter. (E, F) Chat-GFP+ neurites (green) extend near the central canal (yellow dotted lines) (E), and those with gephyrin+ puncta (blue and white, arrowheads) are contacted by mCherry+ CSF-cN fibers (red) (F). (F) is a magnified view of the white dotted area in (E). (G, H) Chat-GFP+ interneuron (green) near the central canal (yellow dotted lines) is contacted by mCherry+ CSF-cN fibers (red) apposing gephyrin+ puncta (blue and white, arrowheads). (H) is a magnified view of the white dotted area in (G). (I, J) Chat-GFP+ neurites intermingled with the mCherry+ subependymal axon bundle (red) in the cervical cord (arrowheads). Transverse (I) and horizontal sections (J). (K) Chat-GFP+ neurites (green) are intermingled with the mCherry+ axon bundle (red) in the ventral funiculus (arrowheads), with some making contact with the gephyrin+ puncta (blue and white, closed arrowheads). (L) Diagram representing axial MNs and CSF-cNs, labeled by retroAAV-CAG-EGFP and AAV-Syn-mCherry injections into the axial muscle and lateral ventricle, respectively. Image positions of (N, O) are indicated. (M) GFP+ MN of the dorsal neck muscle (semispinalis capitis) is labeled with retroAAV-CAG-EGFP (green) and mCherry+ CSF-cNs at the cervical level. Note the GFP+ fibers extending to the central canal, ventral midline, and ventral funiculus. (N) GFP+ MN neurites extending near the central canal and are contacted by mCherry+ CSF-cN fibers with GAD65+ puncta (blue and white, arrowheads). (O) GFP+ MN neurites (green) are intermingled with the mCherry+ axon bundle (red) in the ventral funiculus with GAD65+ puncta (blue, white, arrowheads). The right panel is a magnified view of the dotted area in the left panel. (P) Diagram of Chx10-GFP+ V2a neurons and AAV-Syn-mCherry-labeled CSF-cNs in Chx10Cre;CAG-lcl-EGFP mice. Image positions of (R, S) are indicated. (Q) Chx10-GFP+ V2a neurons (green) and mCherry+ CSF-cNs (red) in the cervical cord of Chx10Cre;CAG-lcl-EGFP mice. (R, S) Chx10-GFP+ fibers (green) extending to mCherry+ fiber bundles (red) in the ventral funiculus. (S) shows a magnified view of the dotted area in (R), which consists of Chx10-GFP+ fibers contacted by mCherry+ ventral bundles with GAD65+ puncta (blue and white) (arrowheads). (T) Serial block-face scanning electron microscopy images of the ventral bundles showing COX4-dAPEX2+ presynaptic terminals of CSF-cNs (pseudo-colored in green) in contact with a COX4-dAPEX2– neurite coming from outside of the bundle (yellow). Positions 1 and 2 in the left panel are magnified in the right panels (the 80th and 139th serial images). (U–W) Transmission electron microscope images of presynaptic terminals containing COX4-dAPEX2+ mitochondria (arrowheads) contacting with COX4-dAPEX2– neurites in the bundle of ventral funiculus at the thoracic level (U, V) and subependymal area at the cervical level (W). Scale bars, 250 µm (B, C, M, Q); 50 µm (D), (K), left panel of (O), (R); 20 µm (E), (G), (I), (J), (N), right panel of (O); 5 µm (F), (H), (S), left panel of (T); 0.5 µm (right panels of T, U, V, W).
Figure 6—figure supplement 1
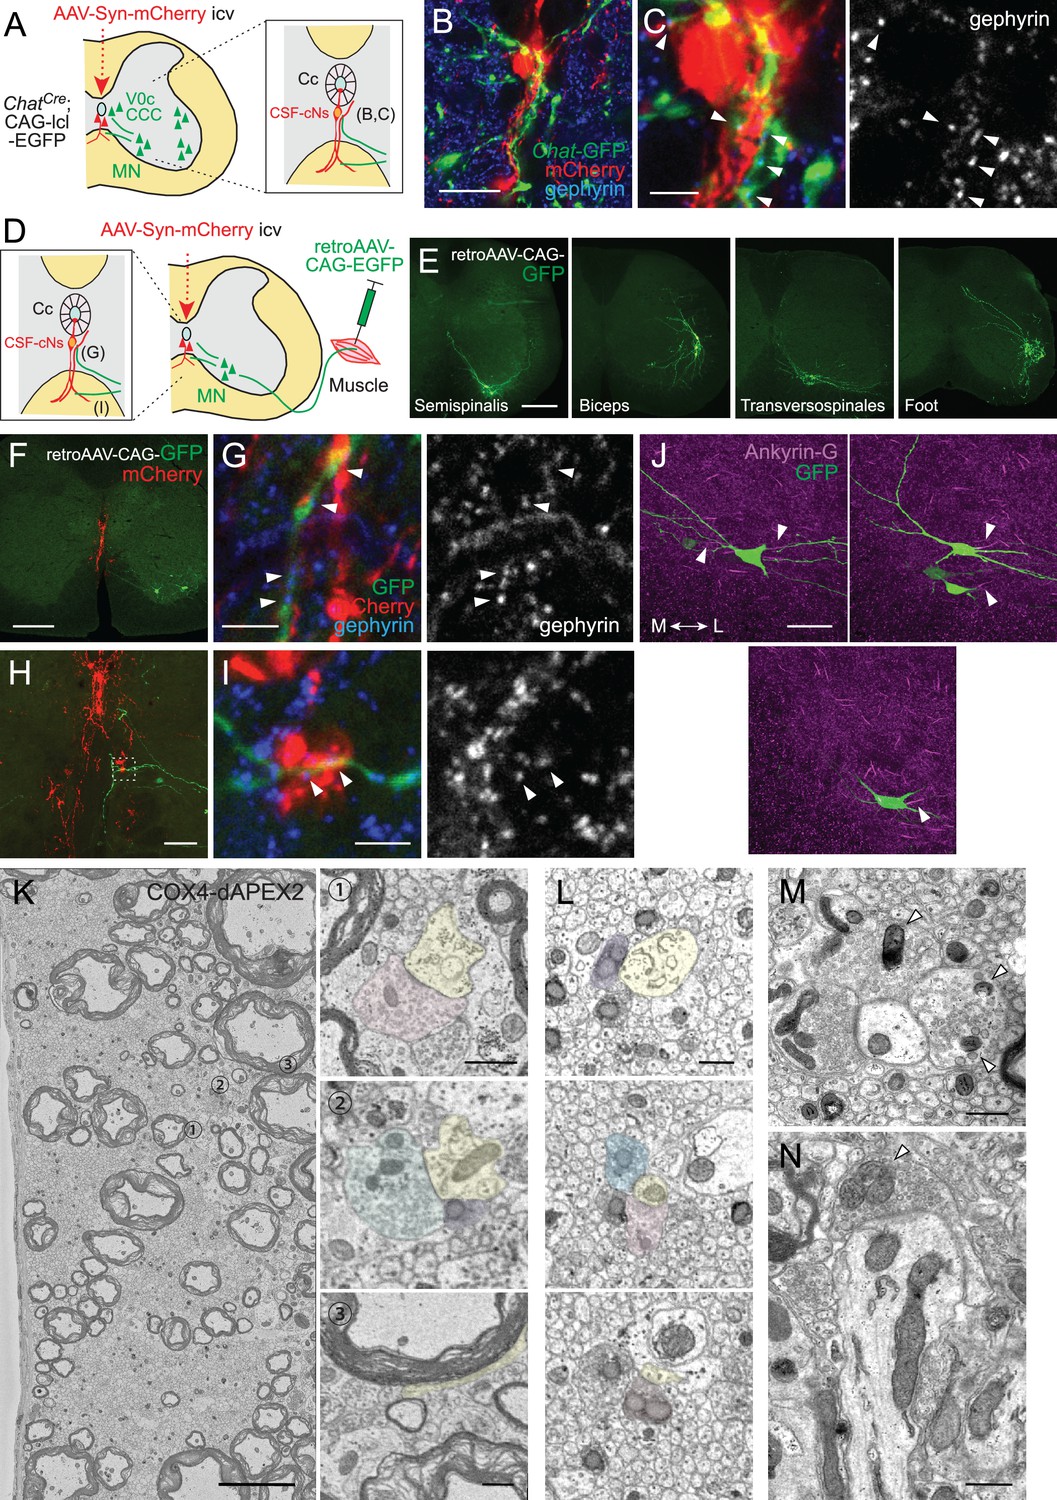
Connections of cerebrospinal fluid-contacting neurons (CSF-cNs) with premotor and motor neurons (MNs) in the spinal cord.
(A) Diagram of Chat-EGFP+ cells and adeno-associated virus (AAV)-Syn-mCherry-labeled CSF-cNs in ChatCre;CAG-lcl-EGFP mice. CCC, central canal cluster cells. Image positions of (B, C) are indicated. (B, C) Representative images of Chat-GFP+ neurites (green) extending near the central canal (Cc) and contacted by mCherry+ CSF-cNs fibers (red), apposing to gephyrin+ puncta (blue and white, arrowheads). The images of (C) are magnified views of (B). (D) Diagram of GFP+ MN labeled by retro-AAV-CAG-EGFP muscle injections, and AAV-Syn-mCherry-labeled CSF-cNs. Image positions of (G, I) are indicated. (E) Representative images of retro-AAV-CAG-EGFP-labeled MNs, traced from different muscles (semispinalis capitis at dorsal neck, biceps of forelimb, transversospinales at the caudal thoracic to lumbar levels, and dorsal muscles of foot). (F, G) GFP+ MN neurites of the sternocleidomastoid (green) extend to the midline and are contacted by mCherry+ CSF-cN fibers (red), which appose gephyrin+ puncta (blue and white, arrowheads). (G) is a magnified view of (F). (H, I) GFP+ MN neurites (green) extend to the ventral funiculus and are contacted by an mCherry+ axon bundle (red), which apposes gephyrin+ puncta (blue and white, arrowheads). (I) is a magnified view of the dotted area in (H). (J) Three representative images of ankyrin-G staining of retro-AAV-CAG-EGFP-labeled MNs (green) of the semispinalis capitis, showing an axon initial segment in the axons extending to the lateral side (arrowheads, magenta). Left, medial (M); right, lateral (L). (K) Serial block-face scanning electron microscopy (SBF-SEM) images representing COX4-dAPEX2+ presynaptic terminals of CSF-cNs (pseudo-colored in red, green, and purple) contacting with a COX4-dAPEX2– neurite coming from outside of the bundle (yellow), in the ventral bundles at the thoracic level. Positions 1–3 in the left panel are magnified in the right panels (the 93th, 112th, and 156th serial images). (L) SBF-SEM images of subependymal bundles at the cervical level (the 399th, 460th, and 498th serial images), showing COX4-dAPEX2+ presynaptic terminals of CSF-cNs (pseudo-colored in purple, blue, red, and orange) contacting with a COX4-dAPEX2– neurite (yellow). (M, N) Representative transmission electron microscope images of presynaptic terminals containing COX4-dAPEX2+ mitochondria (arrowheads) contacting with COX4-dAPEX2– neurites in the bundle of ventral funiculus at the thoracic level (M) and subependymal area at the cervical level (N). Scale bars, 20 µm (B); 5 µm (C), (G), (I), left panel of (K); 250 µm (E, F); 50 µm (H, J); 0.5 µm (right panels of K), (L–N).
Figure 7 with 1 supplement
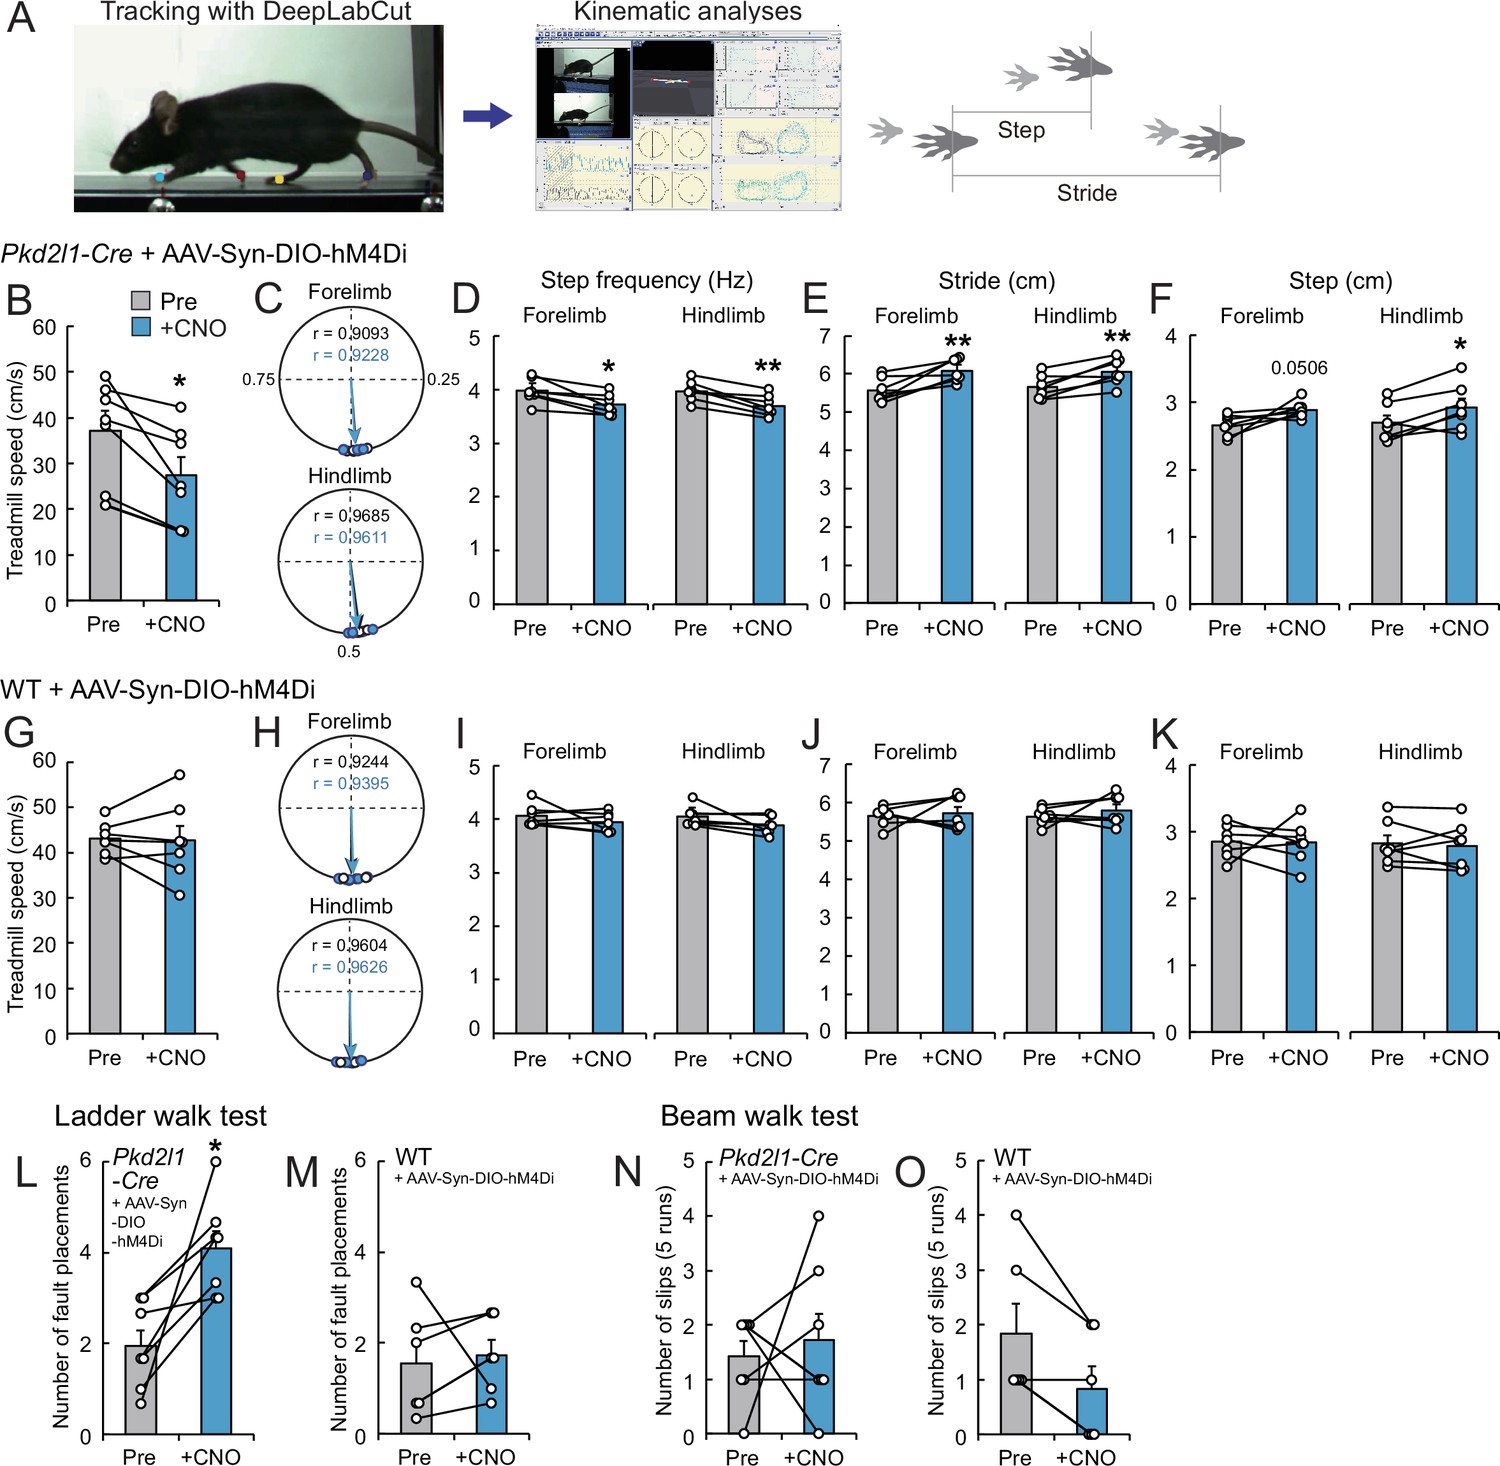
Chemogenetic inhibition of cerebrospinal fluid-contacting neurons (CSF-cNs) impairs treadmill locomotion.
(A) The experimental system to analyze treadmill locomotion. Trajectories of fore- and hind-paw were tracked by DeepLabCut and kinematic parameters including step and stride lengths were analyzed by KinemaTracer. (B–F) Analyses of treadmill locomotion pre- and post-inactivation of hM4Di+ CSF-cNs by clozapine-N-oxide (CNO) treatment. Pkd2l1-Cre mice were intracerebroventricularly injected with adeno-associated virus (AAV)-Syn-DIO-hM4Di-mCherry to introduce hM4Di-mCherry. (B) Maximum treadmill speeds in a program increasing from 8.33 to 58.33 cm/s (5.0–35 m/min). (C–F) Circular phase plots representing phase values of the left fore- and hind-paw contacts between two right paw contacts and r (C), step frequency (D), stride lengths (E), and step lengths (F) of the left fore- and hindlimbs at a speed of 23.3 cm/s (14 m/min). CNO-treated groups are represented in blue. (G–K) Analyses of treadmill locomotion of AAV-Syn-DIO-hM4Di-mCherry-injected wild-type (WT) mice pre- and post-CNO treatment. Maximum treadmill speeds (G), circular phase plots (H), step frequency (I), stride lengths (J), and step lengths (K) of the left fore- and hindlimbs. (L, M) Average number of fault placements in the ladder walk test pre- and post-CNO treatment in AAV-Syn-DIO-hM4Di-mCherry-injected Pkd2l1-Cre (L) and WT mice (M). (N, O) The number of slips in five runs of the beam walk test pre- and post-CNO treatment in AAV-Syn-DIO-hM4Di-mCherry-injected Pkd2l1-Cre (N) and WT mice (O). Paired t-test (B,D–F, G, I–M), Wilcoxon matched-pairs signed rank test (N, O); *p<0.05, ** p<0.01; the mean ± standard error of the mean (SEM); n=7 (B–L, N), n=6 (M, O).
-
Figure 7—source data 1
Raw data for maximum treadmill speeds, circular phase plots, step frequency, stride lengths, step lengths, the ladder walk test, and the beam walk test.
- https://cdn.elifesciences.org/articles/83108/elife-83108-fig7-data1-v1.xlsx
Figure 7—figure supplement 1
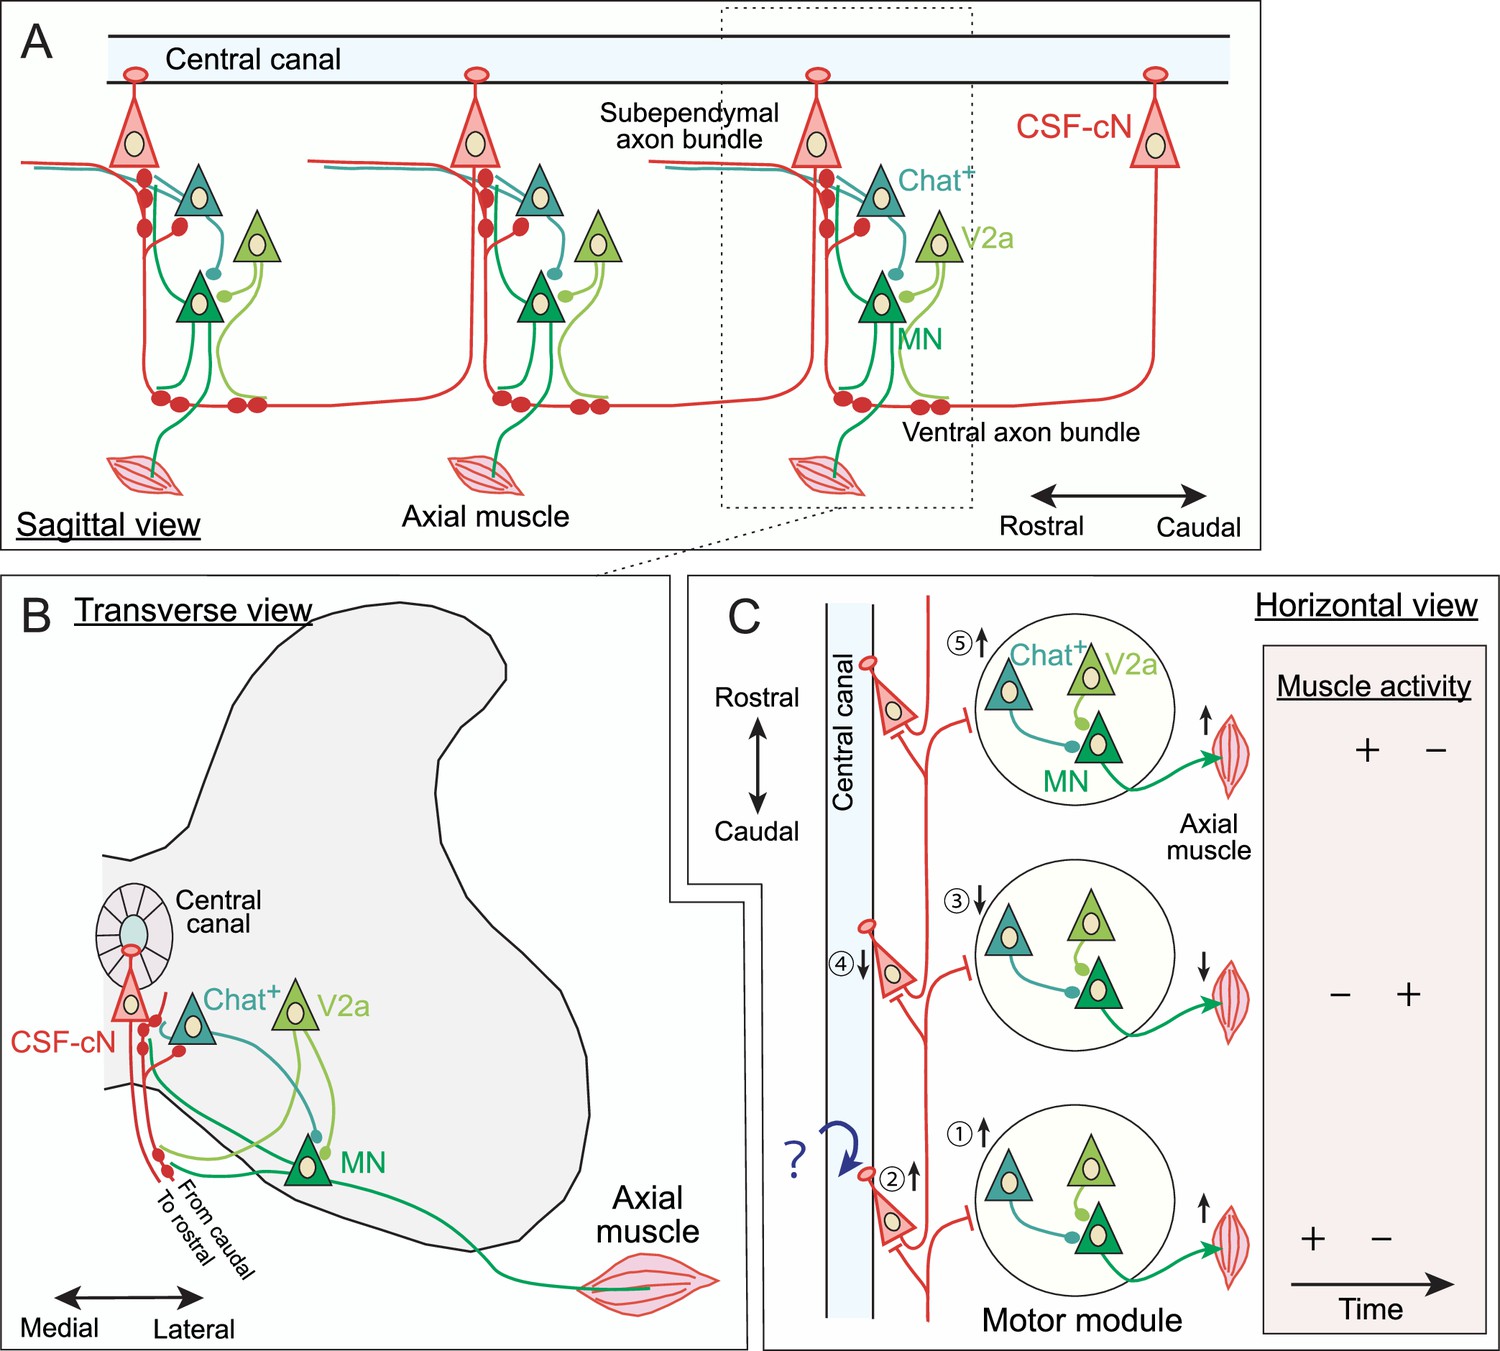
Schematic model of cerebrospinal fluid-contacting neuron (CSF-cN) connections in the spinal circuits.
(A) Sagittal view of rostrally projecting CSF-cNs comprising recurrent connections with rostral CSF-cNs and with axial motor neurons (MNs), Chat+ interneurons (central canal cluster cells or V0c), and V2a premotor neurons. Left, rostral; right, caudal. (B) Transverse view of CSF-cN connections with axial MNs, Chat+ interneurons, and V2a premotor neurons. (C) Horizontal view of rostrally projecting CSF-cNs that have recurrent connections with rostral CSF-cNs, as well as inhibitory outputs to a spinal motor module comprising axial MNs, Chat+ interneurons, and V2a premotor neurons that evokes muscle activation. Top, rostral; bottom, caudal. This shows a predictive schematic model of connective functions in mice, which may convey caudo-rostral information flow for motor coordination, especially for axial muscles. The numbers indicate presumptive sequential timings of events occurring during locomotion: (1) the motor module in the most caudal part begins to activate; (2) axial muscle activity may bend body axis and stretch the central canal, which were sensed by CSF-cNs; (3) inhibitory signals from activated CSF-cNs are transmitted to the rostral motor module to inhibit muscle activation; (4) the rostral CSF-cNs are simultaneously silenced; (5) the CSF-cNs inhibition releases suppressions onto more rostral motor module to initiate activation. The table in the right panel details the presumptive timing of muscle activity during the course of movement, starting at the activation of the most caudal motor module. Sequential switching of axial muscle activities in the rostrocaudal axis may drive smooth locomotion and precise postural control. Note that the connections between CSF-cNs and axial MNs, Chat+ and V2a interneurons are still hypothetical without electrophysiological analyses. The minor bidirectionally and caudally projecting CSF-cNs are not integrated in this model.
Videos
Video 1
Magnified z-stack images of mCherry-labeled cerebrospinal fluid-contacting neurons in a cleared cervical cord.
Video 2
Z-stack images of a tdTomato+ cell body of single-cell traced cerebrospinal fluid-contacting neuron.
Video 3
Z-stack images of tdTomato+ projections of single-cell traced cerebrospinal fluid-contacting neuron in a cleared cervical cord.
Video 4
Z-stack images of tdTomato+ projections of single-cell traced cerebrospinal fluid-contacting neurons (CSF-cNs) innervating to GFP+ CSF-cNs in a cleared cervical cord.
Video 5
Serial section serial block-face scanning electron microscopy images of cerebrospinal fluid-contacting neurons and the subependymal axon bundle around the central canal.
Video 6
Treadmill locomotion during a programmed increase in speeds from 5.0 to 35 m/min in an hM4Di-introduced Pkd2l1-Cre mouse pre- and post-clozapine-N-oxide (CNO) treatment.
Video 7
Treadmill step frequency at a speed of 14 m/min in an hM4Di-introduced Pkd2l1-Cre mouse pre- and post-clozapine-N-oxide (CNO) treatment.
Additional files
Download links
A two-part list of links to download the article, or parts of the article, in various formats.
Downloads (link to download the article as PDF)
Open citations (links to open the citations from this article in various online reference manager services)
Cite this article (links to download the citations from this article in formats compatible with various reference manager tools)
Cerebrospinal fluid-contacting neuron tracing reveals structural and functional connectivity for locomotion in the mouse spinal cord
eLife 12:e83108.
https://doi.org/10.7554/eLife.83108


