Environmental response in gene expression and DNA methylation reveals factors influencing the adaptive potential of Arabidopsis lyrata
- Department of Ecology and Genetics, University of Oulu, Finland
Figures
Figure 1 with 2 supplements
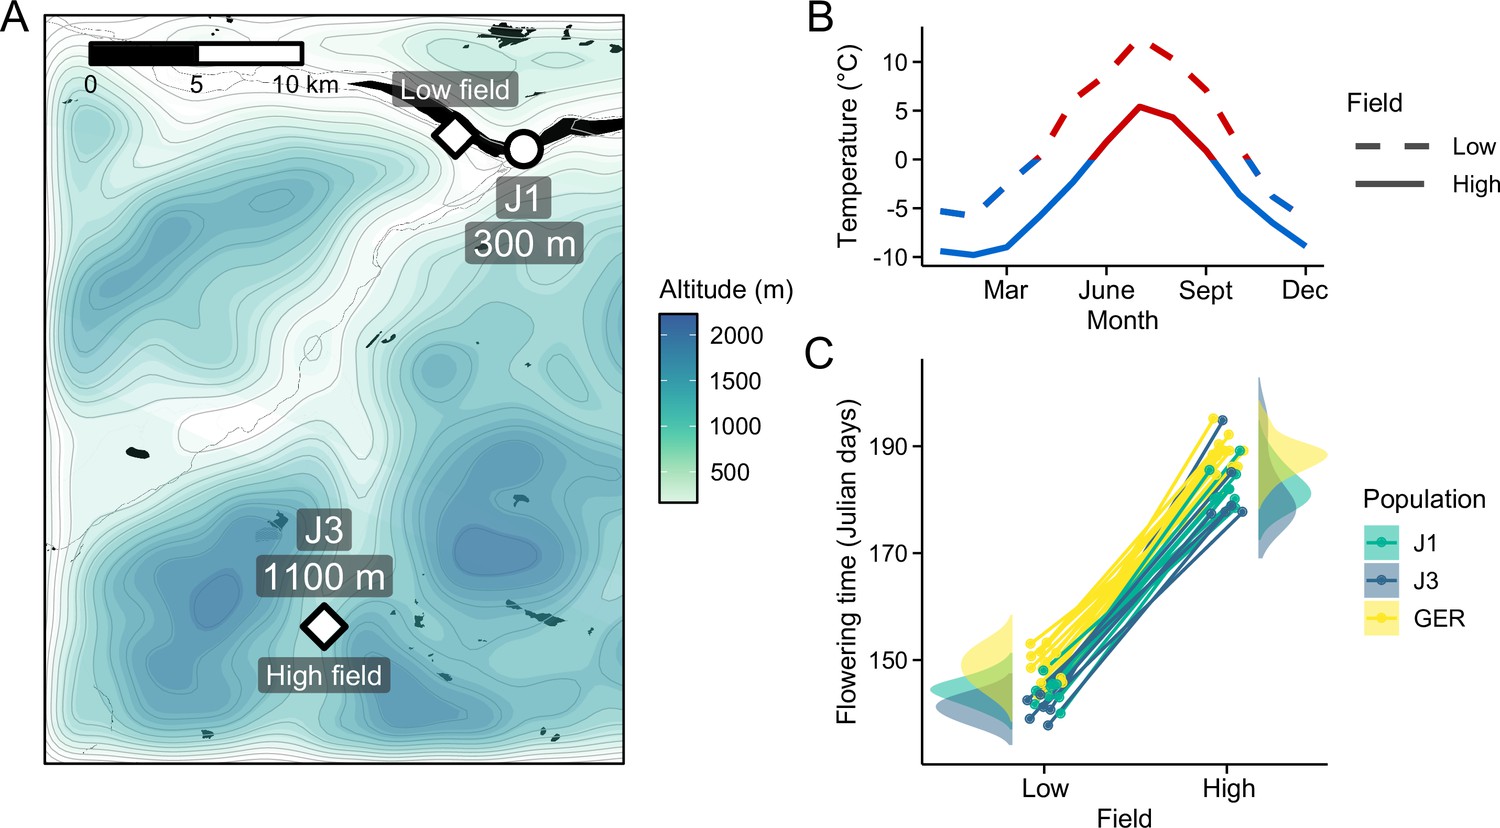
Reciprocal transplant experiment to study environmental adaptation in A. lyrata.
(A) Locations and altitudes of the Norwegian populations and field sites. Map tiles by Stamen Design, under CC BY 3.0. Map data by OpenStreetMap, under ODbL. Altitude data from Shuttle Radar Topography Mission (SRTM) (Farr and Kobrick, 2000). (B) Average monthly temperature at areas around the field sites (red line: ≥0°C, blue line: <0°C). Data from MET Norway. (C) Average flowering time of full-sib families grown at the field sites. Data from Hämälä et al., 2018.
Figure 1—figure supplement 1

Locations of the A. lyrata populations.
Figure 1—figure supplement 2

Photos of the low- and high-altitude field sites, taken during June 6 and 7, 2015, respectively.
Figure 2 with 4 supplements
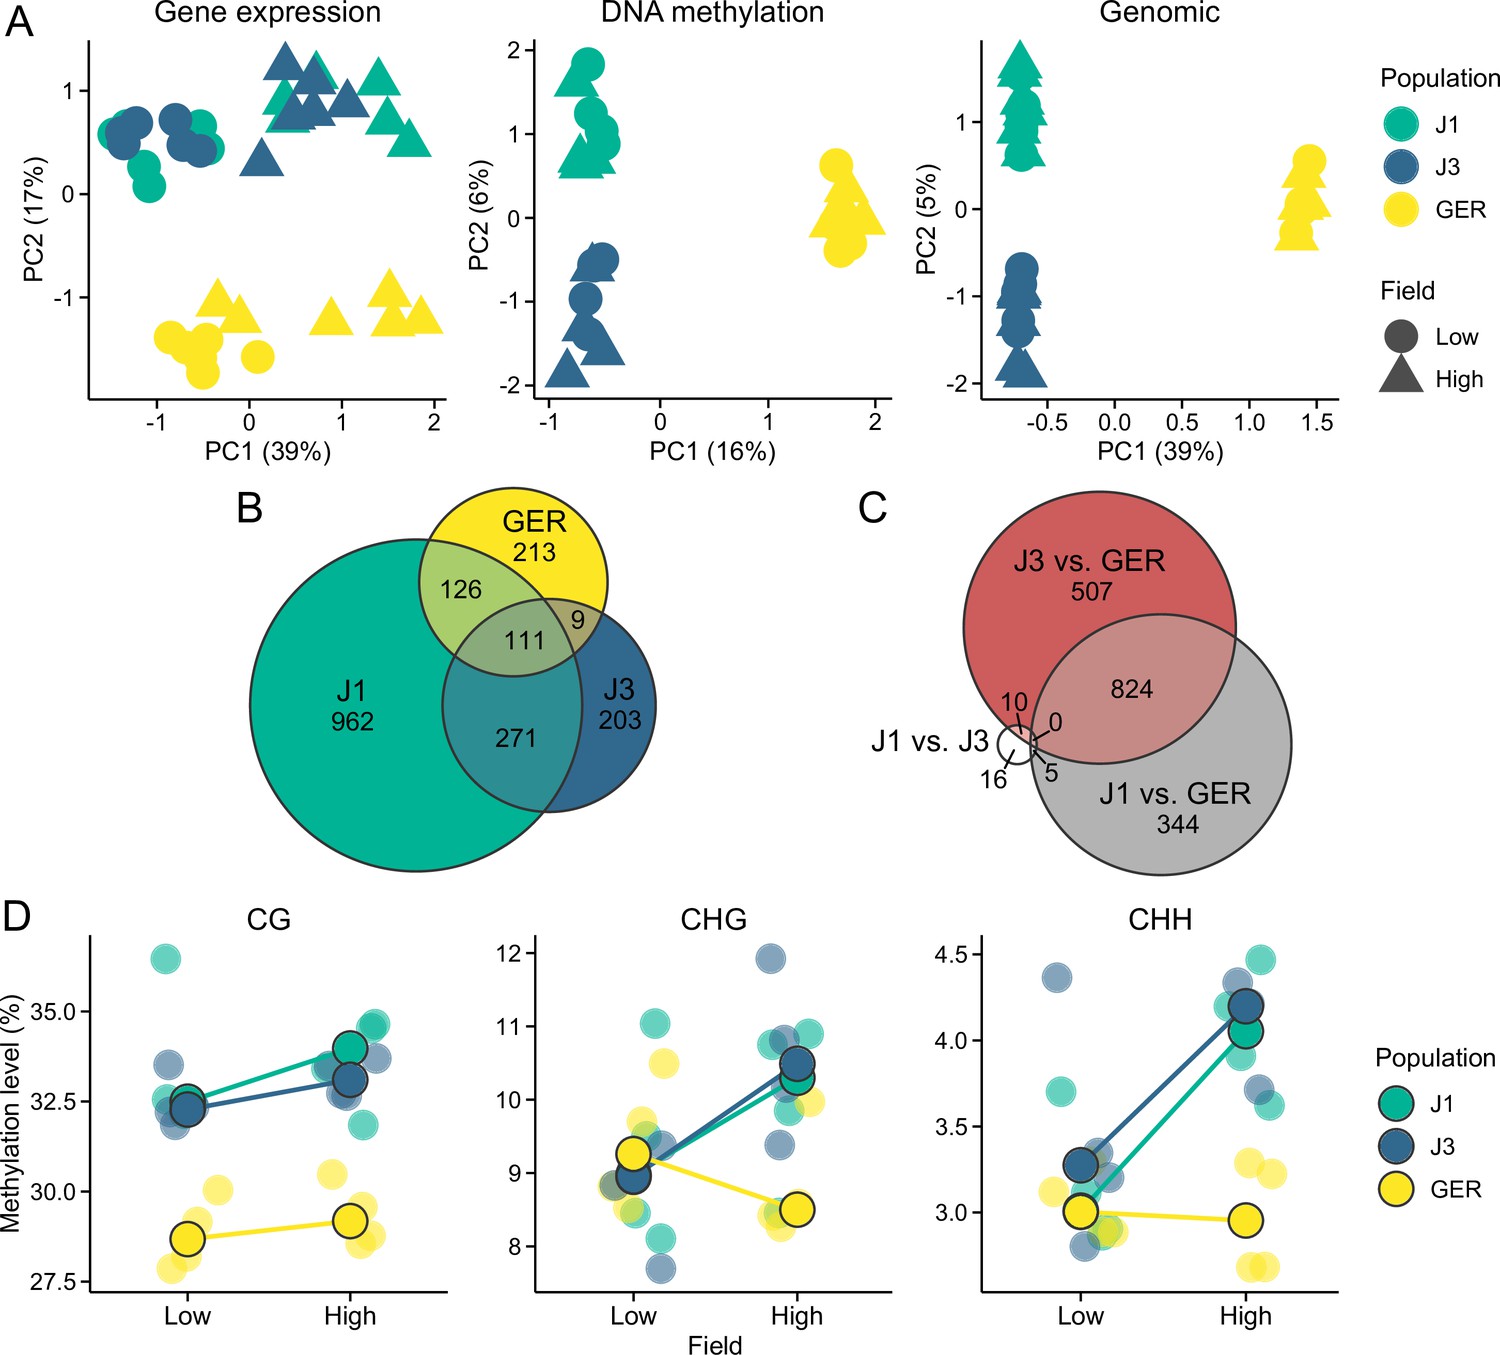
Gene expression and methylation variation across the field sites and populations.
(A) Gene expression, DNA methylation, and genomic (based on SNPs called from the transcriptome data) variation along the first two eigenvectors of a principal component analysis (PCA). The proportion of variance explained by the principal components (PCs) is shown in parentheses. (B) The number of differentially expressed genes (DEGs) between field sites. (C) The number of DEGs between populations (across both fields). (D) Average methylation levels at the two field sites, shown for CG, CHG, and CHH contexts. Black-lined circles show median estimates for the populations, while individual estimates are shown with transparent colors in the background. Note the difference in y-axis scales between the panels.
Figure 2—figure supplement 1
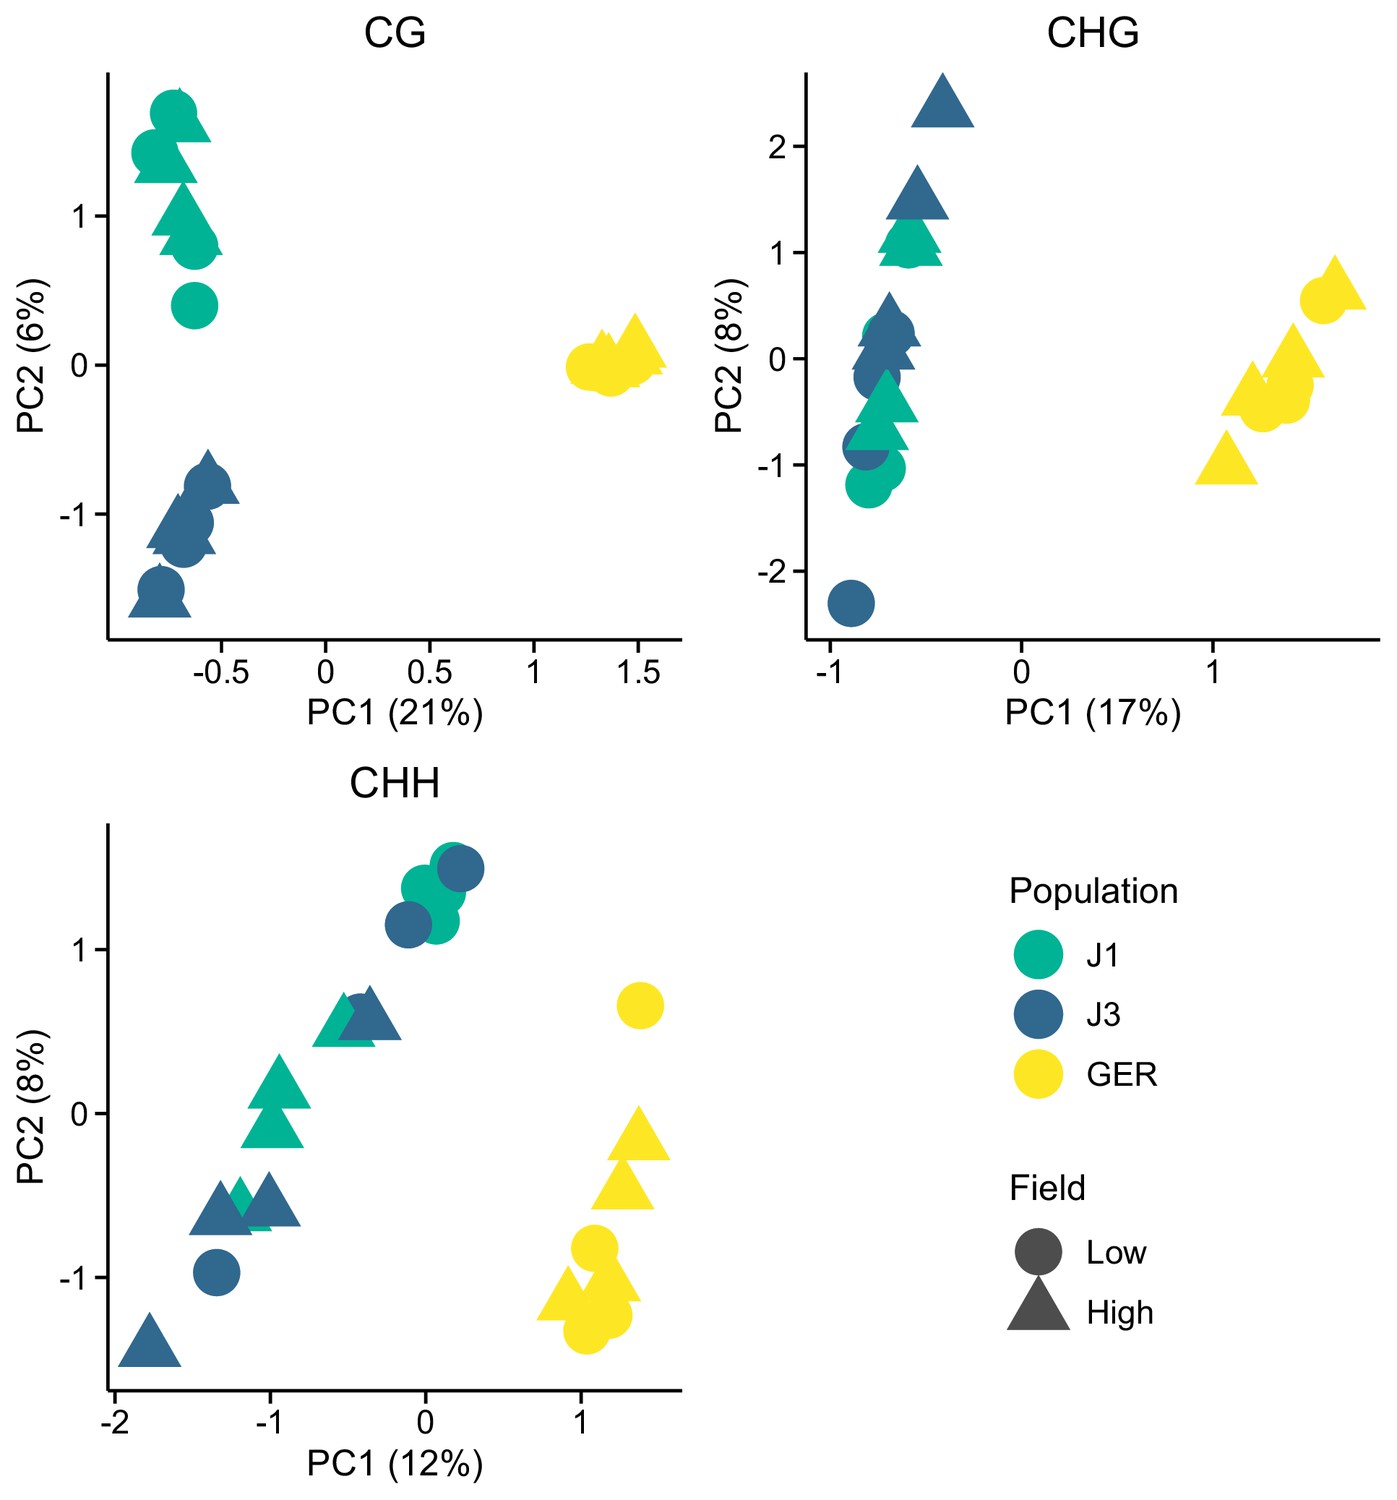
Methylation variation along the first two eigenvectors of a principal component analysis (PCA), shown for the three methylation contexts.
Figure 2—figure supplement 2
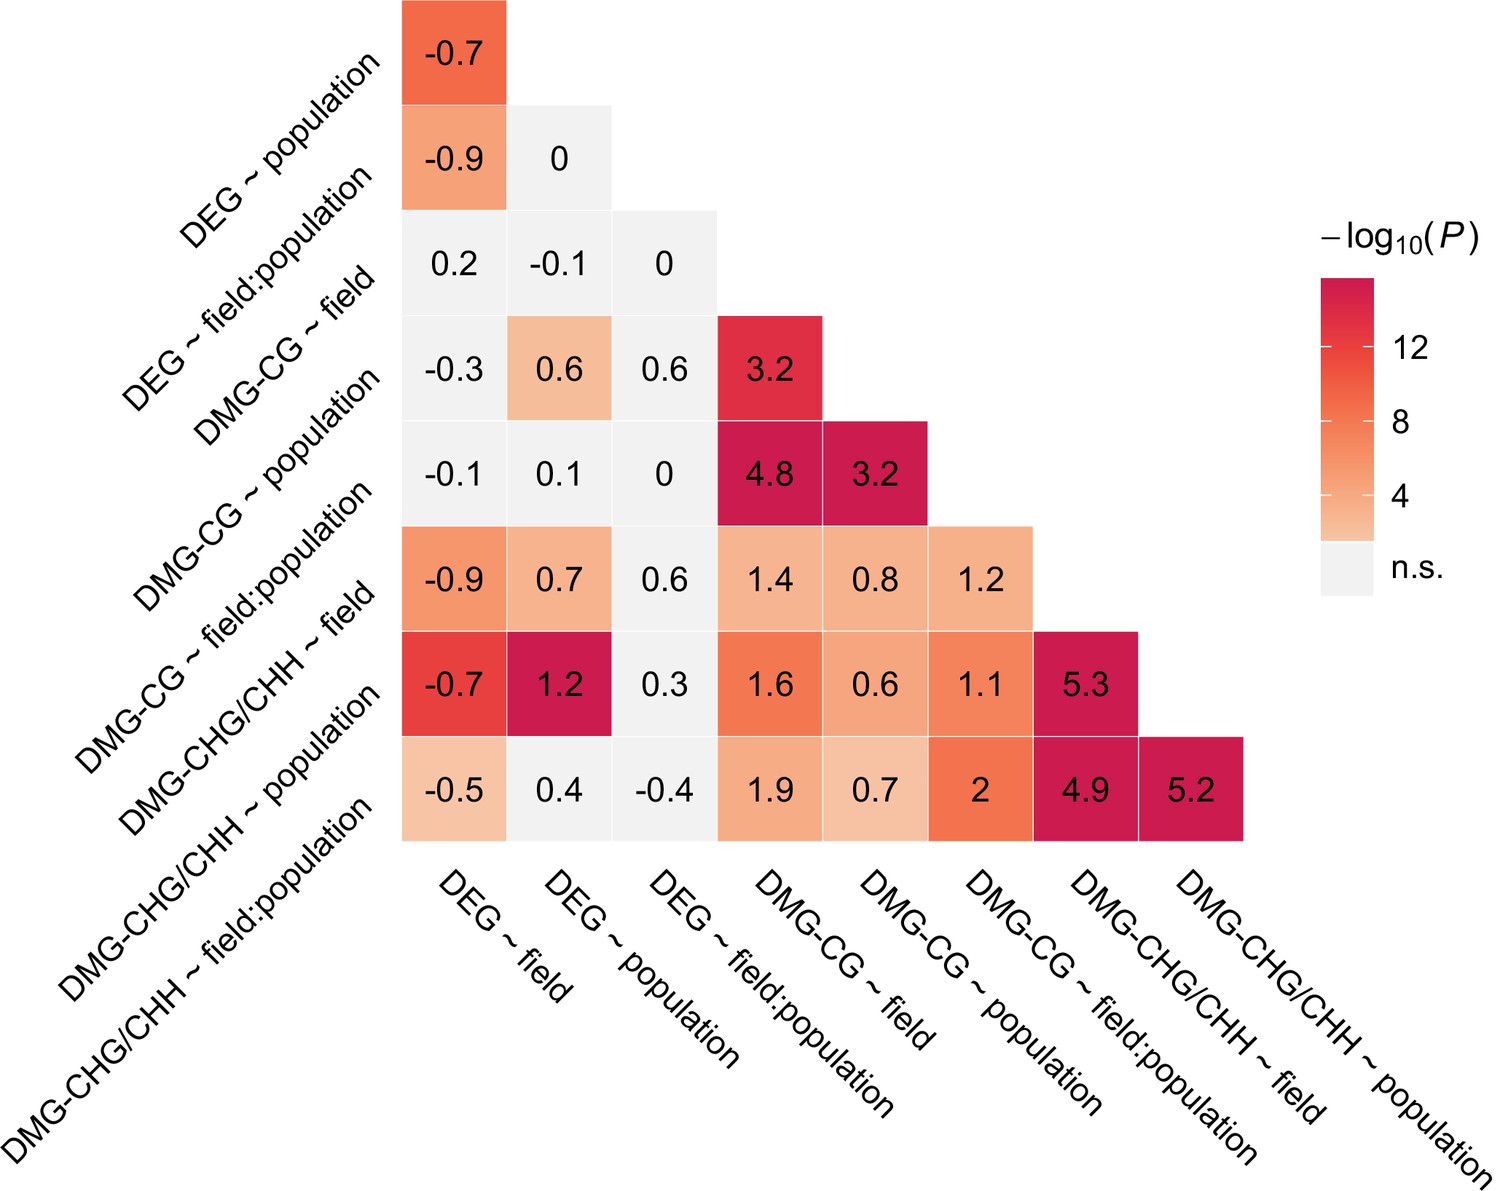
Overlap between candidate gene groups.
Shown are log2 ORs (numbers) and p values (color gradient) from Fisher’s exact tests.
Figure 2—figure supplement 3
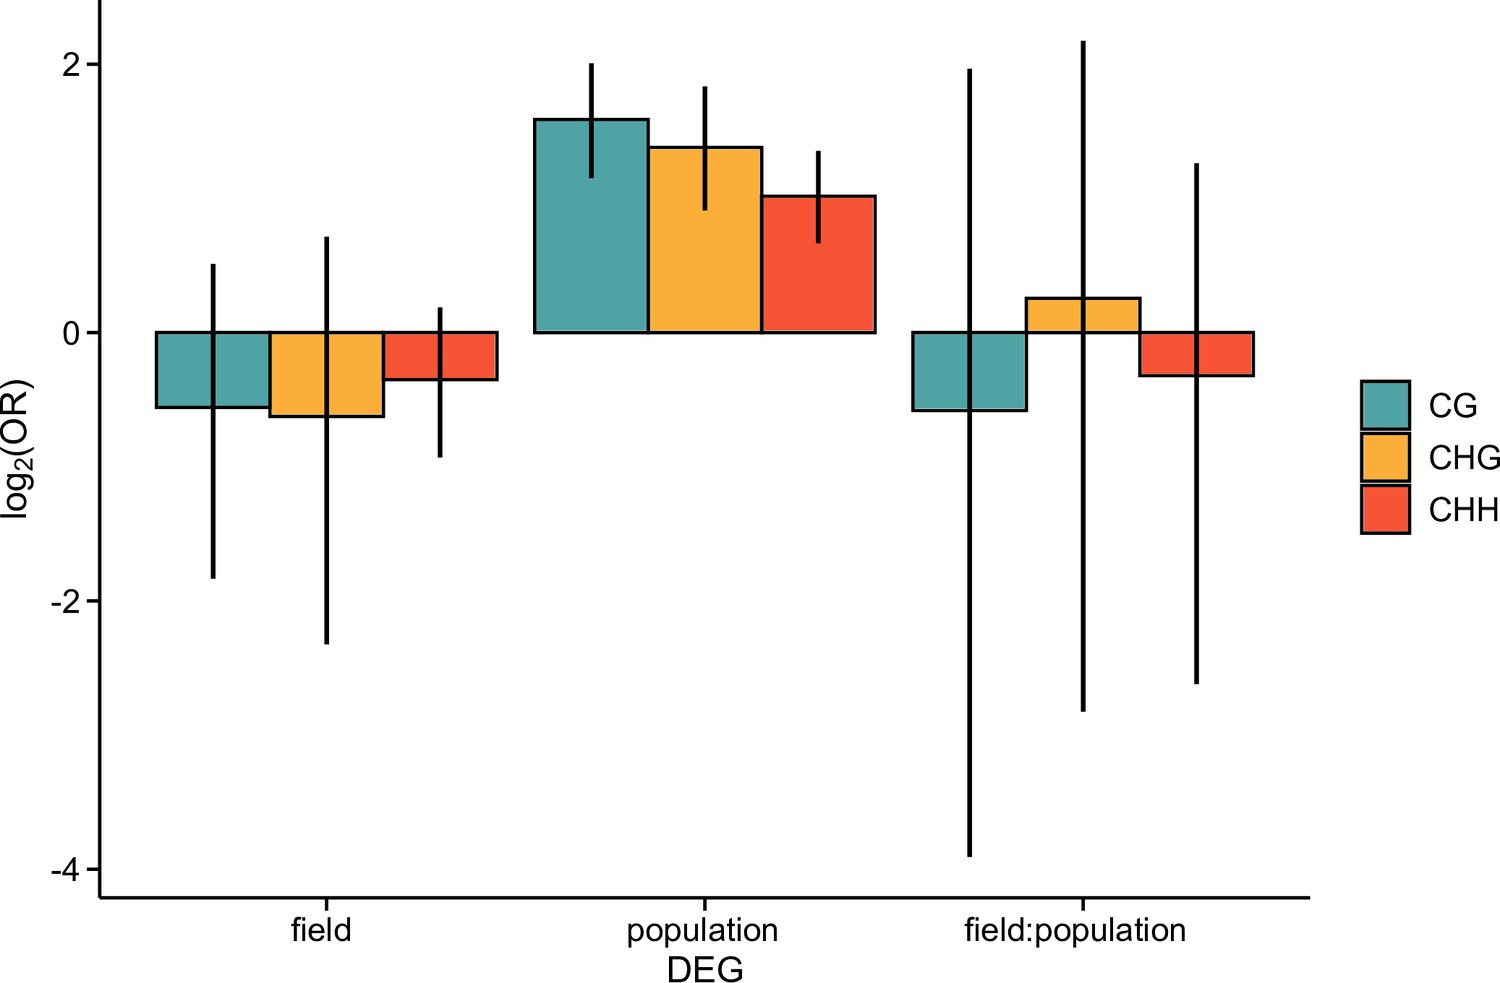
The log2 OR of association between differentially expressed genes (DEGs) and differentially methylated regions 1 kb upstream of each gene, shown for each methylation context.
Error bars show 95% bootstrap-based CIs.
Figure 2—figure supplement 4
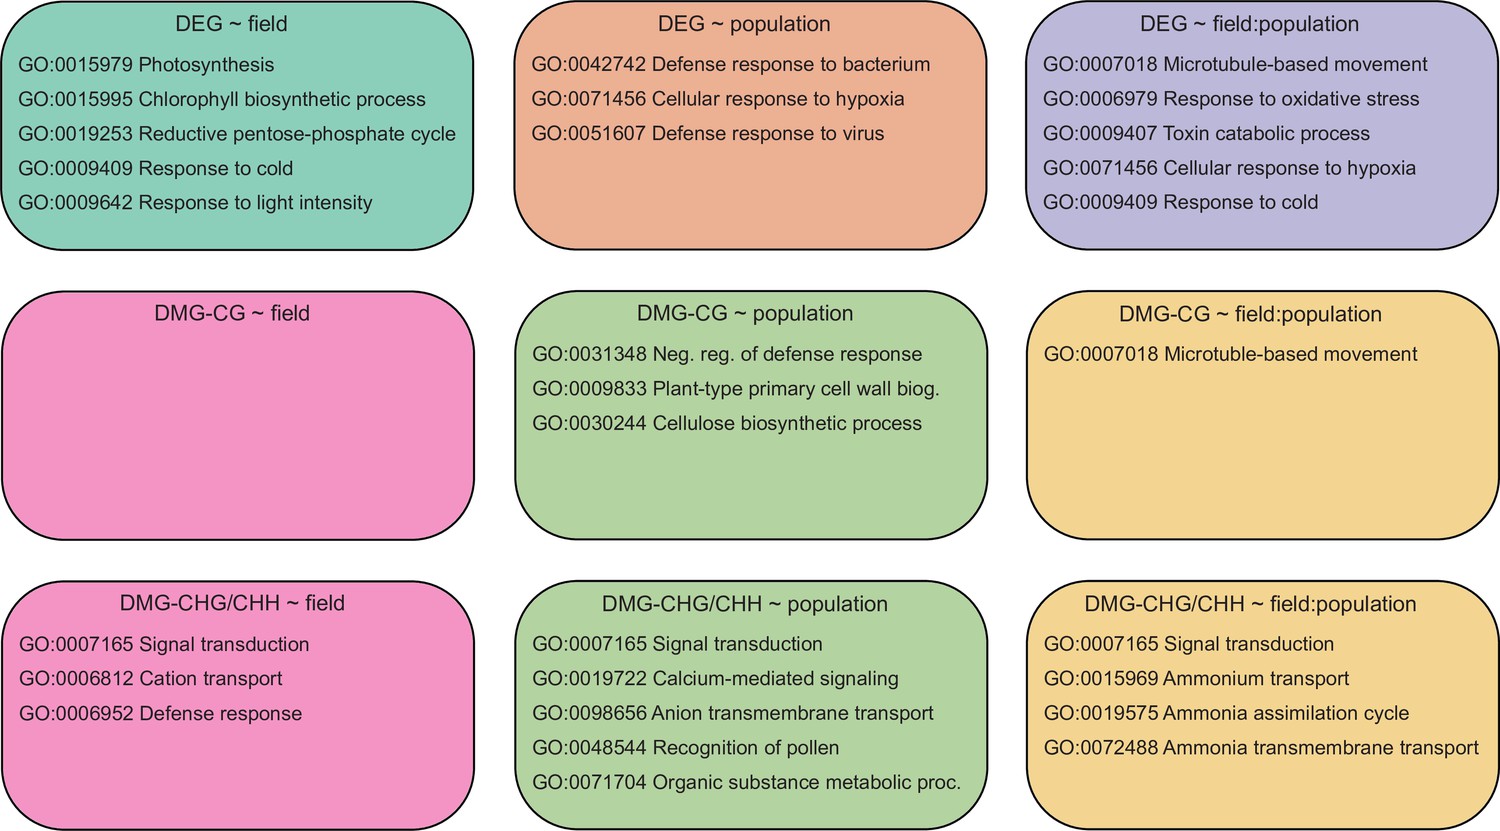
Top five enriched (Q<0.05, hypergeometric test) gene ontology (GO) terms among each candidate gene set.
Figure 3 with 4 supplements
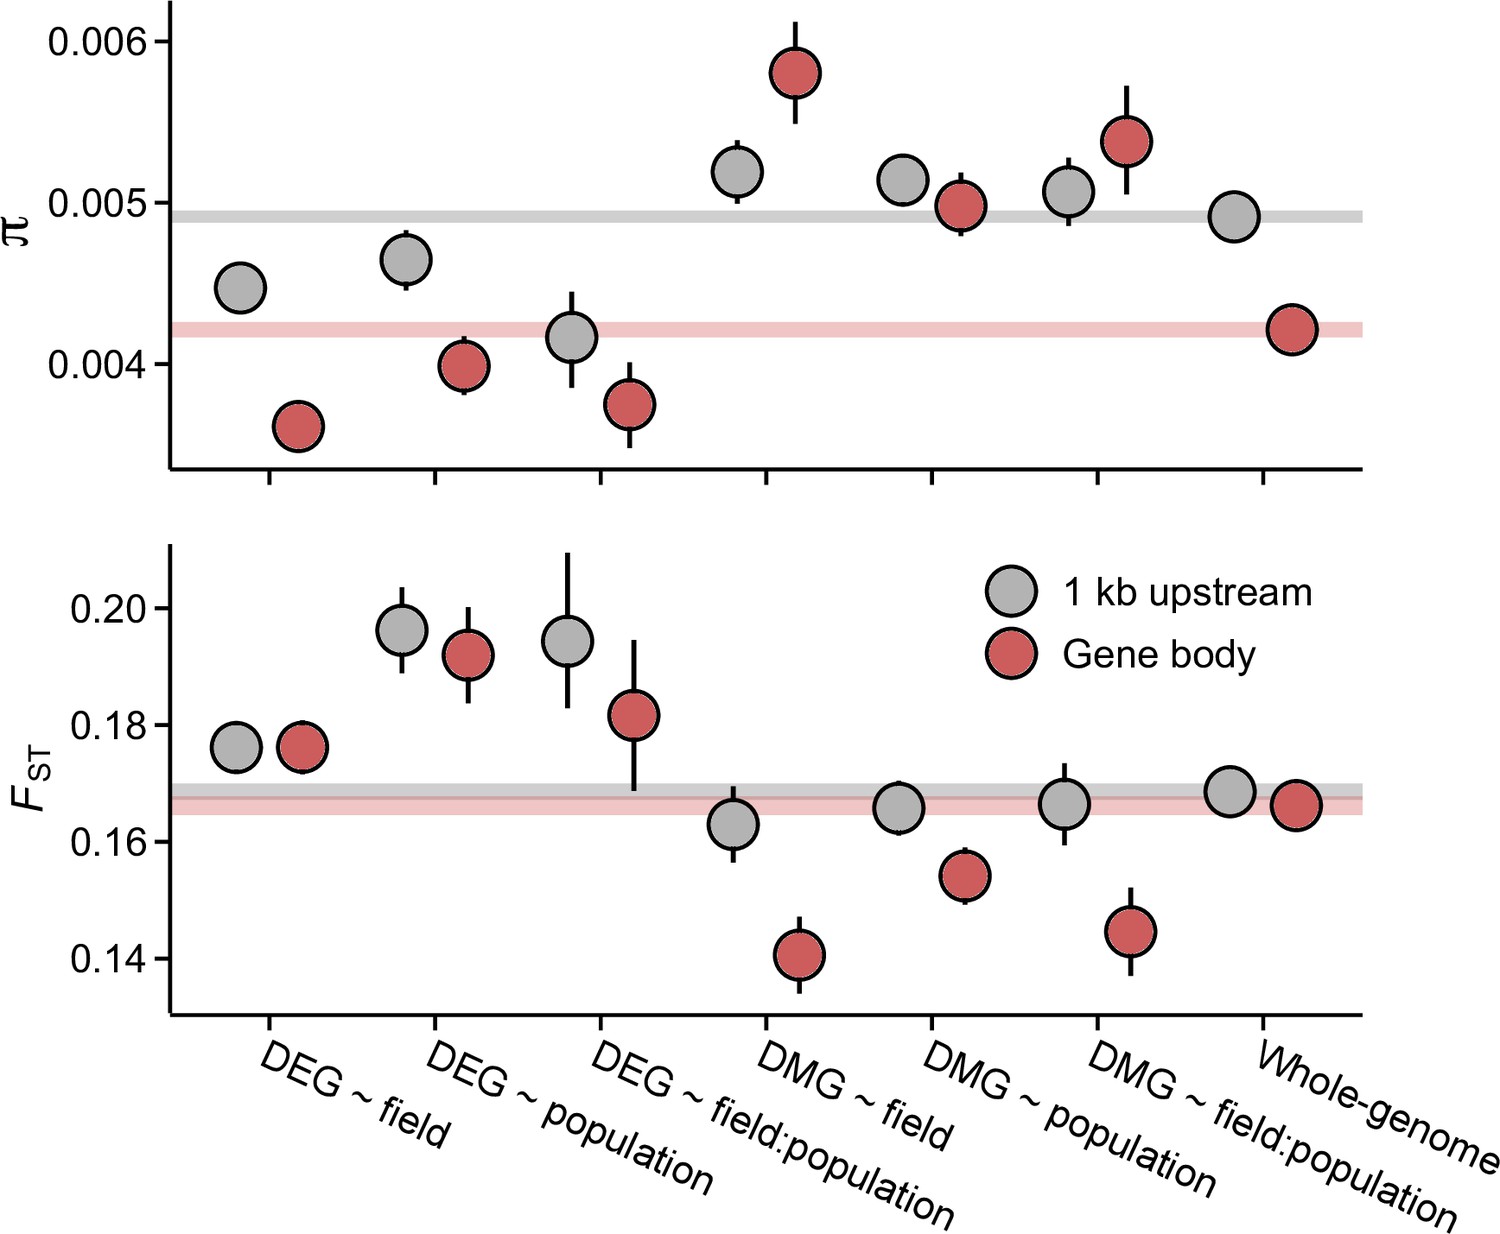
Pairwise nucleotide diversity (π) and FST at the candidate gene sets.
π estimates are shown for J3 (n=22) population. Estimates for J1 (n=9) and GER (n=17) are shown in Figure 3—figure supplements 1 and 3. FST was estimated across the three populations. See Figure 3—figure supplement 3 for pairwise FST estimates. Error bars show 95% bootstrap-based CIs. Shaded areas mark the 95% CIs across all genes.
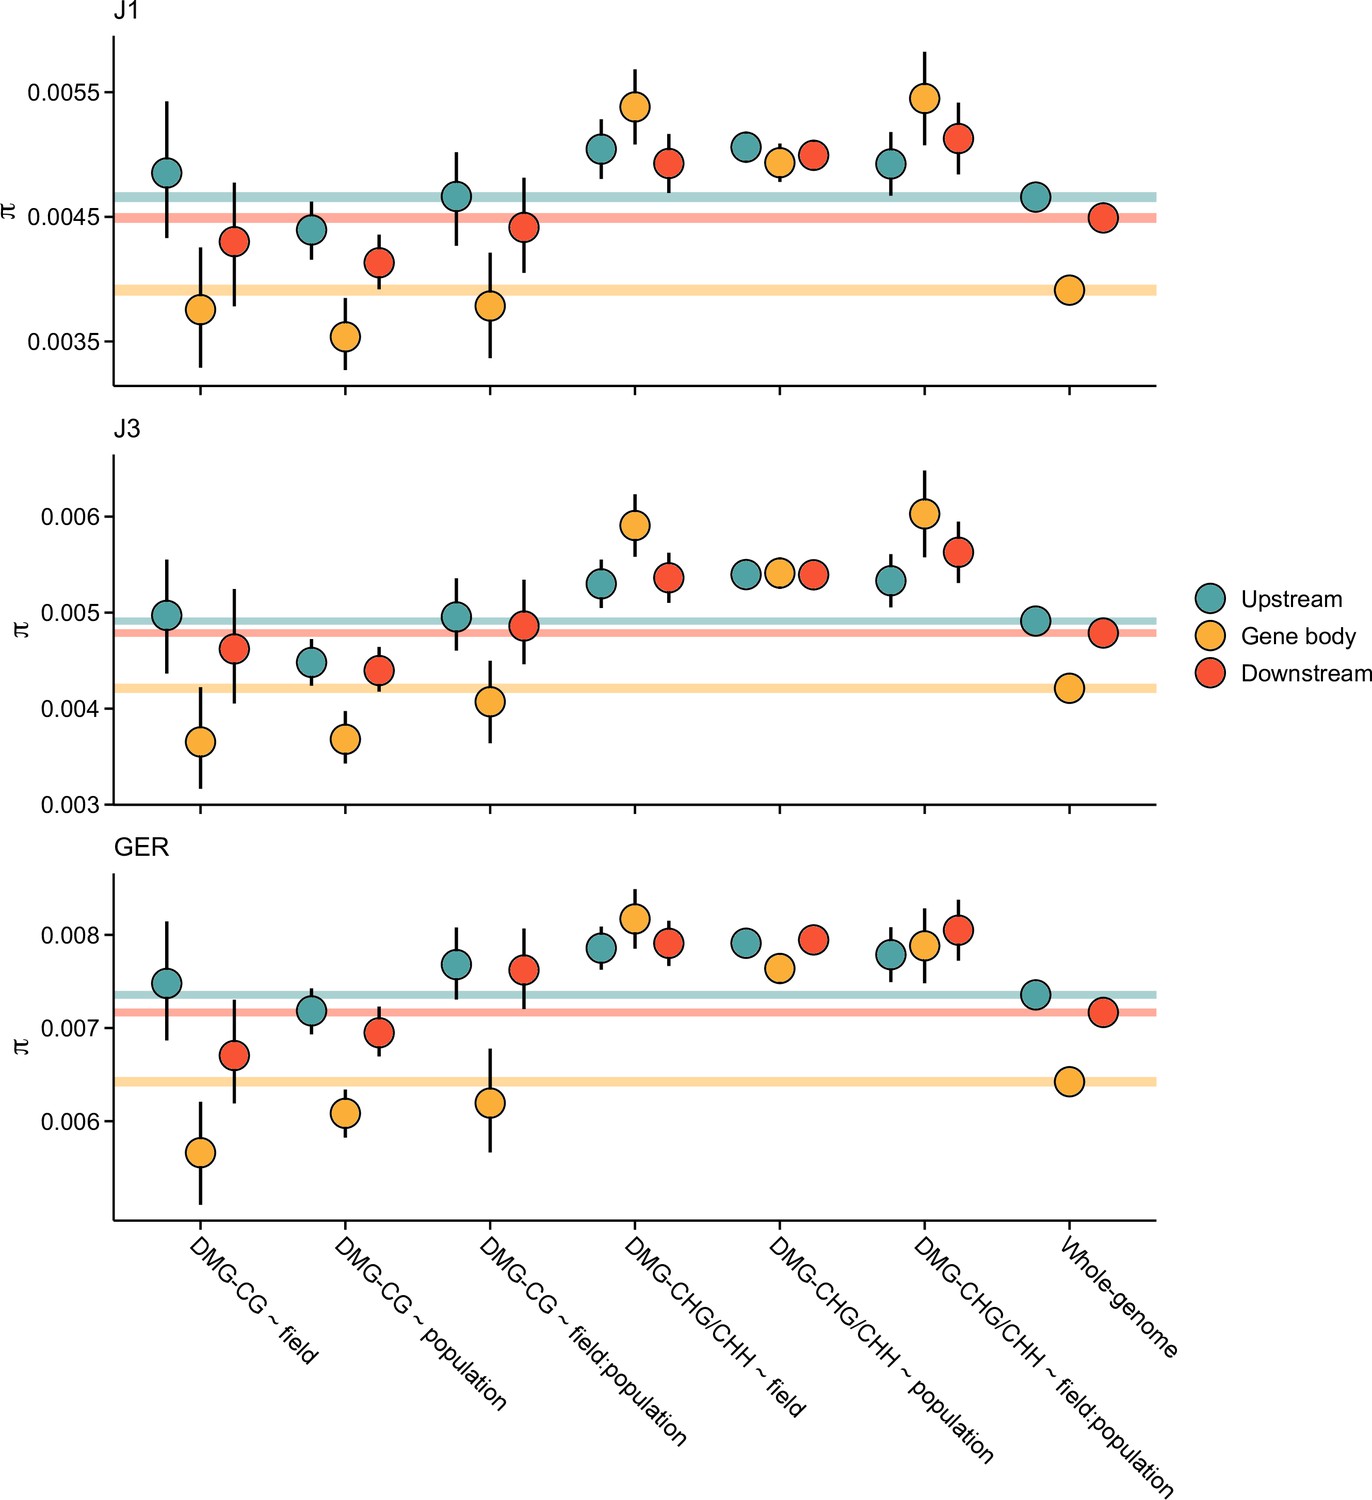
Figure 3—figure supplement 1

Pairwise nucleotide diversity (π) at the candidate gene sets.
Shown are estimates for gene bodies and 1 kb up- and downstream regions. Error bars show 95% bootstrap-based CIs. Shaded areas mark the 95% CIs across all genes.
Figure 3—figure supplement 2
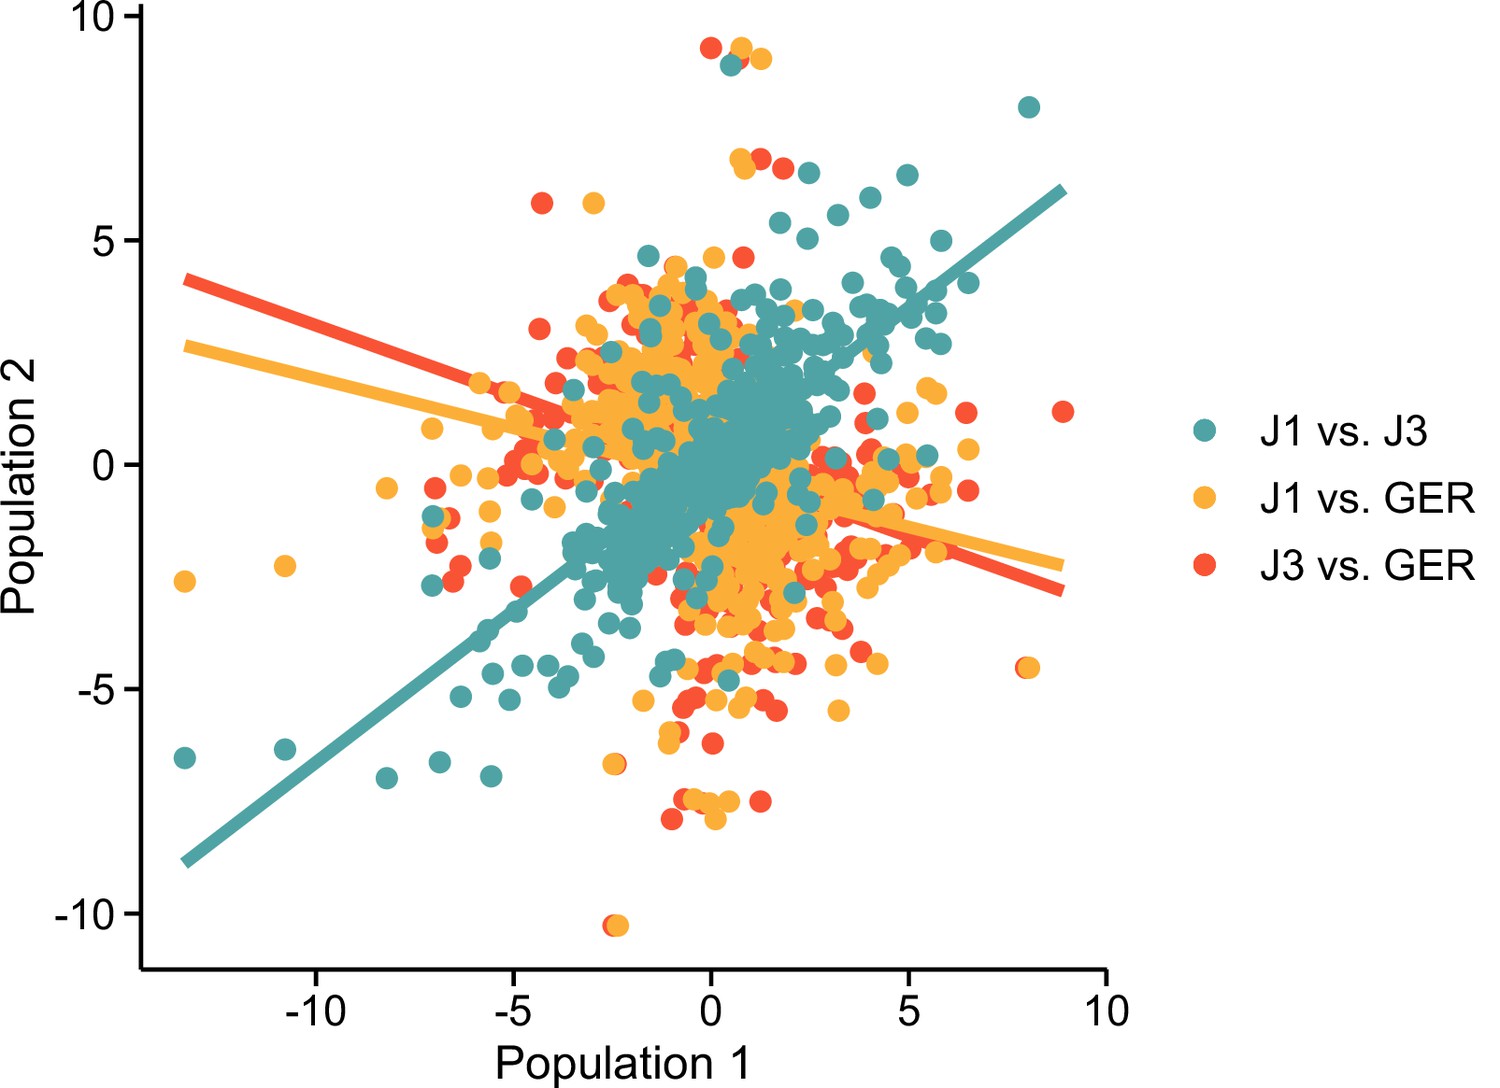
Population effects at DEG ~ field:population genes.
For each population comparison (shown with colors), values indicate expression log2 fold changes between the low- and high-altitude field sites. For example, teal circles indicate that the fold change for J1 is on the x-axis and J3 on the y-axis. Fit from linear models are shown with lines.
Figure 3—figure supplement 3
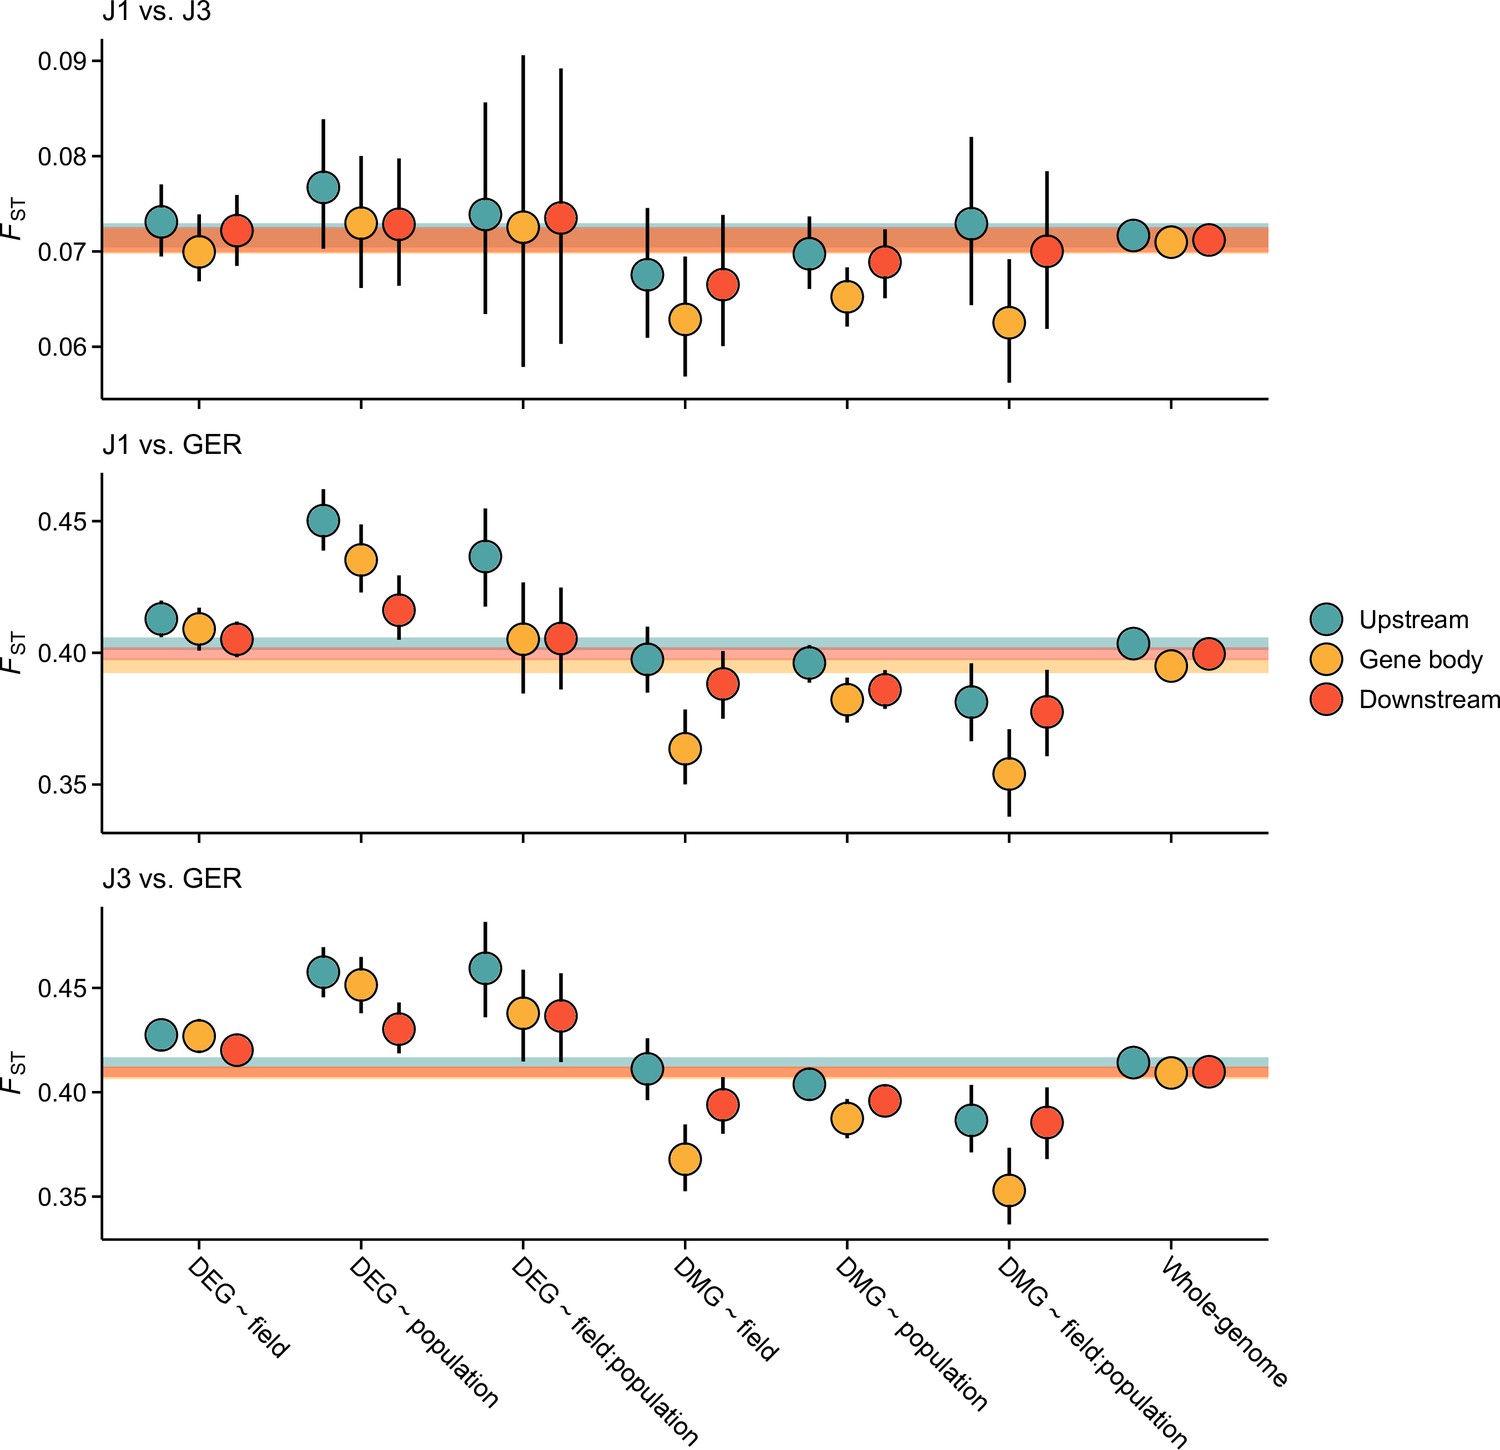
Pairwise FST estimates for the candidate gene sets.
Shown are estimates for gene bodies and 1 kb up- and downstream regions. Error bars show 95% bootstrap-based CIs. Shaded areas mark the 95% CIs across all genes.
Figure 3—figure supplement 4
Pairwise nucleotide diversity (π) at CG and non-CG differentially methylated genes (DMGs).
Shown are estimates for gene bodies and 1 kb up- and downstream regions. Error bars show 95% bootstrap-based CIs. Shaded areas mark the 95% CIs across all genes.
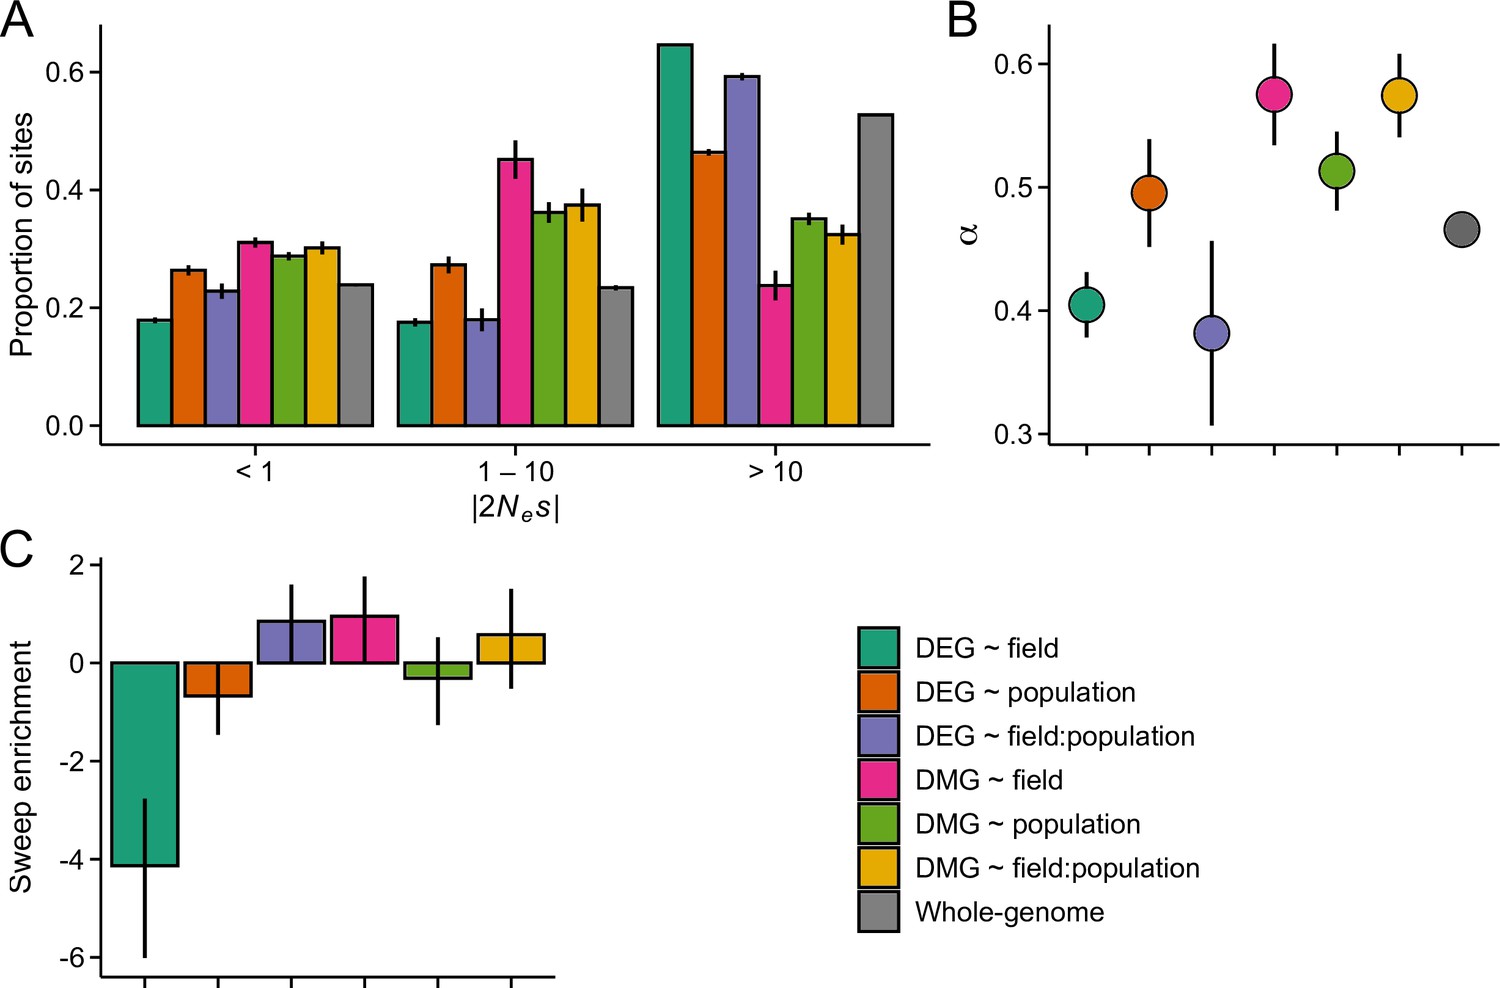
Figure 4 with 2 supplements
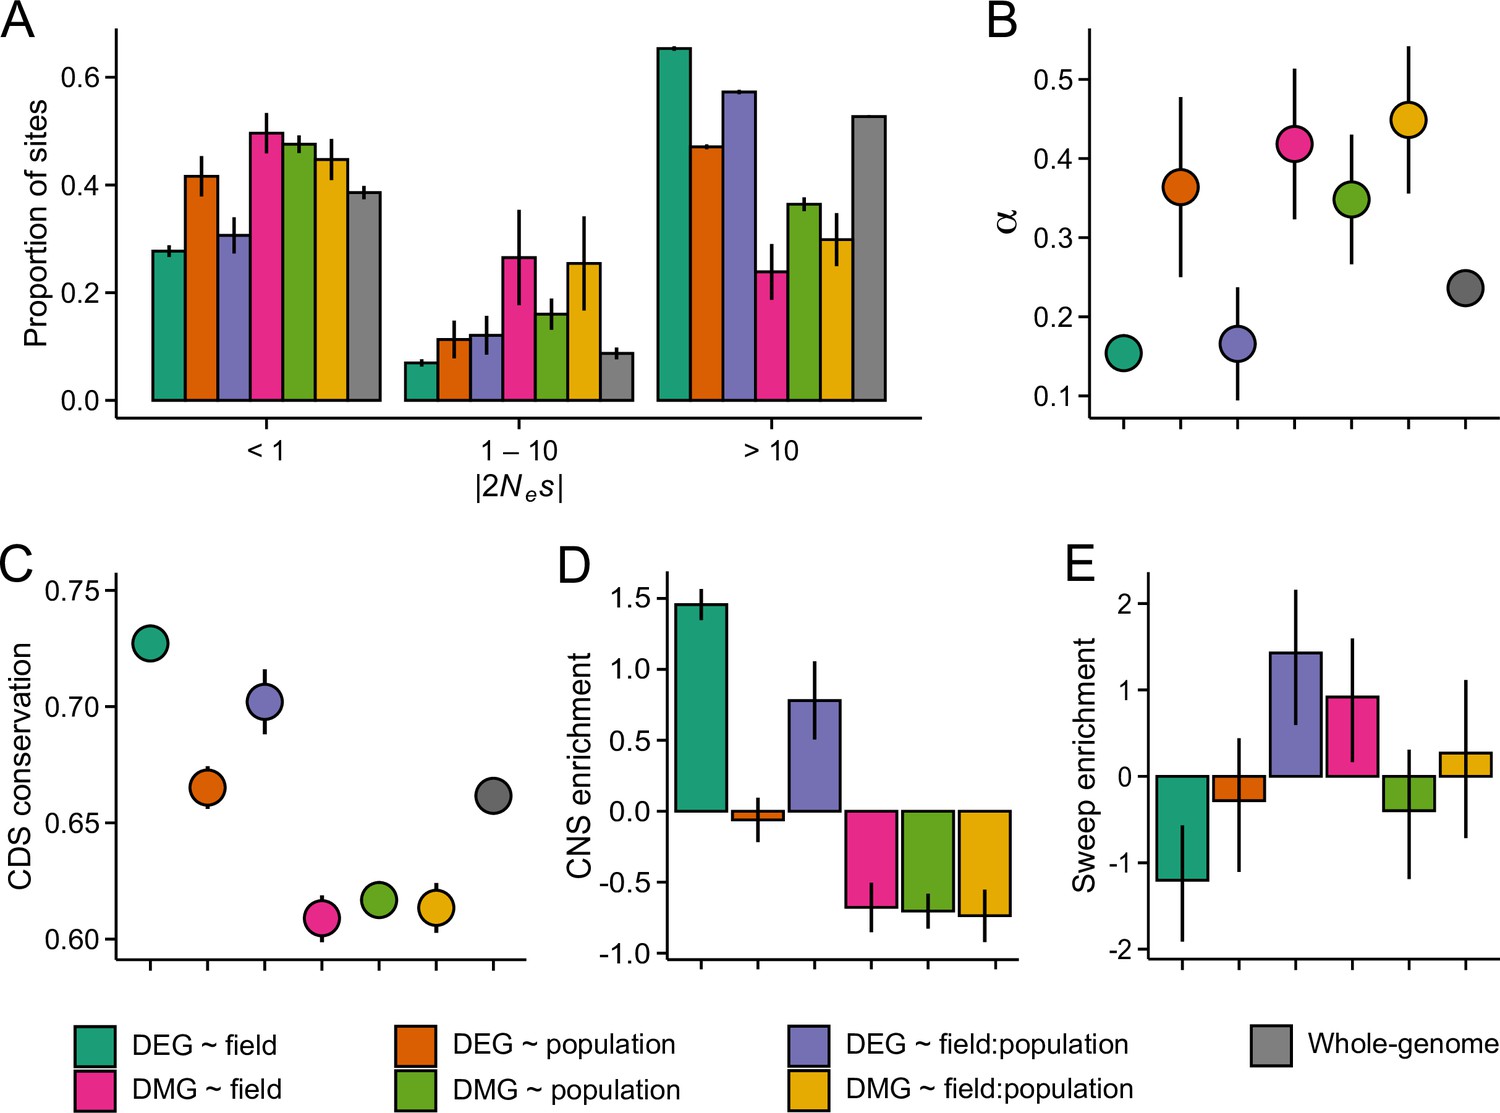
The efficacy of negative and positive selection at the candidate gene sets.
(A) The distribution of fitness effects of new nonsynonymous variants. The mutations were divided into three bins based on the strength of purifying selection (2Nes): nearly neutral, intermediate, and deleterious, respectively. (B) The proportion of sites fixed by positive selection (α). (C) The conservation of coding sequence (CDS). Shown are average GERP scores estimated for each gene group. The scores were rescaled from 0 to 1 using the range of possible values at each site. (D) The enrichment of conserved noncoding sequence (CNSs) 1 kb upstream of candidate genes. Shown are the log2 OR of association between CNSs and the candidate gene sets. (E) The enrichment of selective sweeps at the candidate genes. Shown are the log2 ORs of association between selective sweeps and the candidate gene sets. Panels A, B, and E show results for the J3 population (n=22). See Figure 4—figure supplements 1 and 21,2 for results on J1 (n=9) and GER (n=17), respectively. For all panels, error bars show 95% bootstrap-based CIs.
Figure 4—figure supplement 1
The efficacy of negative and positive selection at candidate gene sets in the J1 population (n=9).
(A) The distribution of fitness effect (DFE) of new nonsynonymous variants. (B) The proportion of sites fixed by positive selection (α). (C) The enrichment of selective sweeps at the candidate genes.
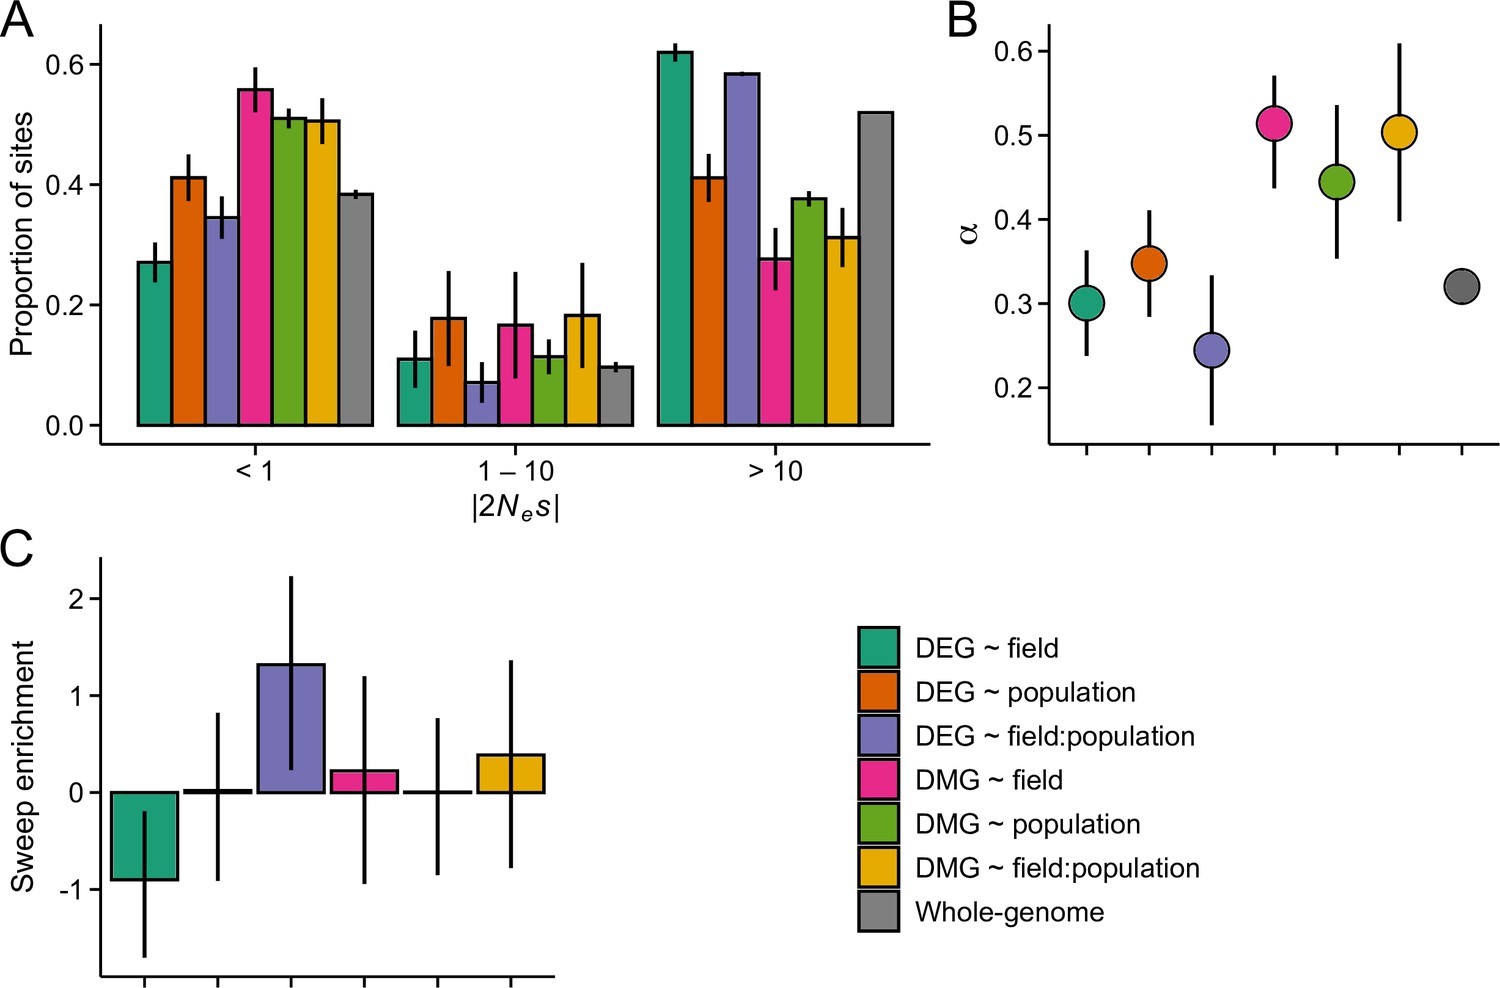
Figure 4—figure supplement 2
The efficacy of negative and positive selection at candidate gene sets in the GER population (n=17).
(A) The distribution of fitness effect (DFE) of new nonsynonymous variants. (B) The proportion of sites fixed by positive selection (α). (C) The enrichment of selective sweeps at the candidate genes.
Figure 5 with 10 supplements

Environmental response at transposable elements (TEs).
(A) Methylation levels across meta-genes and meta-TEs, shown for CG, CHG, and CHH contexts. Note the difference in y-axis scales between the panels. See Figure 5—figure supplements 1–3 for results on different TE superfamilies (B) The expression of TE families at low- and high-altitude field sites. See Figure 5—figure supplement 4 for results on different TE superfamilies. (C) Tajima’s D for TEs and nonsynonymous SNPs in the three populations. (D) The proportion of retrotransposons (class I) and DNA transposons (class II) in each population. See Figure 5—figure supplement 8 for results on different superfamilies. (E) Enrichment of TEs at gene bodies of differentially expressed genes (DEGs) and non-CG differentially methylated genes (DMGs). Shown are the log2 ORs of association between the four largest TE superfamilies and the candidate gene sets (Q<0.05). See Figure 5—figure supplement 10 for results on all TEs, including up- and downstream regions of genes. For C and D panels, error bars show 95% bootstrap-based CIs.
Figure 5—figure supplement 1
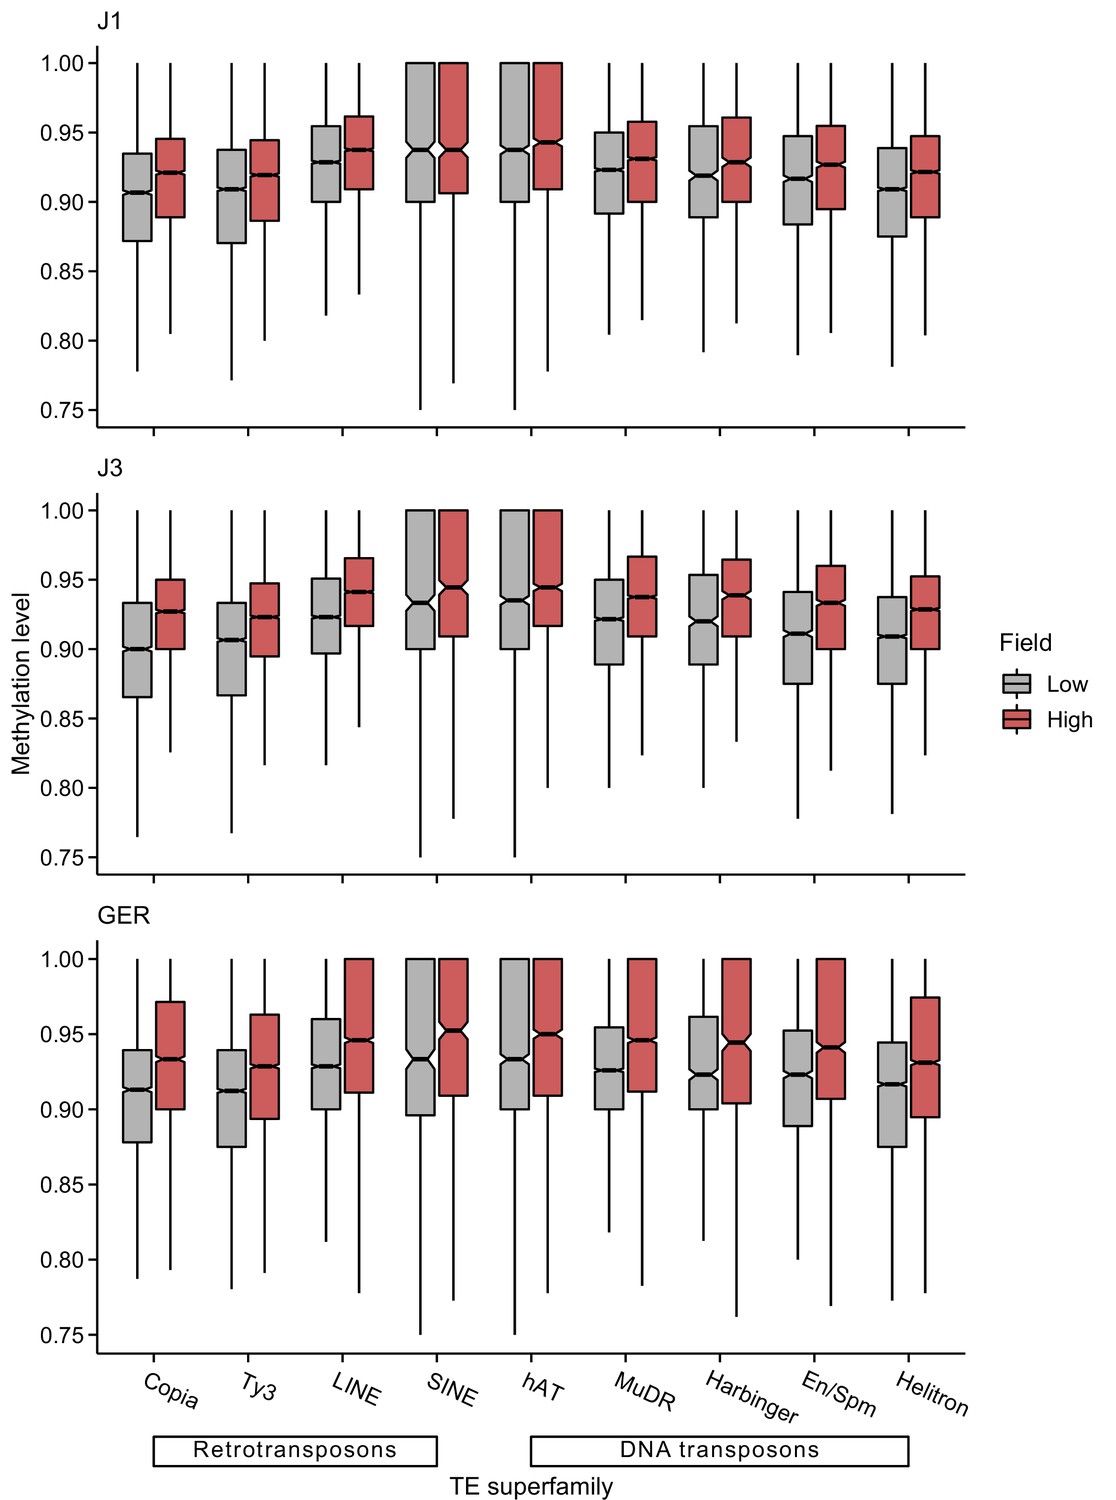
CG methylation levels of different transposable element (TE) superfamilies at low- and high-altitude field sites.
Figure 5—figure supplement 2
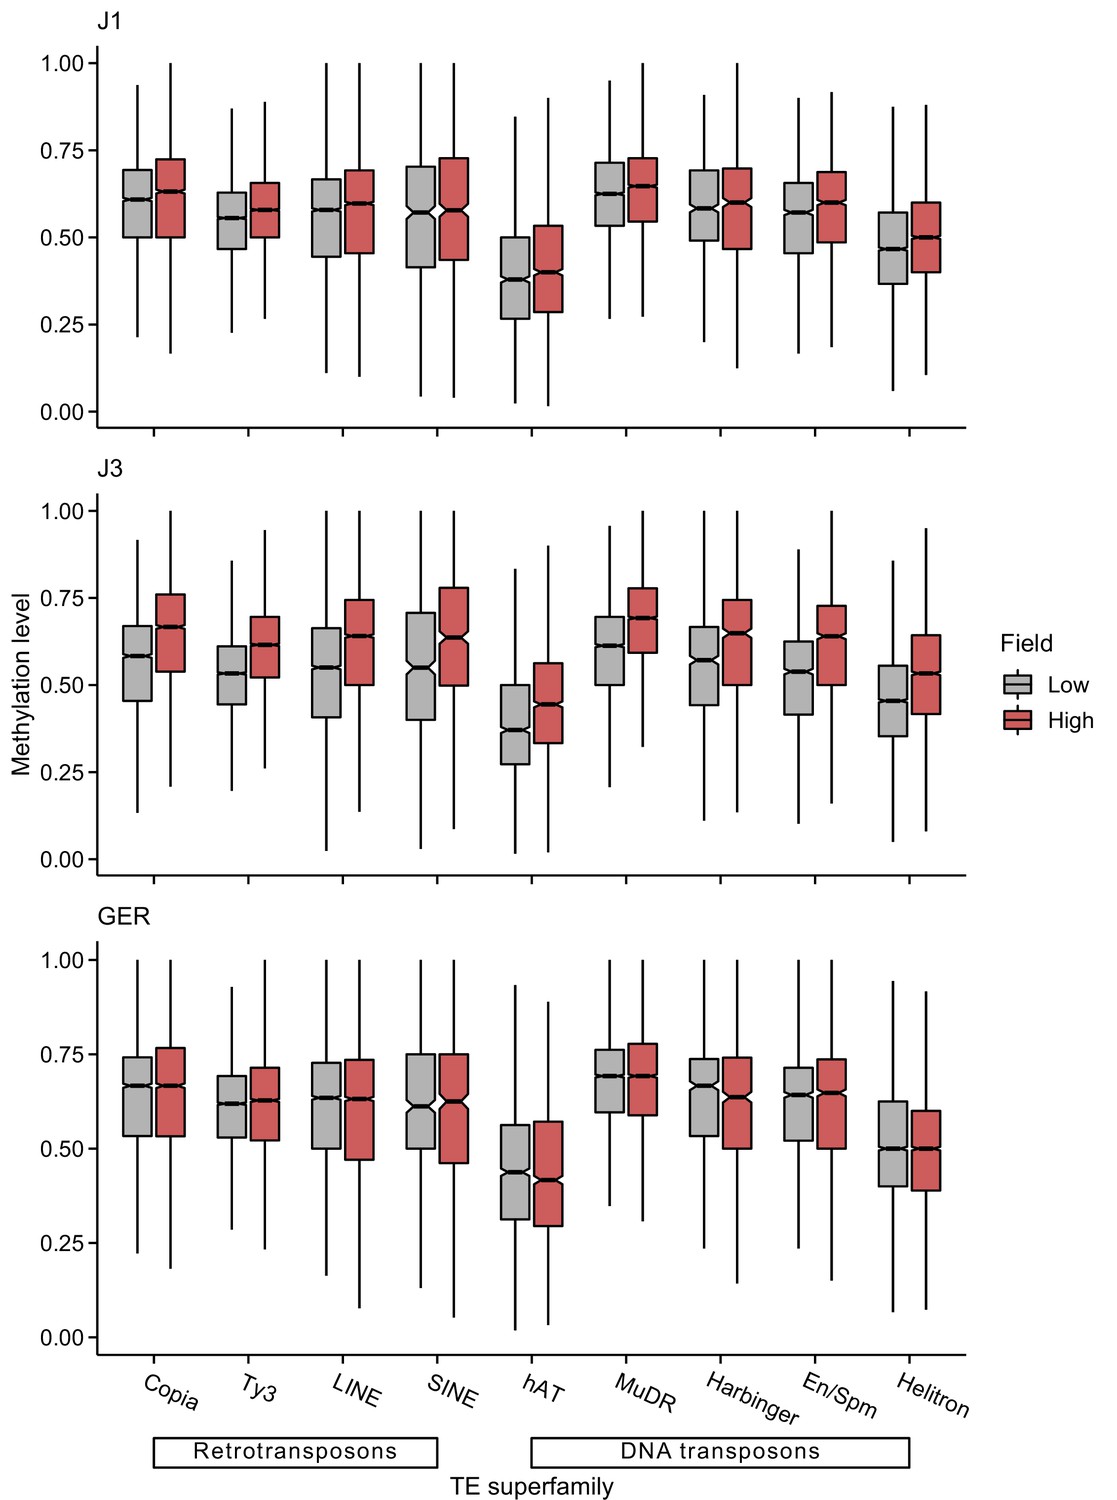
CHG methylation levels of different transposable element (TE) superfamilies at low- and high-altitude field sites.
Figure 5—figure supplement 3

CHH methylation levels of different transposable element (TE) superfamilies at low- and high-altitude field sites.
Figure 5—figure supplement 4

Expression levels of different transposable element (TE) superfamilies at low- and high-altitude field sites.
Figure 5—figure supplement 5
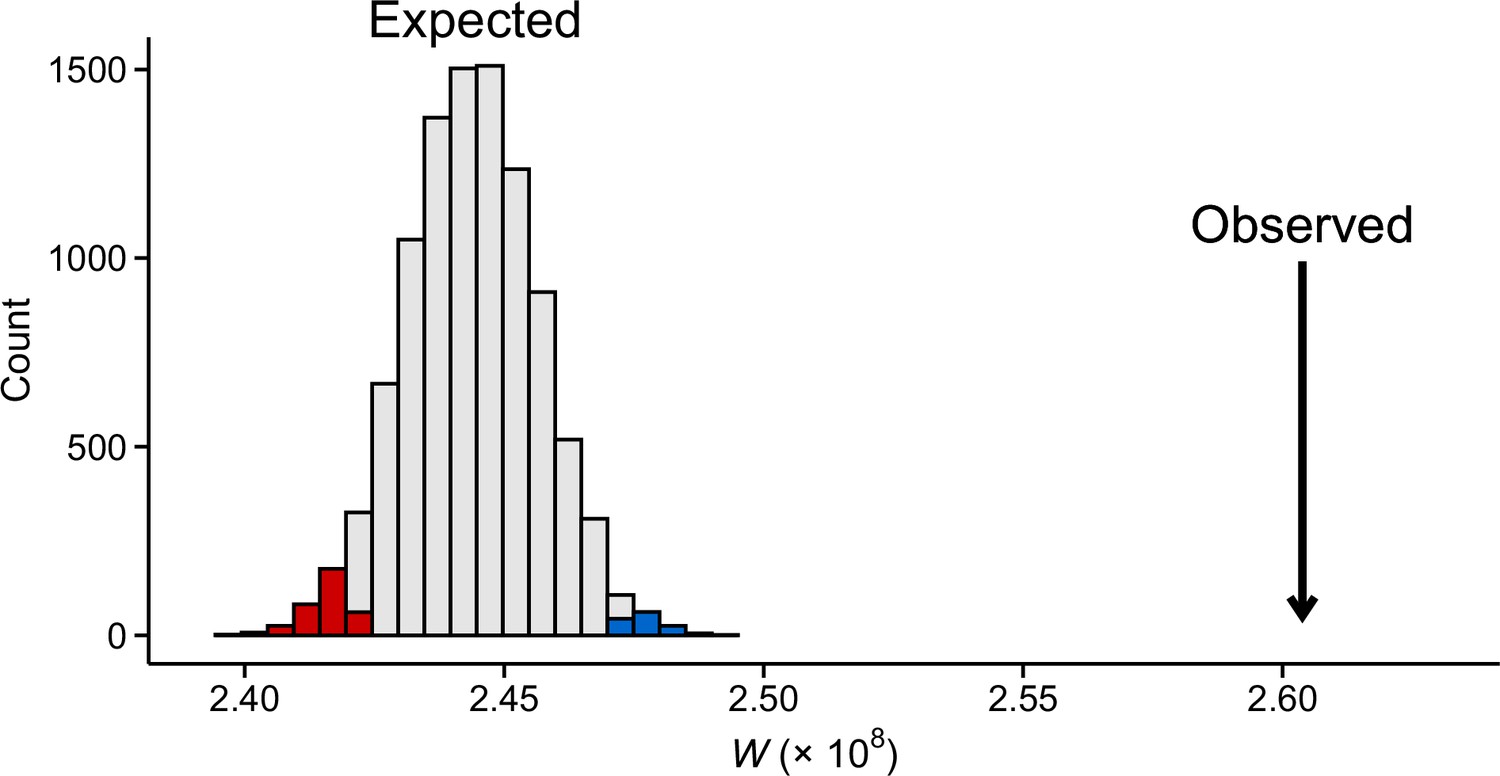
Observed transposable element (TE) expression difference between the field sites compared to 10,000 randomly compiled gene sets of equal size.
Shown are test statistics (W) from Wilcoxon rank-sum tests. Colors indicate p<0.05 (blue = higher expression in the high-altitude field and red = higher expression in low-altitude field). Data were normalized by applying variance stabilization transformation (VST) on combined gene and TE counts.
Figure 5—figure supplement 6

The association between gene expression and distance from the closest transposal element (TE; upstream of transcription start site [TSS]).
Data were split into 100 bp nonoverlapping windows based on their distance and average expression level calculated for each window.
Figure 5—figure supplement 7
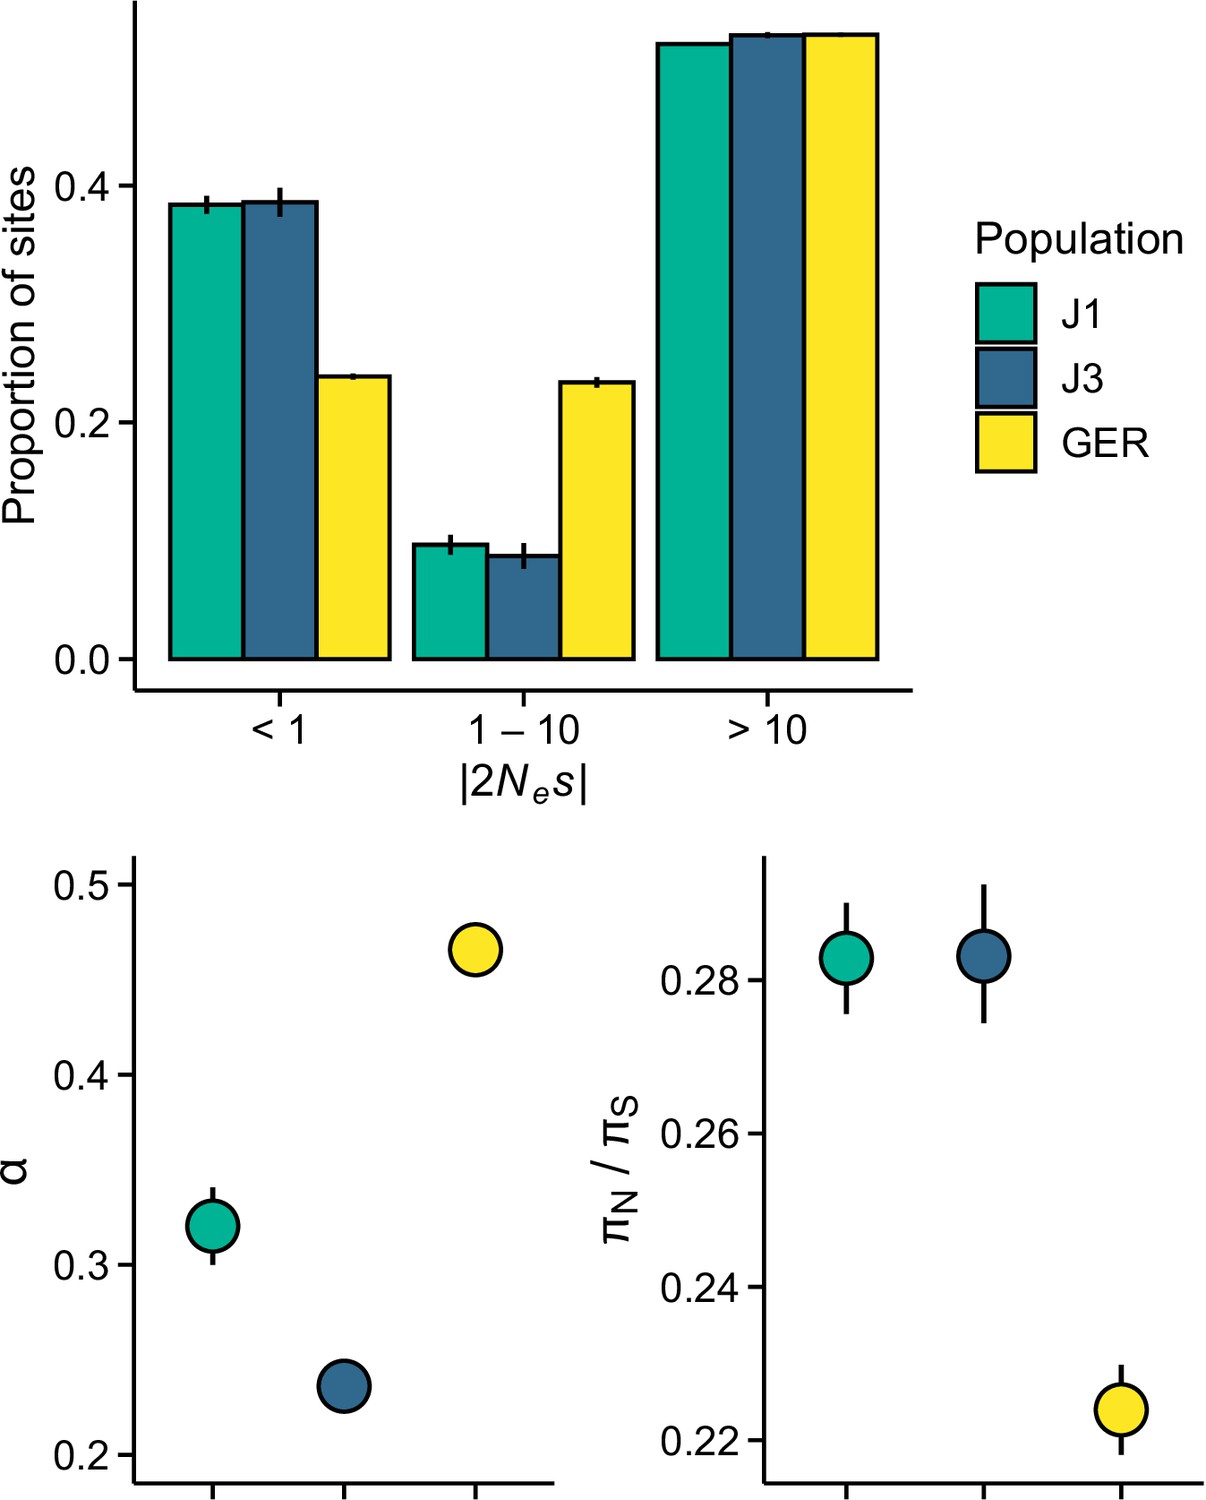
Efficacy of selection in the three populations.
(A) The distribution of fitness effect (DFE) of new nonsynonymous variants. (B) The proportion of sites fixed by positive selection (α). (C) The ratio of nonsynonymous to synonymous nucleotide diversity (πN/πS).
Figure 5—figure supplement 8
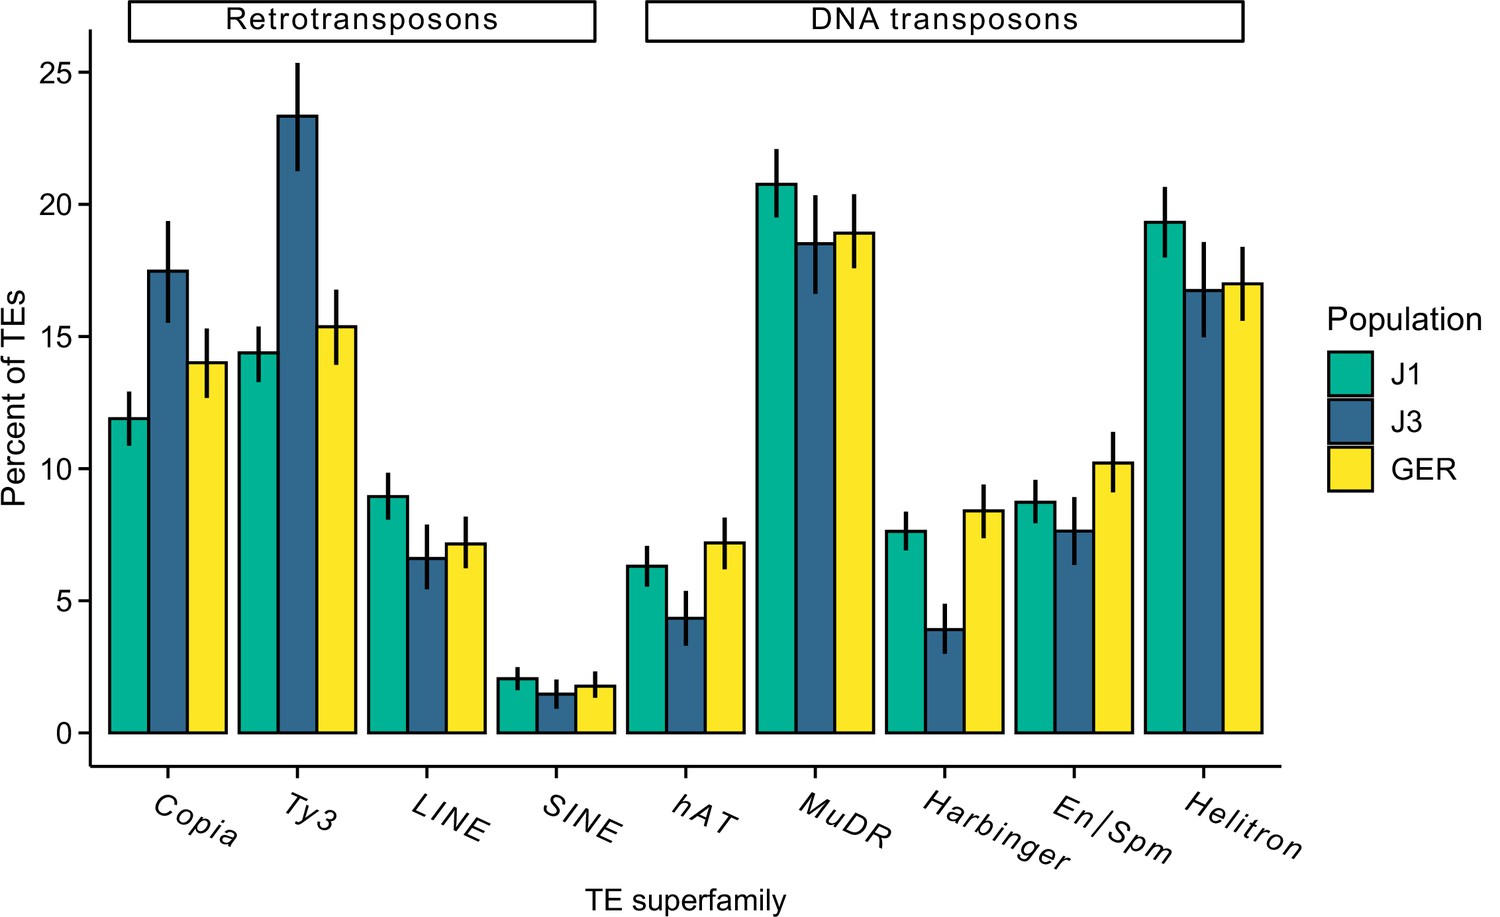
The proportion of different transposal element (TE) superfamilies in each population.
Figure 5—figure supplement 9
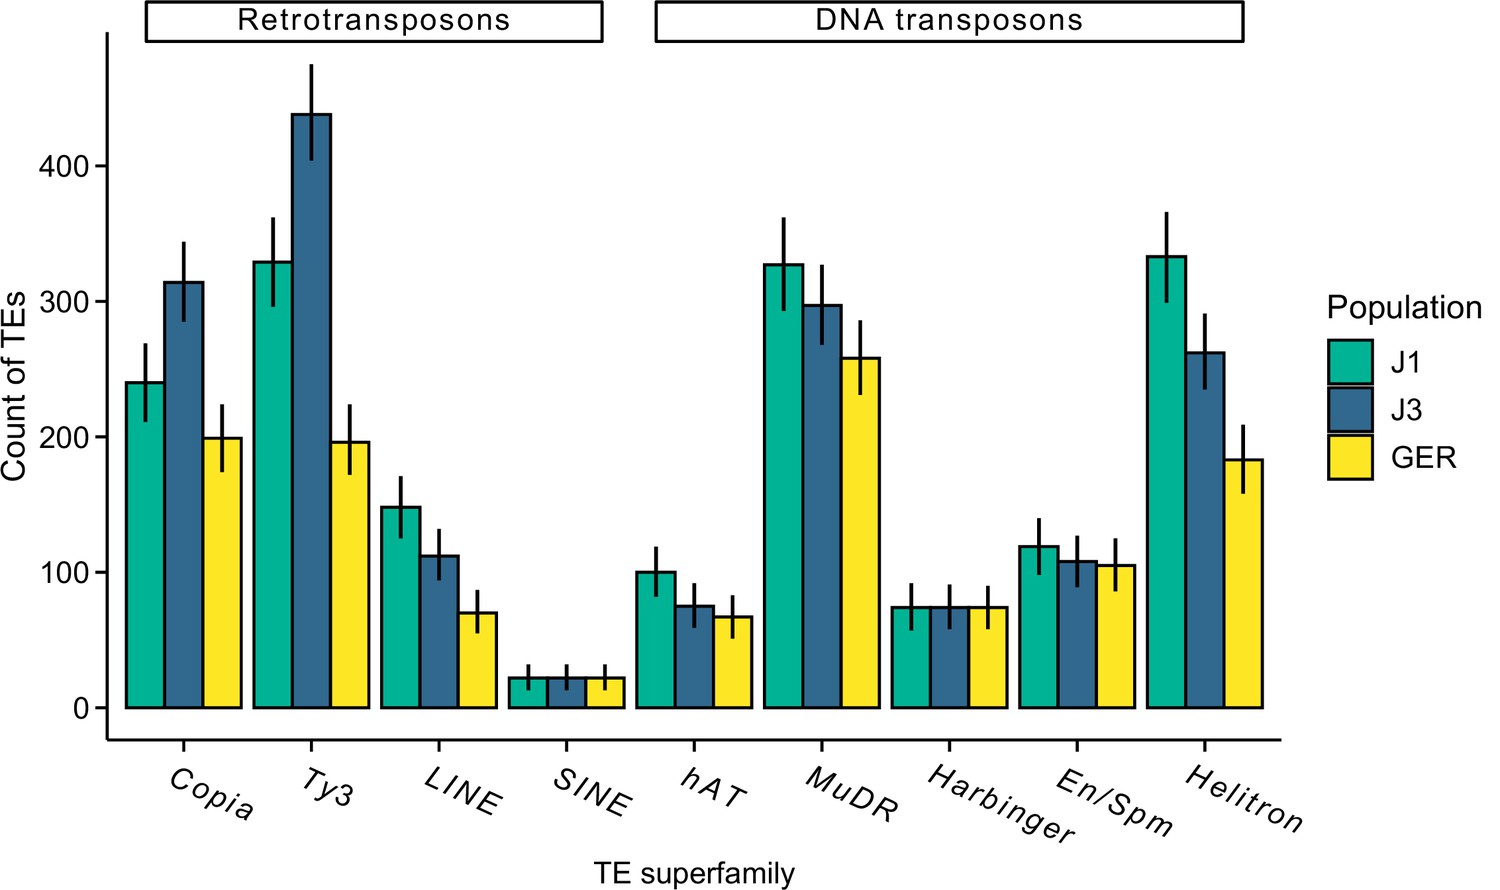
The count of different transposal element (TE) superfamilies in each population.
The analysis was conducted using the same sample size for each population (n=9) and the same number of aligned read pairs for each sample (20 million).
Figure 5—figure supplement 10

The log2 OR of association between transposal elements (TEs) and the candidate gene sets.
Shown are estimates for gene bodies and 1 kb up- and downstream regions. Error bars show 95% bootstrap-based CIs.
Appendix 1—figure 1
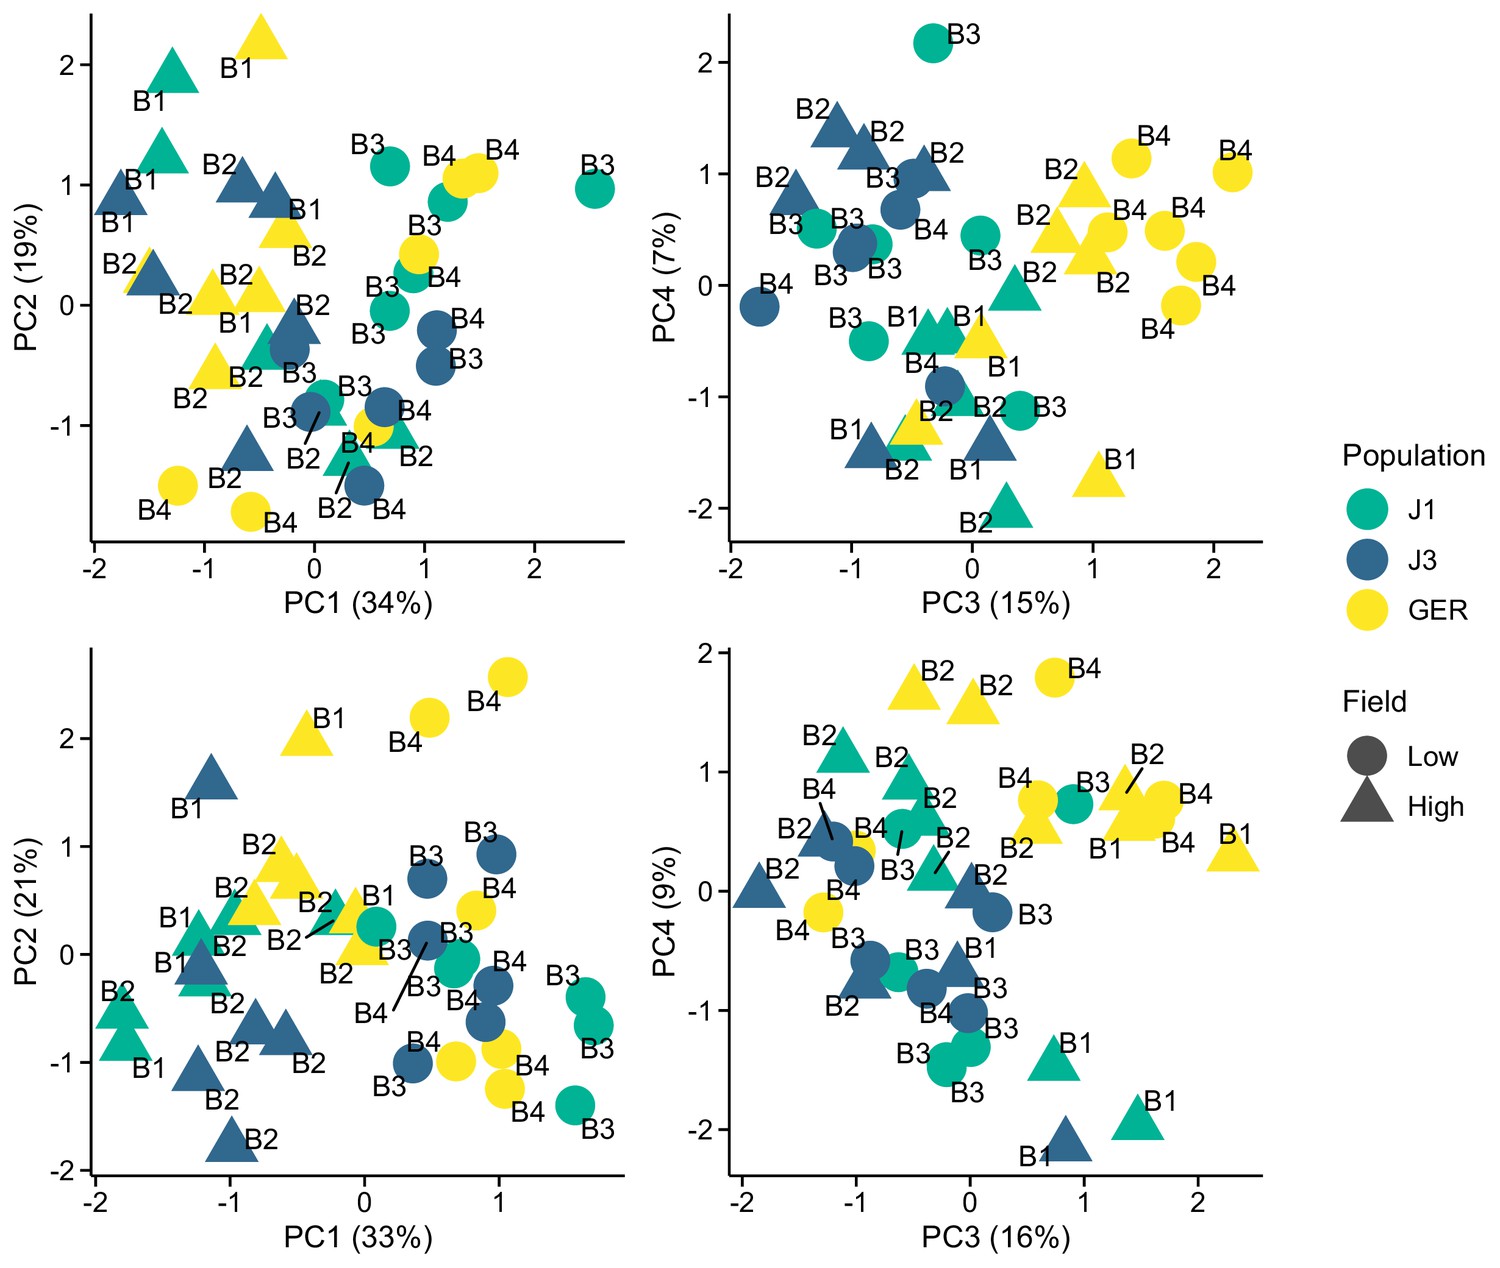
Expression variation along first four eigenvectors of a principal component analysis (PCA) conducted using stably expressed reference genes.
The sequencing batch (B1, B2, B3, and B4) is marked next to the symbols. Top panels: 20 genes from Czechowski et al., 2005. Bottom panels: 13 genes from Kudo et al., 2016.
Tables
Table 1
Models for likelihood-ratio tests (LRTs) and the number of identified differentially expressed genes (DEGs) and differentially methylated genes (DMGs).
| Gene set | Full and reduced model | Number |
|---|---|---|
| DEG ~ field | Expression ~ population + field Expression ~ population | 3456 |
| DEG ~ population | Expression ~ field + population Expression ~ field | 1476 |
| DEG ~ field:population | Expression ~ field + population + field:population Expression ~ field + population | 477 |
| DMG-CG ~ field | CG methylation ~ CH% + population + field CG methylation ~ CH% + population | 112 |
| DMG-CG ~ population | CG methylation ~ CH% + field + population CG methylation ~ CH% + field | 641 |
| DMG-CG ~ field:population | CG methylation ~ CH% + field + population + field:population CG methylation ~ CH% + field + population | 260 |
| DMG-CH ~ field | CH methylation ~ population + field CH methylation ~ population | 1036 |
| DMG-CH ~ population | CH methylation ~ field + population CH methylation ~ field | 3580 |
| DMG-CH ~ field:population | CH methylation ~ field + population + field:population CH methylation ~ field + population | 680 |
-
CH = CHG and CHH.
-
CH% = methylation rate at CHG and CHH contexts.
Additional files
-
Supplementary file 1
Number of read pairs and mapping rates for each sample.
- https://cdn.elifesciences.org/articles/83115/elife-83115-supp1-v1.docx
-
Supplementary file 2
Bisulfite conversion efficacy for each sample.
- https://cdn.elifesciences.org/articles/83115/elife-83115-supp2-v1.docx
-
Supplementary file 3
Species used in estimating nucleotide conservation with GERP++.
- https://cdn.elifesciences.org/articles/83115/elife-83115-supp3-v1.docx
-
MDAR checklist
- https://cdn.elifesciences.org/articles/83115/elife-83115-mdarchecklist1-v1.pdf
Download links
A two-part list of links to download the article, or parts of the article, in various formats.
Downloads (link to download the article as PDF)
Open citations (links to open the citations from this article in various online reference manager services)
Cite this article (links to download the citations from this article in formats compatible with various reference manager tools)
Environmental response in gene expression and DNA methylation reveals factors influencing the adaptive potential of Arabidopsis lyrata
eLife 11:e83115.
https://doi.org/10.7554/eLife.83115


