Common genetic variations in telomere length genes and lung cancer: a Mendelian randomisation study and its novel application in lung tumour transcriptome
- Genomic Epidemiology branch, International Agency for Research on Cancer/World Health Organization (IARC/WHO), France
- Cancer Epidemiology Unit, University of Oxford, United Kingdom
- MRC Integrative Epidemiology Unit, Bristol Population Health Science Institute, Bristol Medical School (PHS), United Kingdom
- Department of Cardiovascular Sciences, University of Leicester, United Kingdom
- NIHR Leicester Biomedical Research Centre, Glenfield Hospital, United Kingdom
- Ludwig Lausanne Branch, Faculty of Biology and Medicine, Switzerland
- Institute for Clinical and Translational Research, Baylor College of Medicine, United States
- Lunenfeld-Tanenbaum Research Institute, Sinai Health, Canada
- Departament of Epidemiology and Population Health, Stanford University, United States
Figures
Figure 1 with 1 supplement
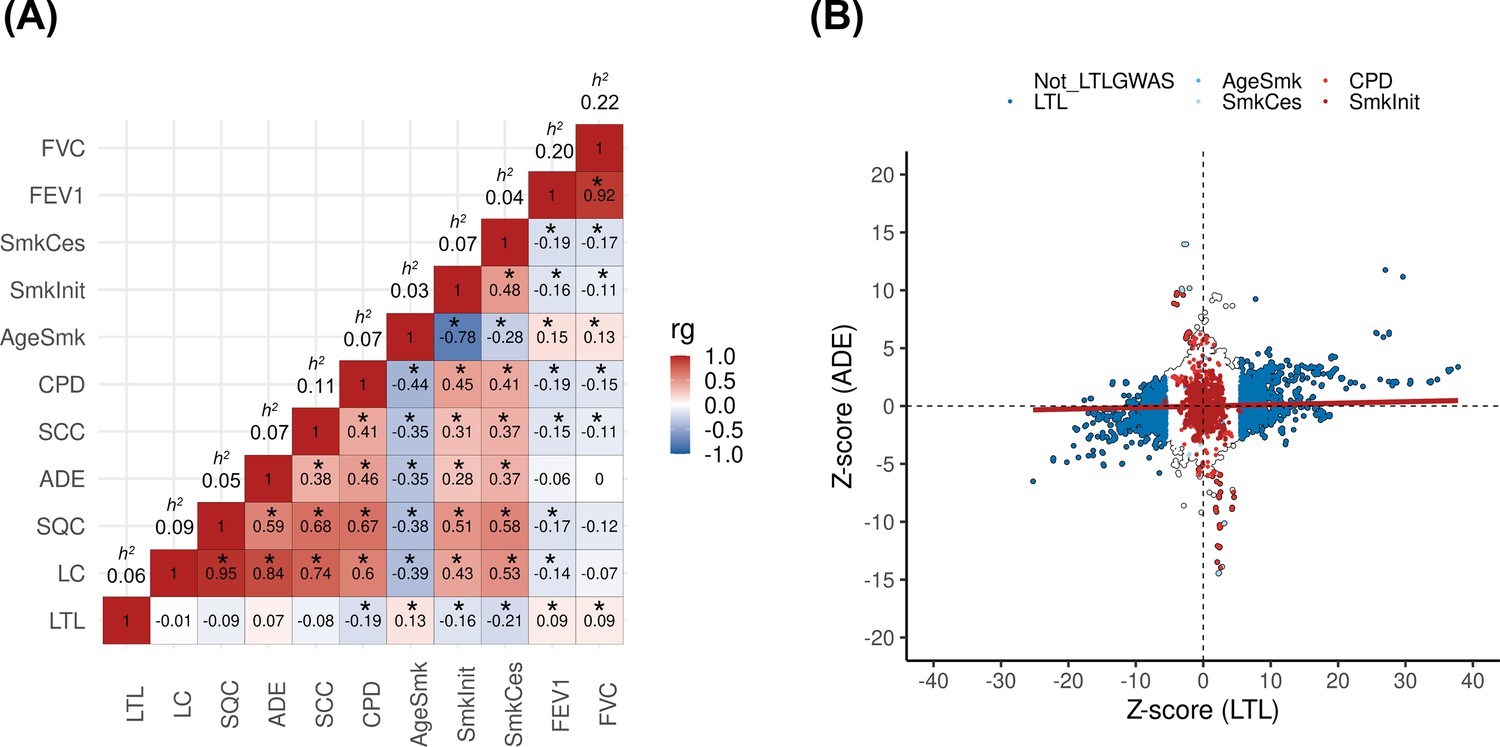
Genetic correlations between leukocyte telomere length (LTL) and lung cancer (LC) related traits.
(A) Heatmap representing the genetic correlation analyses (rg) for LTL across LC, histological subtypes (lung adenocarcinoma [ADE], squamous cell carcinoma [SQC], and small-cell carcinoma [SCC]), smoking propensity (cigarettes per day [CPD], smoking cessation [SmkCes], Smoking initiation [SmkInit], and age of smoking initiation [AgeSmk]), and lung function related (forced vital capacity [FVC] and forced expiratory volume [FEV1]) traits. The black star indicates correlations that passed Bonferroni correction (p<4x10–04). Heritability (h2) as the proportion of the phenotypic variance caused by SNPs. (B) Plot of Z-scores (ADE versus LTL), restricting to the Hapmap SNPs (~1.2 million) but excluding HLA region. Genome-wide significant SNPs (p<5x10–08) for each trait were coloured (CPD in red, SmkInit in dark red, LTL in dark blue, AgeSmk in blue, SmkCes in lightblue, and not genome-wide hits for LTL or any other selected trait in white). Linear regression line was coloured in red.
Figure 1—figure supplement 1
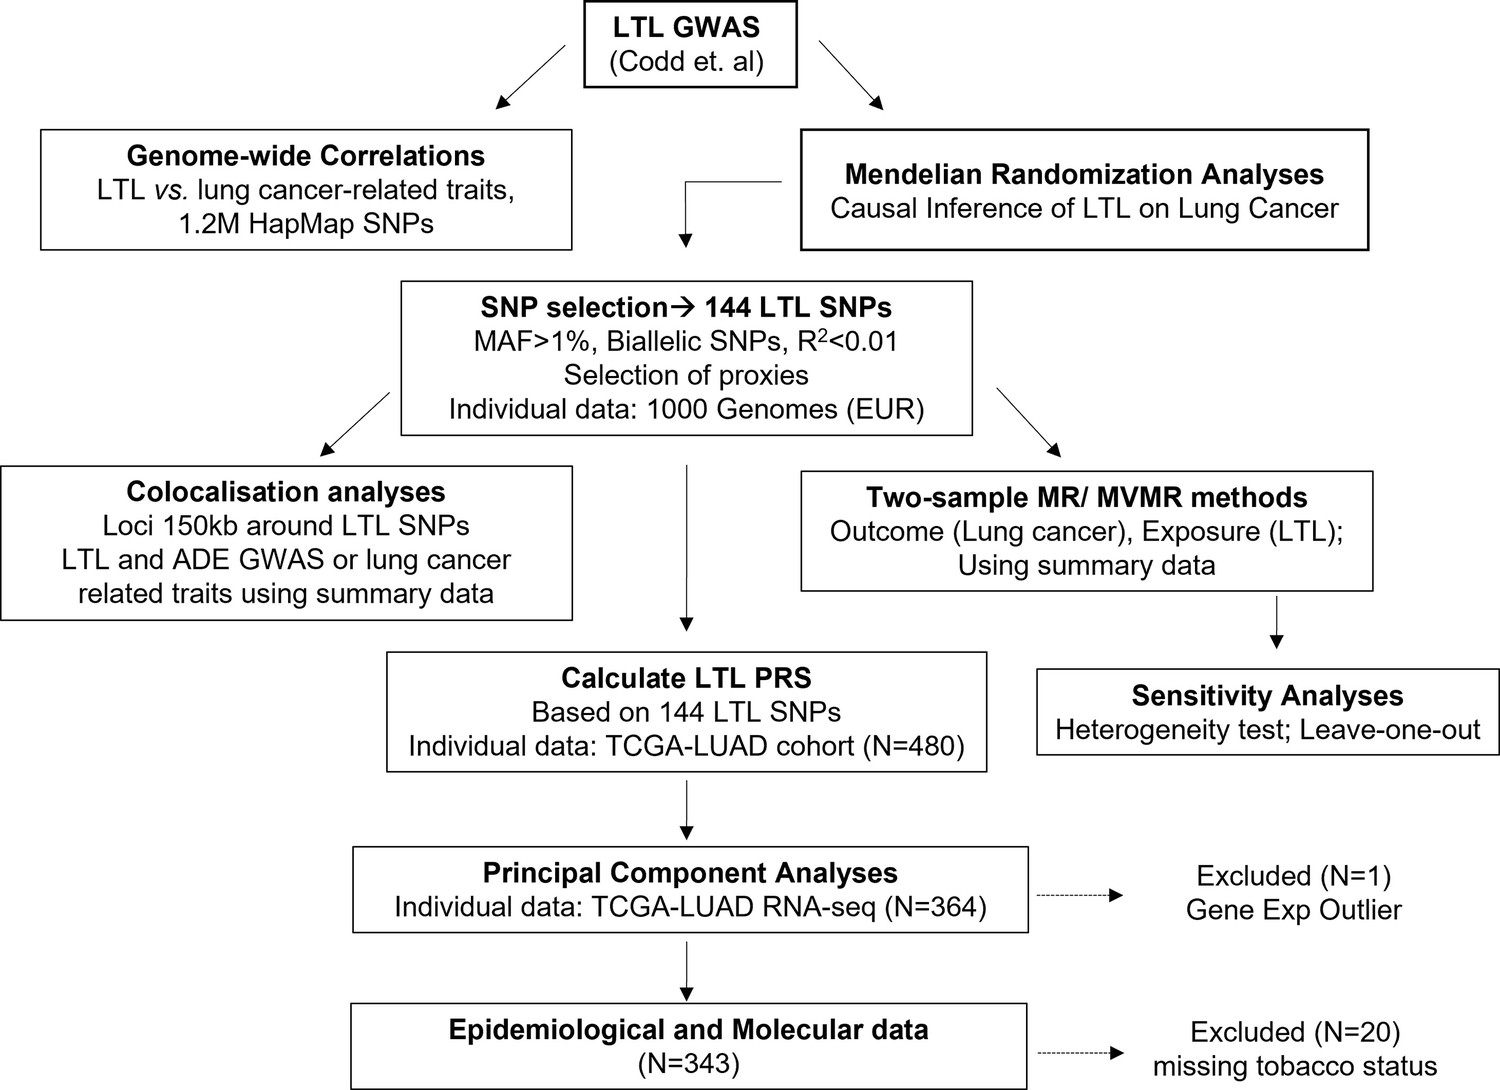
Design of the study.
Upper: the leukocyte telomere length (LTL) variants were derived from the latest genome-wide association study (GWAS) in UK Biobank (UKBB) participants by Codd et al. Genome-wide correlations between LTL and lung cancer related traits were performed. Focus on a subset of LTL variants selected for Mendelian randomisation (MR) framework. Middle: selection of independent SNPs as LTL instrument for causal inference of LTL on lung cancer risk. Explore biological meaning of these variants using colocalisation methods and principal component analyses to summarise gene expression data. Bottom: calculate LTL polygenic risk score (PRS) based on the 144 SNPs and evaluate its association with principal components and epidemiological, and molecular data of lung adenocarcinoma tumours from The Cancer Genome Atlas (TCGA) dataset (TCGA-lung adenocarcinoma [LUAD]).
Figure 2 with 1 supplement

Genetically predicted leukocyte telomere length (LTL) association with lung cancer.
Lung cancer (by histology or by smoking status) risk associations with the LTL instrument from the inverse-variance-weighted MR analyses are expressed as OR per SD increase in genetically predicted LTL. Statistically significant associations with p-values<0.05 (red square). Heterogeneity is estimated by the statistic I2, tau variance of subgroups (τ2), and p-values for Cochran’s Q heterogeneity measure.
Figure 2—figure supplement 1
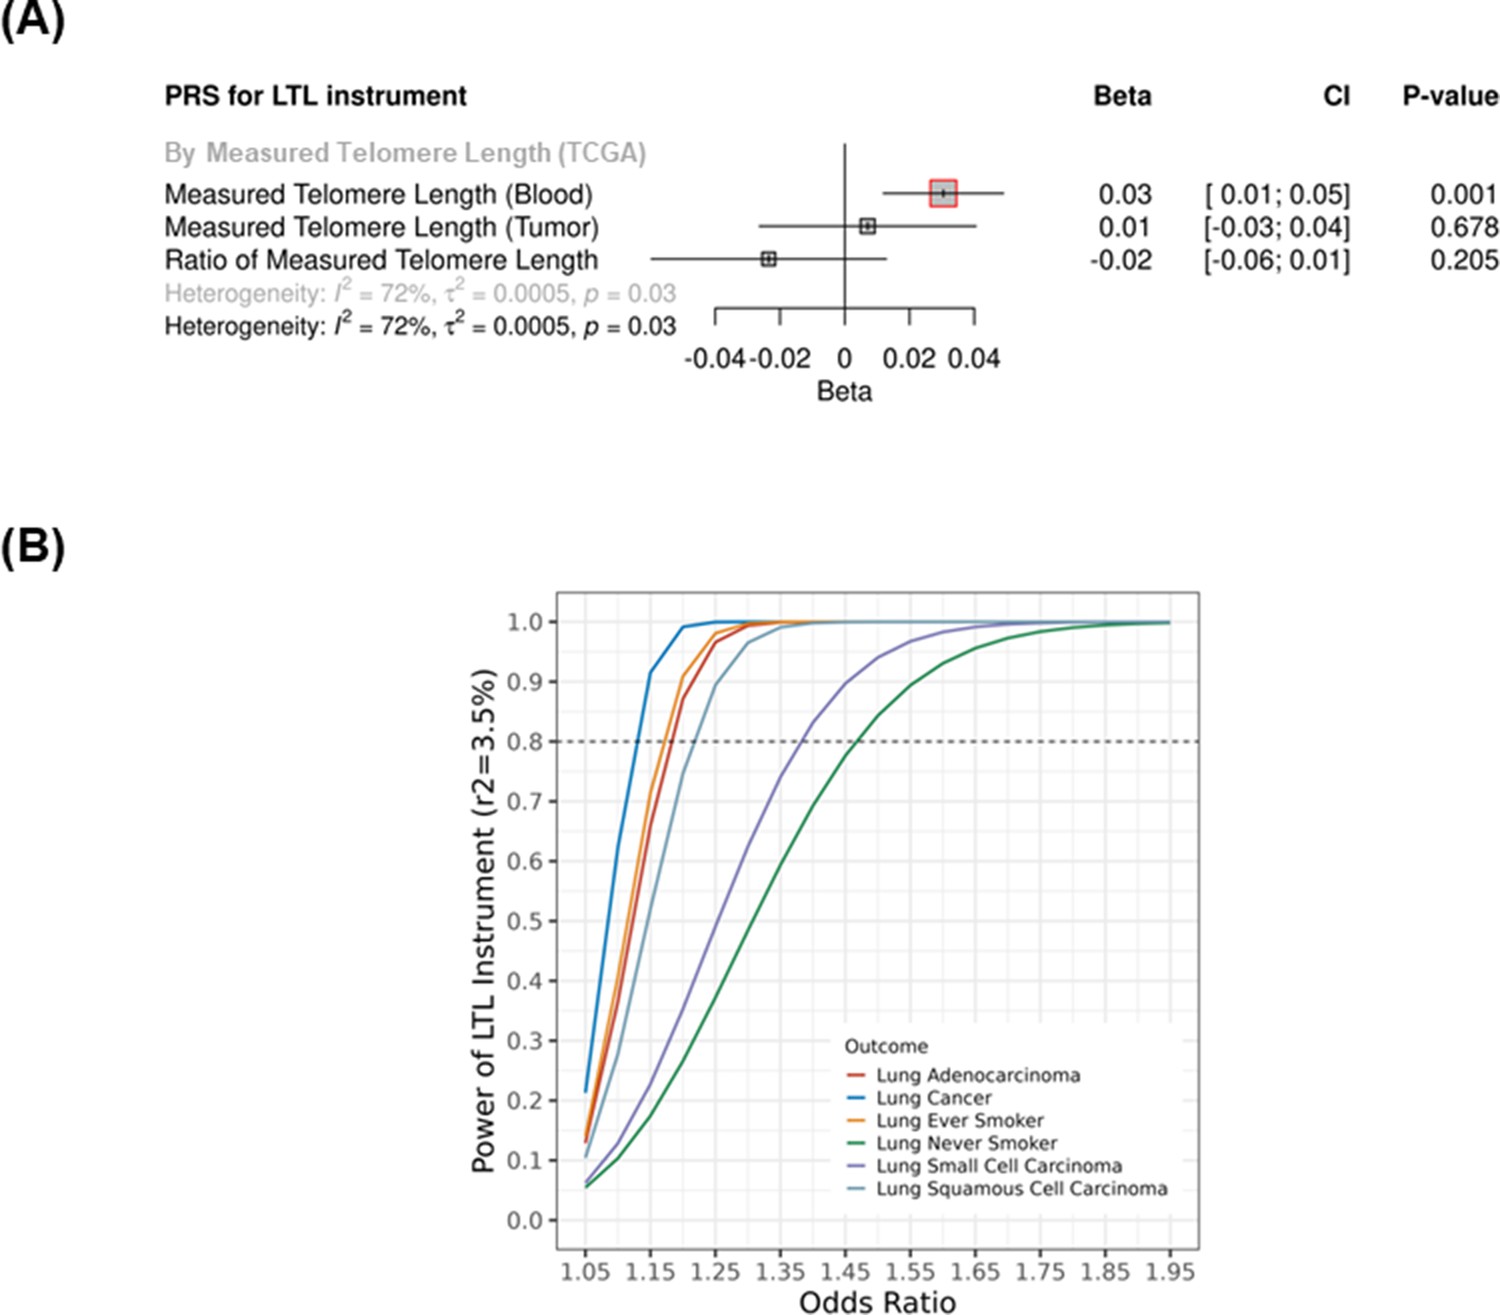
Sensitivity analysis of the genetically predicted leukocyte telomere length (LTL) Mendelian randomisation (MR) instrument.
(A) Telomere length (TL) was measured by Barthel et al. in a subset of high-confident samples from The Cancer Genome Atlas (TCGA) cohorts using whole-genome sequencing (n=655). TL was directly measured in blood and tumour samples, and log(tTL/nTL) were also obtained from several TCGA cohorts. Associations were expressed as beta estimate per SD longer LTL in log scale. p-Values<0.05 (red square). Sex, age at diagnosis, cohort, and principal components of genetic ancestry (PC1-5) were used as covariates in the linear regression model. Heterogeneity is estimated by the statistic I2, tau variance of subgroups (τ2), and p-values for Cochran’s Q heterogeneity measure. (B) Power calculation by lung cancer strata considering a variance explained by the LTL instrument of 3.5% and alpha type-1 error rate of 5%.
Figure 3 with 1 supplement
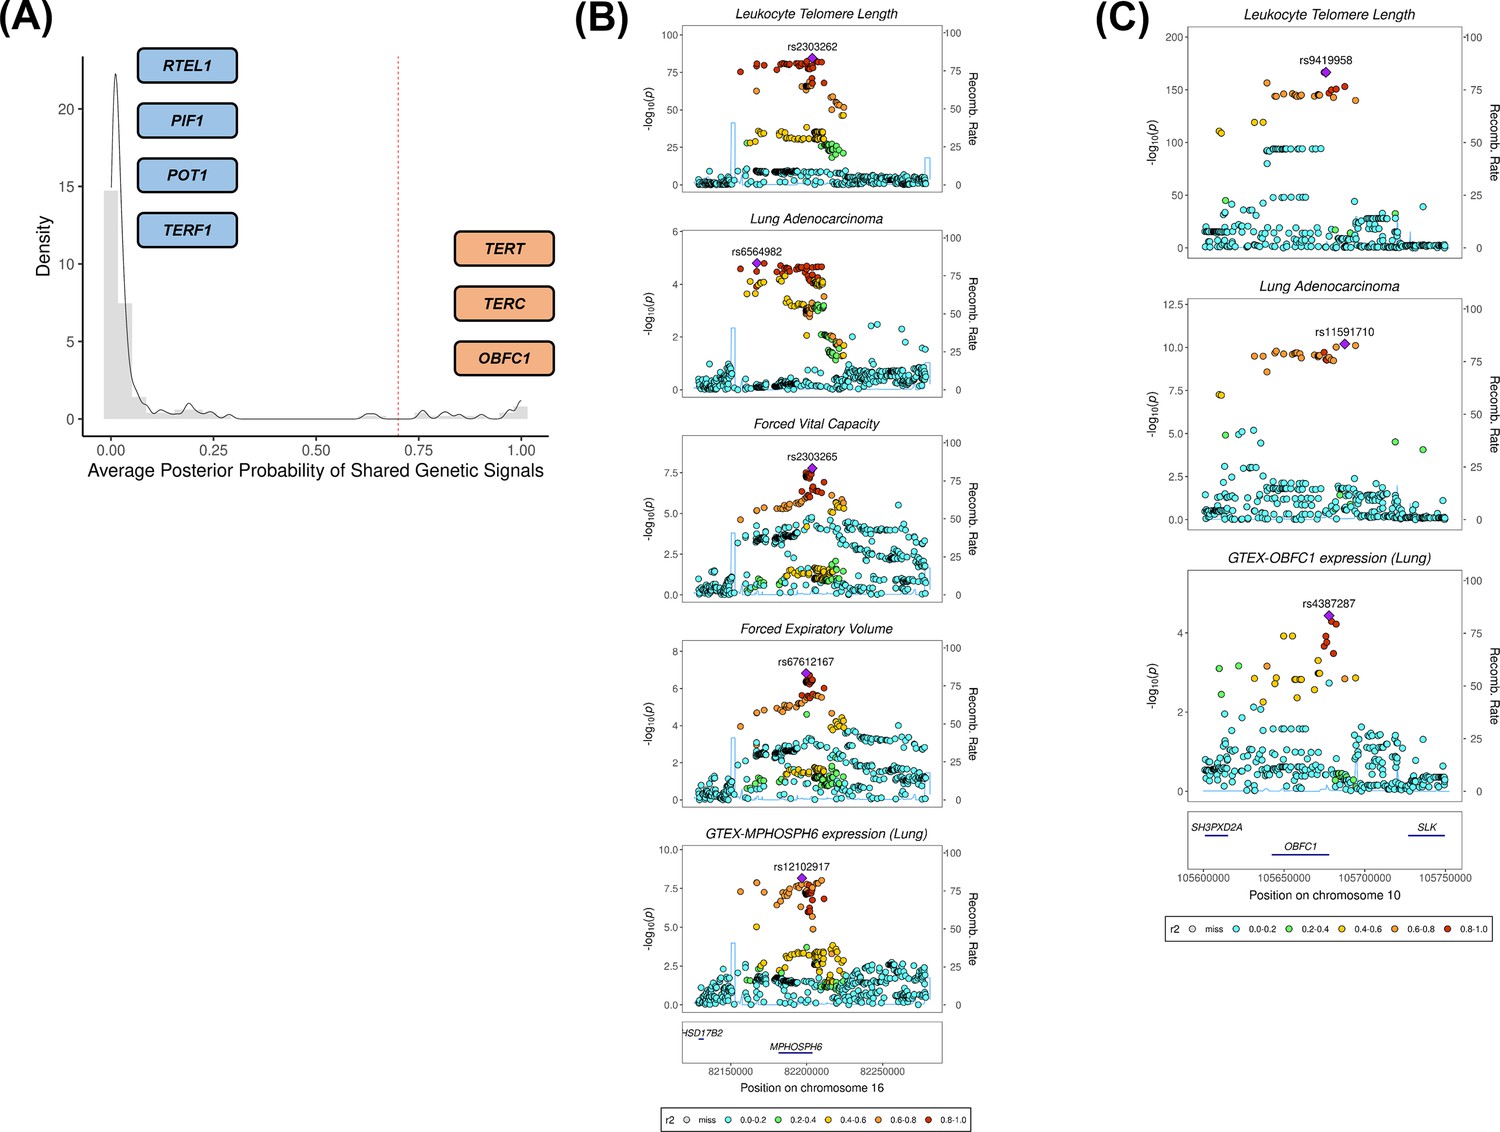
Colocalisation analyses for the genetic loci defined by the 144 leukocyte telomere length (LTL) variants.
(A) Distribution of the average posterior probability for shared genetic loci between LTL and lung adenocarcinoma, highlighting in orange the telomere maintenance loci that colocalised (avg_PP4≥0.70) and in blue the ones where there was limited evidence for colocalisation (avg_PP4<0.70). Dashed red line represents the arbitrary avg_PP4 cutoff of 0.70. Representative stack plots for the multi-trait colocalisation results within (B) MPHOSPH6 and (C) OBFC1 loci, centred on a 150 kb LD window of rs2303262 and rs9419958 variants, respectively. Left Y-axis represents the –log10(p-values) of the association in the respective genome-wide association study for a given trait. The right Y-axis represents the recombination rate for the genetic loci. The X-axis represents the chromosome position. SNPs are coloured by the linkage disequilibrium correlation threshold (r2) with the query labelled SNP in European population. Sentinel SNPs within the defined LD window were labelled in each trait.
Figure 3—figure supplement 1
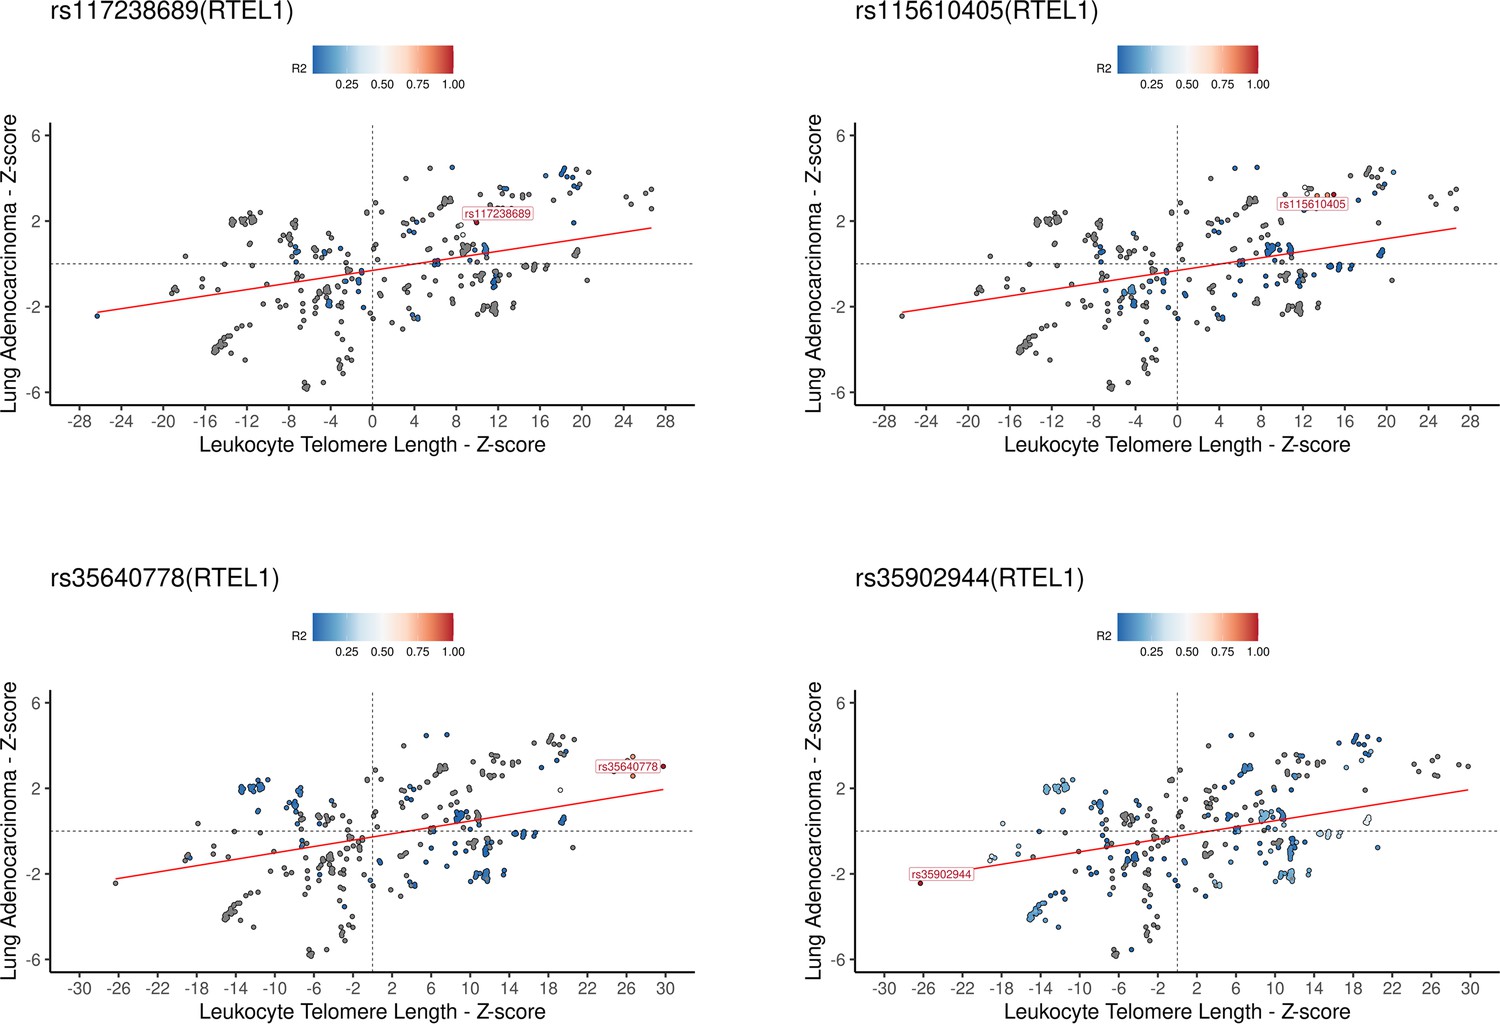
Association plots for leukocyte telomere length (LTL) and lung adenocarcinoma at RTEL1 locus.
Z-score plots for genetically predicted LTL and lung adenocarcinoma risk for the four LTL variants annotated for RTEL1. The genetic variants were coloured by the linkage disequilibrium correlation threshold (r2) with the query labelled SNP in a defined LD window of 150 kb centred on the query SNP in European populations. Z-score defined as the beta estimate divided by SE for each SNPs in the respective genome-wide association study.
Figure 4 with 1 supplement
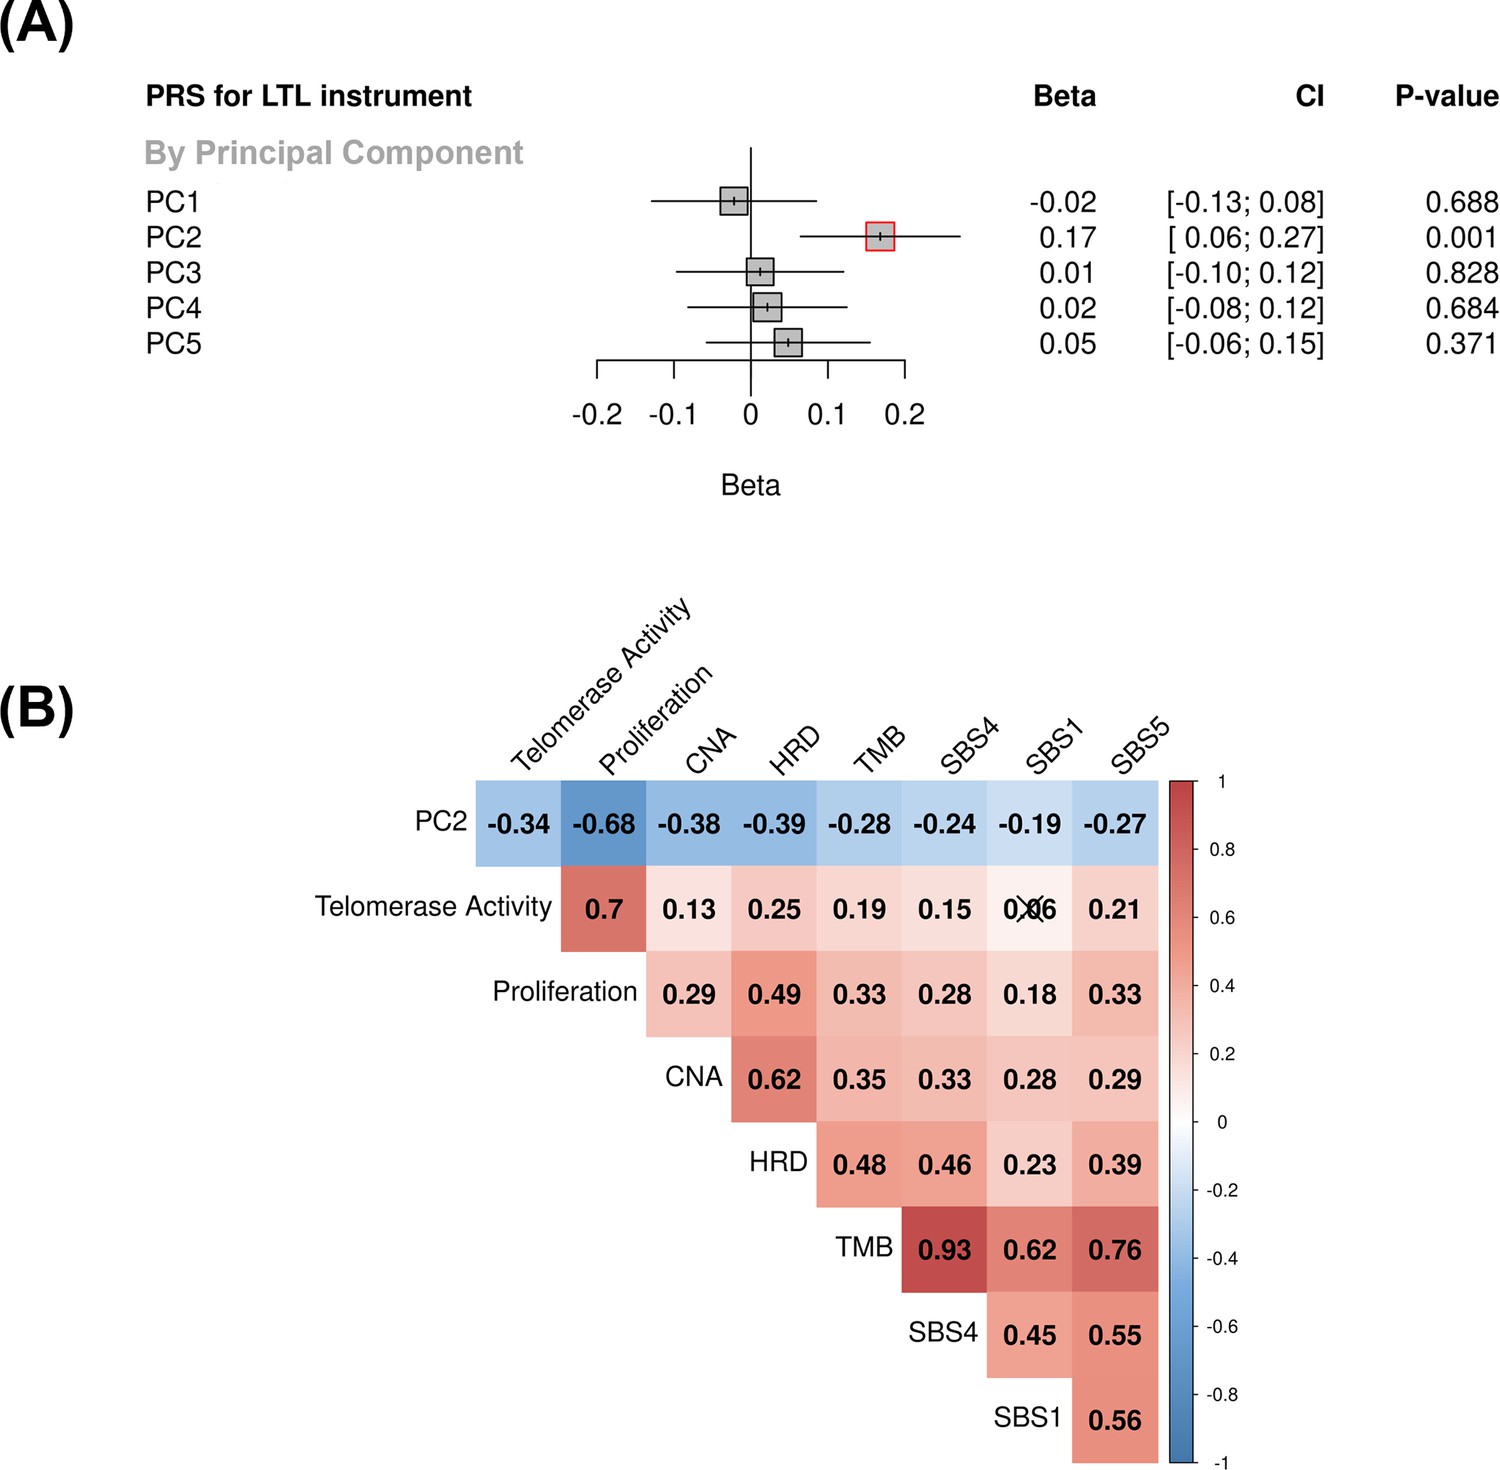
Associations between molecular expression patterns of lung adenocarcinoma tumours, LTL PRS, and The Cancer Genome Atlas (TCGA) features.
(A) LTL PRS association with the first five principal components based on RNA-sequencing data of lung adenocarcinomas tumours (n=343). Results are expressed as beta estimate per SD increase in genetically predicted LTL. Linear regression model adjusted by sex, age, smoking status, and PC1-5 (genetic ancestry) covariates. Statistically significant associations with p-values<0.05 (red square). (B) Heatmap representing the correlations among PC2 and selected molecular features related to telomere length canonical roles. LTL = leukocyte telomere length; PRS = polygenic risk score; PC = principal component; TMB = tumour total mutation burden; HRD = homologous recombination deficiency, SBS (single base substitution DNA mutational signatures). SBS1 and SBS5 are DNA mutational signatures associated with age-related processes, and SBS4 is associated with tobacco smoking exposure. X-shaped marker to cross correlations with p-value>0.05.
Figure 4—figure supplement 1
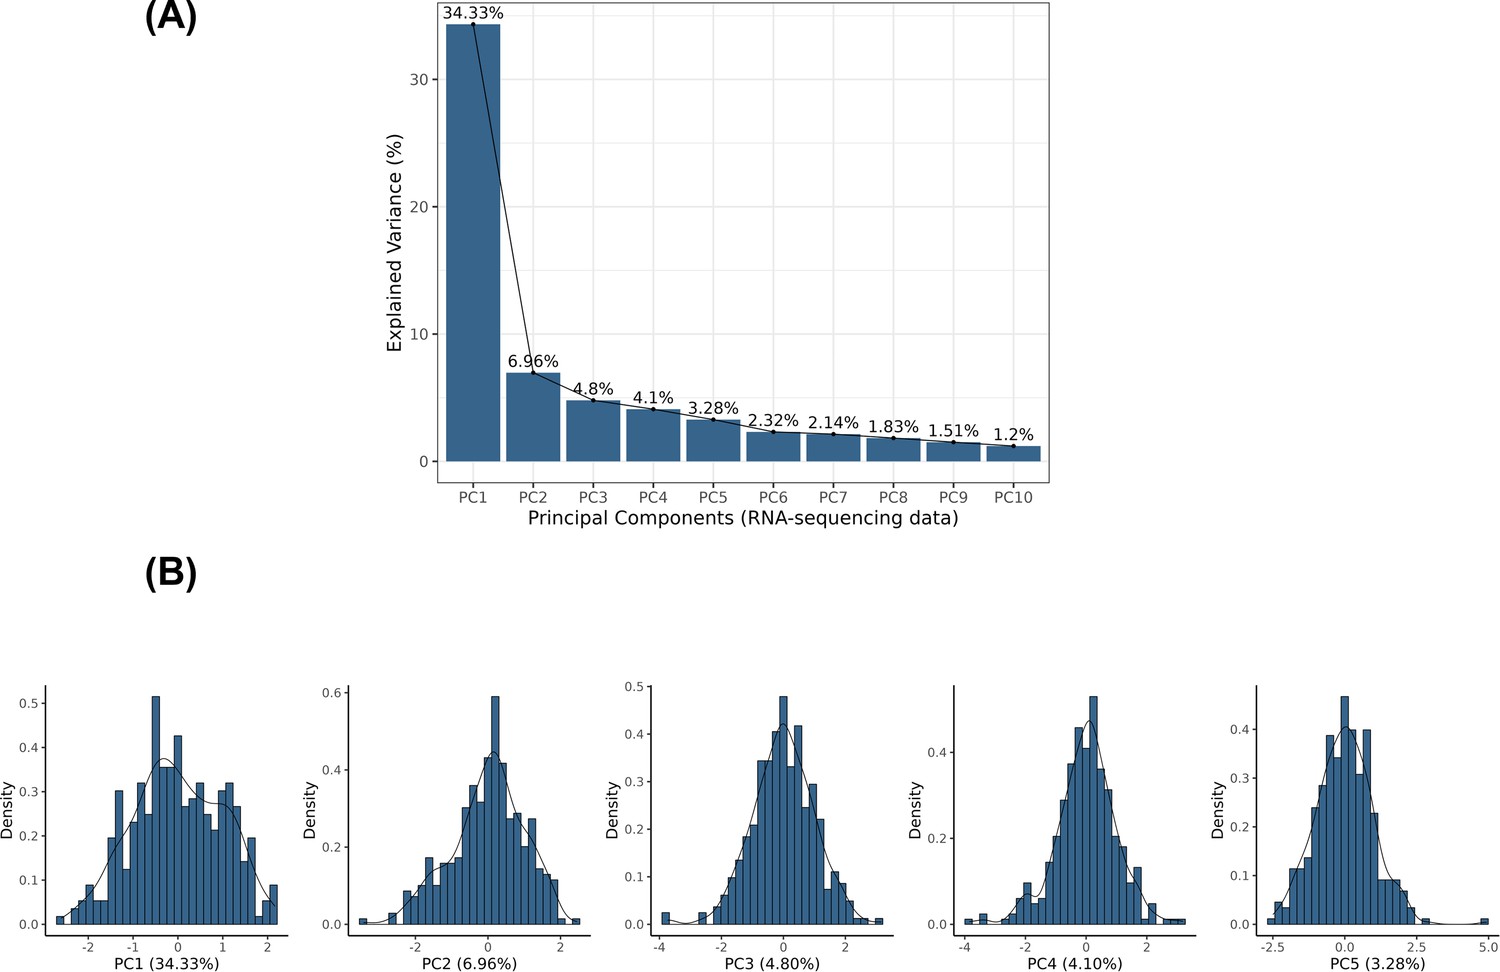
Principal component analysis (PCA) based on RNA-sequencing data.
The RNA sequencing data from 343 primary lung adenocarcinoma tumour samples were retrieved. (A) Principal components analysis was applied to the centred log-transformed gene read counts, and the first five principal components were represented, which explained 53.5% of the variance in the gene expression for those samples. (B) The distributions of the first five principal components are represented in the density plots.
Figure 5 with 1 supplement
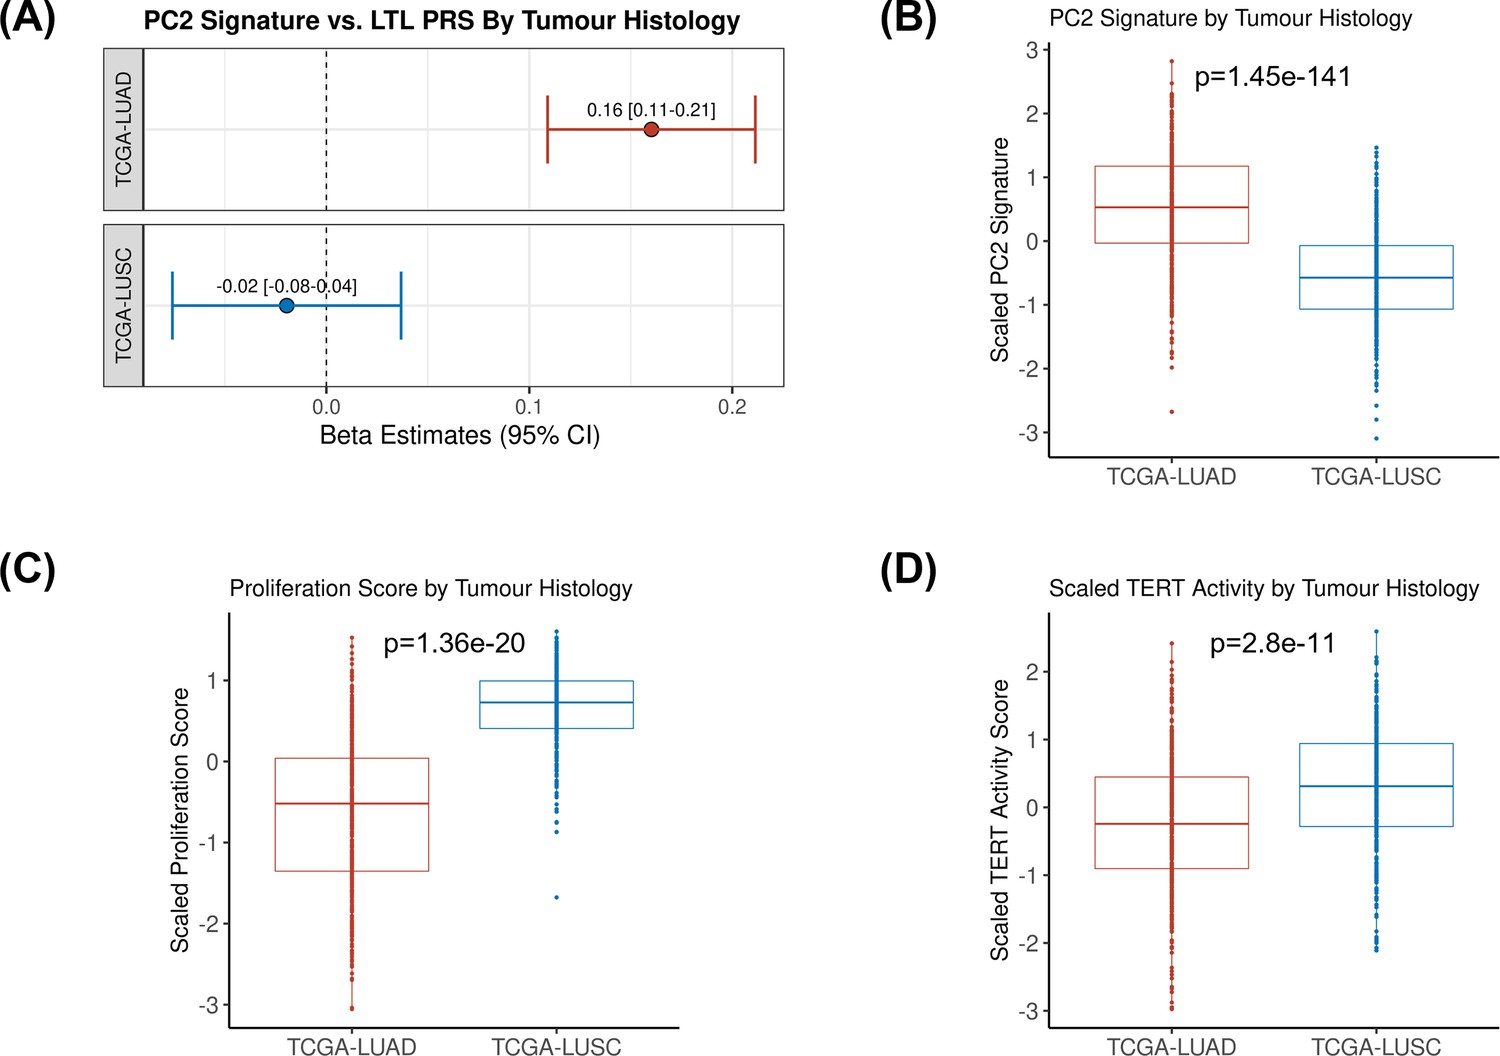
Comparing inferred PC2 gene expression signature by lung cancer histological subtypes.
(A) Leukocyte telomere length (LTL) polygenic risk score (PRS) association with the 10-gene expression signature of PC2 in lung adenocarcinoma (The Cancer Genome Atlas [TCGA]-LUAD, N=343) and squamous cell carcinoma (TCGA-LUSC, N=338) cases from TCGA dataset. Results are expressed as beta estimate per SD increase in genetically predicted LTL. Linear regression model adjusted by sex, age, and PC1-5 (genetic ancestry) covariates, PC2 signature as outcome. Statistically significant associations with -values<0.05. Values per SD of (B) PC2, (C) proliferation score, and (D) telomerase/TERT activity gene expression signatures by lung cancer histological subtypes (TCGA-LUAD and TCGA-LUSC). p-Values derived from Student’s t-tests.
Figure 5—figure supplement 1
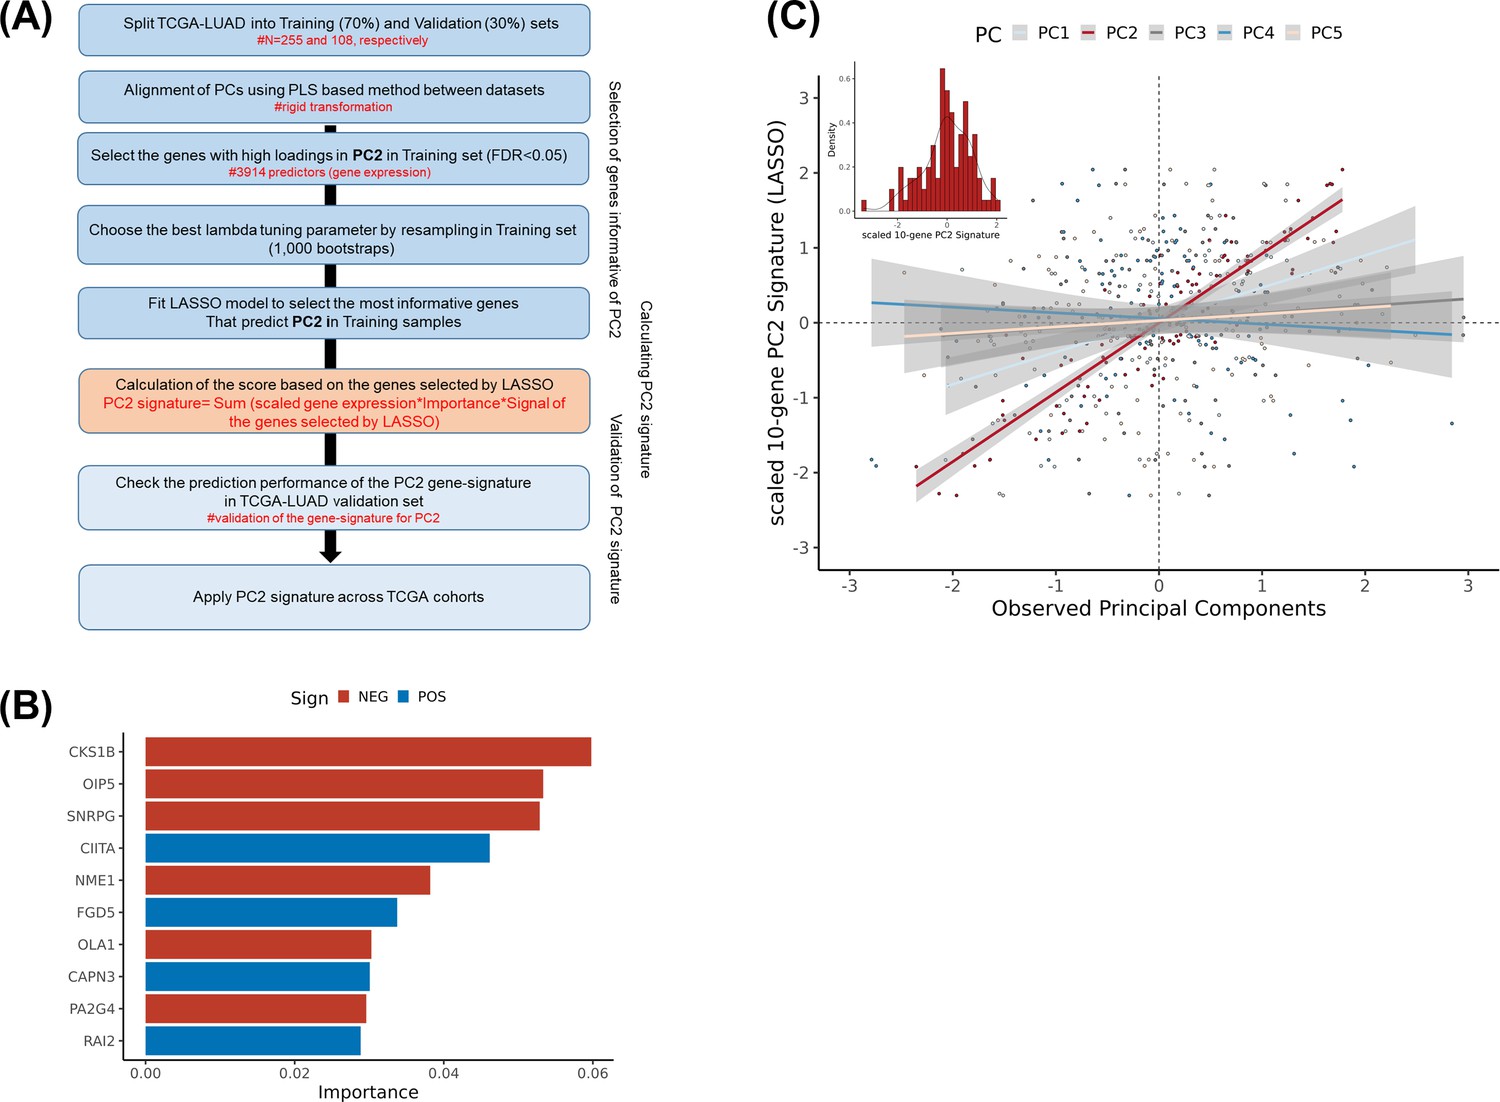
Generating inferred PC2 signature based on RNA-sequencing data.
(A) Workflow for the generation of the PC2 signature. Calculate principal components based on RNA-sequencing data in both The Cancer Genome Atlas (TCGA)-lung adenocarcinoma (LUAD) training (N=255, 70%) and validation (N=108, 30%) datasets and use partial least square (PLS)-based method to align principal components (upper). Select the most informative genes correlated with the observed PC2 in the training dataset using least absolute shrinkage and selection operator (LASSO) regression model and validate it in the validation set (middle). Apply the PC2 signature to the TCGA-LUSC (lung squamous cell carcinoma) and TCGA-LUAD cohorts. (B) The ranked absolute coefficients/importance of the 10 genes selected by the LASSO models. Negative coefficients in red and positive ones in blue. (C) Scatter plot for the correlations between PC2 gene expression signature and observed principal components (PC1-5) based on RNA-sequencing data in the validation set. PC1 in light blue, PC2 in red, PC3 in grey, PC4 in blue, and PC5 in salmon colours.
Tables
Table 1
Association between PC2 (outcome) and lung adenocarcinoma tumour features in univariate and multivariate models (n=343).
| Non-molecular features | ||||||
|---|---|---|---|---|---|---|
| Predictors | Univariate model | Multivariate model | ||||
| OR/Beta (SE) | p-value | OR/Beta (SE) | p-value | |||
| Age at diagnosis* | 0.17±0.05 | 0.001 | 0.17±0.05 | 0.001 | ||
| Gender (male)† | 0.73±0.11 | 0.005 | 0.74±0.11 | 0.005 | ||
| Smoking status (ever)† | 0.67±0.16 | 0.013 | 0.72±0.15 | 0.035 | ||
| Tumour stage (late)† | 0.67±0.13 | 0.002 | 0.67±0.13 | 0.002 | ||
| Molecular features | ||||||
| Predictors | Univariate model | Multivariate model | ||||
| Beta (SE) | p-value | Beta (SE) | p-value | |||
| LTL PRS ‡ | 0.17±0.05 | 0.001 | 0.10±0.04 | 0.009 | ||
| Telomerase activity | –0.37±0.05 | 9.34E-13 | 0.25±0.06 | 1.32E-05 | ||
| Proliferation | –0.69±0.04 | 3.30E-46 | –0.80±0.06 | 3.66E-30 | ||
| Copy number alteration | –0.41±0.05 | 6.36E-16 | –0.23±0.05 | 1.62E-05 | ||
| Homologous recombination deficiency | –0.4±0.05 | 8.32E-15 | 0.12±0.06 | 0.048 | ||
| Tumour total mutation burden | –0.28±0.05 | 1.37E-07 | –0.09±0.24 | 0.695 | ||
| SBS1 | –0.18±0.05 | 0.001 | 0.01±0.05 | 0.827 | ||
| SBS4 | –0.24±0.05 | 6.36E-06 | 0.04±0.18 | 0.814 | ||
| SBS5 | –0.27±0.05 | 4.84E-07 | 0.03±0.09 | 0.770 | ||
-
SBS (single base substitution DNA mutational signatures); LTL = leukocyte telomere length; PC = principal component; PRS = polygenic risk score.
-
*
age of diagnosis represented as beta estimate per 1 unit of SD.
-
†
OR per 1 unit of SD.
-
‡
LTL PRS is adjusted by first five PC of genetic ancestry in the univariate model.
Author response table 1
| Exposure | Outcome | Method | P | OR | LCI | UCI |
|---|---|---|---|---|---|---|
| Telemore Length (Colocalised SNPs) | Lung Cancer | Inverse variance weighted | 3.93E-06 | 2.21 | 1.58 | 3.10 |
| Telemore Length (Colocalised SNPs) | Lung Adenocarcinoma | Inverse variance weighted | 2.91E-07 | 3.48 | 2.16 | 5.60 |
| Telemore Length (Colocalised SNPs) | Lung Squamous Cell Carcinoma | Inverse variance weighted | 0.427 | 1.25 | 0.72 | 2.19 |
| Telemore Length (Colocalised SNPs) | Lung Small Cell Carcinoma | Inverse variance weighted | 0.691 | 0.822 | 0.31 | 2.19 |
| Telemore Length (Colocalised SNPs) | Lung Ever Smokers | Inverse variance weighted | 0.008 | 1.79 | 1.16 | 2.74 |
| Telemore Length (Colocalised SNPs) | Lung Never Smokers | Inverse variance weighted | 0.122 | 3.01 | 0.74 | 12.20 |
| Telemore Length (Non-Colocalised SNPs) | Lung Cancer | Inverse variance weighted | 2.36E-08 | 1.51 | 1.31 | 1.74 |
| Telemore Length (Non-Colocalised SNPs) | Lung Adenocarcinoma | Inverse variance weighted | 5.85E-15 | 2.38 | 1.91 | 2.96 |
| Telemore Length (Non-Colocalised SNPs) | Lung Squamous Cell Carcinoma | Inverse variance weighted | 0.293 | 0.89 | 0.72 | 1.10 |
| Telemore Length (Non-Colocalised SNPs) | Lung Small Cell Carcinoma | Inverse variance weighted | 0.852 | 1.03 | 0.76 | 1.39 |
| Telemore Length (Non-Colocalised SNPs) | Lung Ever Smokers | Inverse variance weighted | 8.35E-06 | 1.44 | 1.23 | 1.69 |
| Telemore Length (Non-Colocalised SNPs) | Lung Never Smokers | Inverse variance weighted | 1.03E-03 | 1.85 | 1.28 | 2.66 |
Additional files
-
Supplementary file 1
Supplementary tables (a-m).
(a) SNPs selected as leukocyte telomere length (LTL) instrument for the Mendelian randomisation (MR) analyses. (b) MR analyses across methods for the 144 LTL SNPs. (c) Test for directional pleiotropy using MR Egger for the 144 LTL SNPs. (d) Heterogeneity tests for the 144 LTL SNPs. (e) Leave-one out analyses for the 144 LTL SNPs. (f) Multivariable MR analyses. (g) Multivariable MR analyses for LTL and lung cancer adjusting for obesity- and alcohol-related traits. (h) Summary of the colocalisation results for the LTL instrument based on 144 variants. (i) Summary of the multi-trait colocalisation results for the 12 colocalised genetic loci. (j) Top 500 genes positively correlated with the first five principal components. (k) Top 500 genes negatively correlated with the first five principal components. (l) Pathway analysis on the top 500 genes positively and negatively correlated with the first five principal components based on RNA-seq data of 343 ADE cases from The Cancer Genome Atlas (TCGA) dataset using Gene Set Enrichment Analysis (GSEA). (m) Association of LTL polygenic risk score (PRS) with the clinical and molecular features of lung adenocarcinoma tumours.
- https://cdn.elifesciences.org/articles/83118/elife-83118-supp1-v1.xlsx
-
MDAR checklist
- https://cdn.elifesciences.org/articles/83118/elife-83118-mdarchecklist1-v1.pdf
Download links
A two-part list of links to download the article, or parts of the article, in various formats.
Downloads (link to download the article as PDF)
Open citations (links to open the citations from this article in various online reference manager services)
Cite this article (links to download the citations from this article in formats compatible with various reference manager tools)
Common genetic variations in telomere length genes and lung cancer: a Mendelian randomisation study and its novel application in lung tumour transcriptome
eLife 12:e83118.
https://doi.org/10.7554/eLife.83118


