A neuroepithelial wave of BMP signalling drives anteroposterior specification of the tuberal hypothalamus
- School of Biosciences, United Kingdom
- Solomon H. Snyder Department of Neuroscience, Johns Hopkins University School of Medicine, United States
- Department of Psychiatry and Behavioral Science, Johns Hopkins University School of Medicine, United States
- Department of Ophthalmology, Johns Hopkins University School of Medicine, United States
- Department of Neurology, Johns Hopkins University School of Medicine, United States
- Institute for Cell Engineering, Johns Hopkins University School of Medicine, United States
- Kavli Neuroscience Discovery Institute, Johns Hopkins University School of Medicine, United States
- Bateson Centre, University of Sheffield, United Kingdom
- Neuroscience Institute, University of Sheffield, United Kingdom
Figures
Figure 1 with 1 supplement
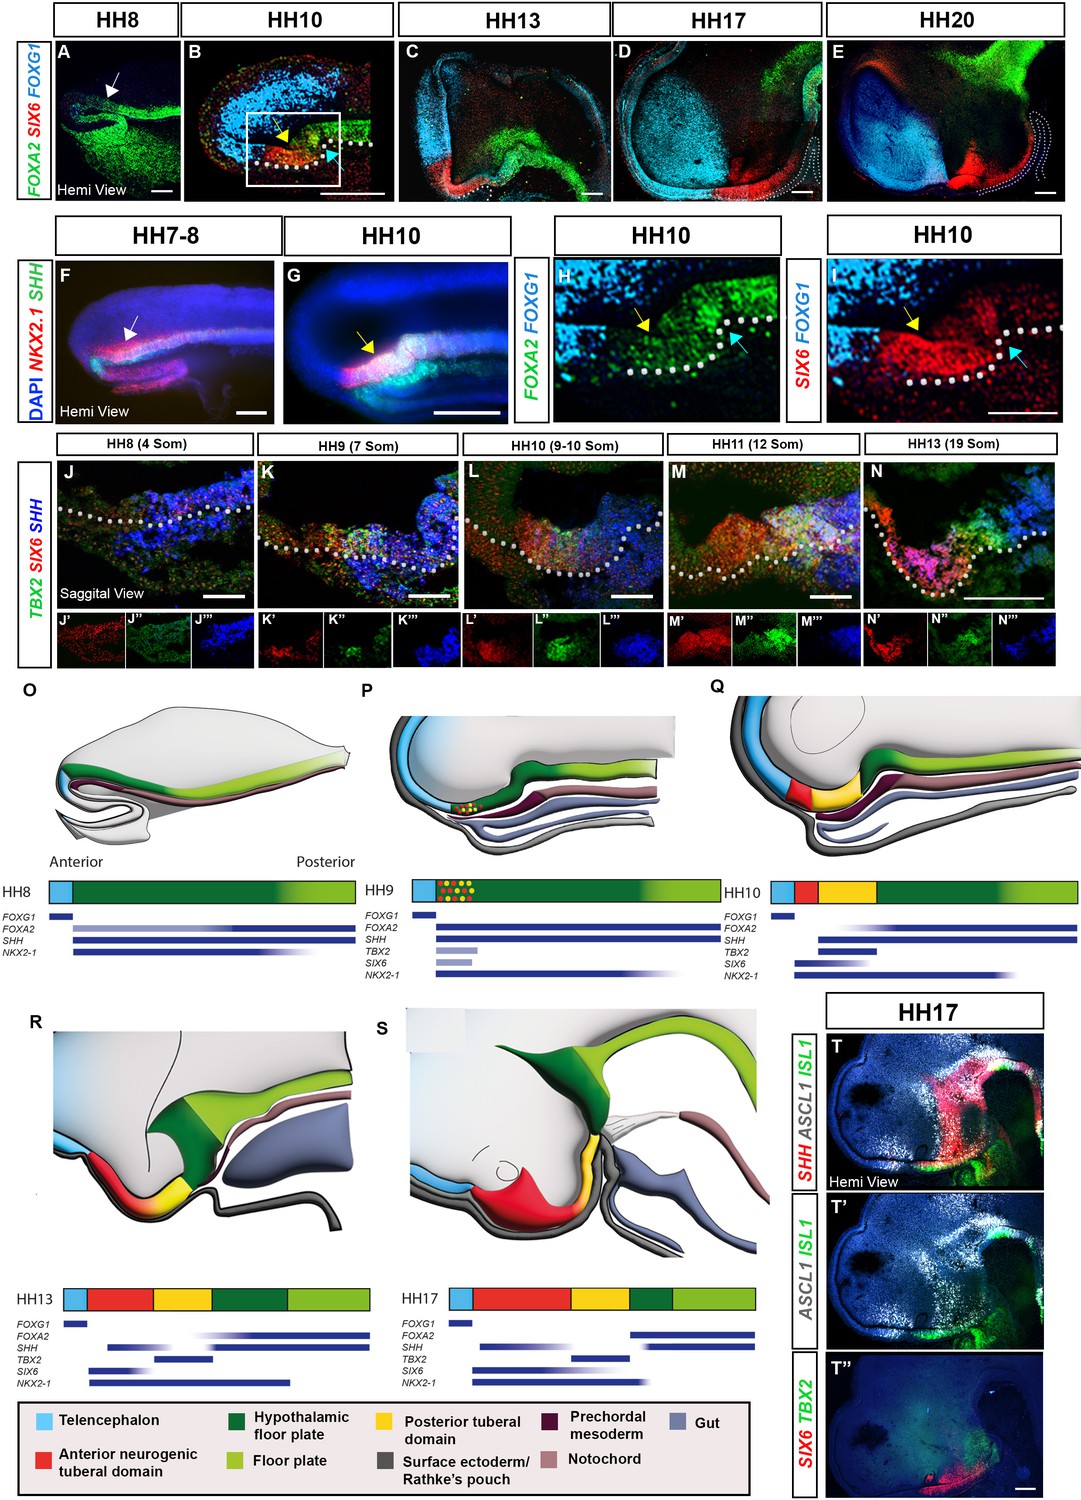
Spatio-temporal development of the tuberal hypothalamus.
(A–I) Maximum intensity projections of hemi-dissected HH8–HH20 heads (hemi-views) after HCR for FOXA2/SIX6/FOXG1 or SHH/NKX2-1 (white arrows: aHypFP cells; yellow arrows: tuberal markers within aHypFP cells; blue arrows: HH10 flexure). (H, I) Double-channel views of boxed region in (B). (J–N) Sagittal sections of HH8–HH13 embryos after HCR for TBX2/SIX6/SHH. Individual channels are shown in (J′–N′″). (O–S) Schematics show hemi-views (top row) or bar representation (second row) of neuroectoderm gene expression domains in HH8–HH17 embryos; colours represent anterior neurogenic (red) and posterior (yellow) tuberal hypothalamic progenitor domains, relative to telencephalon (blue), HypFP (dark green), floor plate (green), oral ectoderm/Rathke’s pouch (dark grey), anterior (gut) endoderm (grey), prechordal mesoderm (dark brown) and notochord (brown). Blue bars beneath schematics show selected gene expression profiles. (T, T″) Hemi-views of HH17 head after HCR for SHH/ASCL1/ISL (T), re-probed in a second round with SIX6/TBX2 (T″). White dots in (C-E) outline Rathke’s pouch, and white dots in (B and I-N) outline basal neural tube. Scale bars: 100 μm. Each panel shows a representative image from n=3–5 embryos. HCR, hybridisation chain reaction.
Figure 1—figure supplement 1
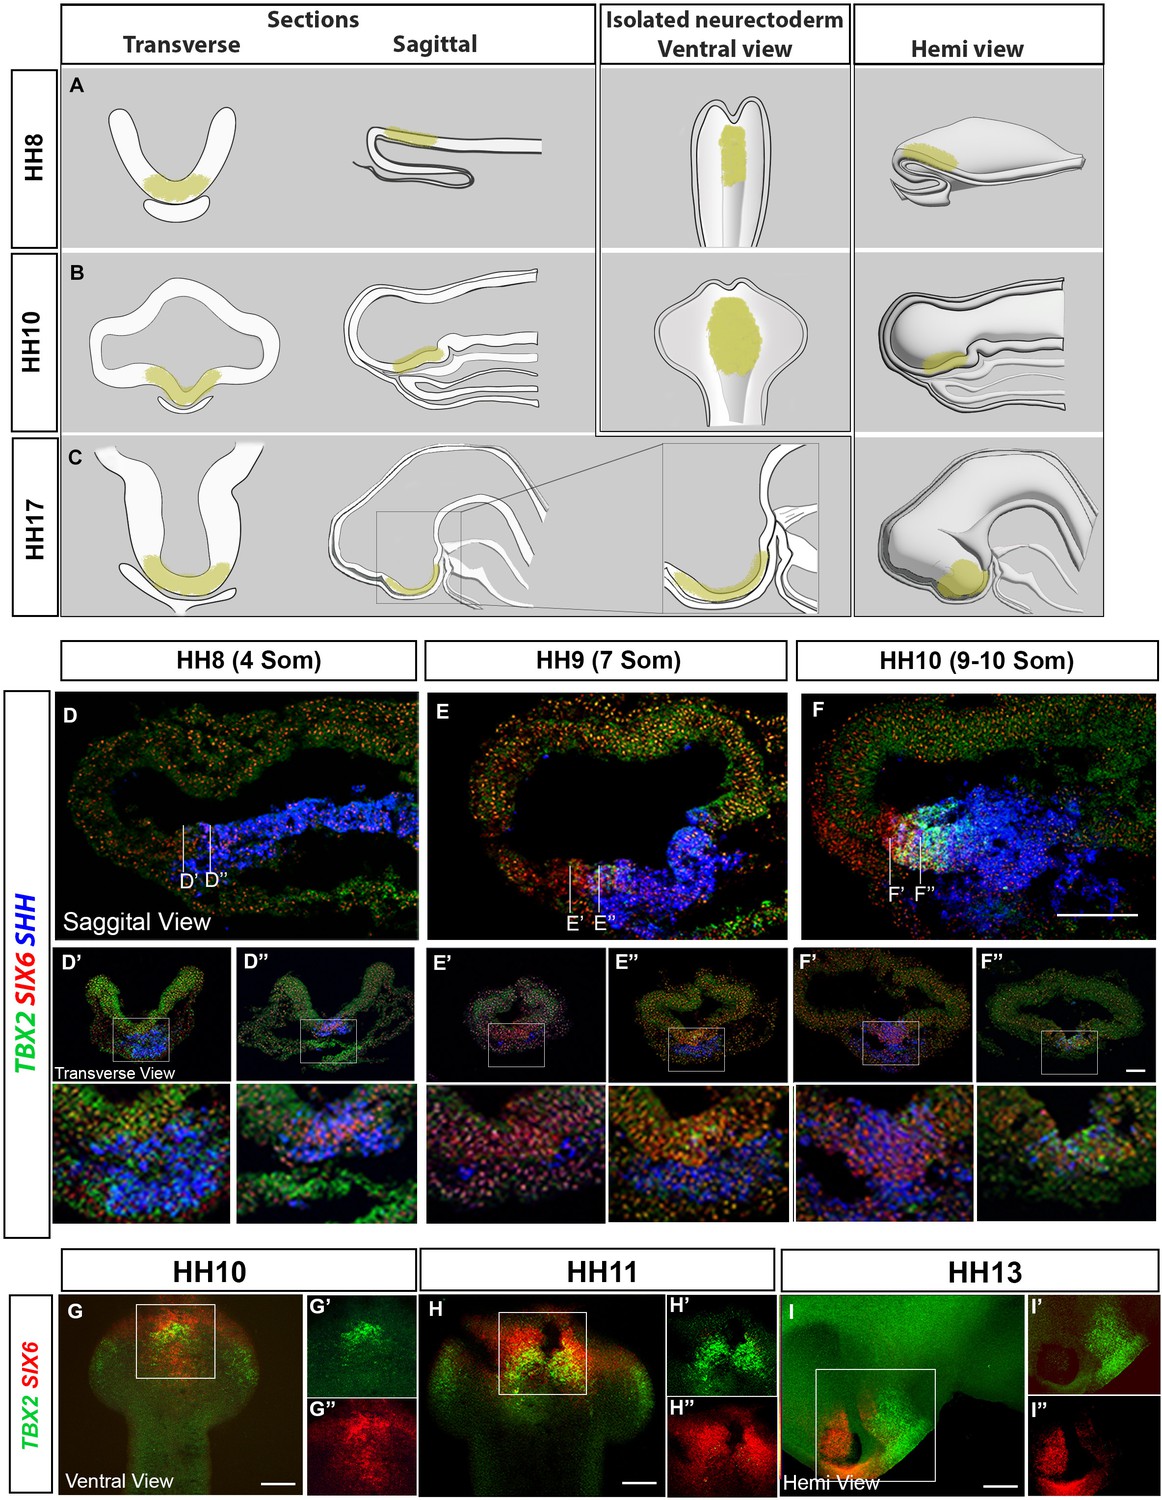
Profiling developing tuberal progenitors.
(A–C) Schematics depict transverse sections, sagittal sections, ventral wholemount and hemi-dissected views of HH8 (A), HH10 (B) and HH17 (C) embryos. Yellow region delineates tuberal hypothalamus. (D–F) MIPs of sagittal sections at HH8–HH10 after HCR for TBX2, SIX6 and SHH. Lines show the position of transverse views shown in (D′-F″). (G–I) Ventral and hemi-views after HCR for TBX2 and SIX6 in HH10–HH13 isolated neural tubes. Scale bars: 100 µm. HCR, hybridisation chain reaction; MIP, maximum intensity projection.
Figure 2 with 2 supplements
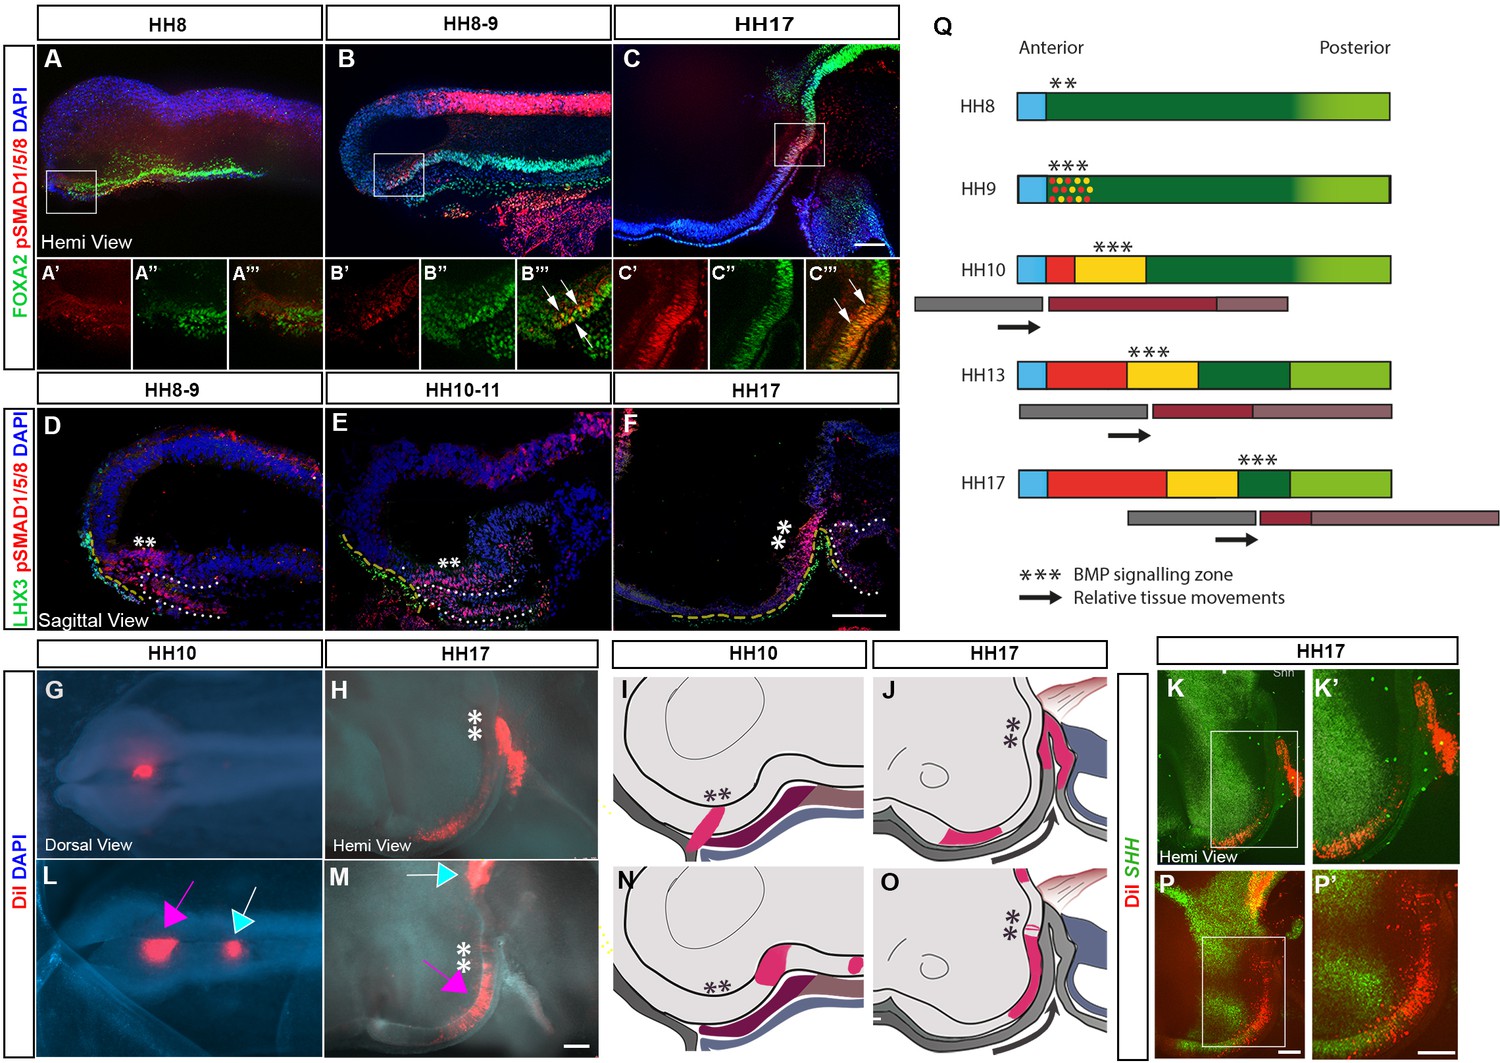
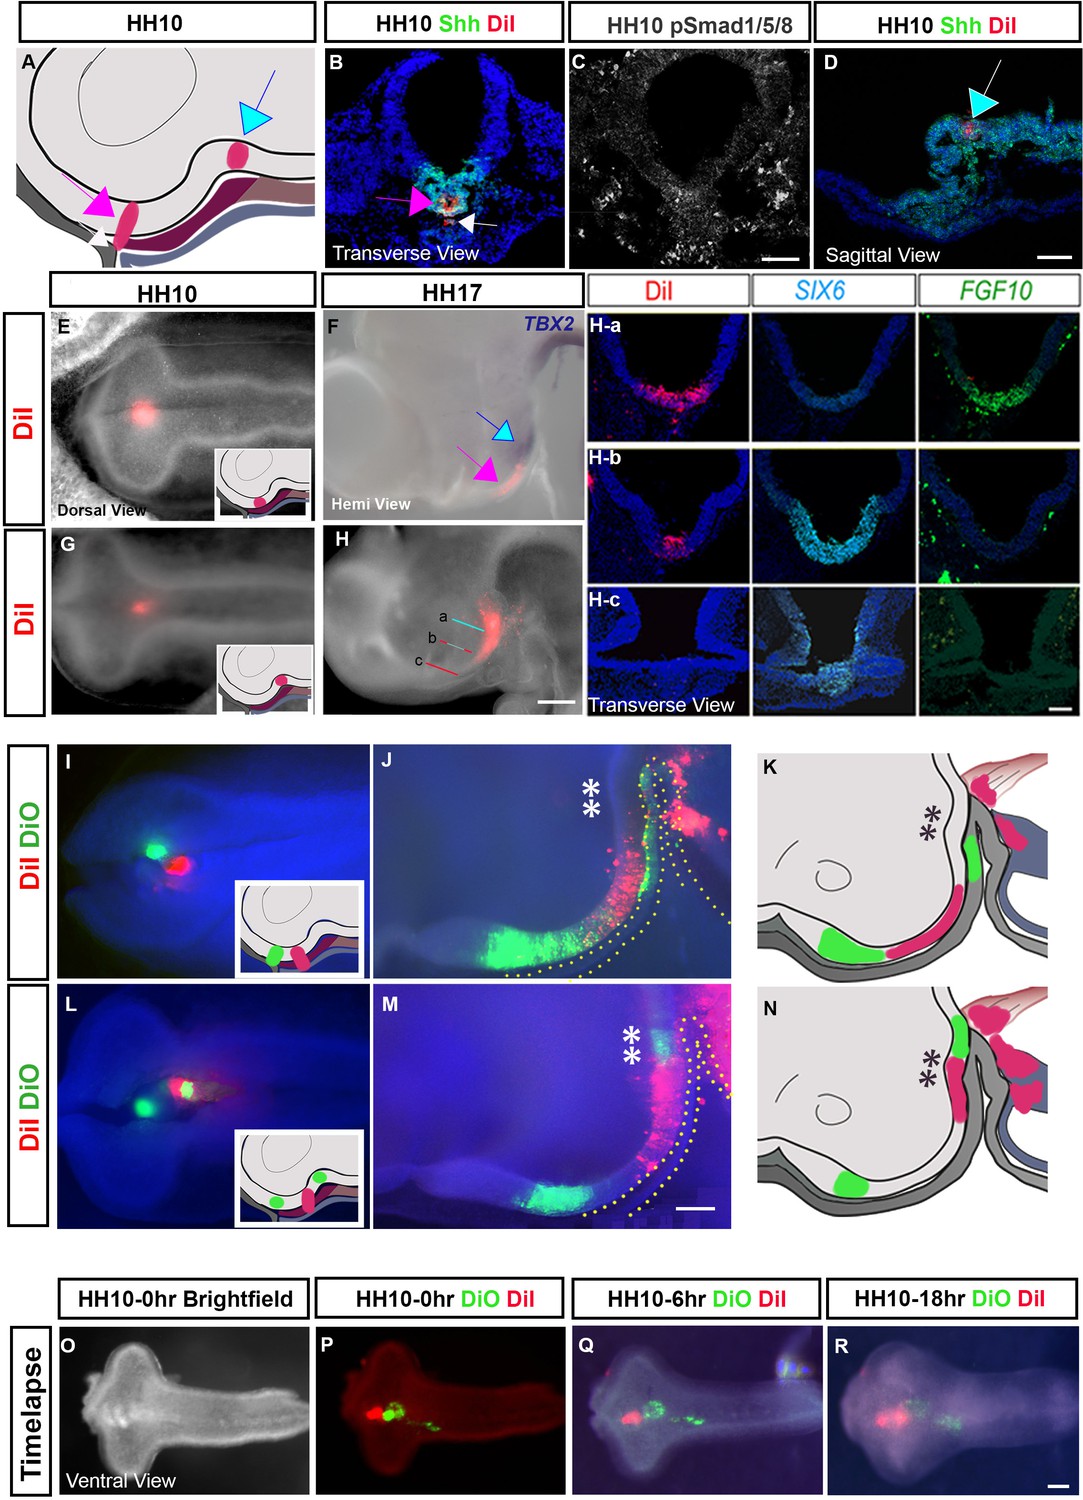
Tuberal progenitors originate from HypFP cells in a conveyor-belt manner.
(A–F) Hemi-views (A–C) and sagittal sections (D–F) from HH8 to HH17 embryos, immunolabelled to detect pSMAD1/5/8 and FOXA2 (A–C): single channel views of boxed regions shown in (A′–C′′′) or pSMAD1/5/8 and LHX3 (D–F). Yellow dashes and white dots outline the surface ectoderm/Rathke’s pouch and anterior gut, respectively. (G, I) Dorsal view (G) of an HH10 embryo after targeting DiI to aHypFP cells and underlying ectoderm (shown schematically in side view in (I)). (H) Hemi-view of the same embryo at HH17, schematised in (J). (K, K′) Hemi-view of the same embryo, after HCR in situ hybridisation. DiI is located in SHH +ve anterior neurogenic cells. (L, N) Dorsal view (L) of an HH10 embryo, after targeting DiI to posterior HypFP cells (pink arrow), and cells at the border of HypFP and floor plate (blue arrow) (shown schematically in side view in (N)). (M–P′) Hemi-views of the same embryo at HH17, visualised for DiI (M), shown schematically in (O) and after HCR in situ hybridisation (P, P′). DiI is located in SHH-ve tuberal cells, petering out in SHH+ve anterior neurogenic cells. Asterisks ** indicate the location of pSMAD1/5/8 cells. Black arrows in (J, O) show relative posterior displacement of pSMAD1/5/8 cells and Rathke’s pouch compared to neuroectoderm. (Q) A model for the generation of tuberal hypothalamus. A wave of BMP signalling (***) tracks posteriorly through HypFP cells, generating tuberal progenitors in its wake. Black arrows show relative posterior movement of underlying tissues Rathke’s pouch (grey bars) in comparison to the neuroectoderm (thicker coloured bars). Colours as in Figure 1O-S. All scale bars = 100 μm. Each panel shows a representative image from n=4 embryos/stage for immunolabelling, and from n > 15 embryos for fate-mapping. HCR, hybridisation chain reaction.
Figure 2—figure supplement 1
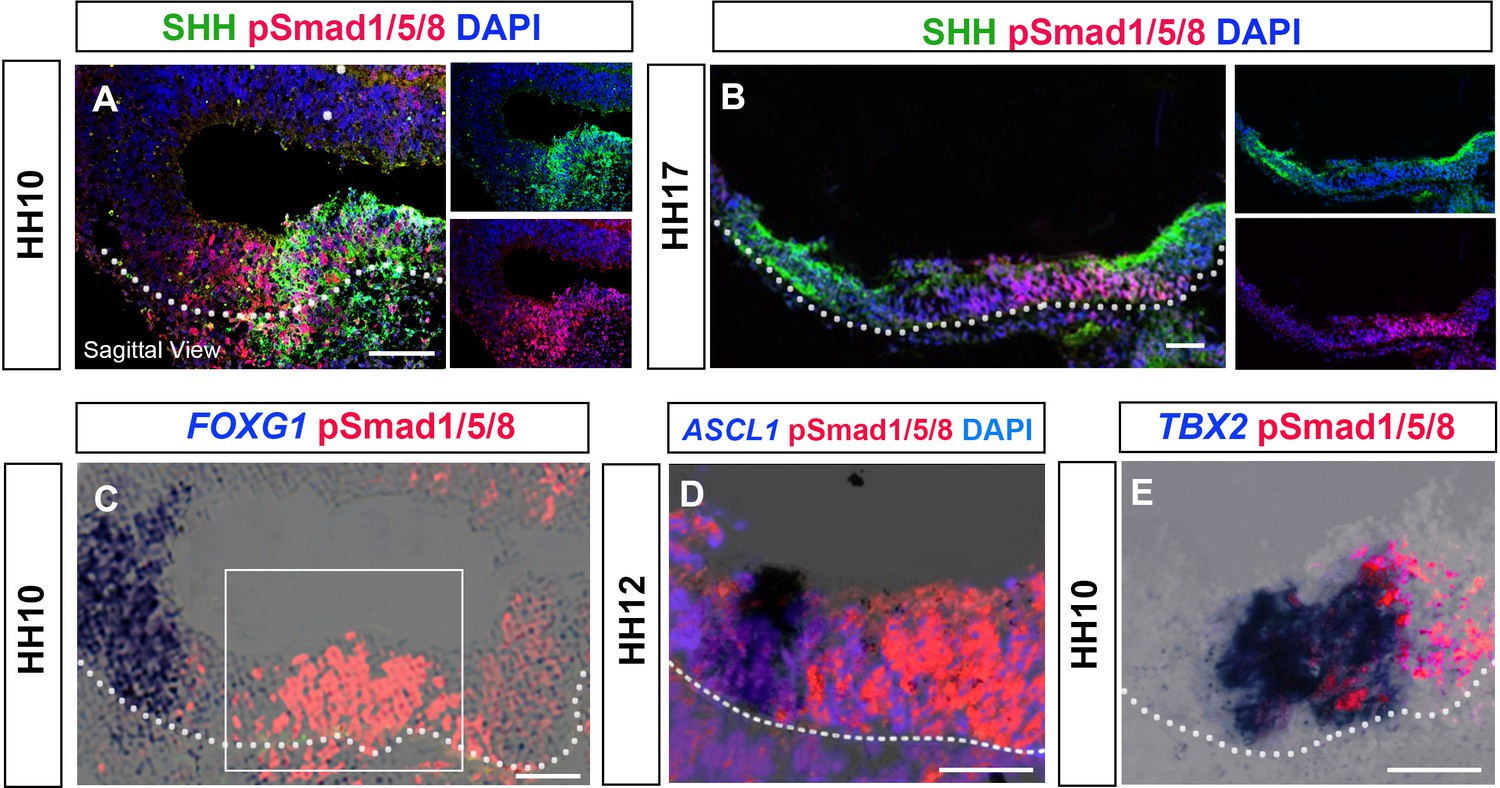
pSMAD1/5/8+ve cells mark the posterior-most tuberal domain.
(A–E) Sagittal sections of embryos over HH10–HH17, analysed by immunolabelling (A, B) or chromogenic in situ hybridisation and immunolabelling (C–E). (A, B) At both HH10 (A), and HH17 (B) pSMAD1/5/8 overlaps with, and extends anterior to SHH +ve aHypFP cells. (C–E) At HH10–HH12, pSMAD1/5/8+ve cells lie some distance from FOXG1+ve telencephalic cells (C), posterior to ASCL1+ve anterior neurogenic tuberal cells (D) and overlap/lie just posterior to TBX2+ve tuberal cells (E). Boxed region in (C) shows regions shown in (D, E). White dots outline basal neural tube. Scale bars: 100 µm. Each panel shows a representative image from a minimum n = 5 embryos/label combination.
Figure 2—figure supplement 2
Fate-mapping identifies the origin of tuberal hypothalamic cells.
(A) Schematic depicting targeting. (B–D) Accuracy of targeting was determined by analysing DiI relative to SHH or pSMAD1/5/8 at time t = 0 in transverse (B, C) or sagittal (D) sections. Coloured arrows match those in (A). (C) Serial adjacent section to that shown in (B). (E, G) Dorsal views of embryos after targeting DiI to aHypFP cells (E) or more posterior HypFP cells (G) at HH10 (schematic insets show regions targeted in side-view). (F) Hemi-view of embryo in (E) after incubation to HH17, and analysed for expression of TBX2. DiI (pink arrow) is located anterior to the TBX2+ve tuberal domain (blue arrow). (H) Hemi-view of embryo in (G) after incubation to HH17. Coloured lines depict levels of transverse sections shown in (Ha–Hc), analysed for SIX6 and FGF10. DiI labelling is within posterior tuberal progenitors FGF10/SIX6(low), petering out in anterior tuberal progenitors (SIX6(high), FGF10-ve). (I, L) Embryos targeted with DiI/DiO (dorsal views; injection sites shown in side-views in schematic insets). (J, K) Embryo shown in (I) developed to HH17 showing non-overlapping regions of DiO-DiI in the anterior tuberal progenitor region (note Rathke’s pouch and developing gut also labelled). (M, N) Embryo shown in (L) developed to HH17 showing non-overlapping regions of DiO-DiI-DiO in the anterior and posterior tuberal hypothalamus (note some gut cells also labelled). Yellow dots in (J, M) outline Rathke’s pouch. (O) Brightfield ventral view of isolated HH10 neural tube. (P–R) Ventral views of same neural tube, targeted with DiI-DiO-DiO, and examined after successive time points in ex vivo culture. Targeted cells maintain their relative positions over time. n > 15 embryos for fate-mapping; n = 5 embryos for ex vivo time-lapse. Scale bars: 100 µm.
Figure 3 with 2 supplements
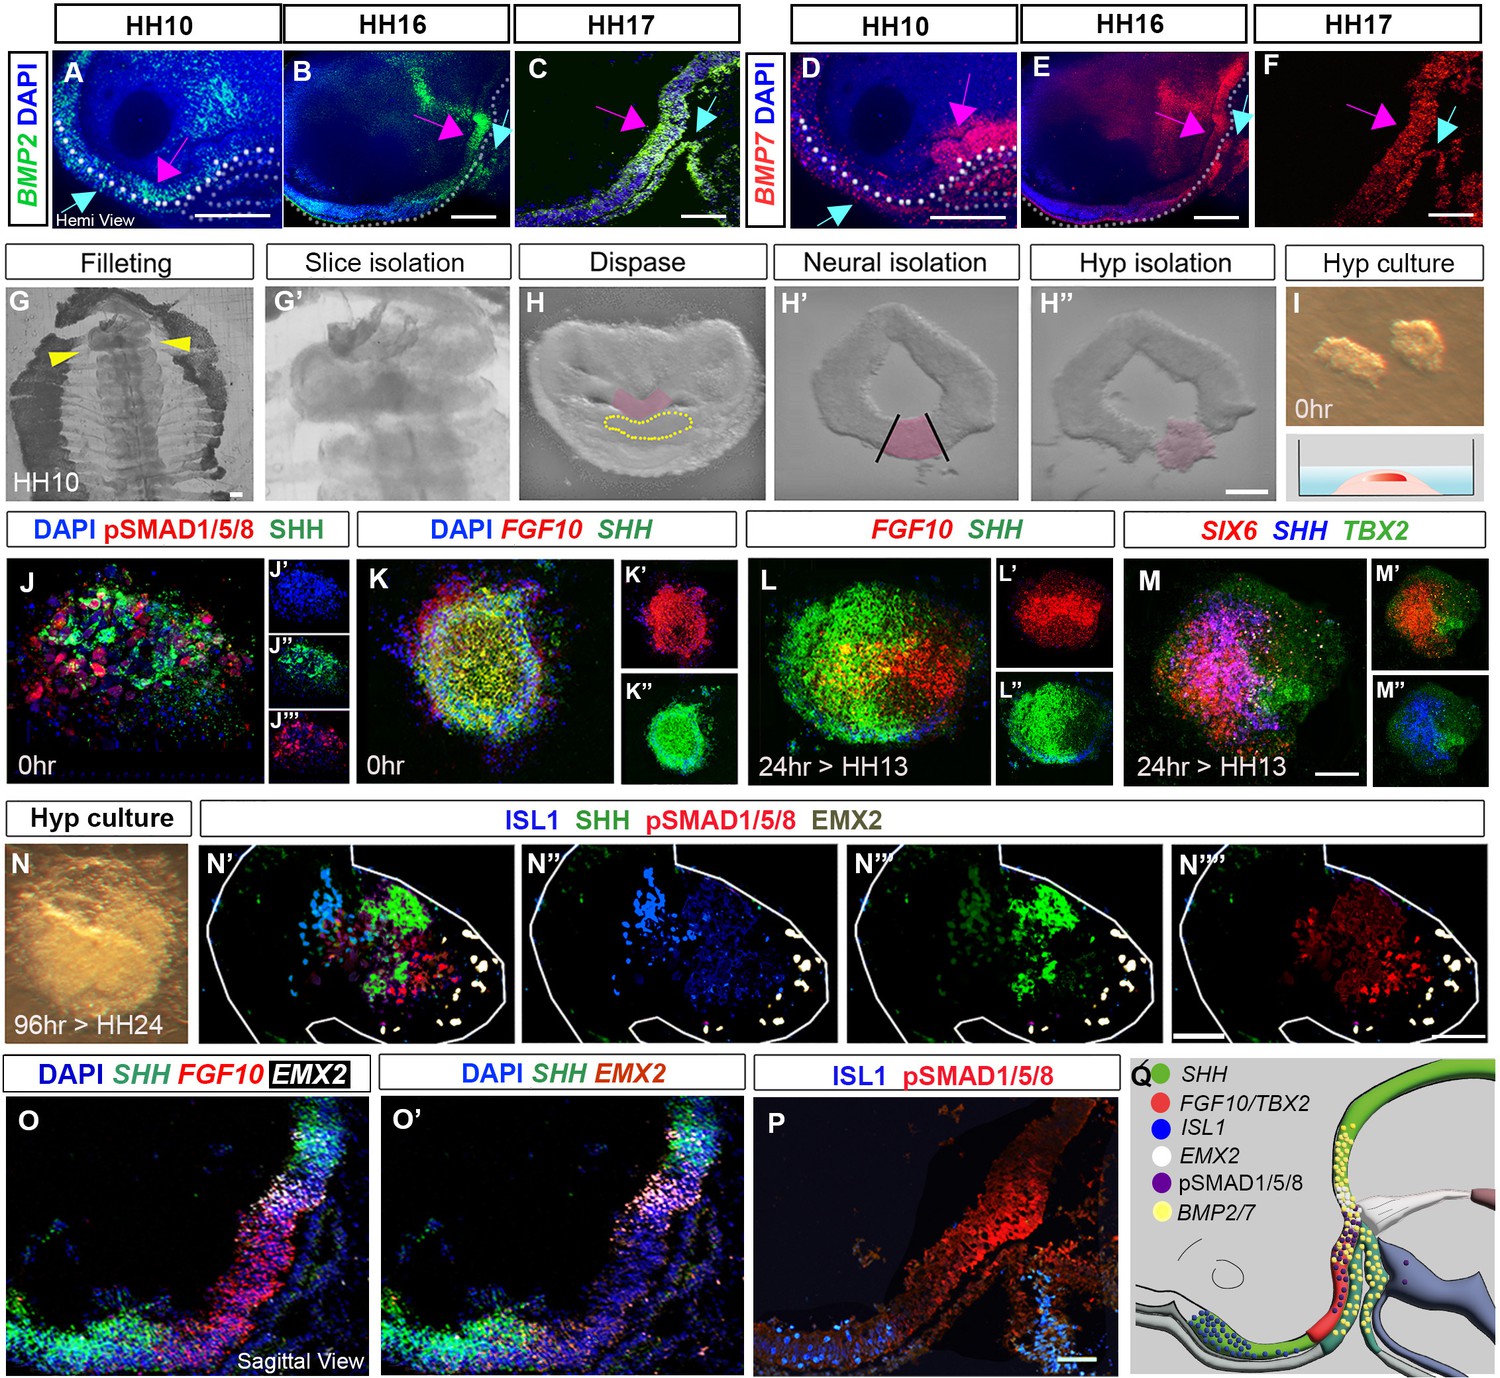
Organisation of tuberal domains through a neuroepithelial-intrinsic mechanism.
(A–F) MIPs of hemi-dissected heads after HCR, showing expression of BMP2 or BMP7 at HH10, HH16 and HH17. Expression is detected in preplacodal ectoderm/Rathke’s pouch (blue arrows) and the neuroectoderm (pink arrows). Dots in (A, B, D and E) outline basal neural tube. (G–I) Steps describing hypothalamic tissue isolation from an HH10 embryo: (G, G′) filleting, yellow arrows in (G) mark the position of the slice containing hypothalamic tissue, shown at higher power in (G′). (H–H″) Isolated slices containing hypothalamic tissue (pink) have a characteristic shape, and the prechordal mesoderm can be identified morphologically (dotted outline in H). After dispase treatment, neural tissue is isolated from surrounding tissues (H′), and hypothalamic tissue is excised (H″). (I) Isolated hypothalamic tissue is embedded in a 3-D collagen matrix. (J–N””) Sections through hypothalamic explants, at 0 hr, or cultured for 24 or 96 hr, analysed by HCR or immunolabelling. (J) At 0 hr, pSMAD1/5/8 and SHH are detected throughout the section (single channel views shown in (J′–J′′′), blue shows DAPI counterstain). (K) At 0 hr, FGF10 and SHH are detected throughout the section single channel views shown in (K′, K″). (L–M) After a 24-hr culture period, to the equivalent of HH13, FGF10 and SHH begin to resolve ((L): single channel views shown in (L′, L′′)), and discrete domains of SIX6, SHH and TBX2 are apparent ((M): double channel views shown in (M′, M″)). (N) Brightfield image of explant cultured for 96 hr to the equivalent of HH24. (N’-N””) Same explant, after immunolabelling, shows organised expression of ISL1, SHH, pSMAD1/5/8 and EMX2 ((N′): double channel views shown in (N″–N″″)). (O–P) Serial adjacent sagittal sections of HH19 embryos, analysed by HCR to show expression of SHH, FGF10 and EMX2 ((O, O′) shows same section without FGF10), or by immunolabelling to detect ISL1 and pSMAD1/5/8 (P). (Q) Schematic summarising the expression of SHH, TBX2, FGF10, ISL1, EMX2, pSMAD1/5/8 and BMP2/7 at HH19. Scale bars: 100 μm. Each panel shows a representative image from a minimum of n=3 embryos or explants. HCR, hybridisation chain reaction; MIP, maximum intensity projection.
Figure 3—figure supplement 1
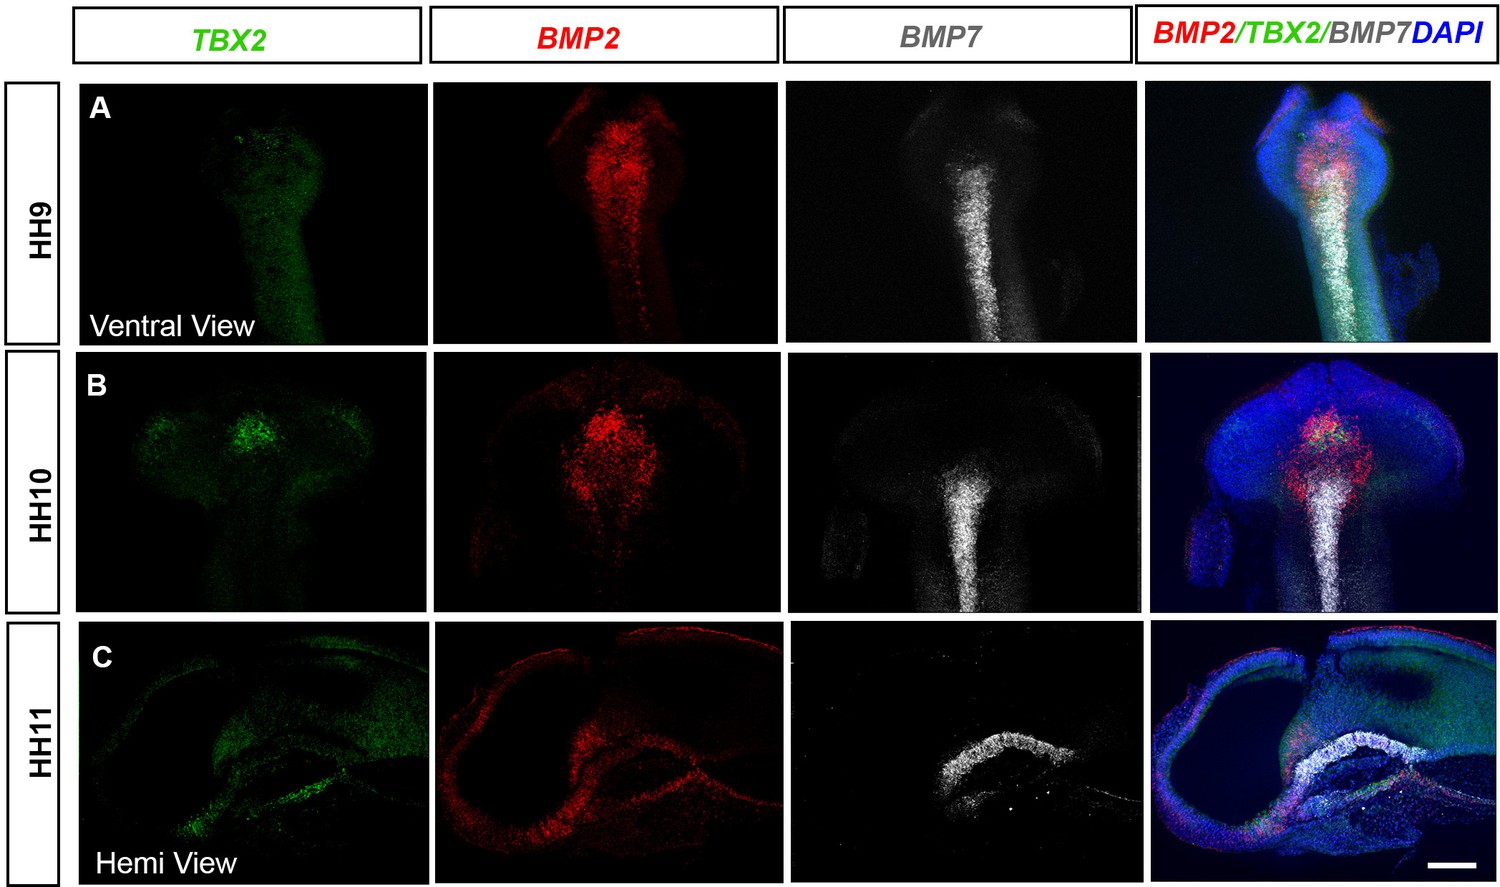
Tuberal progenitors arise in and around BMP-expressing neuroepithelial cells.
(A–C) MIPs of ventral (A, B) and hemi-views (C) of HH9–HH11 embryos, analysed by HCR for TBX2, BMP2 and BMP7. Individual channels are shown in left-hand panels, and combined views in right-hand panels. (A) At HH9, BMP2 is expressed as a cap anterior to/around BMP7+ve cells and TBX2 is detected in small numbers of cells. (B, C) At HH10–HH11, TBX2 is upregulated in neuroectoderm cells that express high levels of BMP2. Scale bars: 100 µm. All panels show representative images from n = 5 embryos. MIP, maximum intensity projection.
Figure 3—figure supplement 2
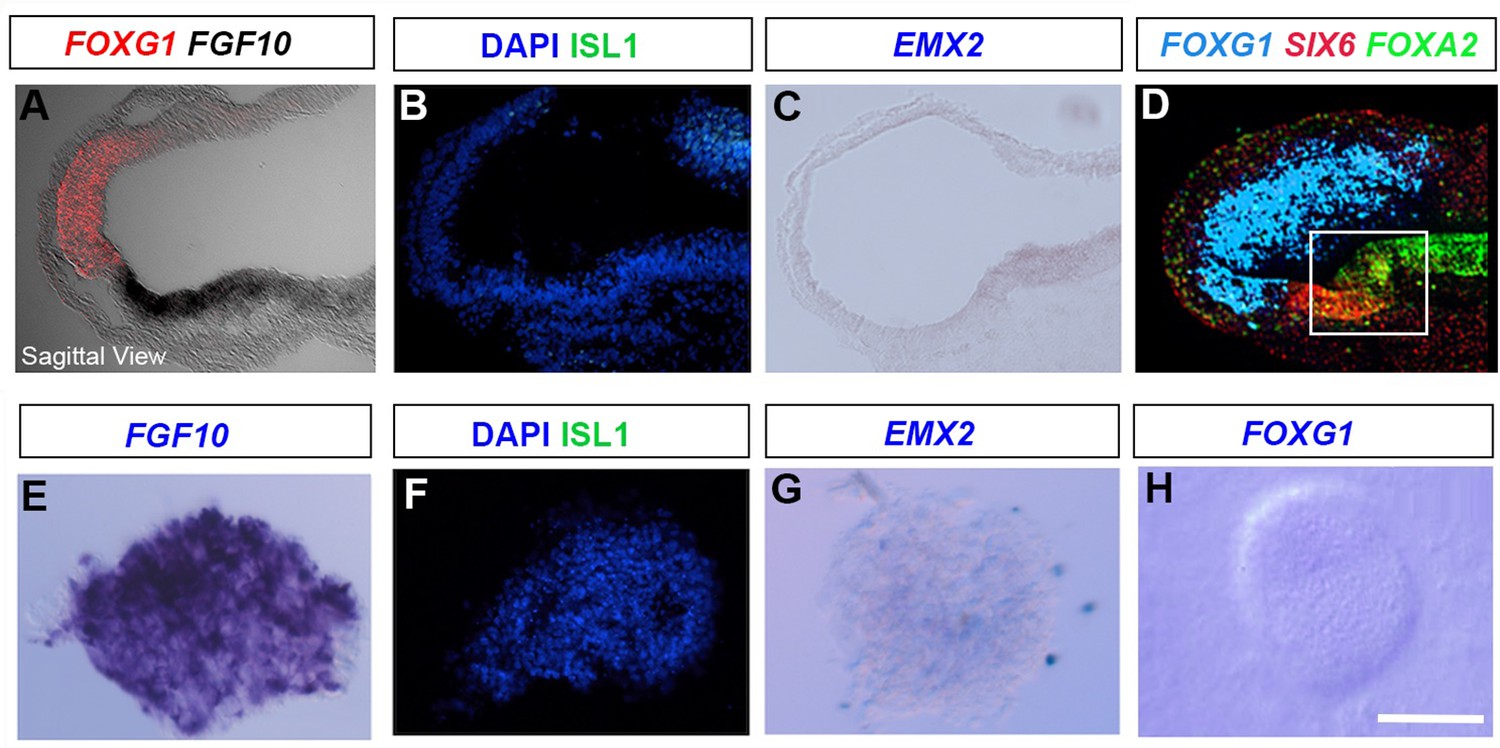
Accurate isolation of hypothalamic tissue.
(A–D) Sagittal sections of HH10 embryos, analysed by chromogenic, HCR in situ hybridisation or immunolabelling to detect FOXG1/FGF10, ISL1, EMX2 or FOXG1/SIX6/FOXA2. Box in (D) shows the region dissected for explant culture. (D) is the same embryo shown in Figure 1B. (E–H) Sections through HH10 hypothalamic explants, isolated as in Figure 3, and examined at t = 0 hr. Explants express FGF10 but not ISL1, EMX2 or FOXG1. Scale bars: 100 µm. All panels show representative images from a minimum of 6 embryos and 4 explants. HCR, hybridisation chain reaction.
Figure 4
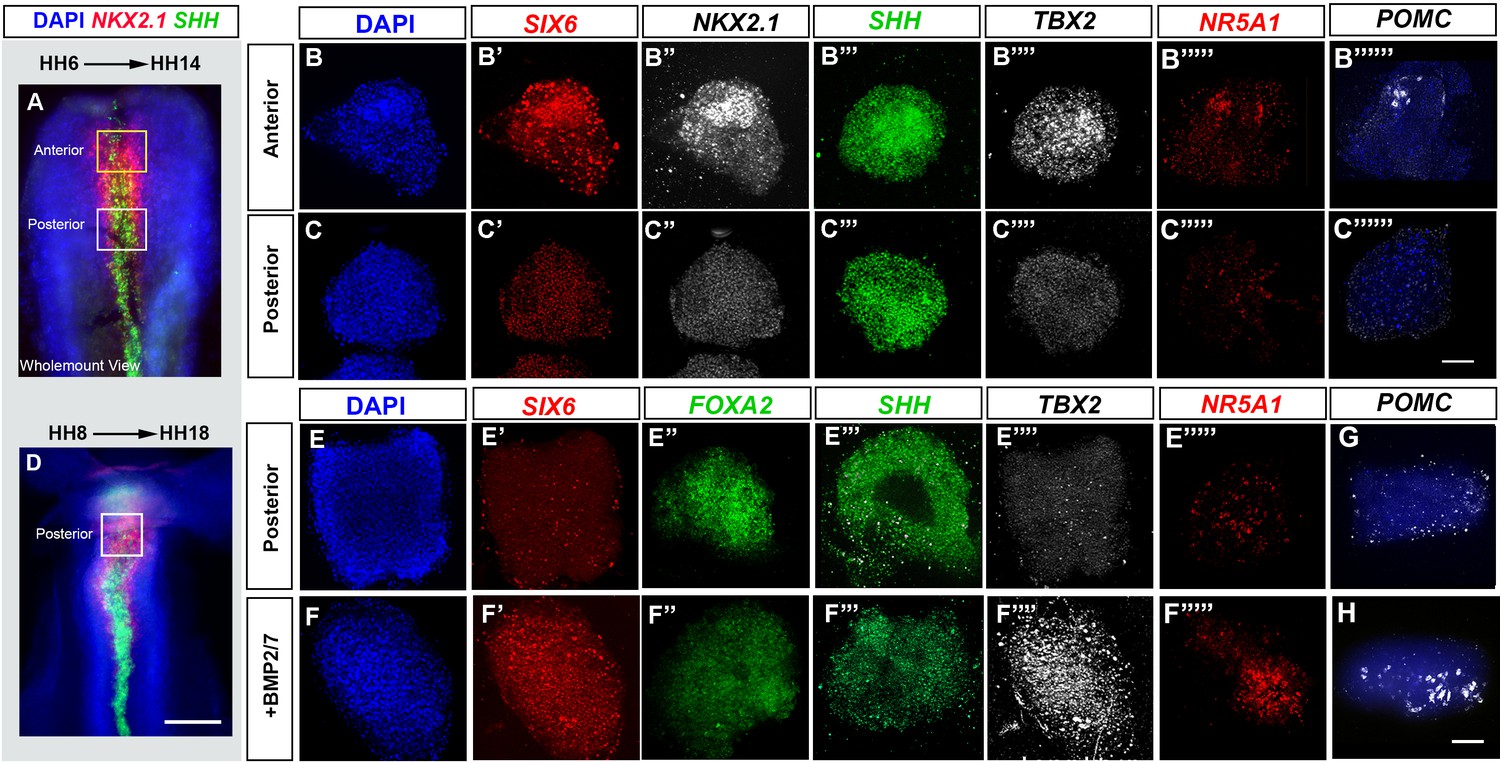
BMP promotes tuberal identity in HypFP cells.
(A, D) HH6 (A) or HH8 (D) isolated neuroepithelia, after HCR to detect NKX2-1 and SHH. Boxes show regions dissected for explant culture. (B–B′′′′′′, C–C′′′′′′′, E–E′′′′′, F–F′′′′′) HH6 anterior or posterior explants cultured to a HH14 equivalent in control media (rows B, C, E) or 32 nM BMP2/7 protein (row F), and then processed through repeated rounds of multiplex HCR for SIX6, SHH, TBX2/NKX2-1/NR5A1/POMC or SIX6/FOXA2/SHH/TBX2/NR5A1. (G–H) HH8 posterior explants cultured to an HH18 equivalent in control media (G) or BMP2/7 (H) and processed by wholemount HCR for POMC. Scale bars: 100 µm. NKX2-1, NR5A1, POMC and FOXA2 were analysed in a minimum of n = 3 explants/condition; SIX6, SHH and TBX2 were analysed in a minimum of n = 11 HH6 explants/condition and n = 7 HH8 explants/condition. HCR, hybridisation chain reaction.
Figure 5 with 1 supplement
BMP signalling patterns anterior and posterior tuberal progenitors over time.
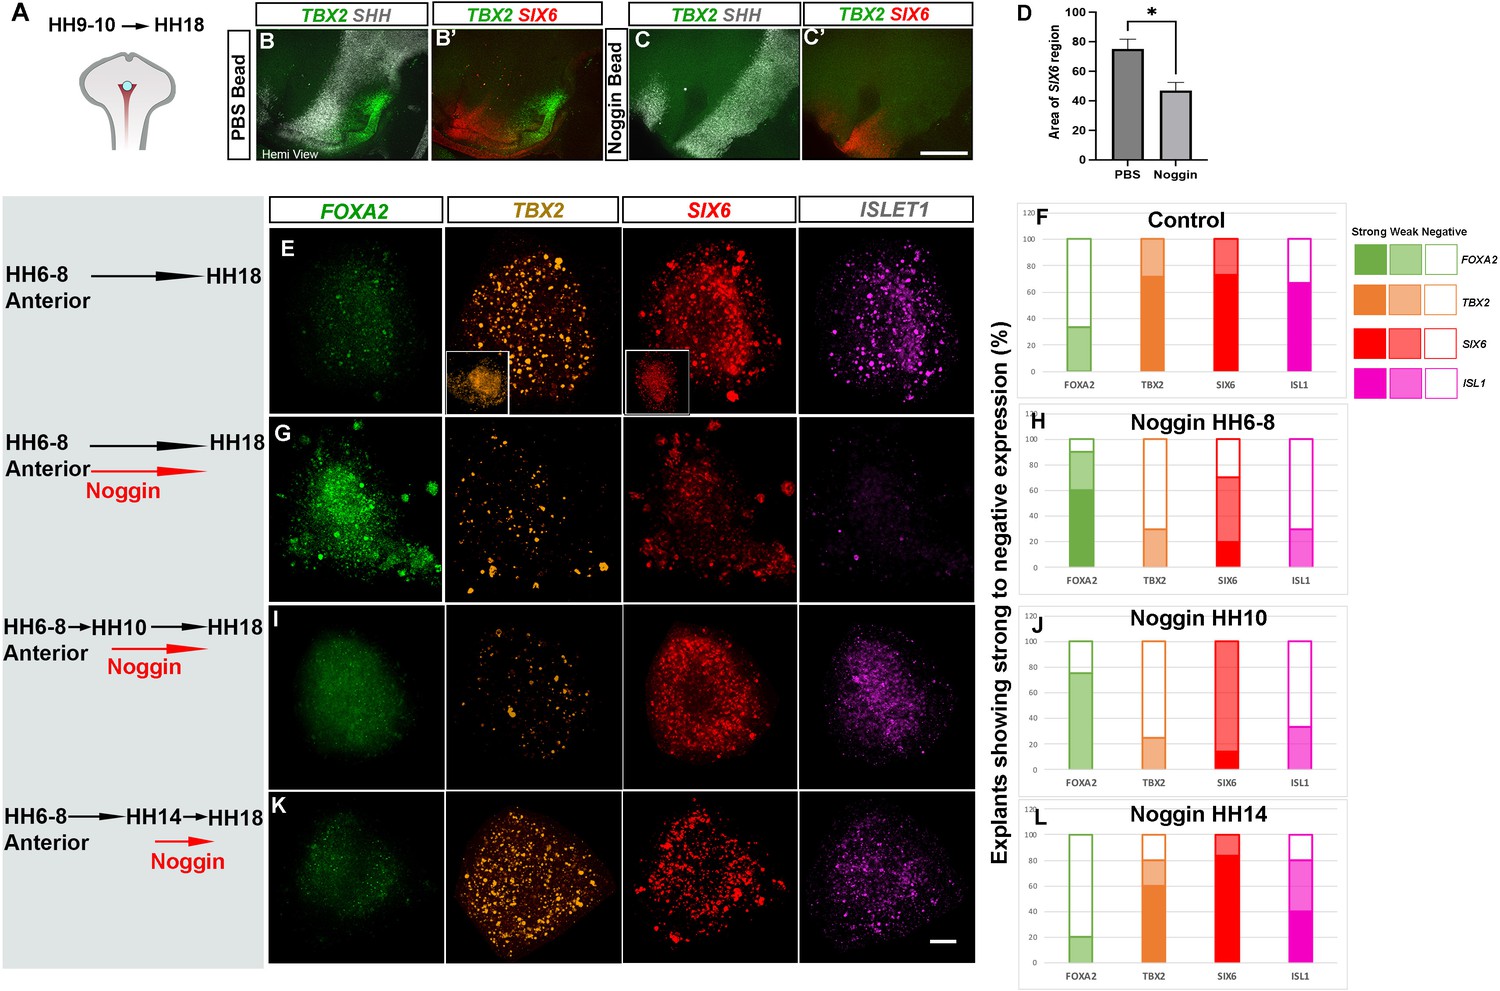
(A) Schematic depicting position of bead implantation. (B–C′) Hemi-views of HH18 heads, analysed by HCR to detect TBX2, SHH and SIX6 after PBS (B, B′) or Noggin (C, C′’) bead implantation. (D) There is a significant decrease in the area of the SIX6+ve domain after exposure to Noggin p < 0.05*, unpaired t test; error bars show SEM ; n = 5 embryos/condition. (E, G, I, K) HH6–HH8 anterior explants, cultured to an HH18 equivalent, in the absence of Noggin (E, F), or after exposure to 300 ng/μl Noggin at the onset of culture (G, H), after culture to an HH10 equivalent (I, J) or after culture to an HH14 equivalent (K, L). Insets in row (E) show explants cultured to an HH10 equivalent. Each row shows a representative single explant, subject to HCR to detect FOXA2/TBX2/SIX6/ISL1. (F, H, J, L) Explants were scored for expression levels (strong expression >50% explant—e.g., TBX2/SIX6/ISL in row (E); weak expression <50% explant—e.g., TBX2/SIX6 in row (G); no expression—e.g., ISL1 in row (G)). n = 14 explants/condition (F, H); n = 4 explants/condition (J, L). Scale bars: 100 µm. HCR, hybridisation chain reaction.
-
Figure 5—source data 1
Raw data for Figure 5D.
- https://cdn.elifesciences.org/articles/83133/elife-83133-fig5-data1-v2.xlsx
-
Figure 5—source data 2
Raw data for Figure 5F, H, J and L.
- https://cdn.elifesciences.org/articles/83133/elife-83133-fig5-data2-v2.xlsx
Figure 5—figure supplement 1
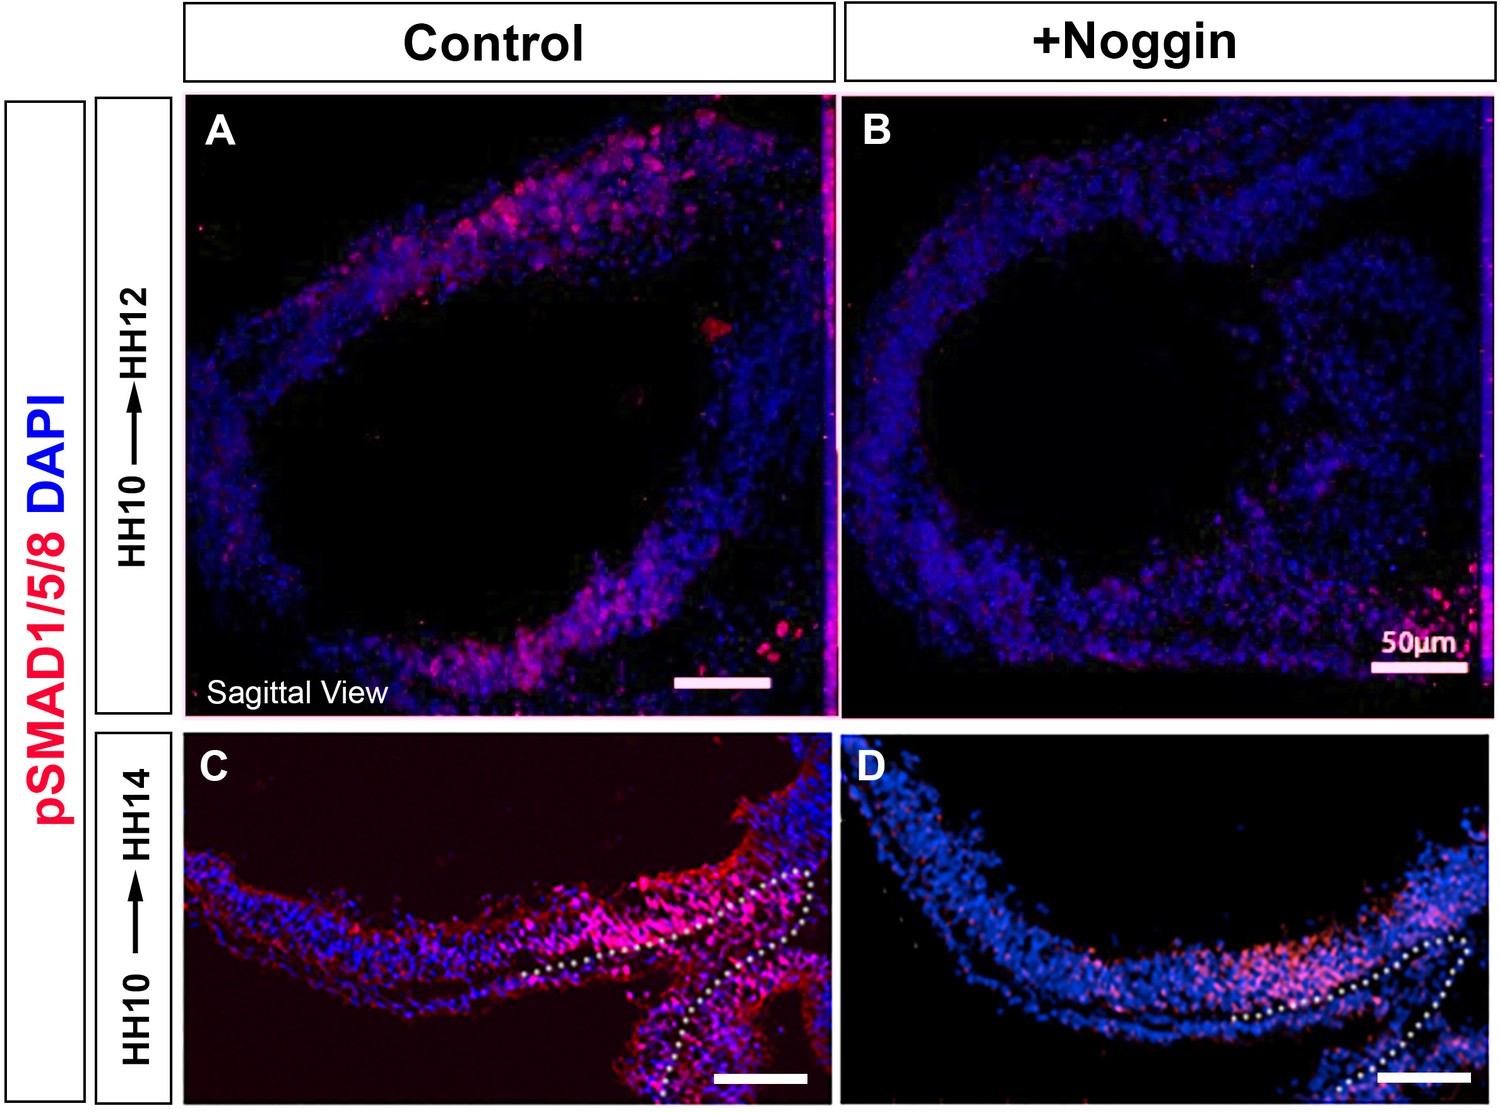
Transient reduction of pSMAD1/5/8 in vivo.
(A–D) Sagittal sections taken through HH12 (A, B) or HH14 (C, D) embryos after implantation of a PBS-soaked control bead (A, C) or a Noggin-soaked bead (B, D) at HH10, analysed by immunolabelling to detect pSMAD1/5/8. Dots outline Rathke’s pouch. . Scale bars: 50 µm. Panels show representative images from n=3 embryos/time point/condition.
Figure 6 with 1 supplement
Ectopic BMP exposure reduces anterior, then posterior tuberal progenitors.
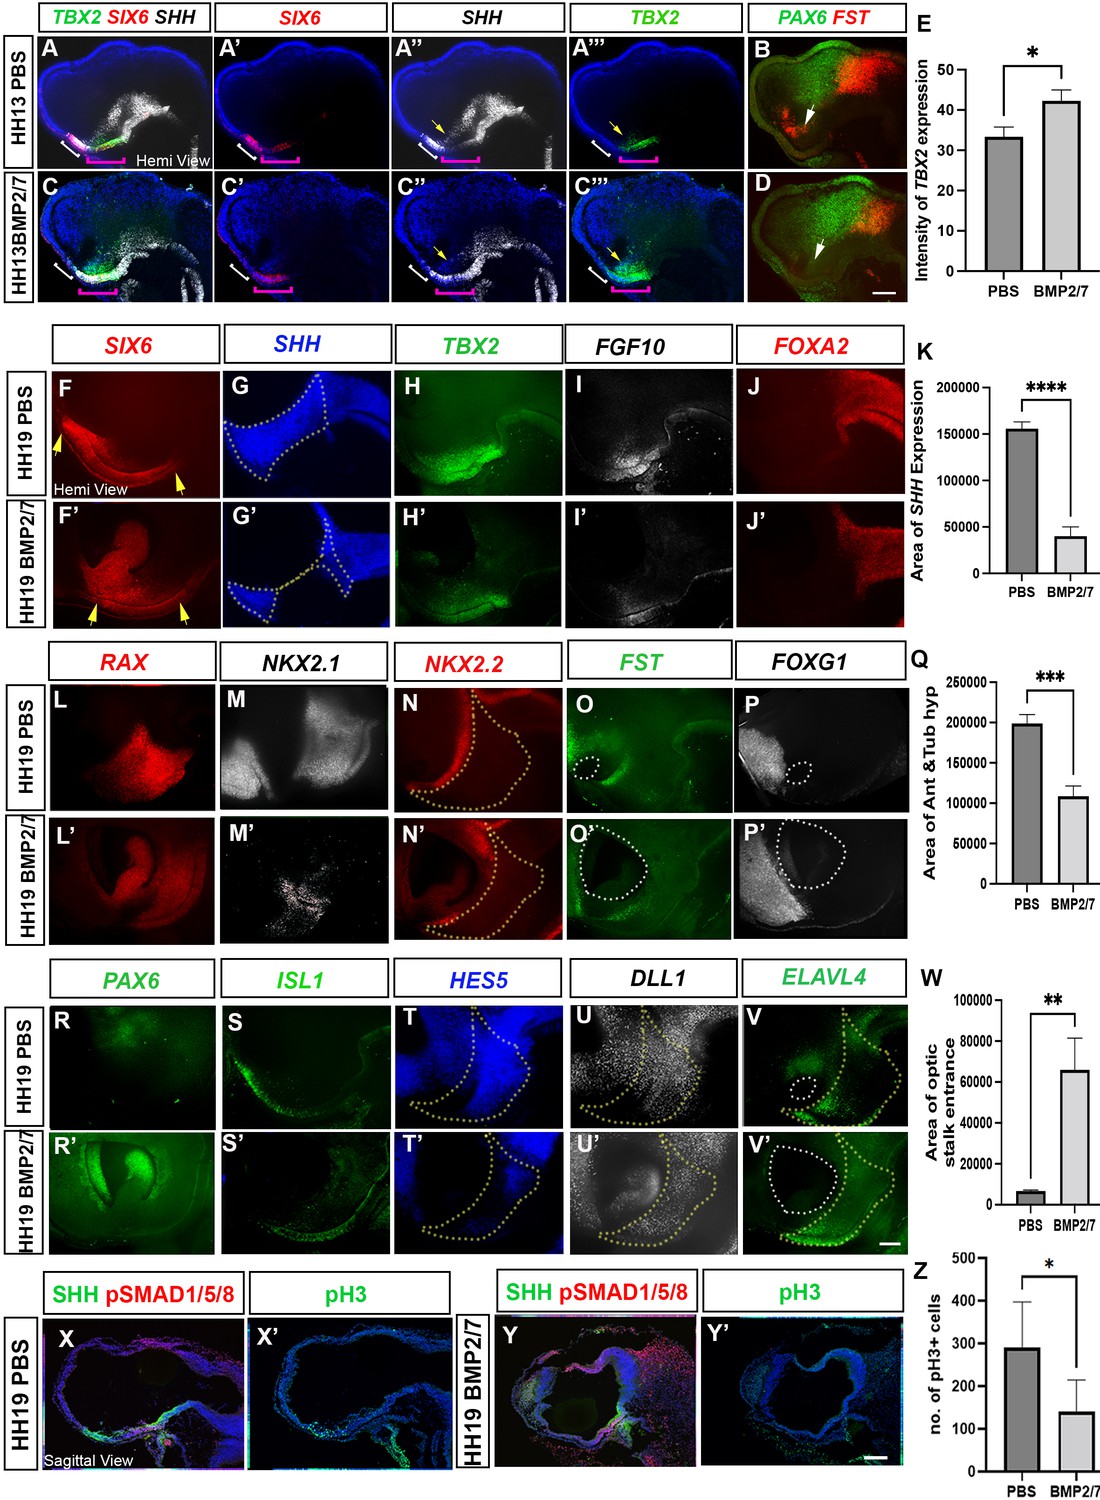
(A–D) MIPs of hemi-dissected head of HH13/14 embryo taken through two rounds of multiplex HCR analysis, after implantation of PBS bead (A) (single channel views in A′–A″′, B) or BMP2/7-soaked bead (C) (single channel views in C′–C″′, D). In (A–C″′), white bracket shows the anterior tuberal domain, absent after BMP2/7 exposure; pink bracket shows the posterior tuberal domain; yellow arrows show anterior ID. In (B, D), white arrows point to FST+ve cells, absent after exposure to BMP2/7. (E) Graph showing a significant increase in intensity of TBX2 following BMP2/7 bead implantation p < 0.05, unpaired t test; error bars show SEM; n = 3 embryos/condition. (F–J′; L–P′; R–V′) Hemi-dissected heads of HH19 embryos after implantation of PBS bead (F–V) or BMP2/7-soaked bead (F′–V′). Each panel shows MIP of single channel views (multiplex views shown in Figure 6—figure supplement 1). In (F, F′), yellow arrows indicate the length of the SIX6+ve domain. Dotted outlines in (G, G′) show area of SHH expression, measured in (K). Yellow dotted outlines in(N, N′, T, T’, U, U’, V, V’) show area of anterior and tuberal hypothalamus, measured in (Q). White dotted outlines in (O, O’ P, P’ and V, V’ ) show area of optic stalk entrance, measured in ( W). (K, Q) There is a significant decrease in the area of SHH expression, p < 0.0001****, unpaired t test and a significant decrease in the area of anterior and posterior tuberal hypothalamus, p < 0.0004***, unpaired t test between PBS and BMP2/7 bead-implanted embryos. n = 6 embryos/condition; error bars show SEM. (W) There is a significant increase in the area of optic stalk entrance, p < 0.001**, unpaired t test. n = 4 embryos/condition; error bars show SEM.. (X–Y′) Serial adjacent sagittal sections of HH17 embryos, immunolabelled to detect expression of SHH, pSMAD1/5/8 or the M-phase marker phosphoH3 (pH3) after implanting PBS bead (X, X′) or BMP2/7-soaked bead (Y, Y′) at HH10. (Z) Graph showing significant decrease in the number of pH3 positive M-phase progenitors (p < 0.05*, unpaired t test; n = 5 embryos/condition; error bars show SD). Scale bars: 100 µm. HCR, hybridisation chain reaction; MIP, maximum intensity projection.
-
Figure 6—source data 1
Raw data for Figure 6E.
- https://cdn.elifesciences.org/articles/83133/elife-83133-fig6-data1-v2.xlsx
-
Figure 6—source data 2
Raw data for Figure 6K, Q and W.
- https://cdn.elifesciences.org/articles/83133/elife-83133-fig6-data2-v2.xlsx
-
Figure 6—source data 3
Raw data for Figure 6Z.
- https://cdn.elifesciences.org/articles/83133/elife-83133-fig6-data3-v2.xlsx
Figure 6—figure supplement 1
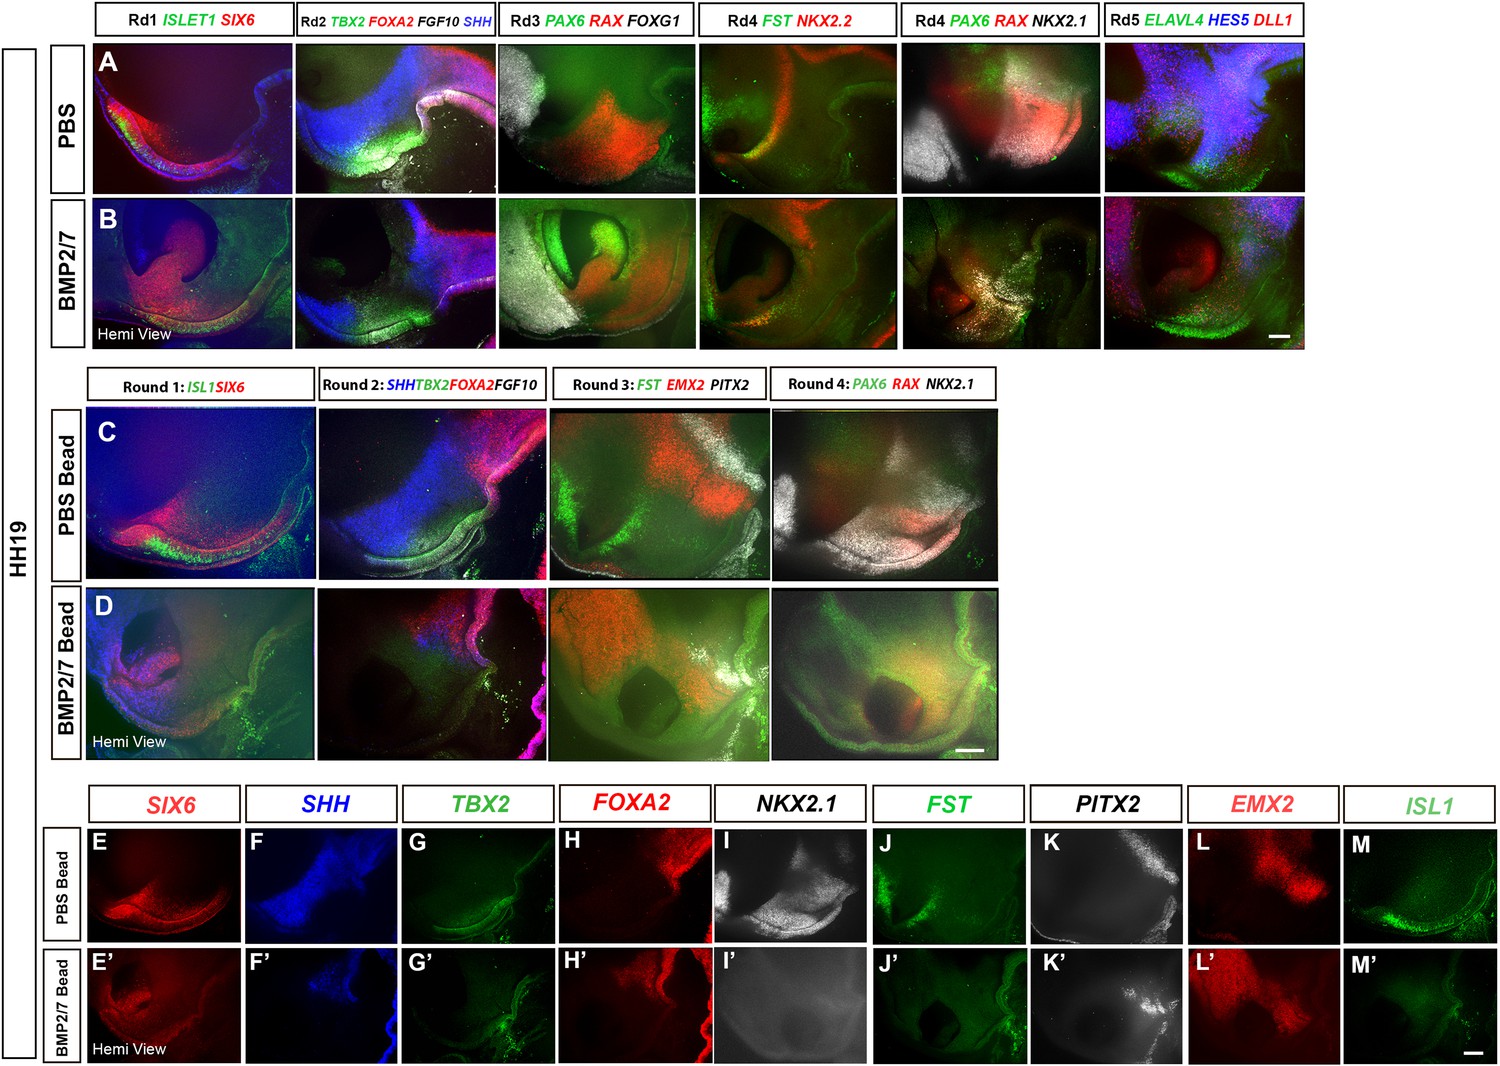
Ectopic BMPs reduce or eliminate tuberal cells.
(A–D) Hemi-views of HH18 embryos after grafting PBS-soaked (A, C) or BMP2/7-soaked (B, D) beads at HH10. Embryo in (B) shows partial loss of tuberal hypothalamus (n = 4); embryo in (D) shows complete loss of tuberal hypothalamus (n = 2) after exposure to BMP. In (A, B), embryos subject to three rounds of multiplex wholemount HCR for SIX6/ISL1 (Round1); SHH/TBX2/FGF10/FOXA2 (Round 2); PAX6/RAX/FOXG1 (Round 3), then subdivided and subject to one or two further rounds of multiplex wholemount HCR (n = 2 embryos each for rounds 4 and 5): FST/ NKX2.2 (Round 4); or PAX6/RAX /NKX2.1 (Round 4*: different embryo to others in row); ELAVL4/HES5/DLL1 (Round 5). In (C, D), embryos subject to four rounds of multiplex wholemount HCR for SIX6/ISL1 (Round 1); SHH/TBX2/FGF10/FOXA2 (Round 2); FST/PITX2/EMX2 (Round 3) and PAX6/RAX/NKX2.1 (Round 4). (E–M′) individual channel views of the control and BMP2/7-treated embryos shown in (C, D). Scale bars: 100 µm.
Figure 7
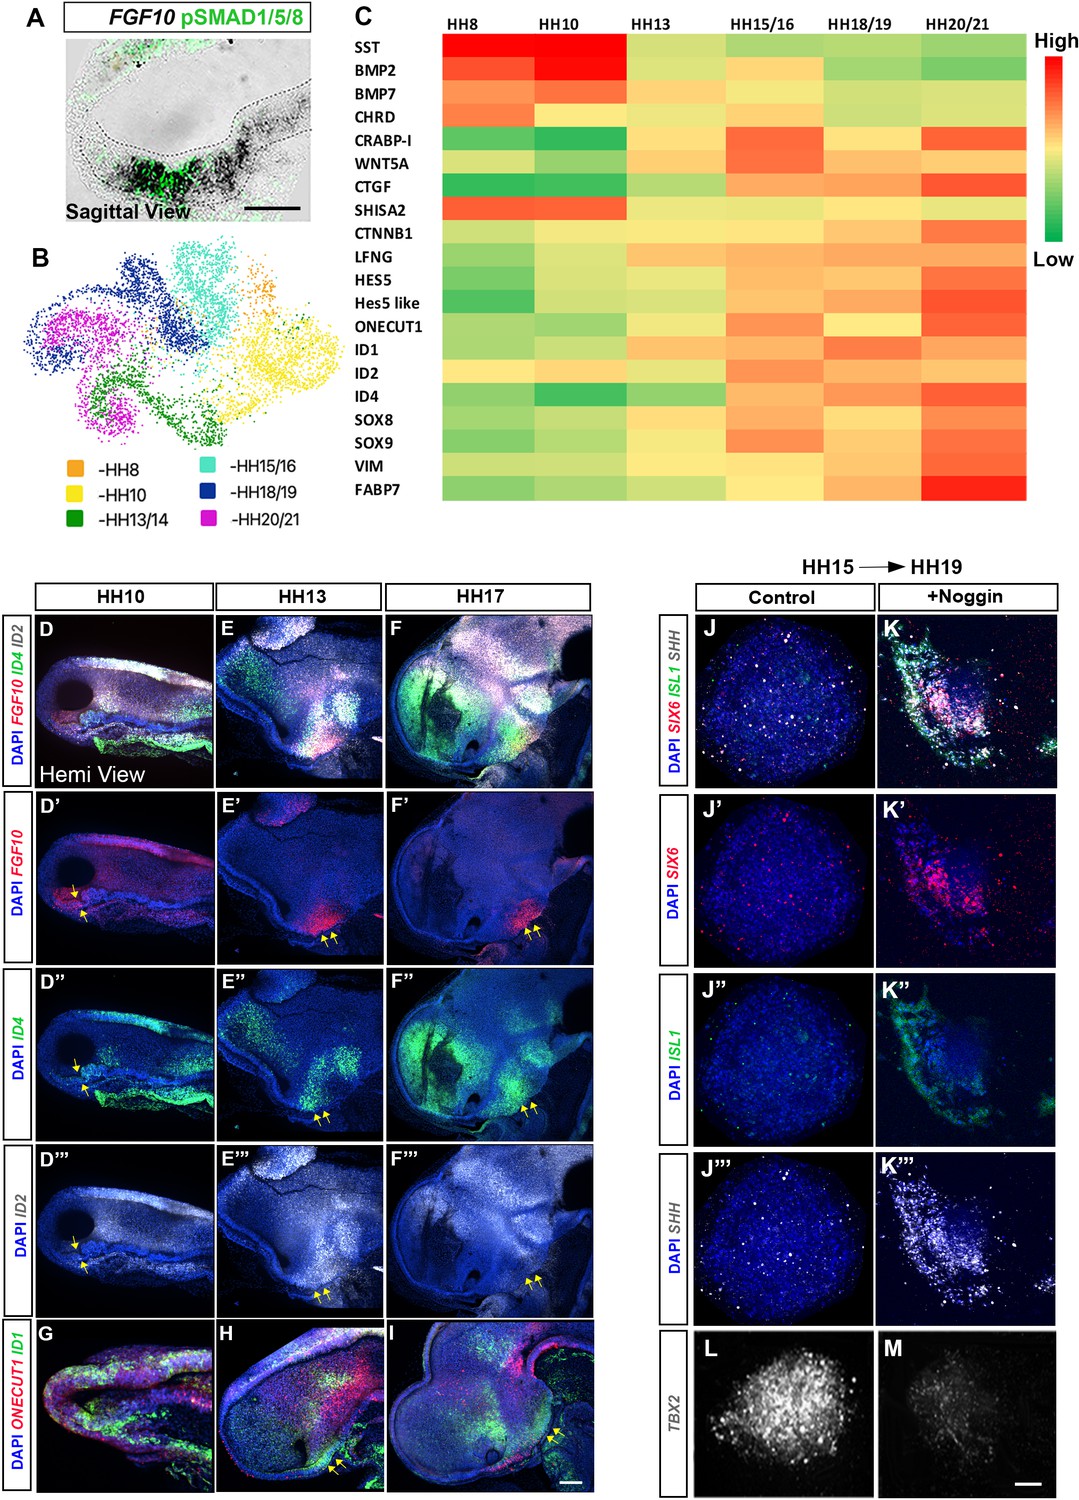
Dynamic transcriptional changes in FGF10-expressing tuberal progenitors.
(A) Sagittal sectionof HH10 embryo, analysed by chromogenic in situ hybridisation and then by immunohistochemistry to detect FGF10 and pSMAD1/5/8. (B) UMAP plot showing the distribution of FGF10+ve tuberal progenitors profiled in a previous scRNA-Seq study (Kim et al., 2022). (C) Heat map showing upregulated and downregulated genes between stages HH8 and HH20/21. (D–I) MIPs of hemi-dissected heads of HH10 (D, G), HH13 (E, H) and HH17 (F, I) embryos after multiplex HCR for FGF10/ID4/ID2 (D–F″) or ONECUT1/ID1 (G–I). Yellow arrows point to FGF10+ve domain. (J–M) MIPs of explants dissected from the FGF10+ve domain at HH15 i.e., region shown by arrows in (E′, F′) and cultured to an HH19 equivalent alone (J–J″′, L) or with Noggin (K–K″′, M) analysed by HCR for SIX6/ISL1/SHH/TBX2. n = 3 explants/condition. Scale bars: 100 µm. HCR, hybridisation chain reaction; MIP, maximum intensity projection.
Figure 8
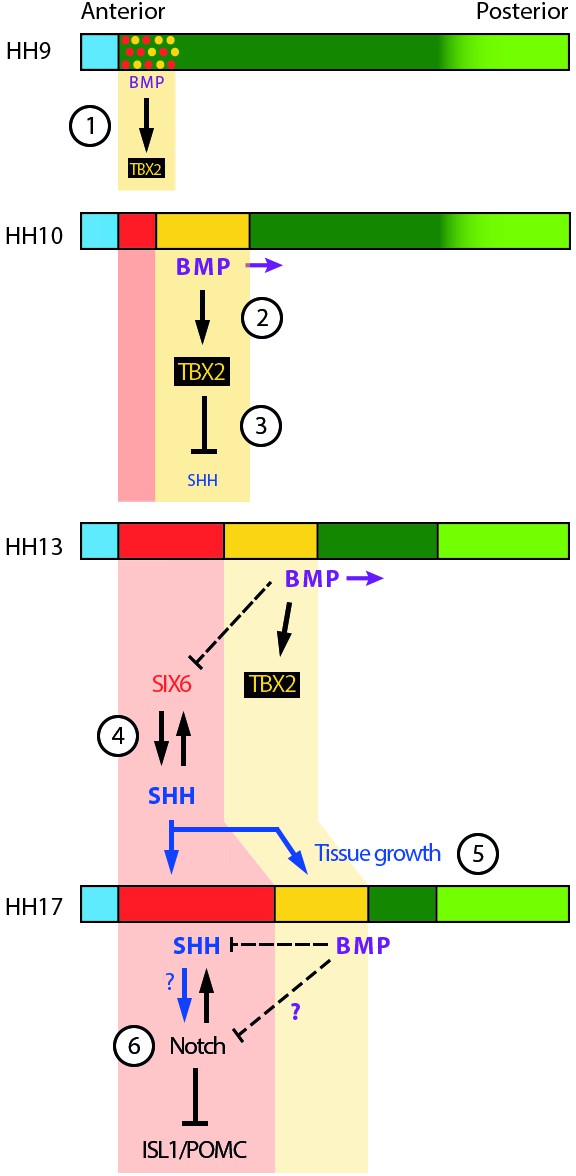
Schematic depicting selected signalling/transcription factor interactions in developing tuberal neuroectoderm.
(1) The onset of BMP signalling in HH8/9 anterior neuroectoderm starts to induce TBX2 in HypFP cells. (2) BMP signalling starts to move posteriorly within the neuroepithelium (purple arrows), promoting TBX2 expression in its vicinity. (3) TBX2 in turn represses SHH, which starts to be downregulated. (4) A mutually reinforcing feedback loop between SIX6 and SHH may help to establish/maintain robust expression of both factors in the anterior tuberal domain. Note that BMP signalling represses SIX6 expression after HH15, whether directly or indirectly (dotted line). (5) SHH produced by anterior tuberal progenitors may feed back onto posterior tuberal progenitors to sustain their growth, and that of the anterior domain. (6) By unknown mechanisms (question marks), fine-tuning of Notch signalling ensures the correct balance of proliferation versus neurogenesis in the tuberal hypothalamus. Horizontal coloured bars represent HH8–HH17 neuroectoderm; colouring is the same as Figure 1O-S, Figure 2P. See Figure 1O-S for corresponding gene expression profiles.
Additional files
-
MDAR checklist
- https://cdn.elifesciences.org/articles/83133/elife-83133-mdarchecklist1-v2.docx
-
Source data 1
Source data provides accession numbers for the HCR probes used in this study.
- https://cdn.elifesciences.org/articles/83133/elife-83133-data1-v2.xlsx
Download links
A two-part list of links to download the article, or parts of the article, in various formats.
Downloads (link to download the article as PDF)
Open citations (links to open the citations from this article in various online reference manager services)
Cite this article (links to download the citations from this article in formats compatible with various reference manager tools)
A neuroepithelial wave of BMP signalling drives anteroposterior specification of the tuberal hypothalamus
eLife 12:e83133.
https://doi.org/10.7554/eLife.83133


