High-resolution imaging of the osteogenic and angiogenic interface at the site of murine cranial bone defect repair via multiphoton microscopy
- Center for Musculoskeletal Research, University of Rochester, School of Medicine and Dentistry, United States
- Department of Biomedical Engineering, University of Rochester, United States
- Shanghai Institutes for Biological Sciences, China
Figures
Figure 1
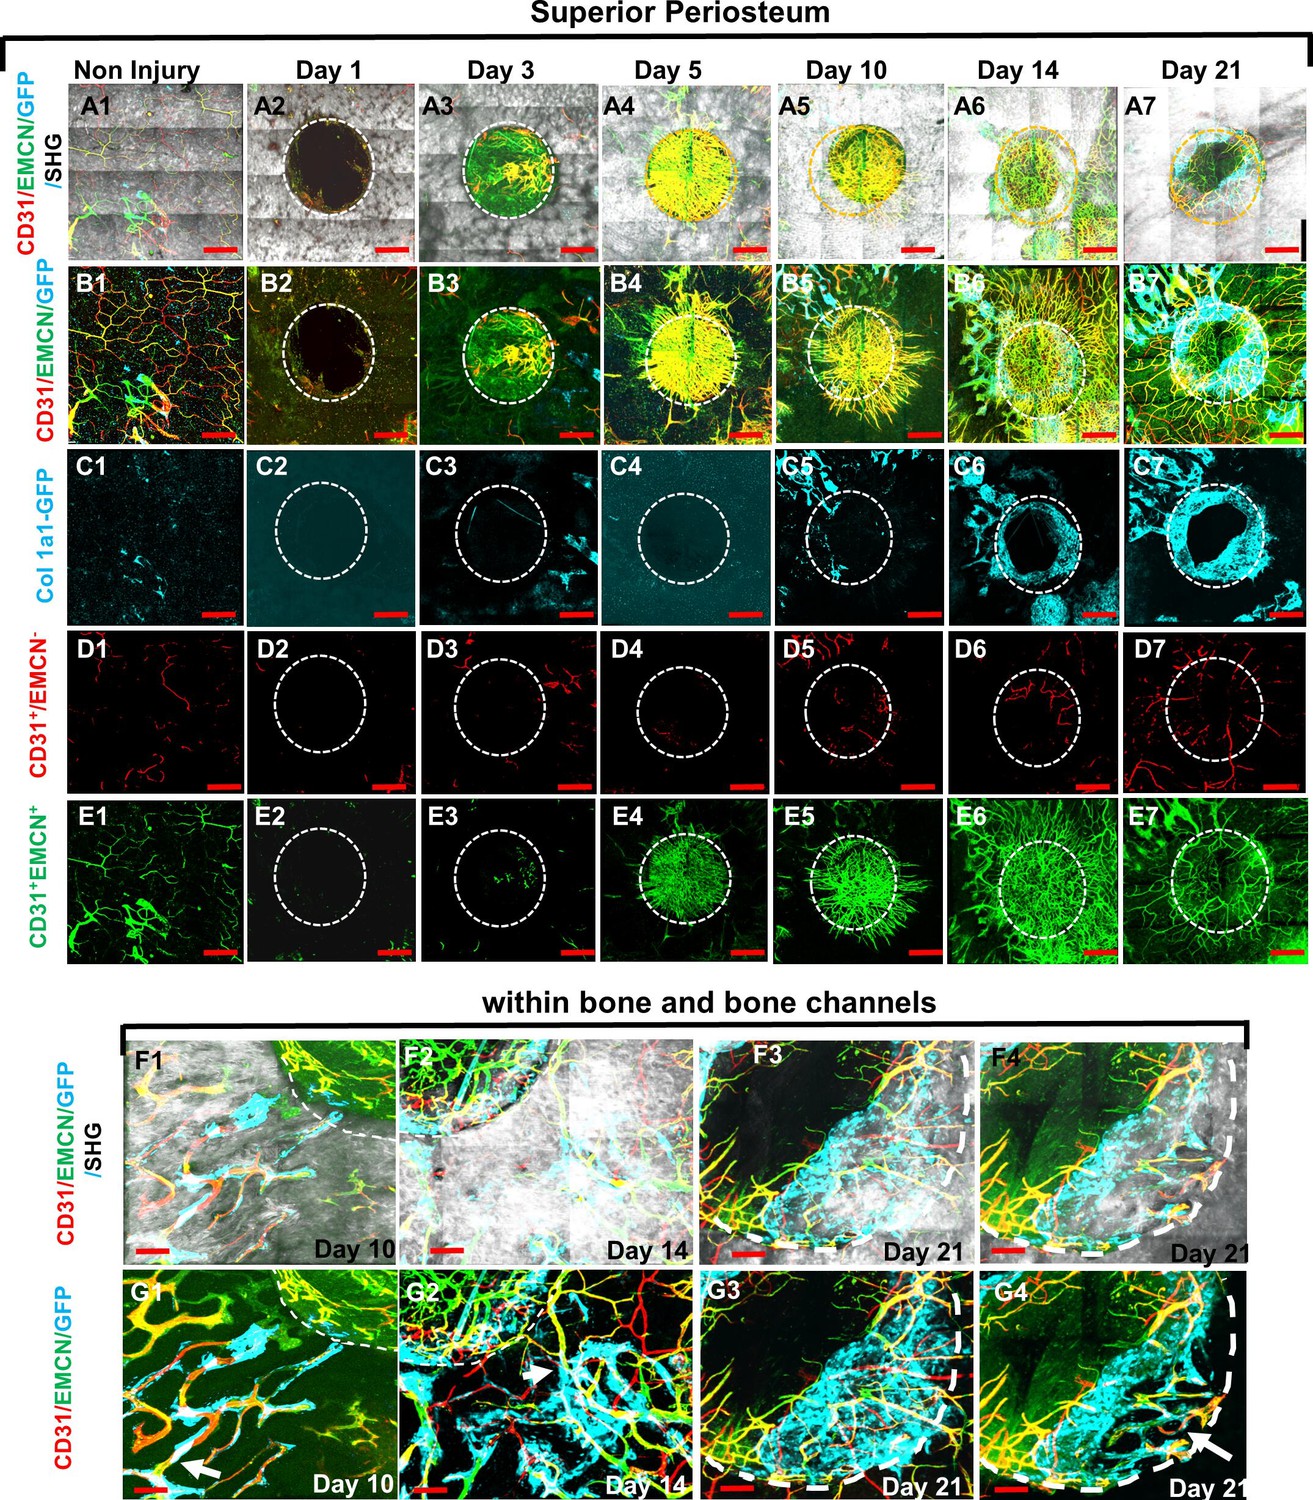
Multiphoton laser scanning microscopy (MPLSM) imaging at the superior periosteum of the cranial bone defect in Col1a1-GFP transgenic mice.
Cranial defects were imaged via MPLSM from superior side of cranial bone before and after injury at days 1, 3, 5, 10, 14, and 21. Two types of vessels CD31+EMCN+ (yellow or yellowish green), CD31+EMCN− (red), and Col1a1-GFP+ osteoblasts (cyan) were reconstructed with (A1–7) or without bone (gray, B1–7) to illustrate the spatiotemporal changes of vessels during cranial repair at the superior side of the defect. Vessels sprouted from the dura side periosteum were abundant in the defect region at day 5. The superior periosteum had no sign of bone formation until day 10. GFP+ osteoblasts (cyan) were found primarily at the leading edge of the defect and within bone channels at days 10, 14, and 21 (C1–7). CD31+EMCN− (red, D1–7), CD31+EMCN+ (green, E1–7) were separately reconstructed to show temporal changes of the two types of vessels. Zoom-in images of bone defect at the leading edge and within bone channels are shown at days 14 and 21 with (F1–4) and without bone (G1–4). Arrows show two types of vessels within bone channels, many tightly associated with Col1a1-GFP+ cells at day 14 and day 21. Scale bar (panels A–E) = 500 μm, Scale bar (panels F and G) = 100 μm. CD 31 staining is pseudocolored as red, EMCN as green, merged color as yellow or yellowish green, Col1a1-GFP as cyan. Bone via second harmonic generation (SHG) as gray.
-
Figure 1—source data 1
Original images for Figure 1.
- https://cdn.elifesciences.org/articles/83146/elife-83146-fig1-data1-v3.zip
Figure 2
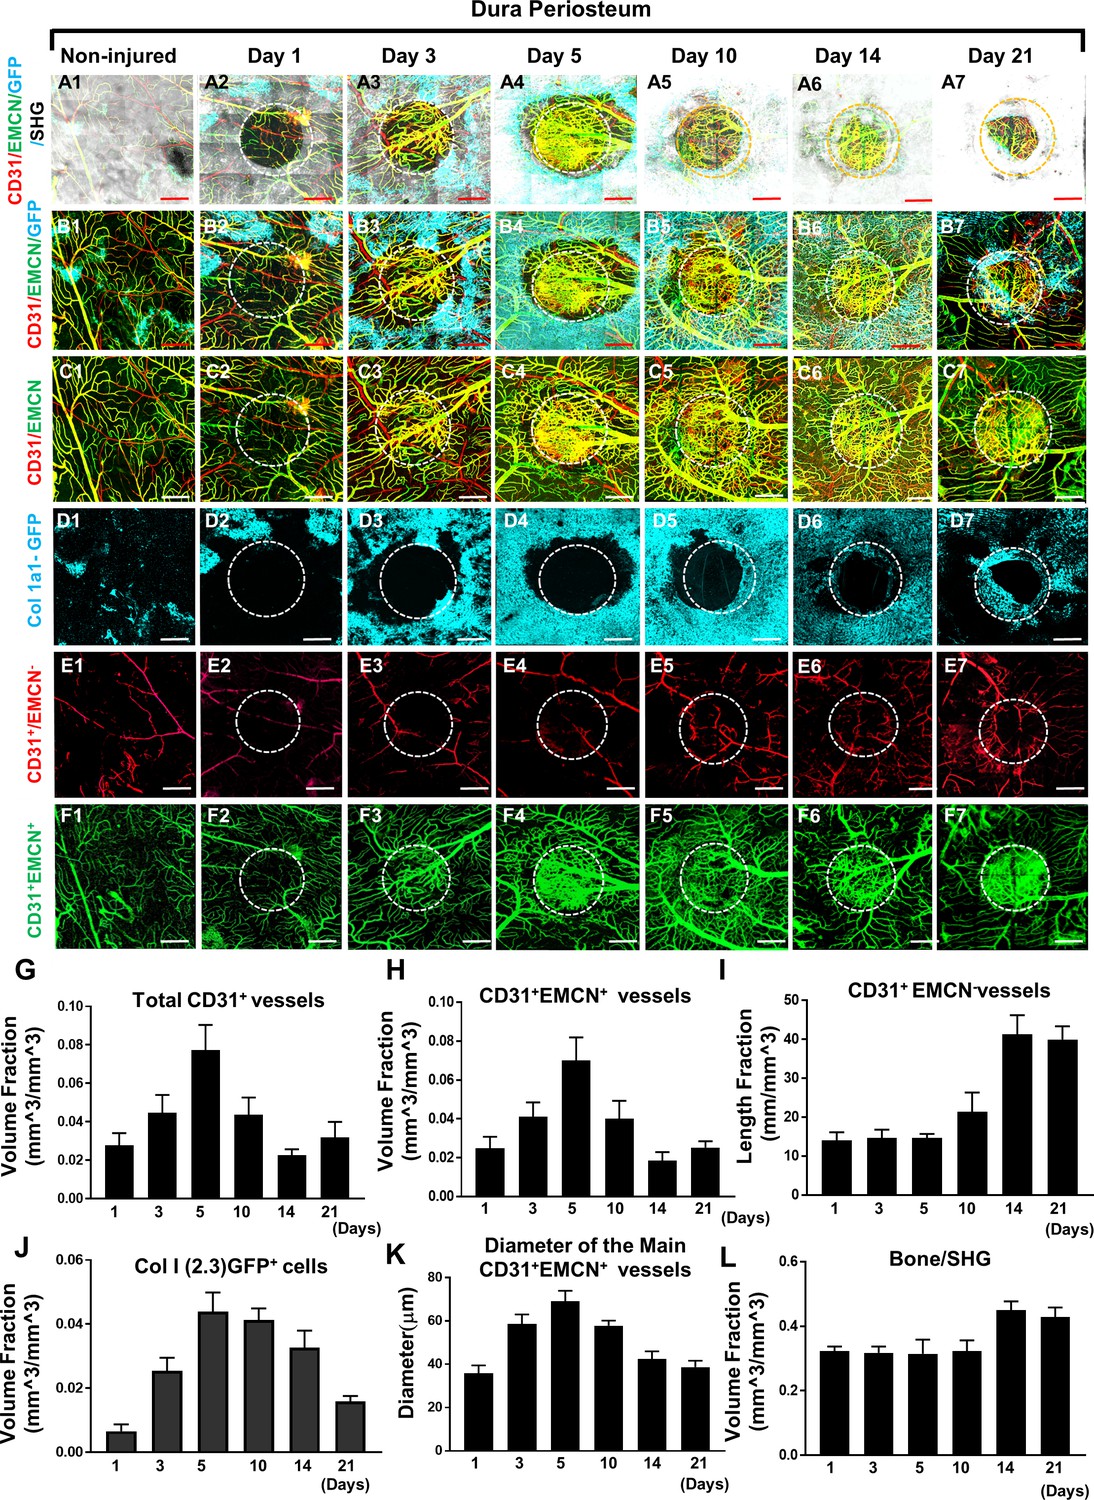
Multiphoton laser scanning microscopy (MPLSM) imaging at the dura periosteum of the cranial bone defect in Col1a1-GFP transgenic mice.
Cranial defects were imaged from the dura side of the cranial bone via MPLSM before and after injury at days 1, 3, 5, 10, 14, and 21. The reconstructed images illustrate bone (gray), Col1a1-GFP osteoblasts (cyan), CD31+EMCN+ vessels (yellow or greenish yellow), and CD31+EMCN− vessels (red) at the dura side of the defect (A1–7). To show spatiotemporal relationship of bone, osteoblasts and two types of vessels, the images were reconstructed to separately illustrate GFP+ osteoblasts with CD31+EMCN+ and CD31+EMCN− vessels (B1–7), two types of vessels together (C1–7), GFP+ osteoblasts only (D1–7), and CD31+EMCN− only (E1–7) or CD31+EMCN+ (green) only vessels (F1–7). Quantitative analyses show volume fraction of the total CD31+ (G), CD31+EMCN+ vessels (H), Length fraction of CD31+EMCN− vessels (I), the associated changes of volume fraction of Col1a1-GFP osteoblasts (J), the mean diameter of the main CD31+EMCN+ vessels (K) and the volume fraction of bone as indicated by second harmonic generation (SHG) (L). n=3. Scale bar = 500 μm. CD 31 staining is pseudocolored as red, EMCN as green, merged color as yellow or yellowish green, Col1a1-GFP as cyan. SHG/bone as gray.
-
Figure 2—source data 1
Original images for Figure 2.
- https://cdn.elifesciences.org/articles/83146/elife-83146-fig2-data1-v3.zip
Figure 3

AplnCreER and BmxCreER, respectively, label CD31+EMCN+ and CD31+EMCN− vessels in cranial defect repair.
Cranial samples in tamoxifen (TM)-treated AplnCreER; Ai6 mice at day 14 were stained with CD31 and EMCN and reconstructed with various combinations of channels as indicated to reveal the identity of vessel types (A1–8). Noted that AplnCreER-labeled vessels (pseudocolored as blue in A3) are completely overlapping with CD31+EMCN+ vessels with merged colors shown as white in A5 and 8. AplnCreER-labeled vessels are excluded from CD31+EMCN− vessels shown as red. BmxCreER; Ai14-labeled vessels (red) and EMCN+ vessels (green) in TM-treated BmxCreER; Ai14 mice at day 14 post-surgery (B1–4). Bmx+ vessels (red) and EMCN+ vessels (green) are mutually exclusive. Images A1–6 and B1–2 were reconstructed from top to bottom at 0–300 μm in depth whereas images A7–8 and B3–4 were reconstructed from 100 μm below surface to show vessels inside bone tissue. scale bar = 200 μm.
-
Figure 3—source data 1
Original files for Figure 3.
- https://cdn.elifesciences.org/articles/83146/elife-83146-fig3-data1-v3.zip
Figure 4
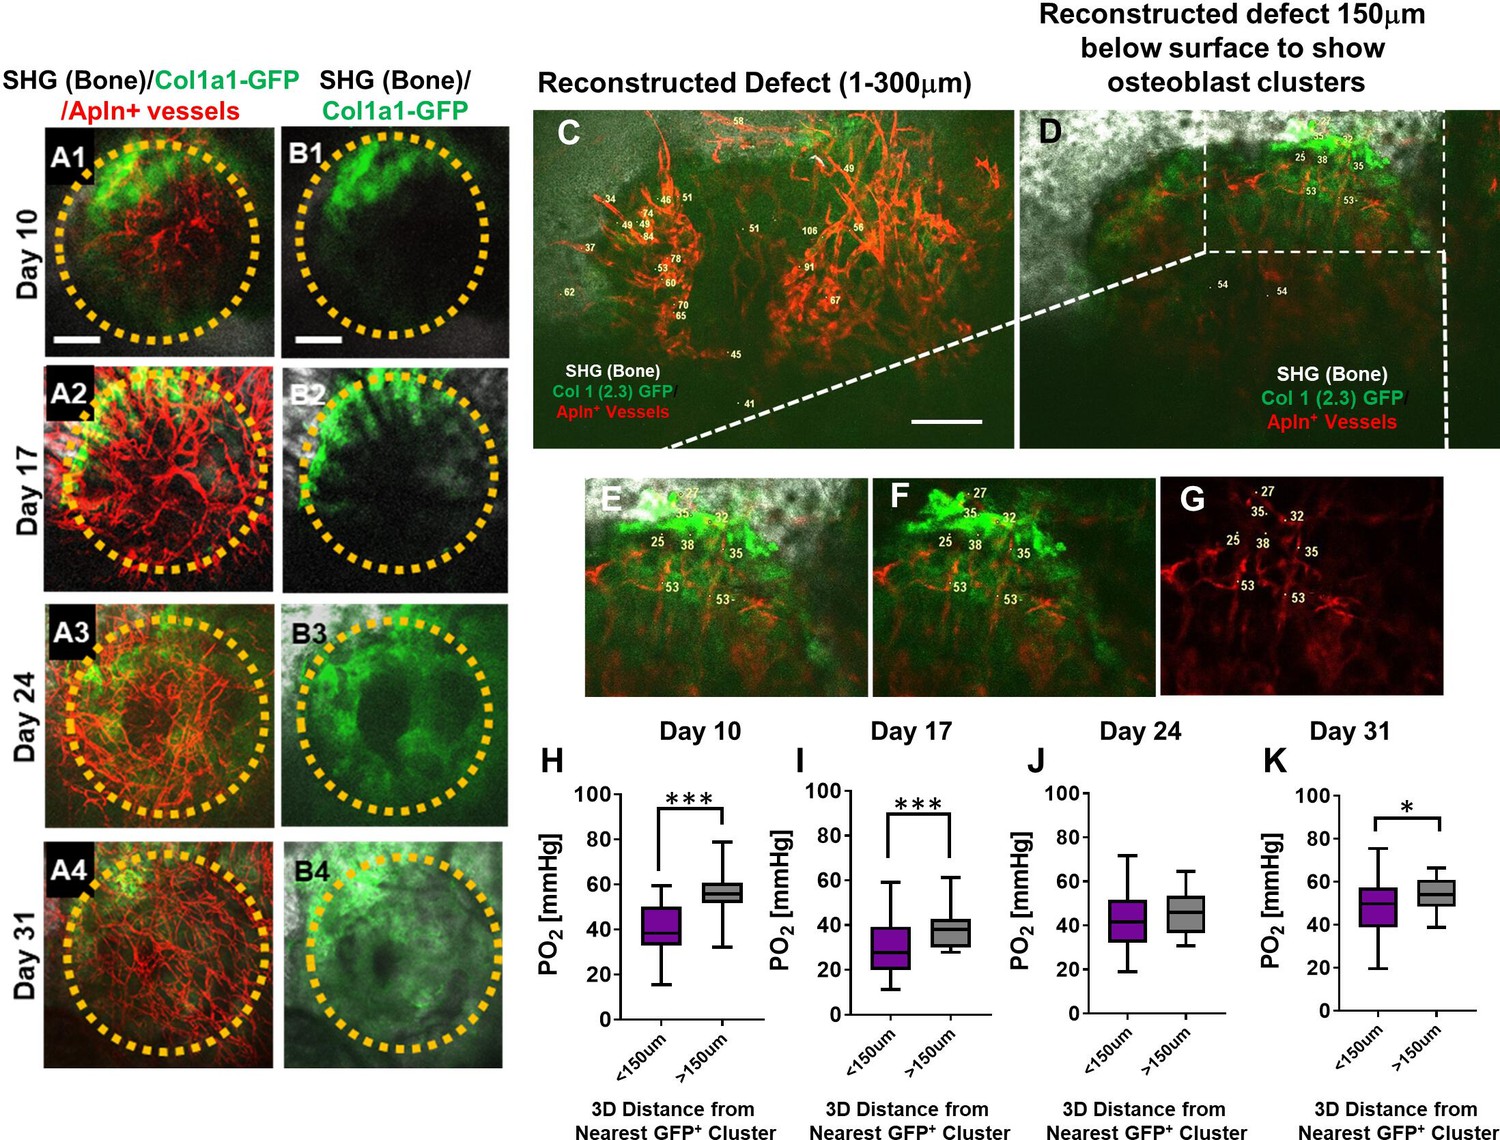
Spatiotemporal analyses of partial oxygen pressure (pO2) using AplnCreER;Ai14;Col1a1-GFP mice.
Representative maximum intensity projection images of osteoblasts (green), Apln+ vessels (red), and bone via second harmonic generation (SHG; gray) of the defect at days 10, 17, 24, and 31 post-surgery (A1–A4, B1–B4). The dashed orange line indicates the initial defect (scale bar = 0.25 mm). Representative multiphoton laser scanning microscopy images show vessels and pO2 measurements at the indicated locations. Images are reconstructed at 0–300 μm (C) and 150–300 μm depths (D–G) to illustrate vessels and pO2 measurements with or without osteoblast clusters. Boxed region in D is zoomed-in to show vessels and the GFP+ osteoblasts (E–G). Box plot to compare measurements of pO2 less than or greater than 150 μm distance from the closest osteoblast clusters at the indicated time points (H–K). (At least 10 measurements in each region at each time point from 4 mice were used for analyses, *, p<0.05, **, p<0.01, ***, p<0.005, ****, p<0.001).
-
Figure 4—source data 1
Original data sets and images.
- https://cdn.elifesciences.org/articles/83146/elife-83146-fig4-data1-v3.zip
-
Figure 4—source data 2
Original data sets and images.
- https://cdn.elifesciences.org/articles/83146/elife-83146-fig4-data2-v3.zip
Figure 5 with 1 supplement
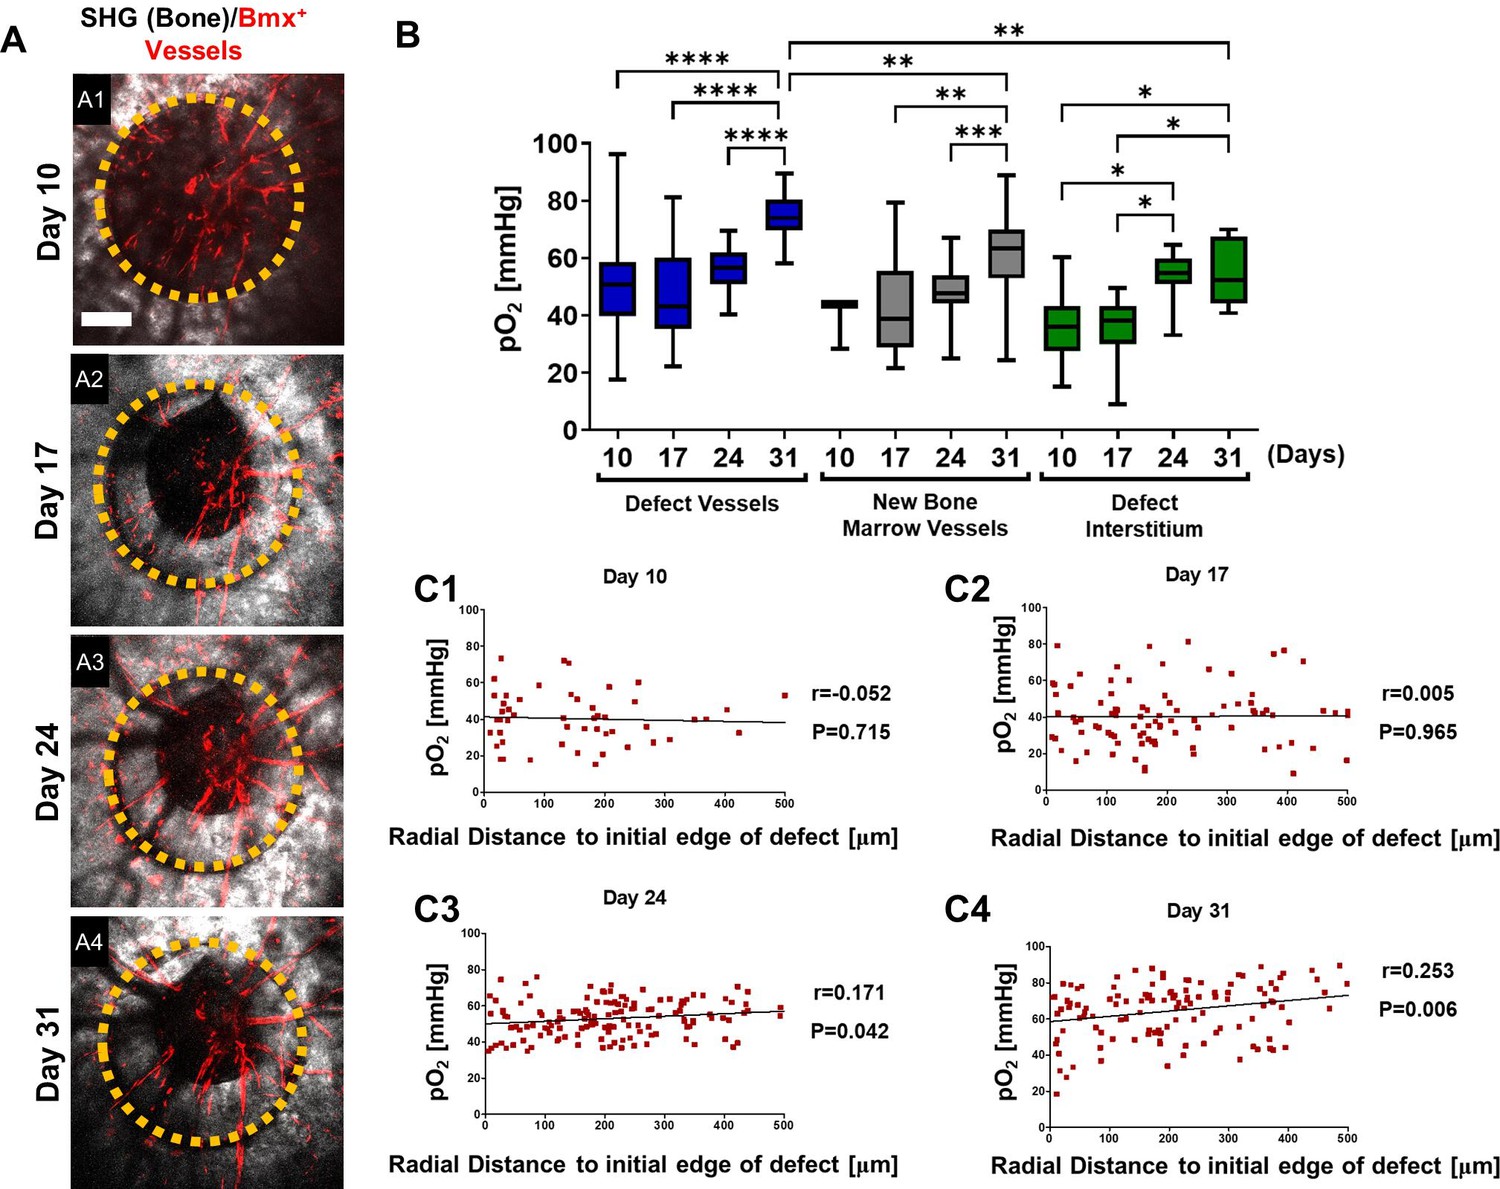
Spatiotemporal analyses of partial oxygen pressure (pO2) using BmxCreER; Ai14 mice.
Representative maximum intensity projection merged images of Bmx+ vessels (red) and bone via second harmonic generation (SHG; gray) of the defect at days 10, 17, 24, and 31 post-surgery (A1–4). The dashed orange line indicates the initial defect (scale bar = 0.25 mm). Box plot of the pO2 in the indicated time and region at the site of defect repair are shown (B). Pearson correlation analyses of the reported pO2 in vessels and the surrounding interstitial space as a function of the distance to the initial edge of the defect at indicated time points (C1–4). (Measurements in each region at each time point from 4 mice are used for analyses, *, p<0.05, **, p<0.01, ***, p<0.005, ****, p<0.001).
-
Figure 5—source data 1
Original data set and statistical analyses.
- https://cdn.elifesciences.org/articles/83146/elife-83146-fig5-data1-v3.zip
Figure 5—figure supplement 1
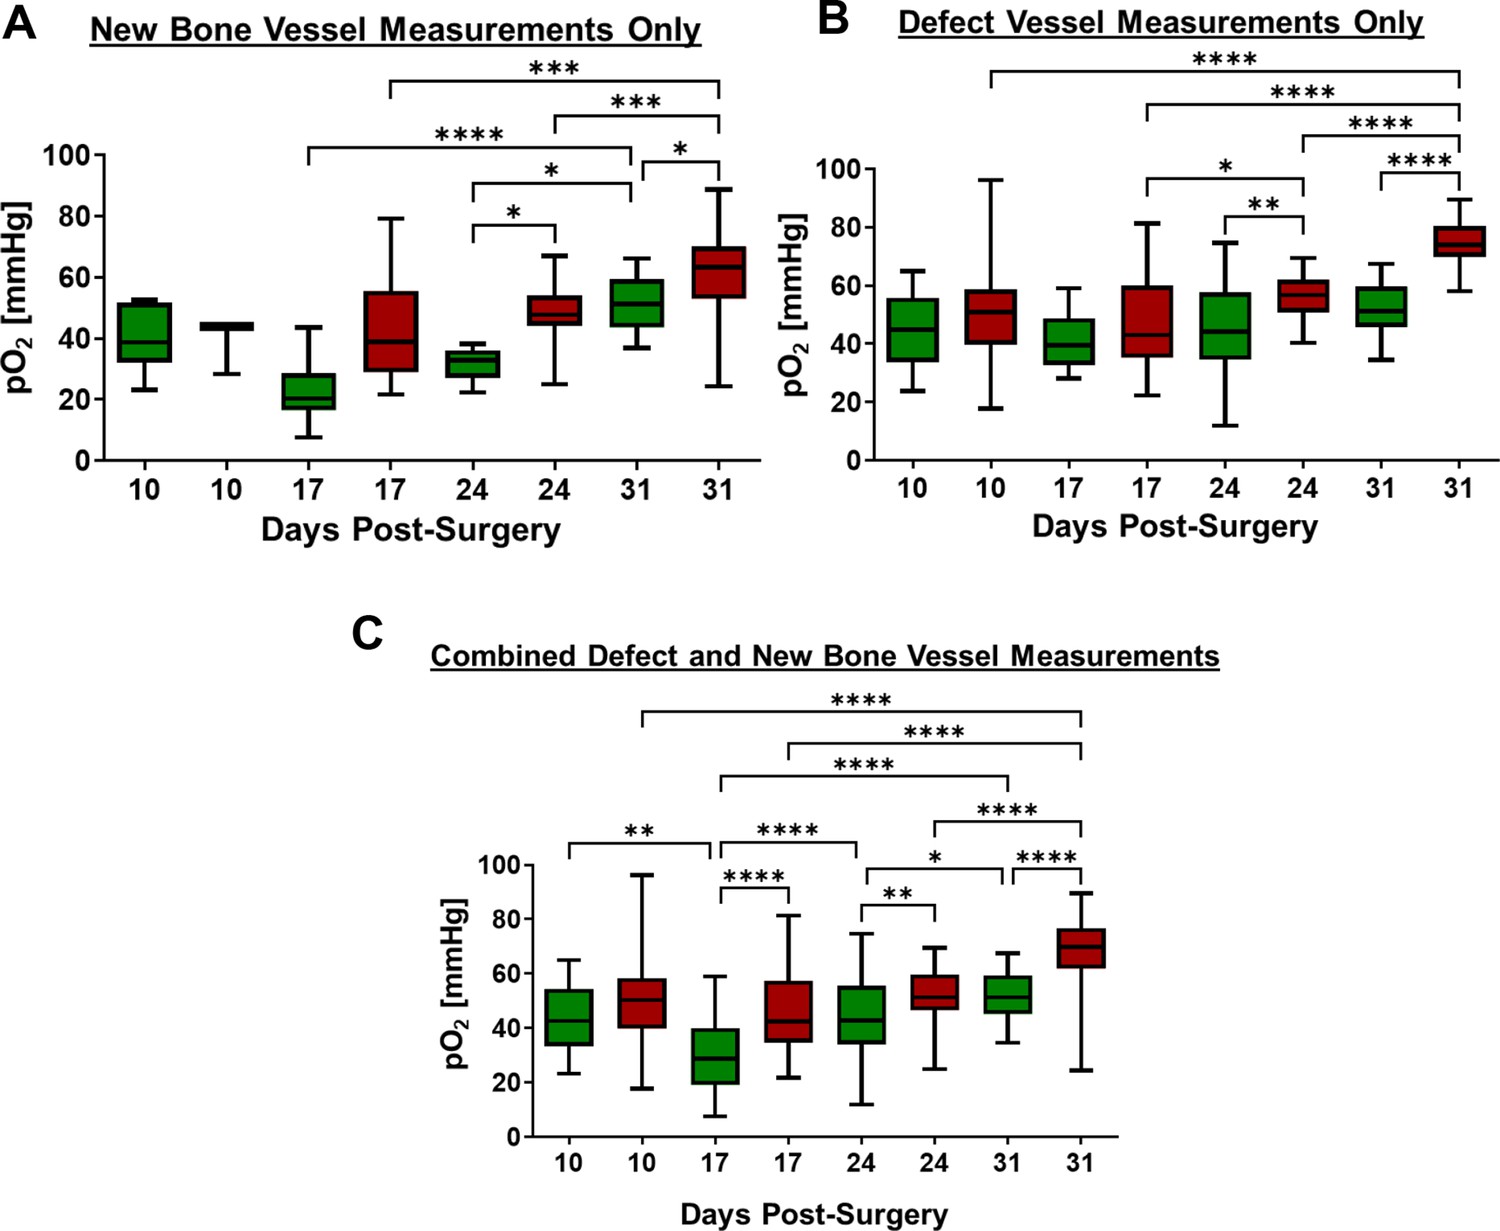
Comparison of longitudinal partial oxygen (pO2) measurements in AplnCreERT2 (green box) and BMX1CreERT2 (red box) by time and locations.
Oxygen measurements in new bone vessels (A) and vessels within defect region (B) as well as combined data (C). (n=4, **, p<0.01; ***, p>0.001, non-parametric two-way ANOVA [Kruskal-Wallis test] with Dunn post-hoc).
Figure 6
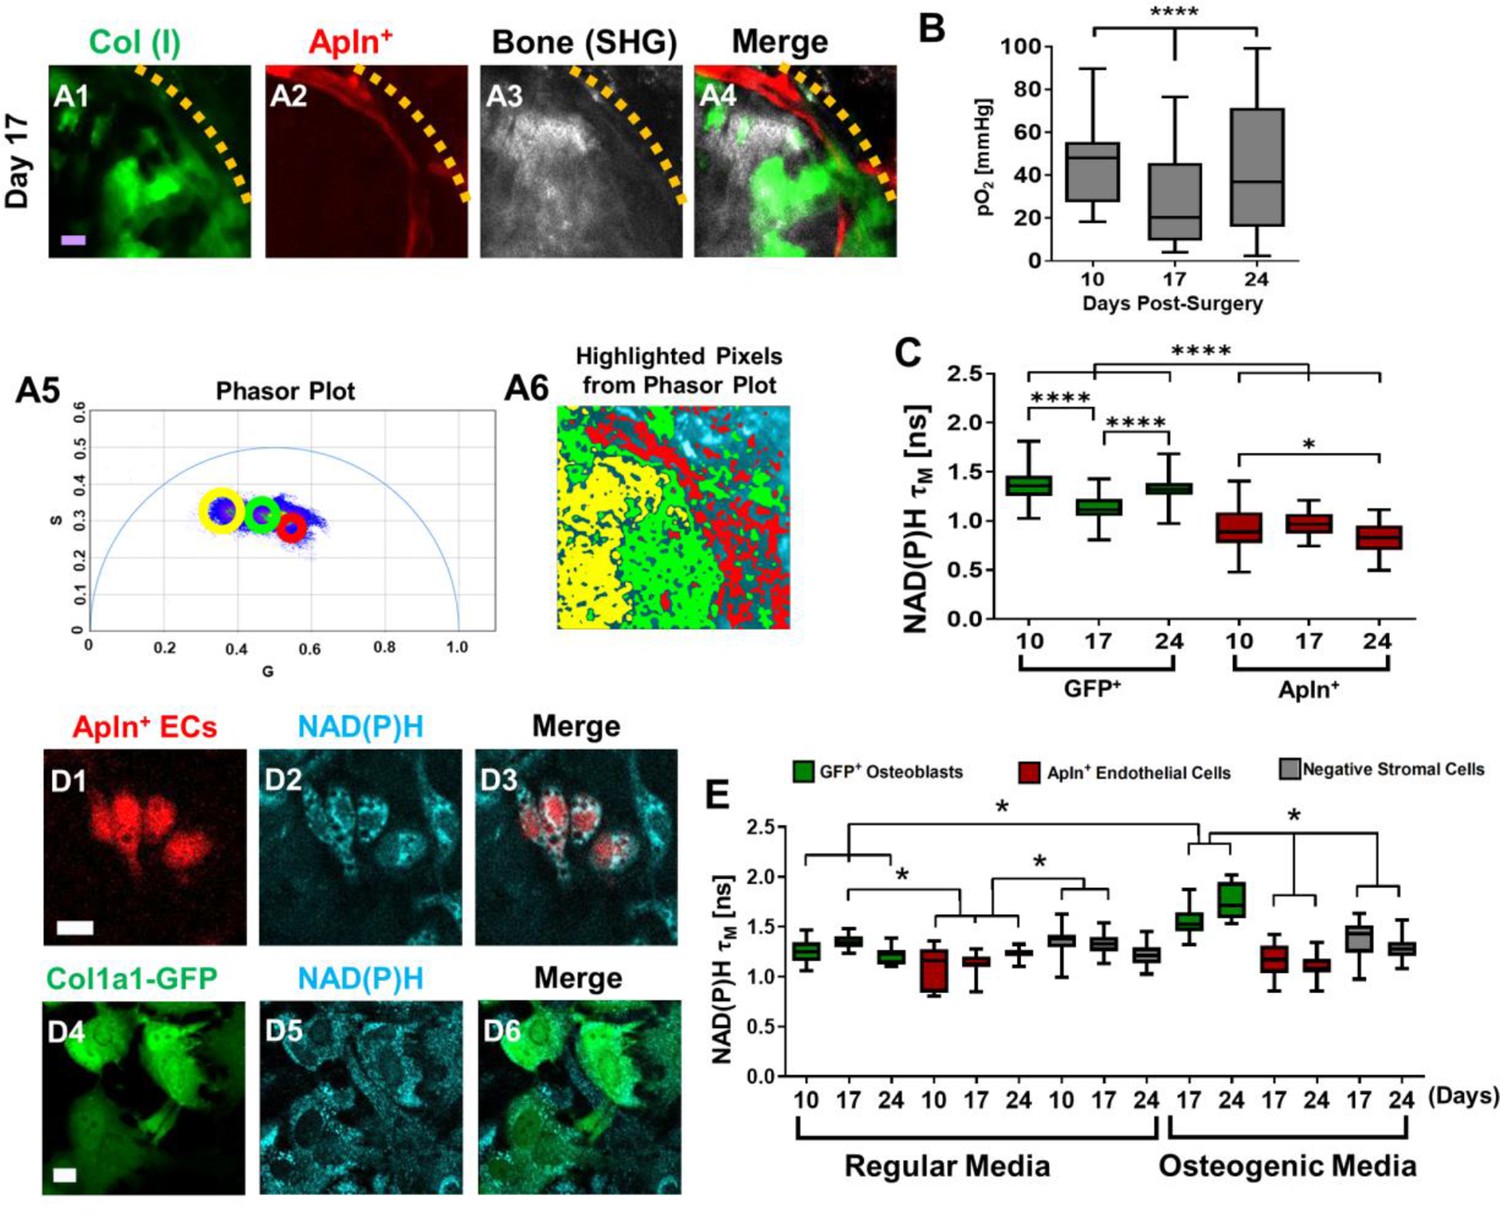
Measurements of energy metabolism in endothelial cells (ECs) and osteoblasts via two-photon NAD(P)H fluorescence lifetime imaging microscopy using AplnCreER;Ai14;Col1a1-GFP mice.
Representative multiphoton laser scanning microscopy (MPLSM) images of osteoblasts (green), Apln+ vessels (red), and bone via second harmonic generation (SHG; gray) in 1-mm cranial defect (A1-4). The dashed orange line indicates the initial defect area (scale bar = 20 μm). The phasor plot (A5) shows the distribution of the fluorescence lifetime species. The circled lifetime species in A5 correspond to the lifetime species located in AplnCreER+ ECs (red), osteoblasts (green), and collagen/bone (yellow) as shown in A6. Reported mean partial oxygen pressure (pO2) from vascular and interstitial measurements within the healing defect (B). Box plot of the measurements of NAD(P)H τM of osteoblasts (green) and Apln+ ECs (red) at days 10, 17, and 24 post-surgery (C). At least 26 cells in each of 3 mice are used for the in vivo NAD(P)H τM analyses. About 22 corresponding pO2 measurements from each of 3 mice are used for analyses. Representative MPLSM images of bone marrow culture from AplnCreERT2;Ai14;Col1a1-GFP mice are shown (D1–6, scale bar = 5 μm). NAD(P)H from all cells in cyan, RFP from Apln+ ECs in red, GFP from osteoblasts in green. Measurements of NAD(P)H τM from GFP+ osteoblasts (green box), Apln+ ECs (red box) as well as the GFP− stromal cells (gray box) in regular or osteogenic media at days 10, 17, and 24 post-seeding (E). At least eight cells in each of three parallel experiments per group are used for the in vitro NAD(P)H τM analyses. *, p<0.05, **, p<0.01, ***, p<0.005, ****, p<0.001.
-
Figure 6—source data 1
Original data set and statistical analyses.
- https://cdn.elifesciences.org/articles/83146/elife-83146-fig6-data1-v3.zip
Additional files
Download links
A two-part list of links to download the article, or parts of the article, in various formats.
Downloads (link to download the article as PDF)
Open citations (links to open the citations from this article in various online reference manager services)
Cite this article (links to download the citations from this article in formats compatible with various reference manager tools)
High-resolution imaging of the osteogenic and angiogenic interface at the site of murine cranial bone defect repair via multiphoton microscopy
eLife 11:e83146.
https://doi.org/10.7554/eLife.83146


