Domestication and lowland adaptation of coastal preceramic maize from Paredones, Peru
- Grupo de Desarrollo Reproductivo y Apomixis, Unidad de Genómica Avanzada, Laboratorio Nacional de Genómica para la Biodiversidad, CINVESTAV, Mexico
- Grupo de Interacción Núcleo-Mitocondrial y Paleogenómica, Unidad de Genómica Avanzada, Laboratorio Nacional de Genómica para la Biodiversidad, CINVESTAV, Mexico
- Departamento de Antropología, Universidad Nacional de Trujillo, Perú, Peru
- Centro de Investigaciones Arquebiológicas y Paleoecológicas Andinas ARQUEBIOS, Peru
- Max Planck Institute for Developmental Biology, Germany
- Department of Anthropology, Vanderbilt University, United States
- Escuela de Arqueología, Universidad Austral de Chile, Chile
Figures
Figure 1 with 1 supplement
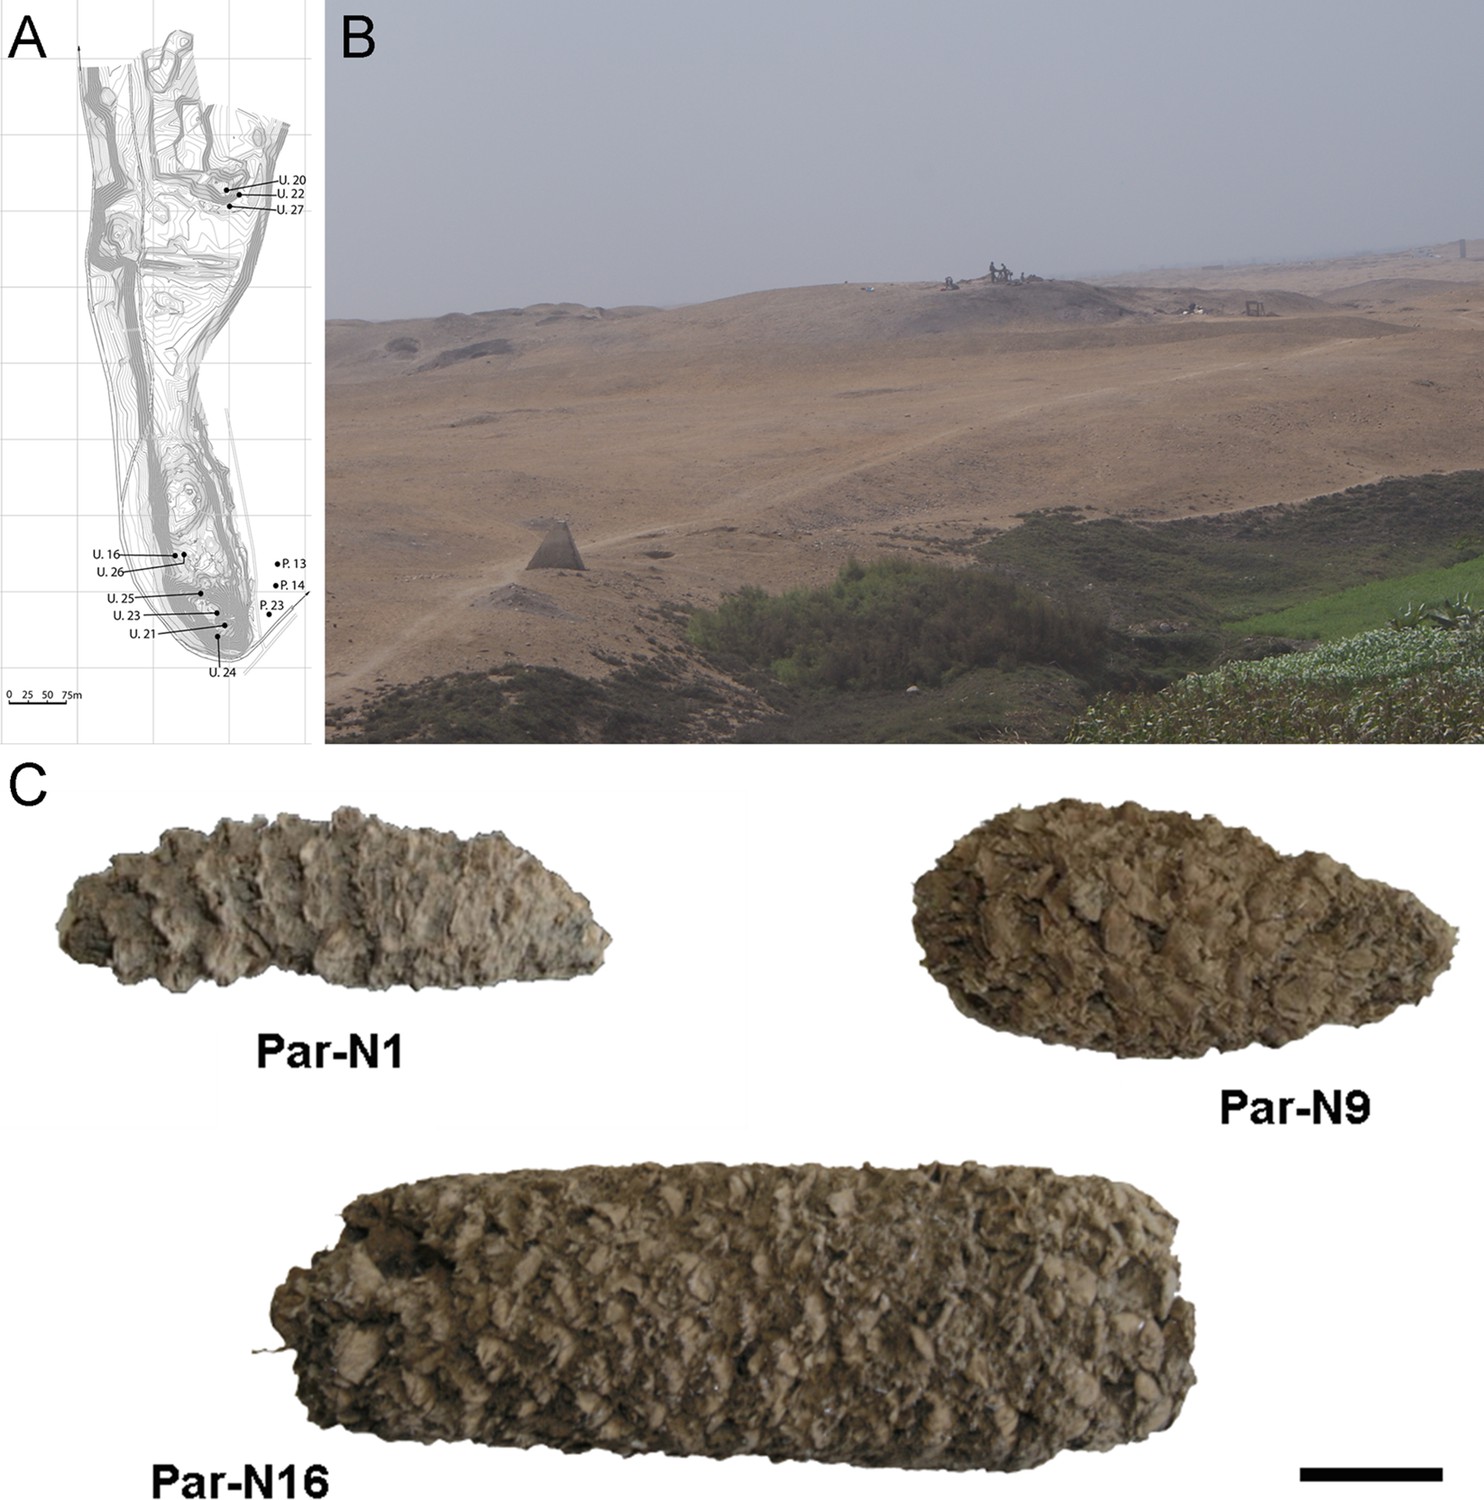
Archeological site and specimens of Paredones.
(A) Topographic contour map of Huaca Prieta and Paredones (units U20, U22, and U27) coastal sites, showing the location excavation units. (B) The Paredones mound during archeological excavations. (C) Maize specimens Par_N1 (dating 6775–6504 calibrated years BP), Par_N9 (dating to 5800–5400 calibrated years BP), and ParN16 (dating 5583–5324 calibrated years BP); Scale bar = 1 cm.
Figure 1—figure supplement 1
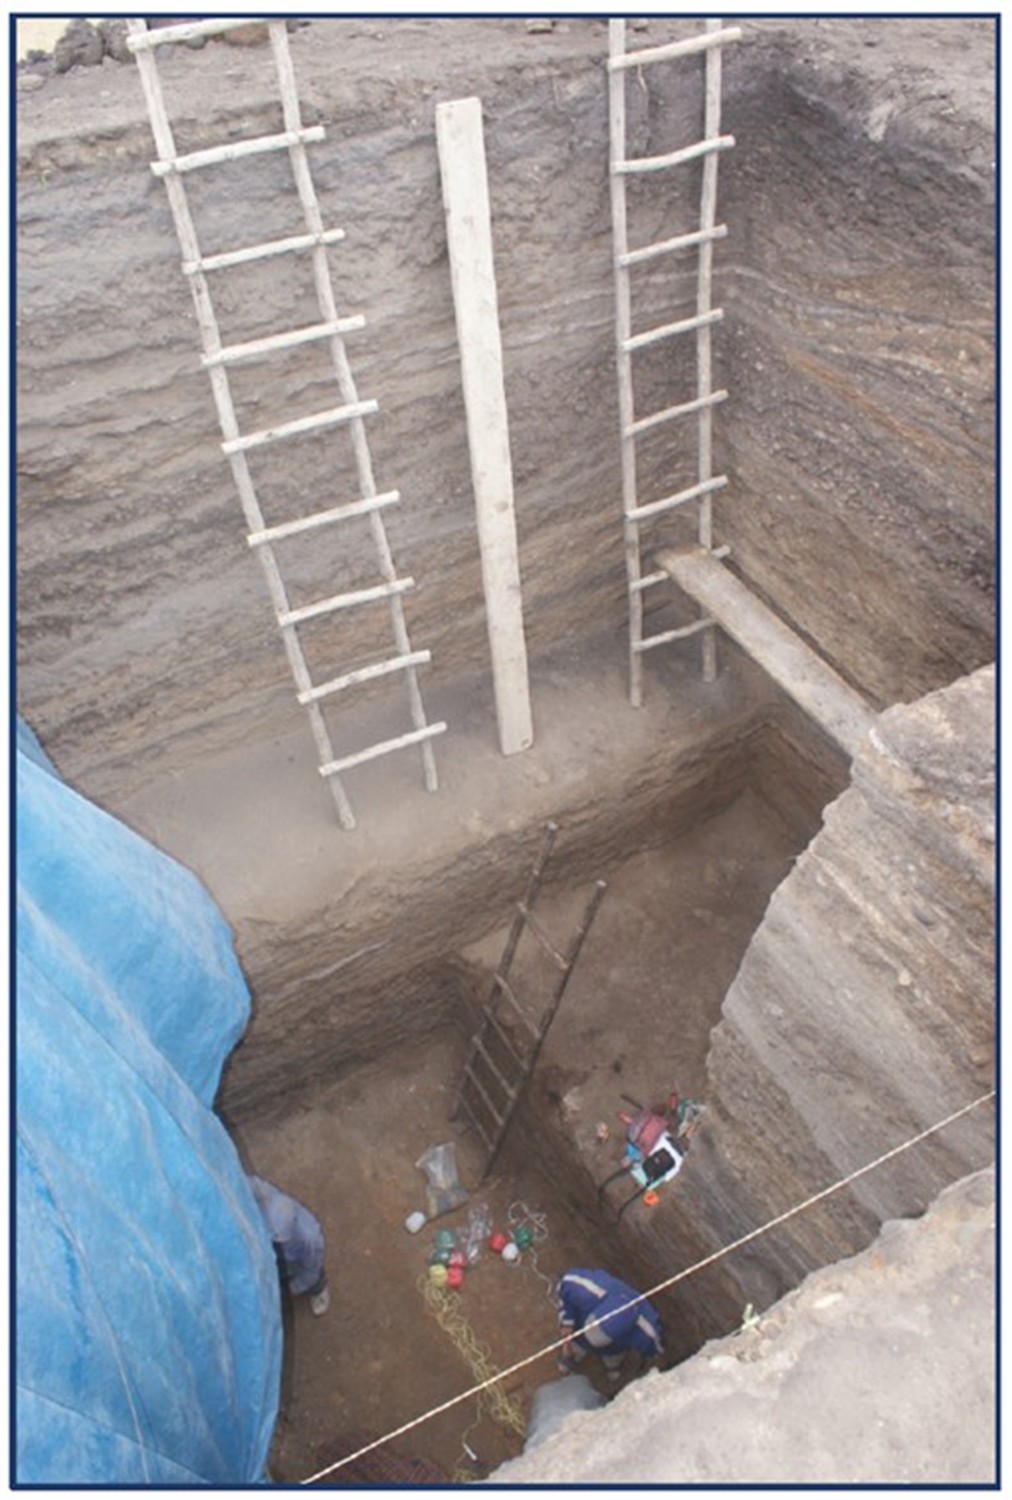
Intact stratigraphy of thin floors in Unit 22.
Par_N1, the most ancient specimen was recovered in this Unit and was dated at 5900±40 14 C years BP (6775–6504 calibrated years BP at 95.4% probability).
Figure 2 with 5 supplements
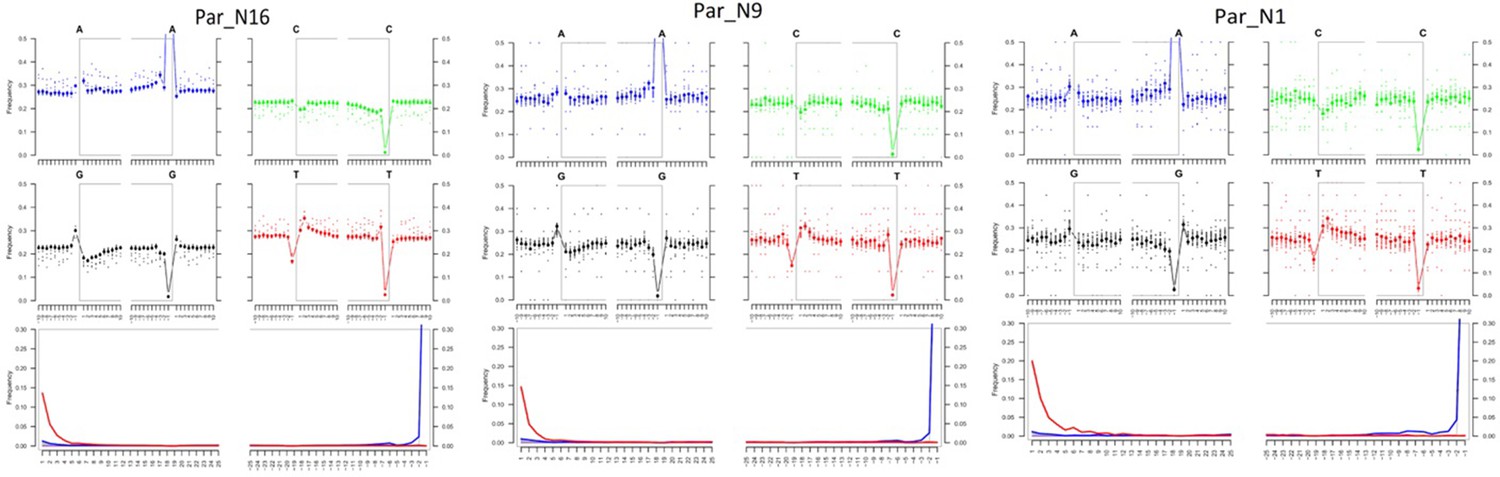
Post-mortem DNA damage and fragmentation patterns of ancient maize samples.
DNA composition around read-termini (top four plots), and DNA mis-incorporation errors relative to the 5’ and 3’ read (bottom plot); the two distributions for post-mortem damage signatures (C to T and G to A) are shown in red and blue respectively, while other types of substitutions are shown in gray.
Figure 2—figure supplement 1
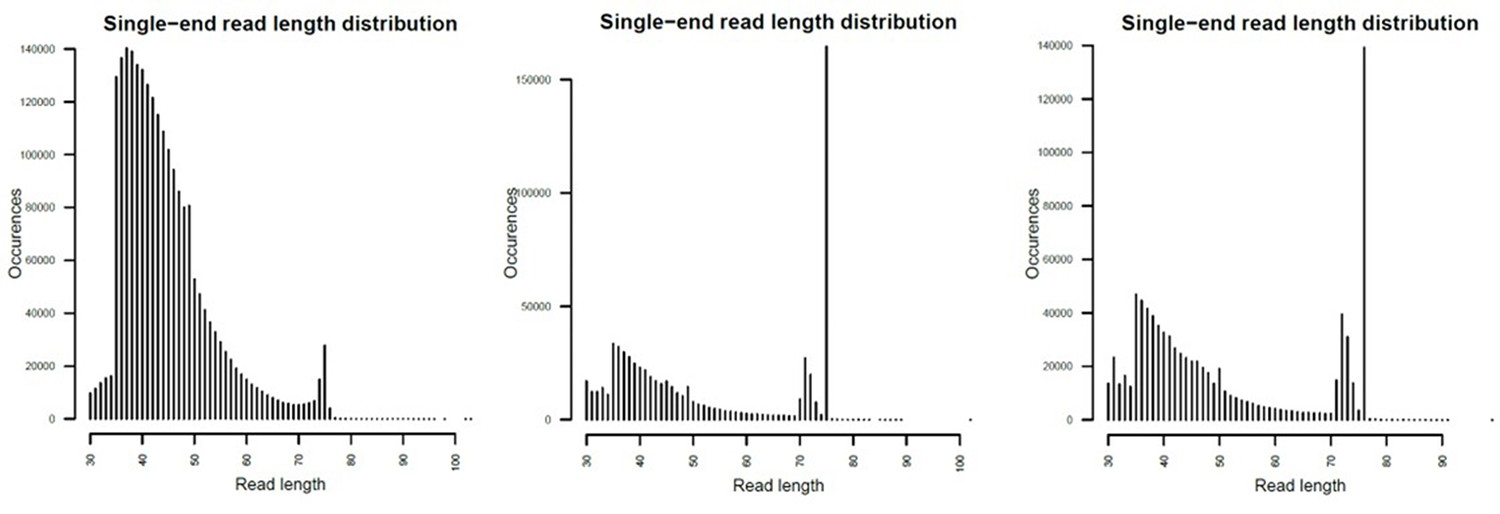
Mapped fragment length plots.
From left to right, Par_N16, Par_N9 and Par_N1.
Figure 2—figure supplement 2
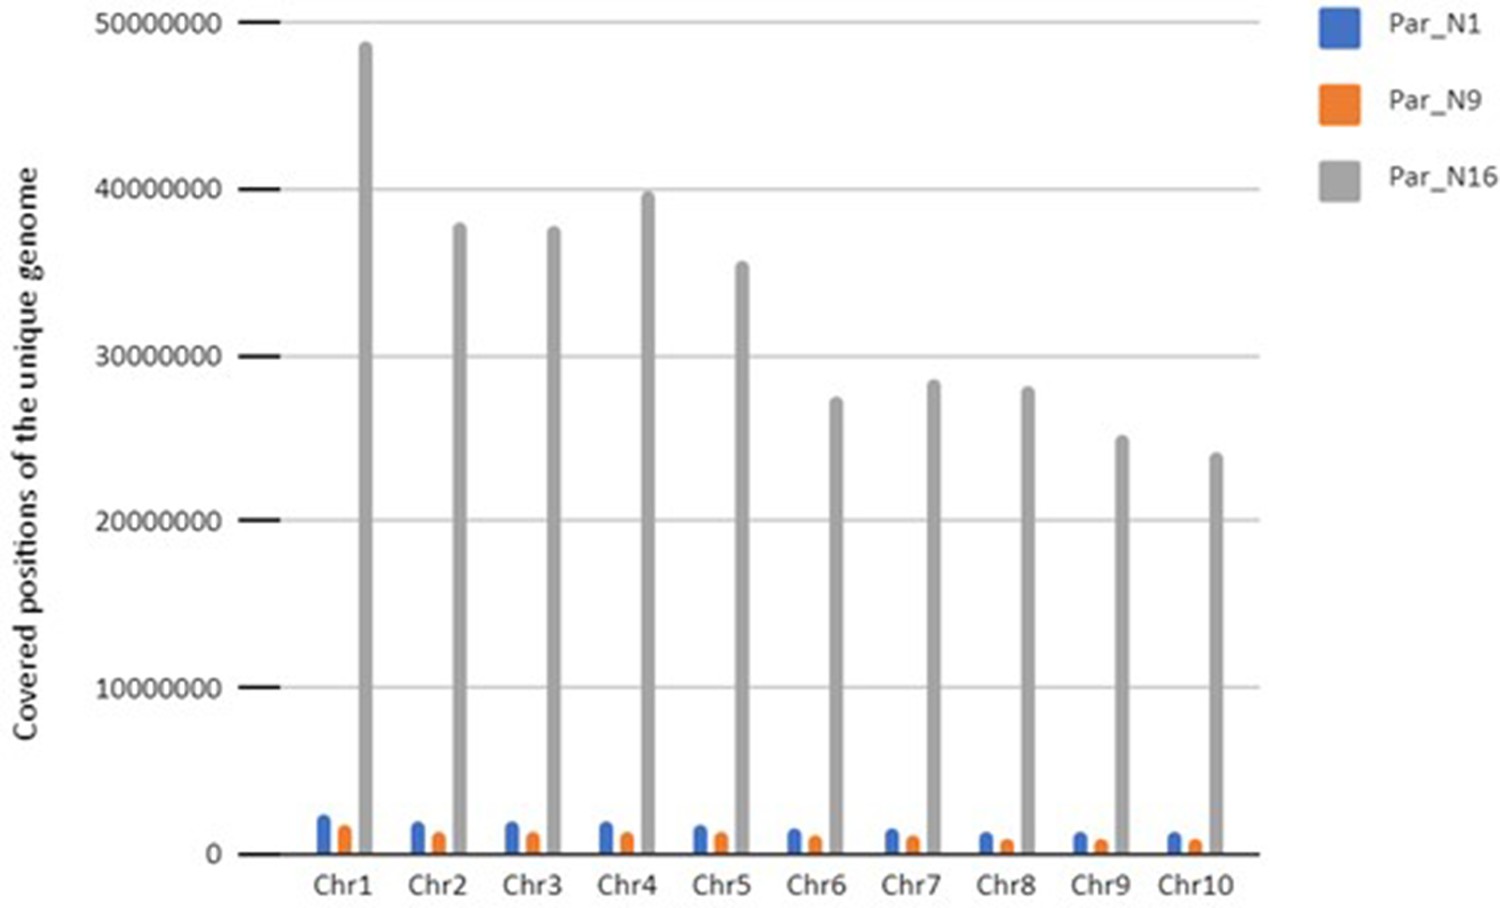
Total coverage of the unique genome for the three ancient samples.
Figure 2—figure supplement 3
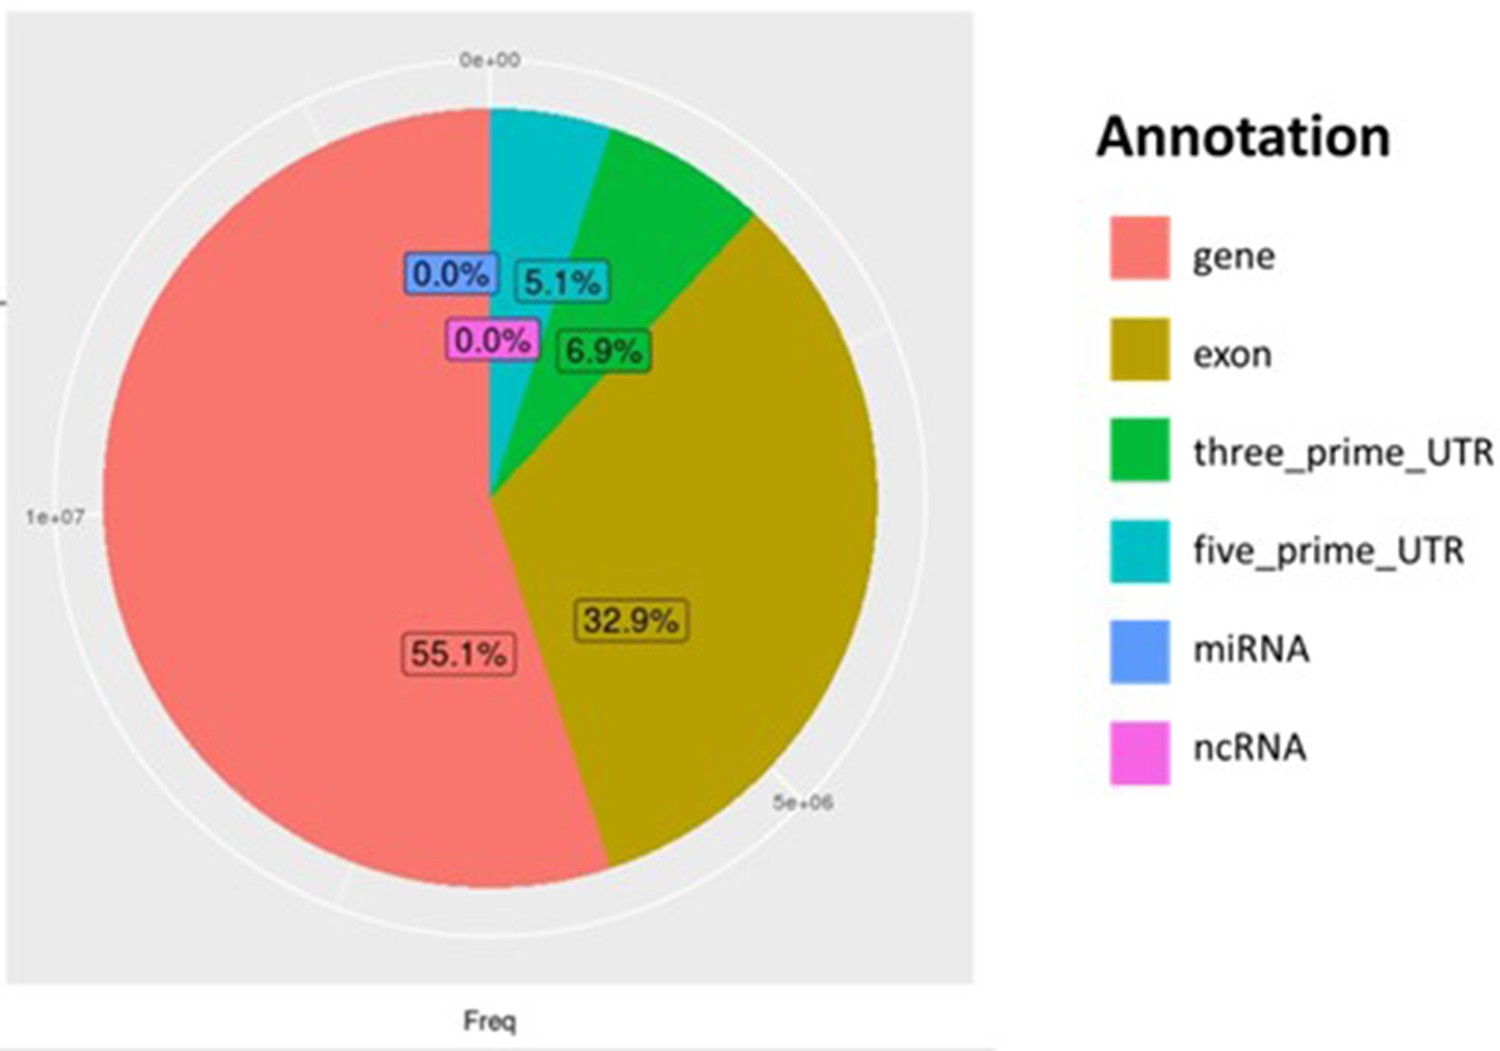
Distribution of all genomic regions covered by reads from Par_N16.
Percentages of covered sites in Par_N16 with Gramene annotation for genes in orange, exons in brown, 3’-UTR in green, and 5’-UTR in light blue; and miRBase annotation for miRNA in blue, and noncoding RNA in Magenta.
Figure 2—figure supplement 4
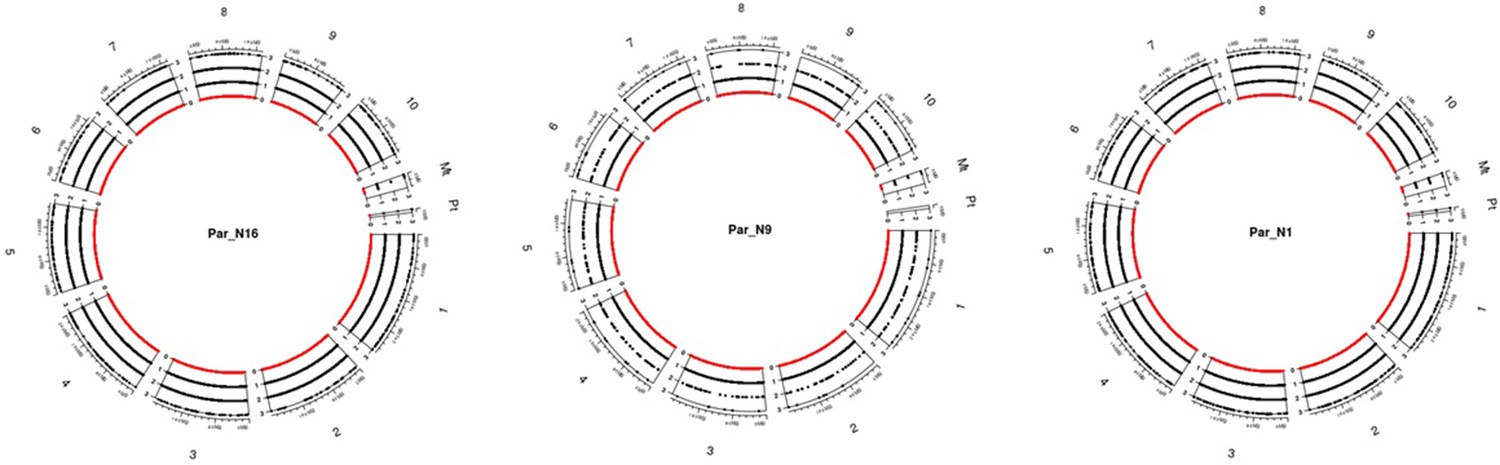
Genomic distribution of SNPs for the ancient samples.
The chart includes all ten chromosomes, as well as the chloroplast and mitochondria. Black dots dispersed across chromosomes represent the depth of each SNP scaled on the left of each chromosome, red dots represent sites without coverage.
Figure 2—figure supplement 5
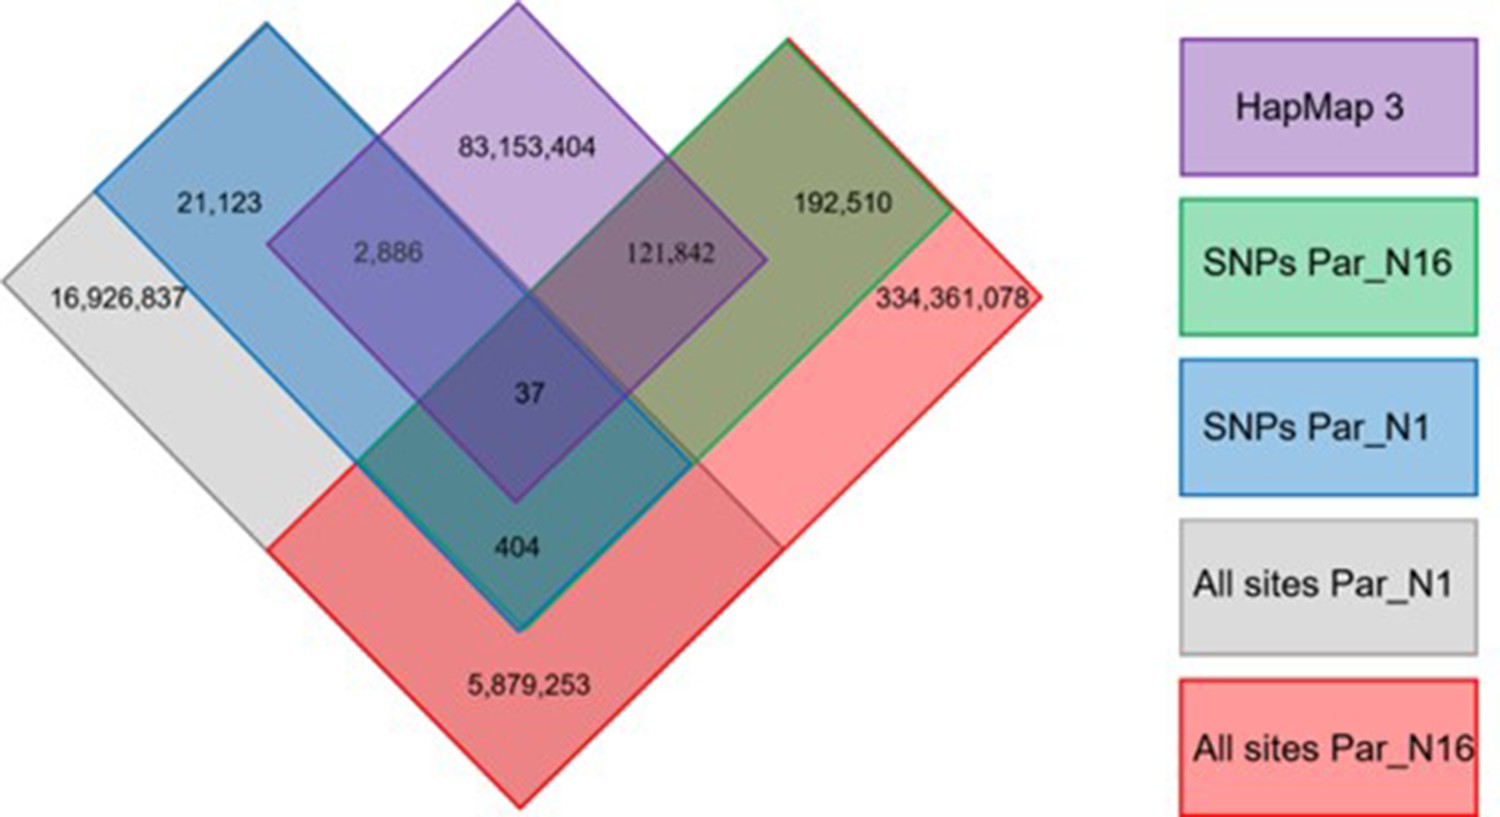
Distribution of genotype calls shared between Par_N16, Par_N1, and the HapMap3.
Figure 3 with 4 supplements
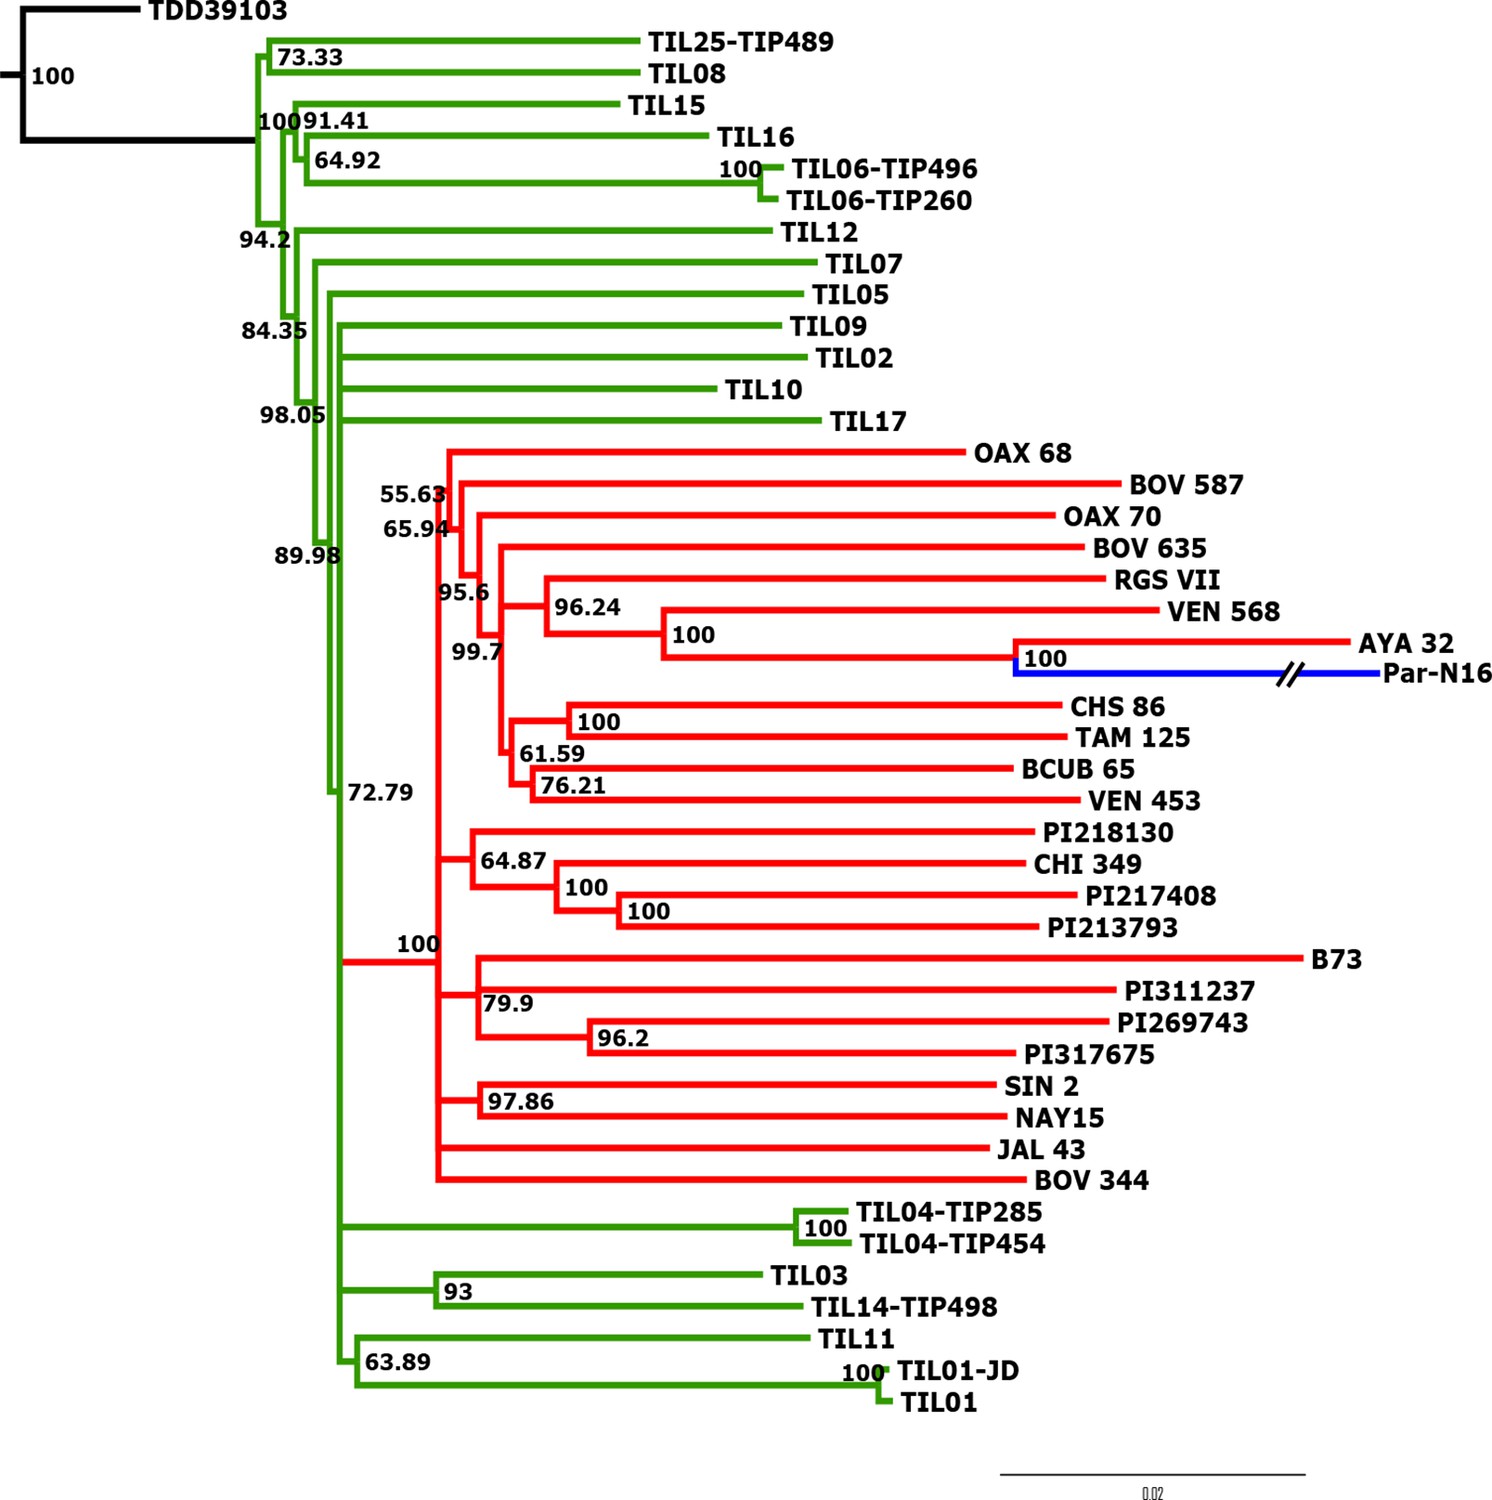
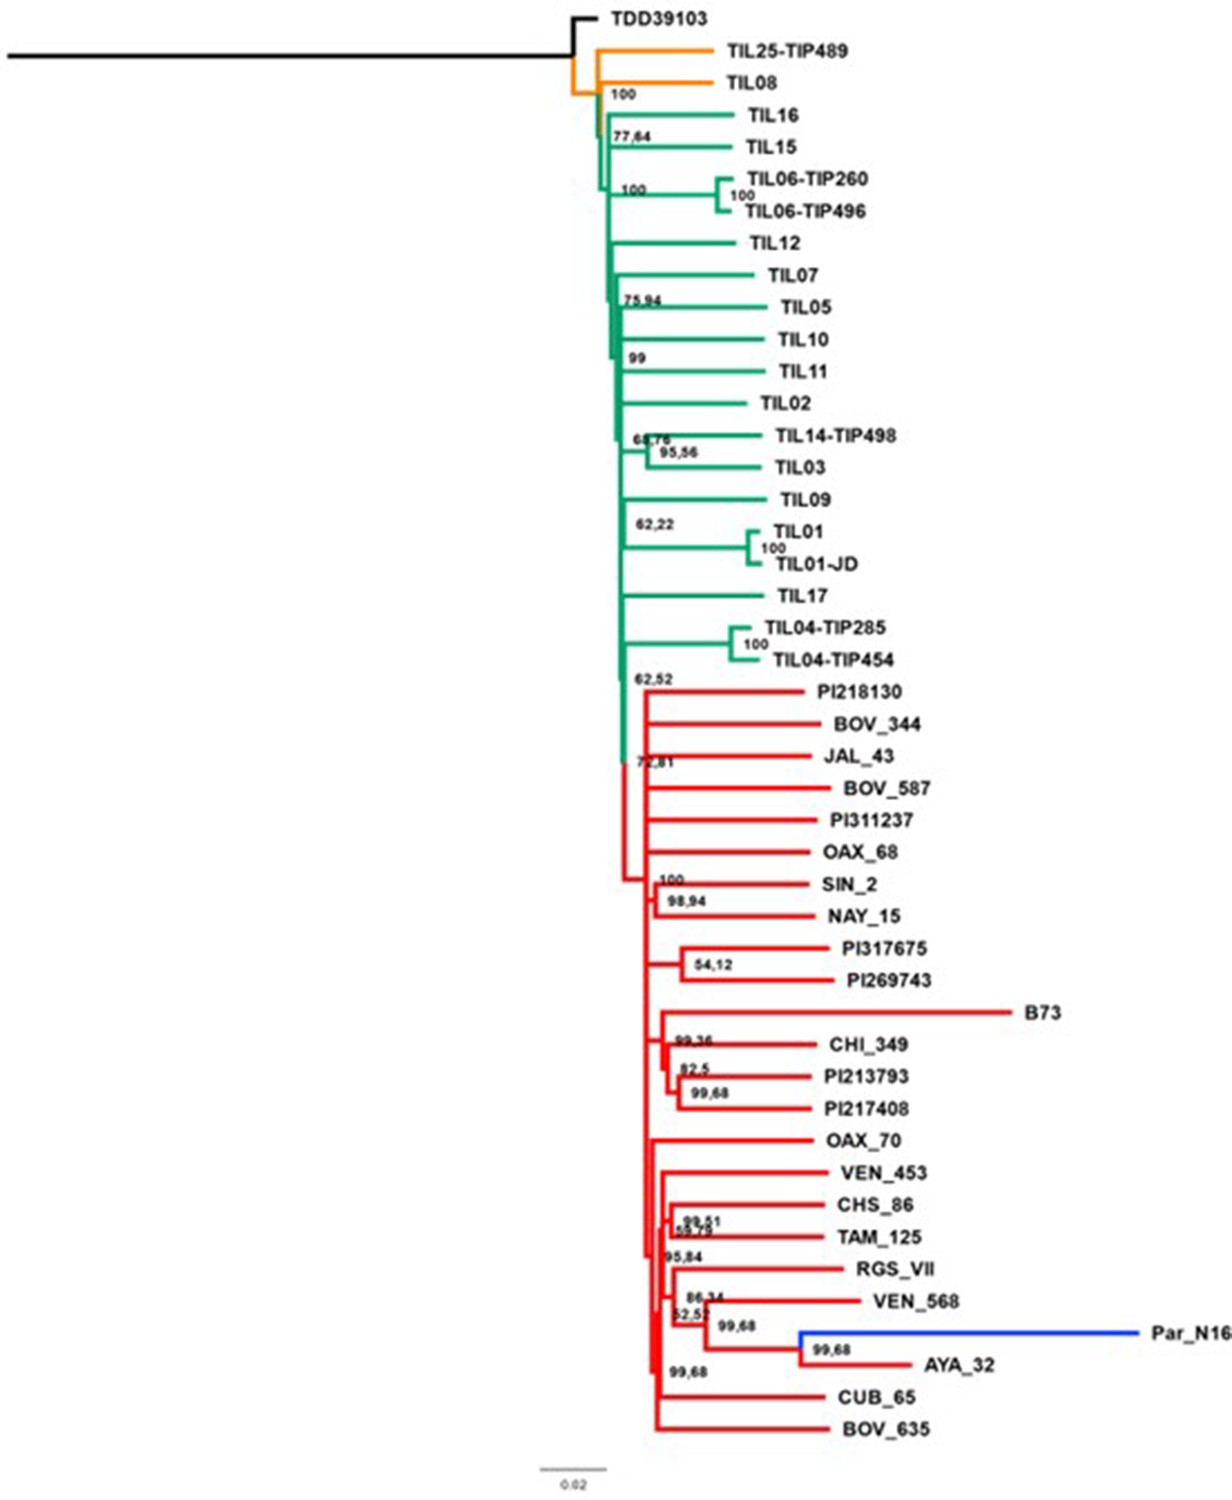
Advanced domestication of ancient Peruvian maize.
Evolutionary relationships between ancient Par_N16 maize and its wild and cultivated relatives. ML tree from an alignment of 121,842 genome-wide genotype calls covering non-repetitive regions of the reference maize genome. The teosinte group is highlighted in green, the maize landrace group in red, and the ancient maize sample from Paredones in blue. The teosinte and landrace accessions follow previously reported nomenclatures and are described in the Supplementary file 1. The Par_N16 branch was cut for format reasons; a tree with the complete branch can be seen in Figure 3—figure supplement 1.
Figure 3—figure supplement 1
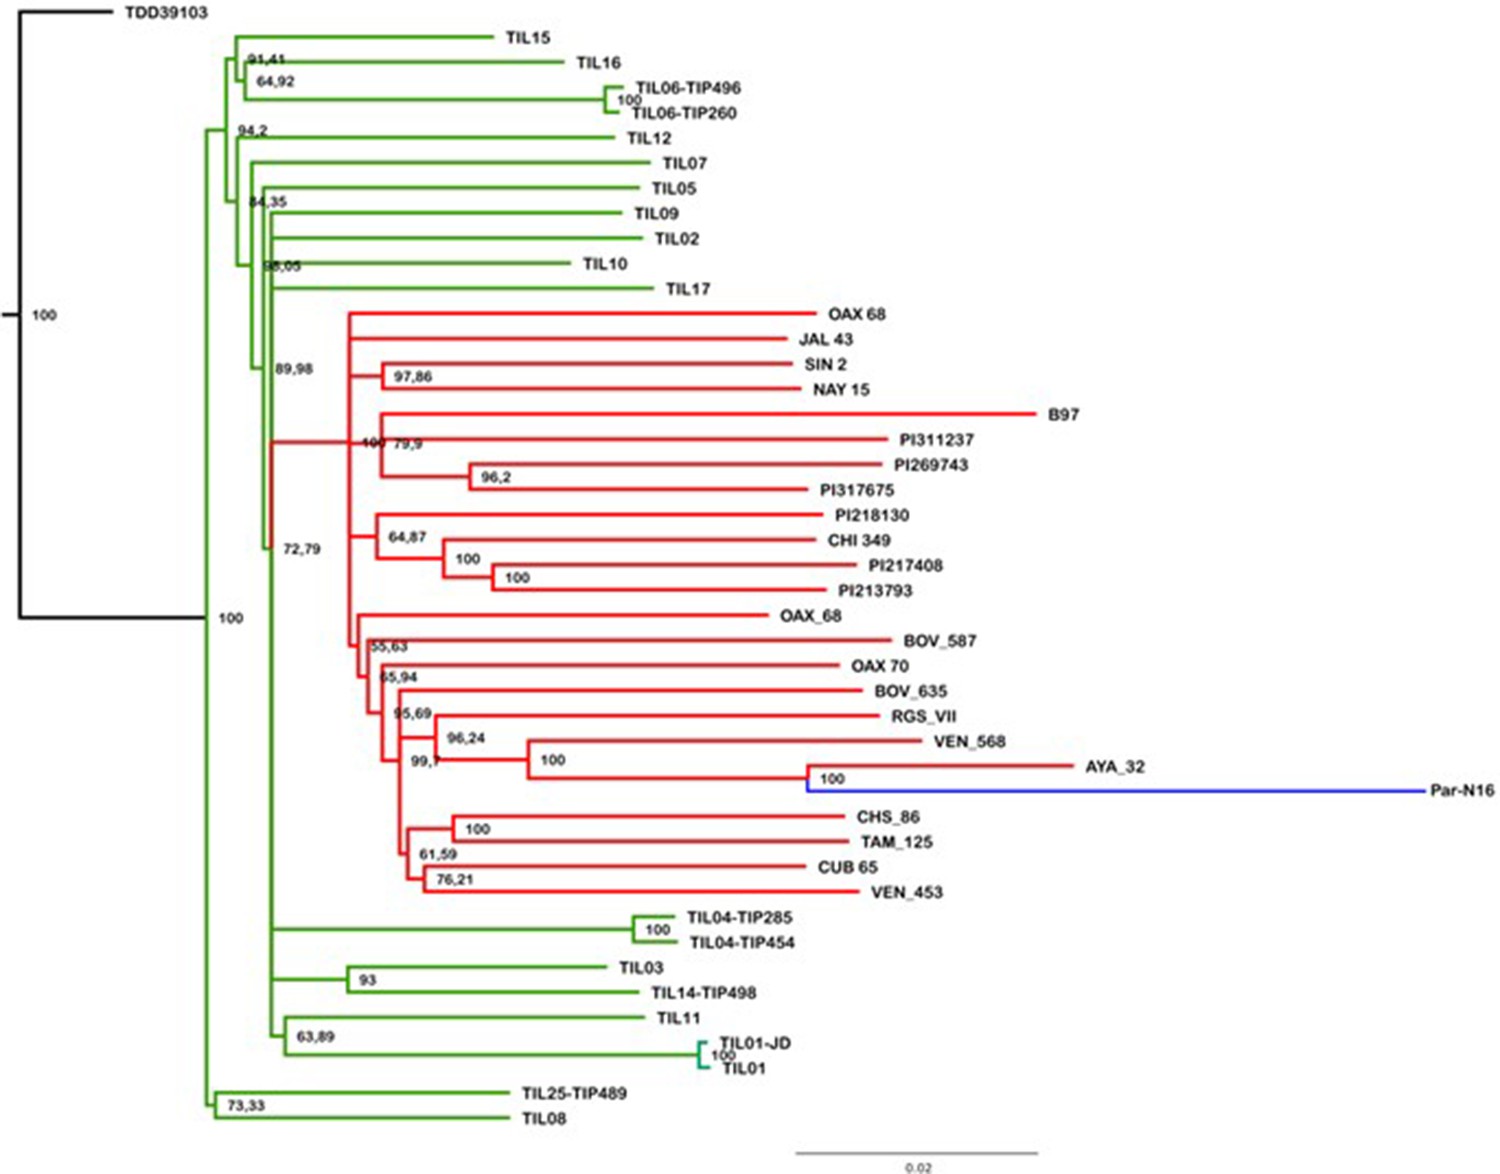
Evolutionary relationships between ancient Paredones maize Par_N16 and its wild or cultivated relatives.
Maximum likelihood tree from an alignment of 121,842 genome-wide genotype calls covering non-repetitive regions of the reference maize genome. The teosinte and landrace accessions follow the previously reported nomenclature (Bukowski et al., 2018) and are described in the Supplementary file 1.
Figure 3—figure supplement 2
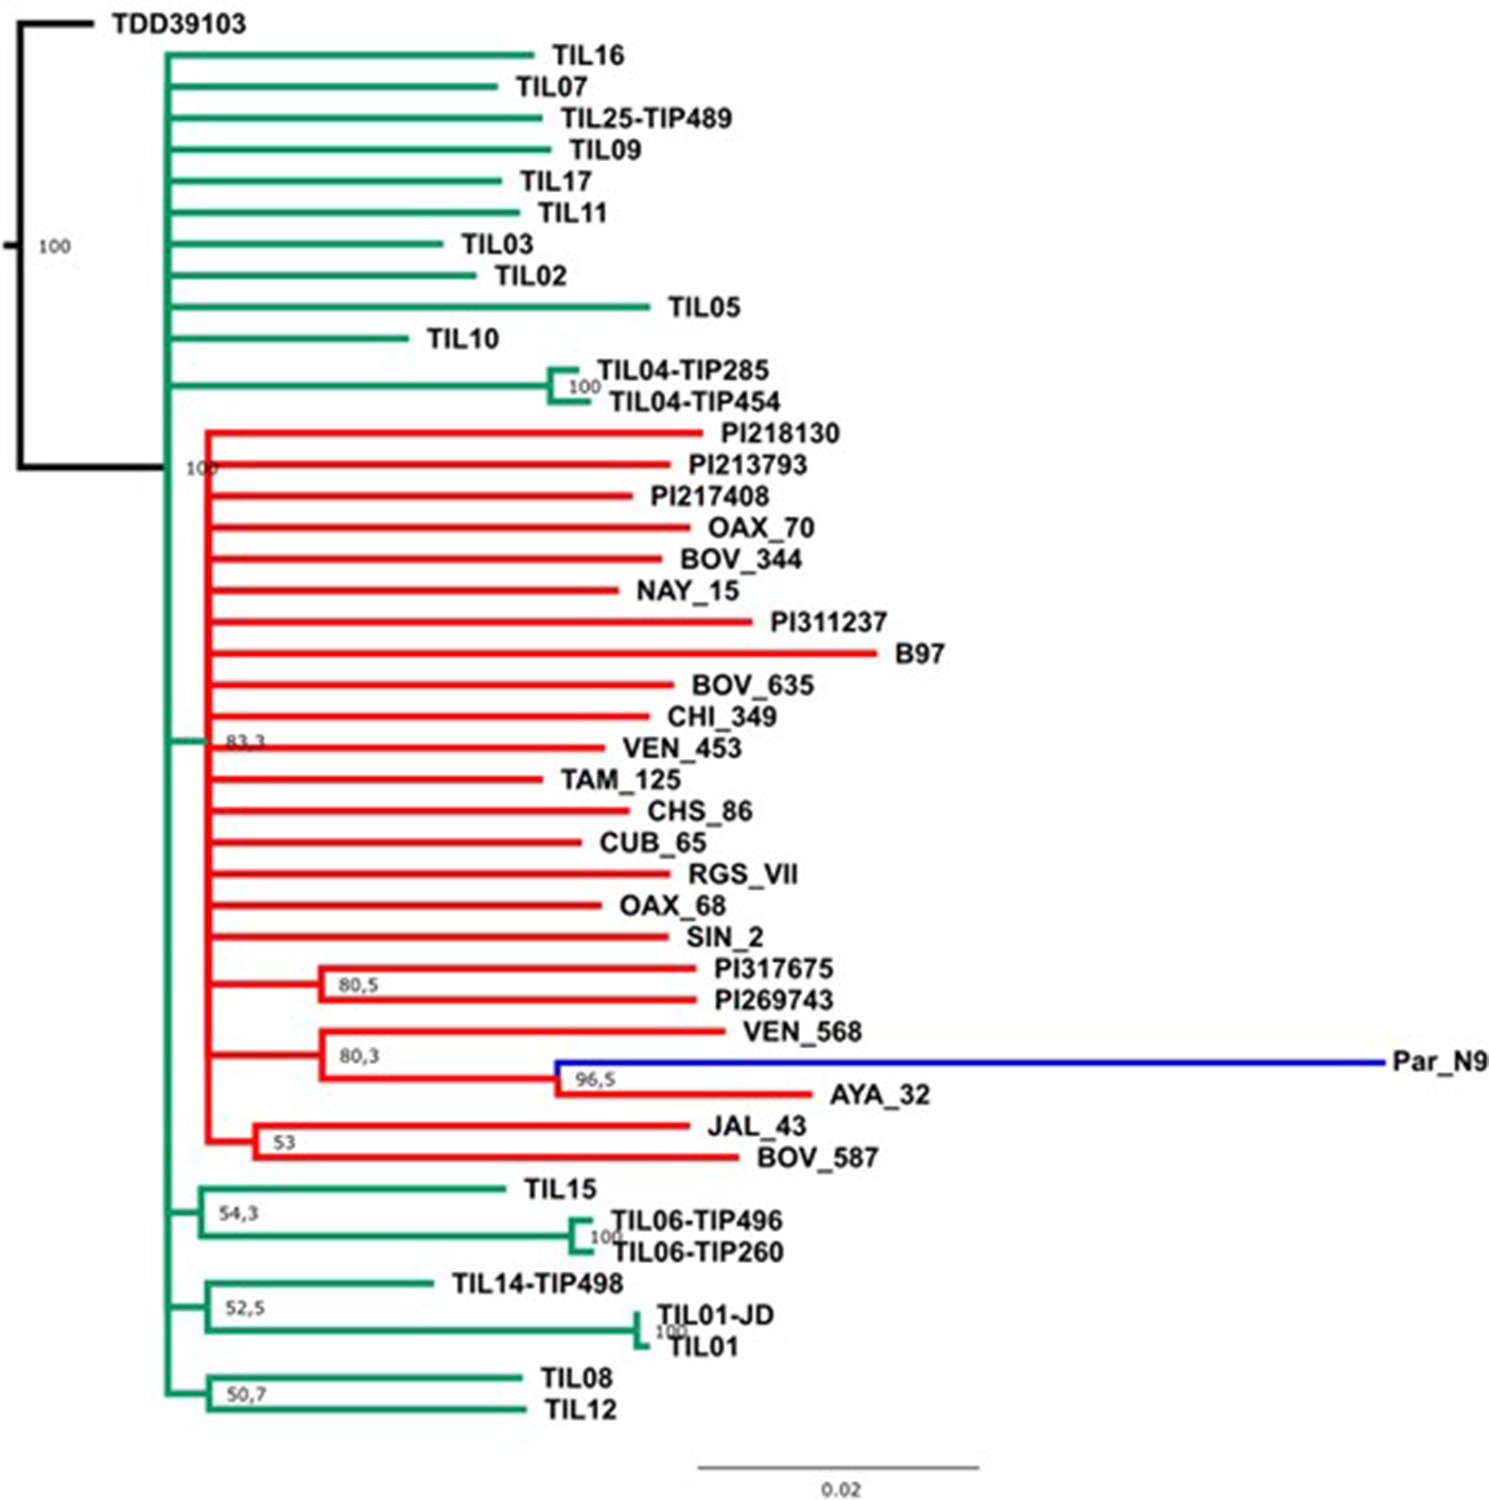
Evolutionary relationships between Paredones ancient maize Par_N9 and its wild or cultivated relatives.
Maximum likelihood reconstruction from an alignment of 1888 genome-wide genotype calls covering non-repetitive regions of the reference maize genome. The teosinte and landrace accessions follow the nomenclature reported in Bukowski et al., 2018 and are described in the Supplementary file 1.
Figure 3—figure supplement 3
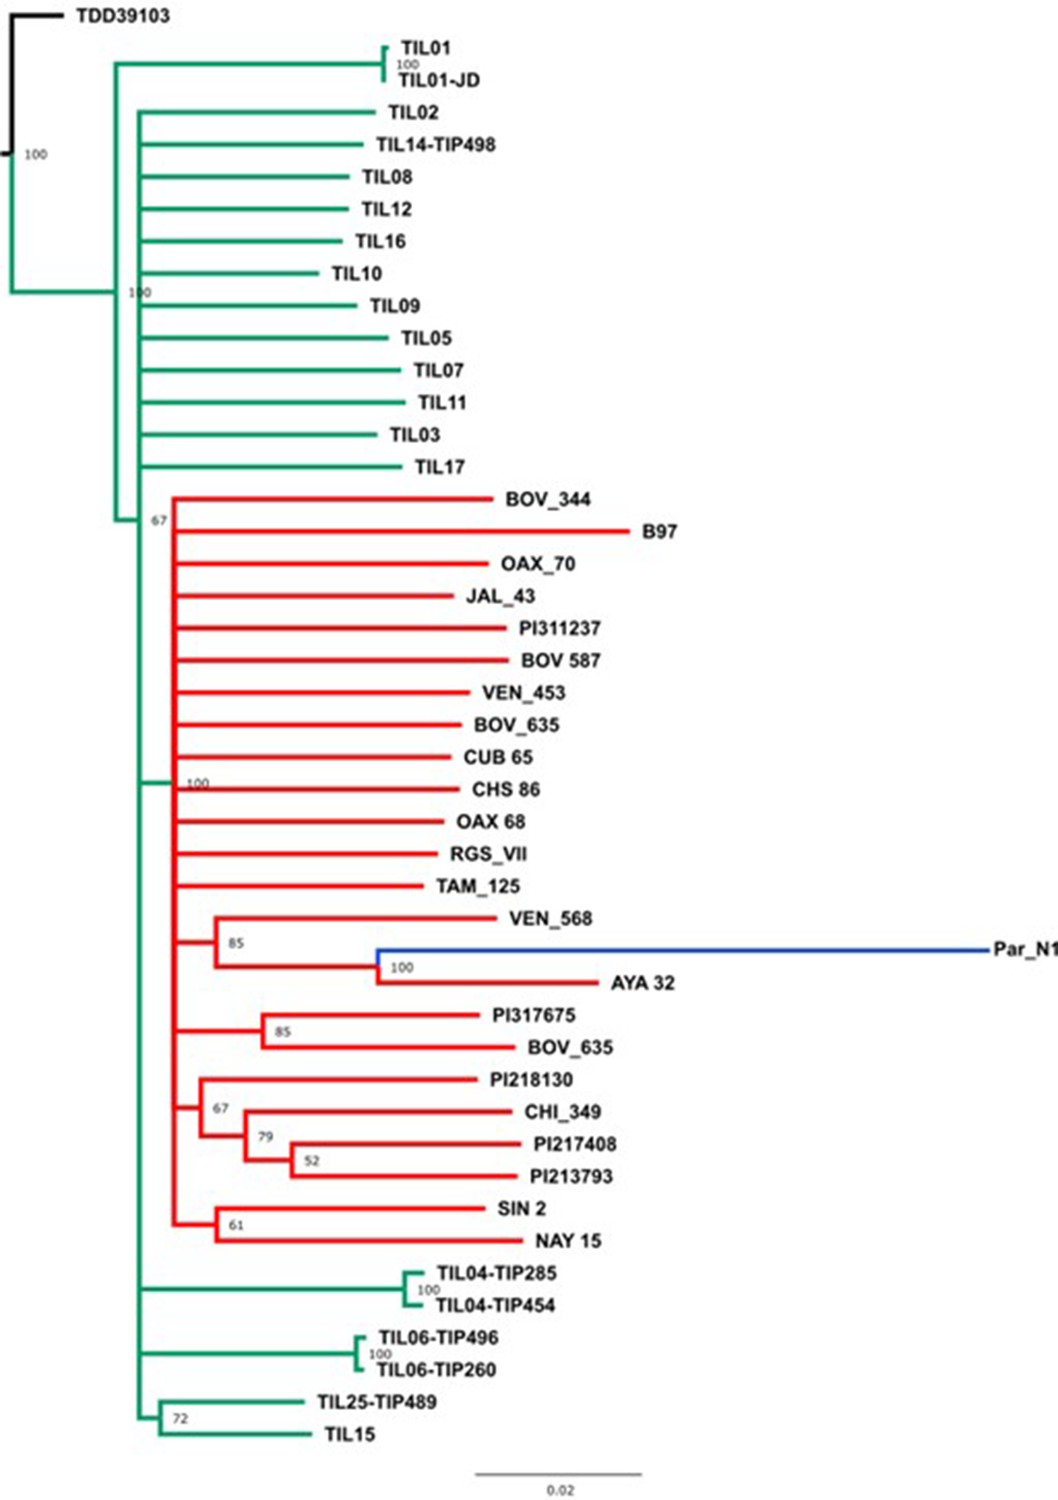
Evolutionary relationships between Par_N1 ancient maize and its wild or cultivated relatives.
Maximum likelihood reconstruction from an alignment of 2886 genome-wide genotype calls covering non-repetitive regions of the reference maize genome. The teosinte and landrace accessions follow the nomenclature reported in Bukowski et al., 2018 and are described in the Supplementary file 1.
Figure 3—figure supplement 4
Evolutionary relationships between ancient Paredones maize Par_N16 and its wild or cultivated relatives in which only transversions were used.
Maximum likelihood tree from an alignment of 64,118 genome-wide genotype calls covering non-repetitive regions of the reference maize genome. The teosinte and landrace accessions follow the previously reported nomenclature (Bukowski et al., 2018) and are described in the Supplementary file 1.
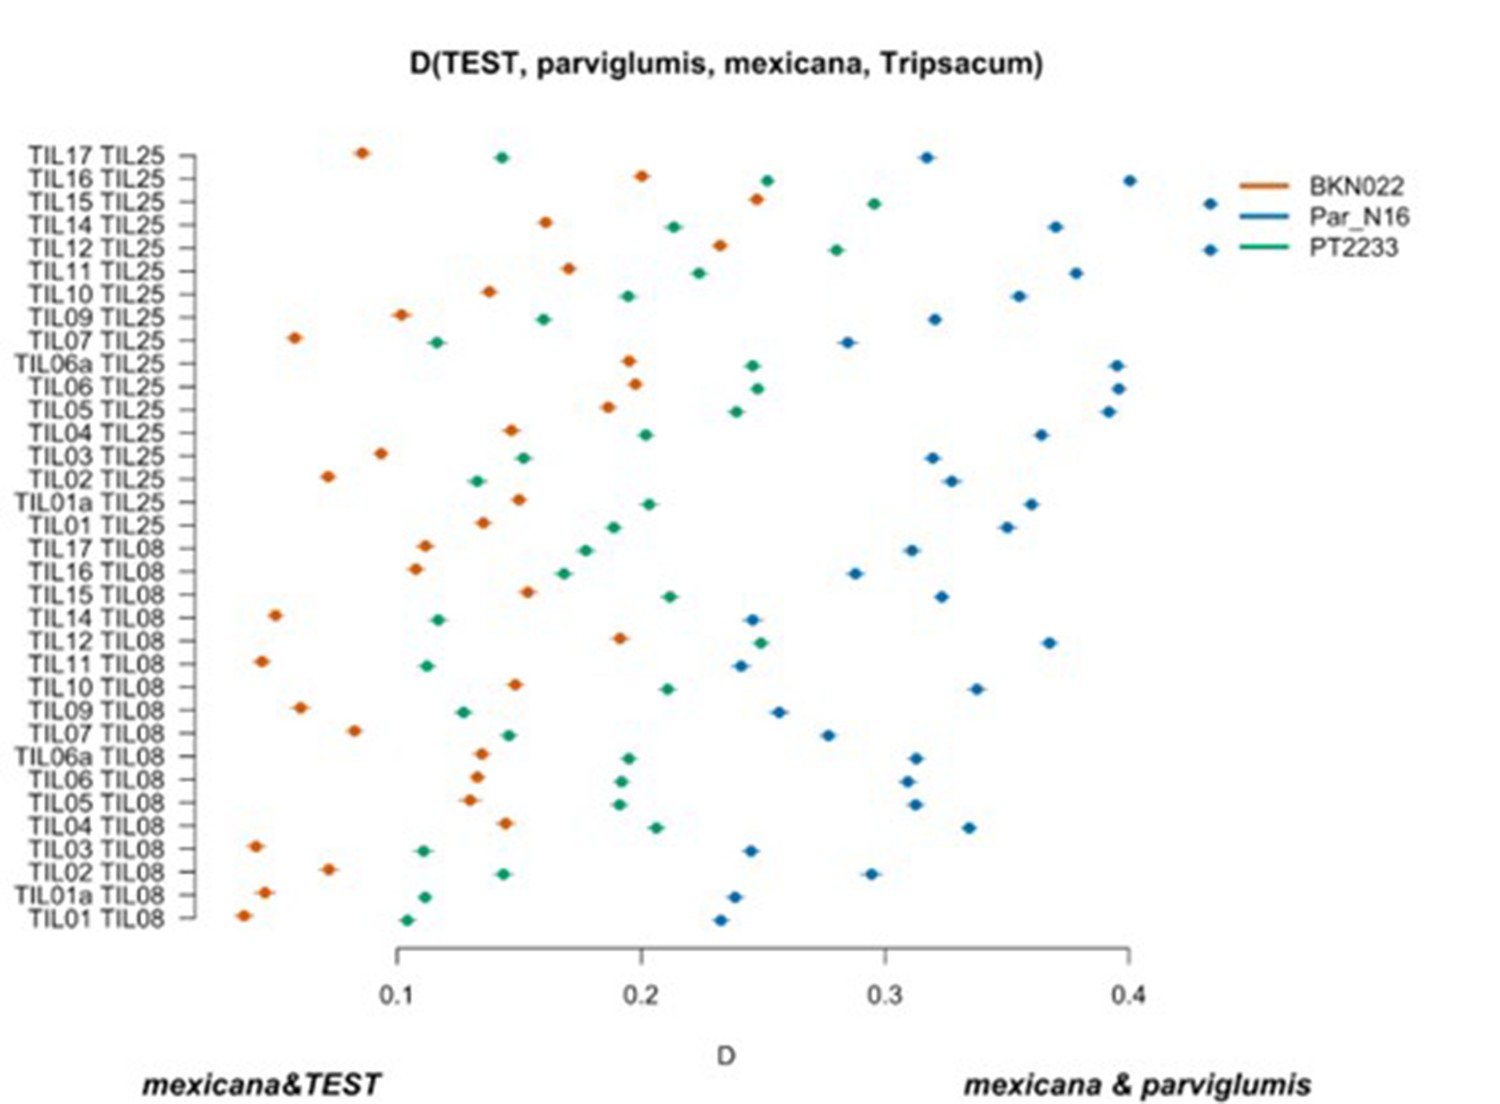
Figure 4 with 5 supplements
Characterization of mexicana gene flow with Par_N16 and Mesoamerican landraces.
D-statistics were calculated in the form D(TEST, parviglumis, mexicana, outgroup) (Figure 4—figure supplement 4) by comparing 121,842 variant sites shared between Par_N16, Palomero toluqueño (PT2233), or Reventador (BKN022), and the corresponding SNP variants from teosinte parviglumis (TIL01-TIL07, TIL09-17) and two teosinte mexicana accessions (TIL25, TIL08). The graph shows the total number of pairwise comparisons (n=34) yielding a negative D for mexicana introgression over a test sample or positive D for a higher introgression of mexicana and parviglumis (Figure 4—source data 1). Lines in each dot reflect the standard deviation calculated from 100 jackknife replicates.
-
Figure 4—source data 1
D-statistic values for each pairwise combination of (TEST, parviglumis, mexicana, outgroup).
- https://cdn.elifesciences.org/articles/83149/elife-83149-fig4-data1-v2.xlsx
Figure 4—figure supplement 1
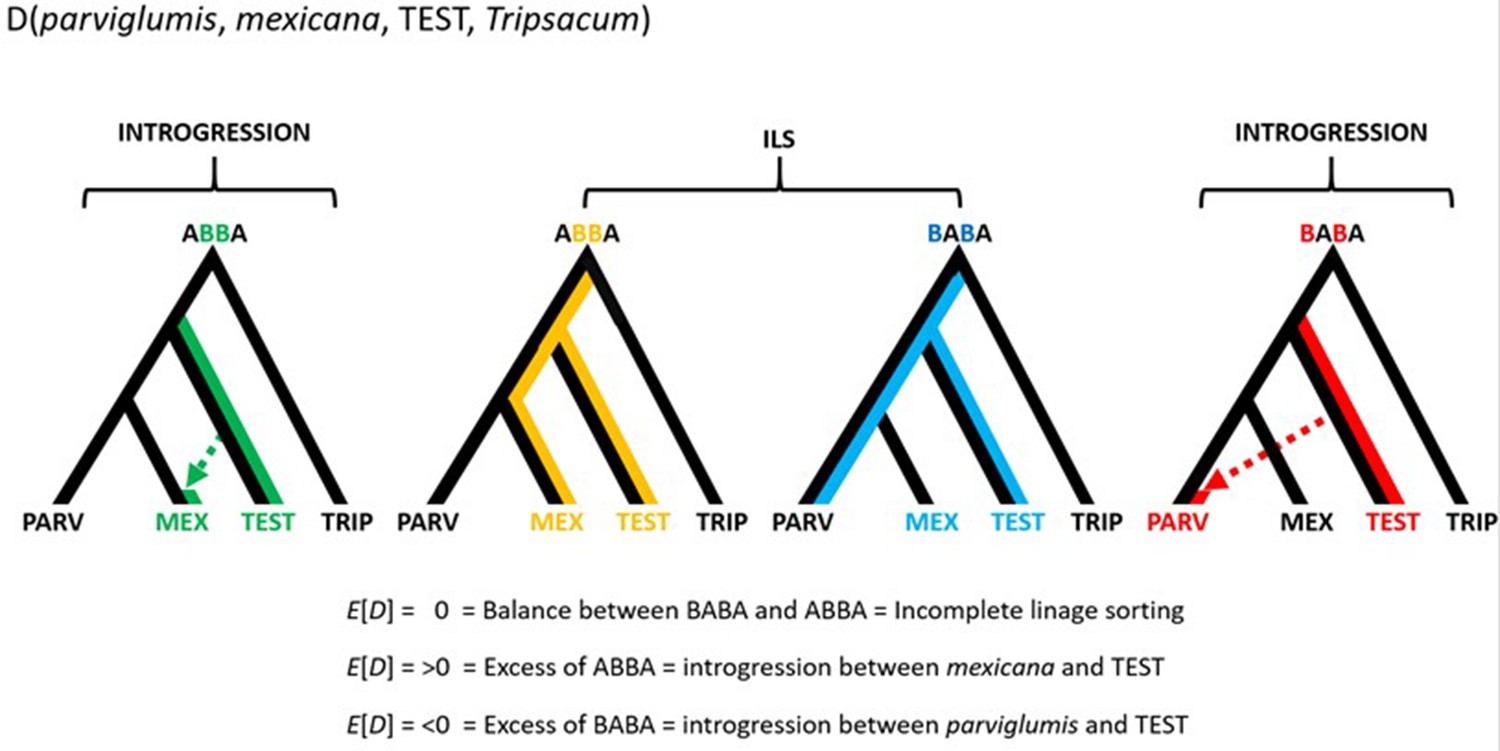
Conceptual representation of the hypothesis testing in the form D(parviglumis, mexicana, TEST, Tripsacum).
The approach makes use of three focal populations, parviglumis (PARV), mexicana (MEX), and TEST rooted over the outgroup Tripsacum (TRIP). Balance between ABBA and BABA sites reflects ILS and/or homogeneous gene flow between TEST and either PARV or MEX. Two other alternatives are: (1) an excess of ABBA resulting in D>0 suggesting introgression between TEST and MEX; (2) an excess of BABA resulting in D<0 suggesting introgression between TEST and PARV.
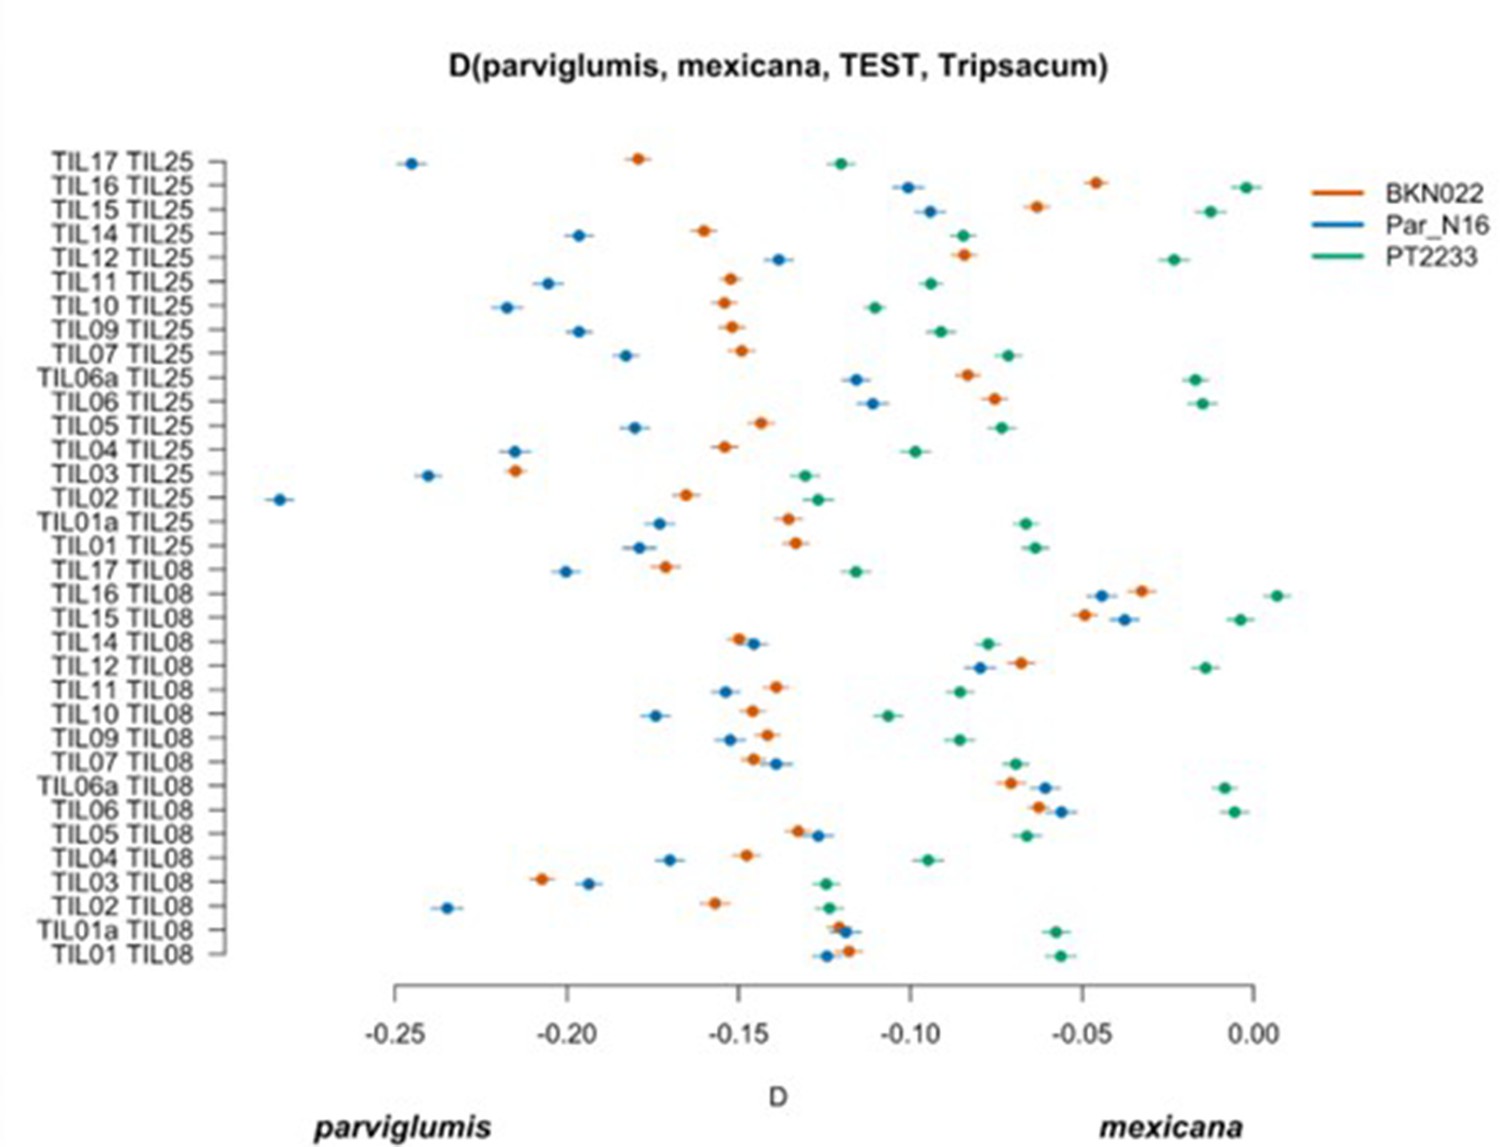
Figure 4—figure supplement 2
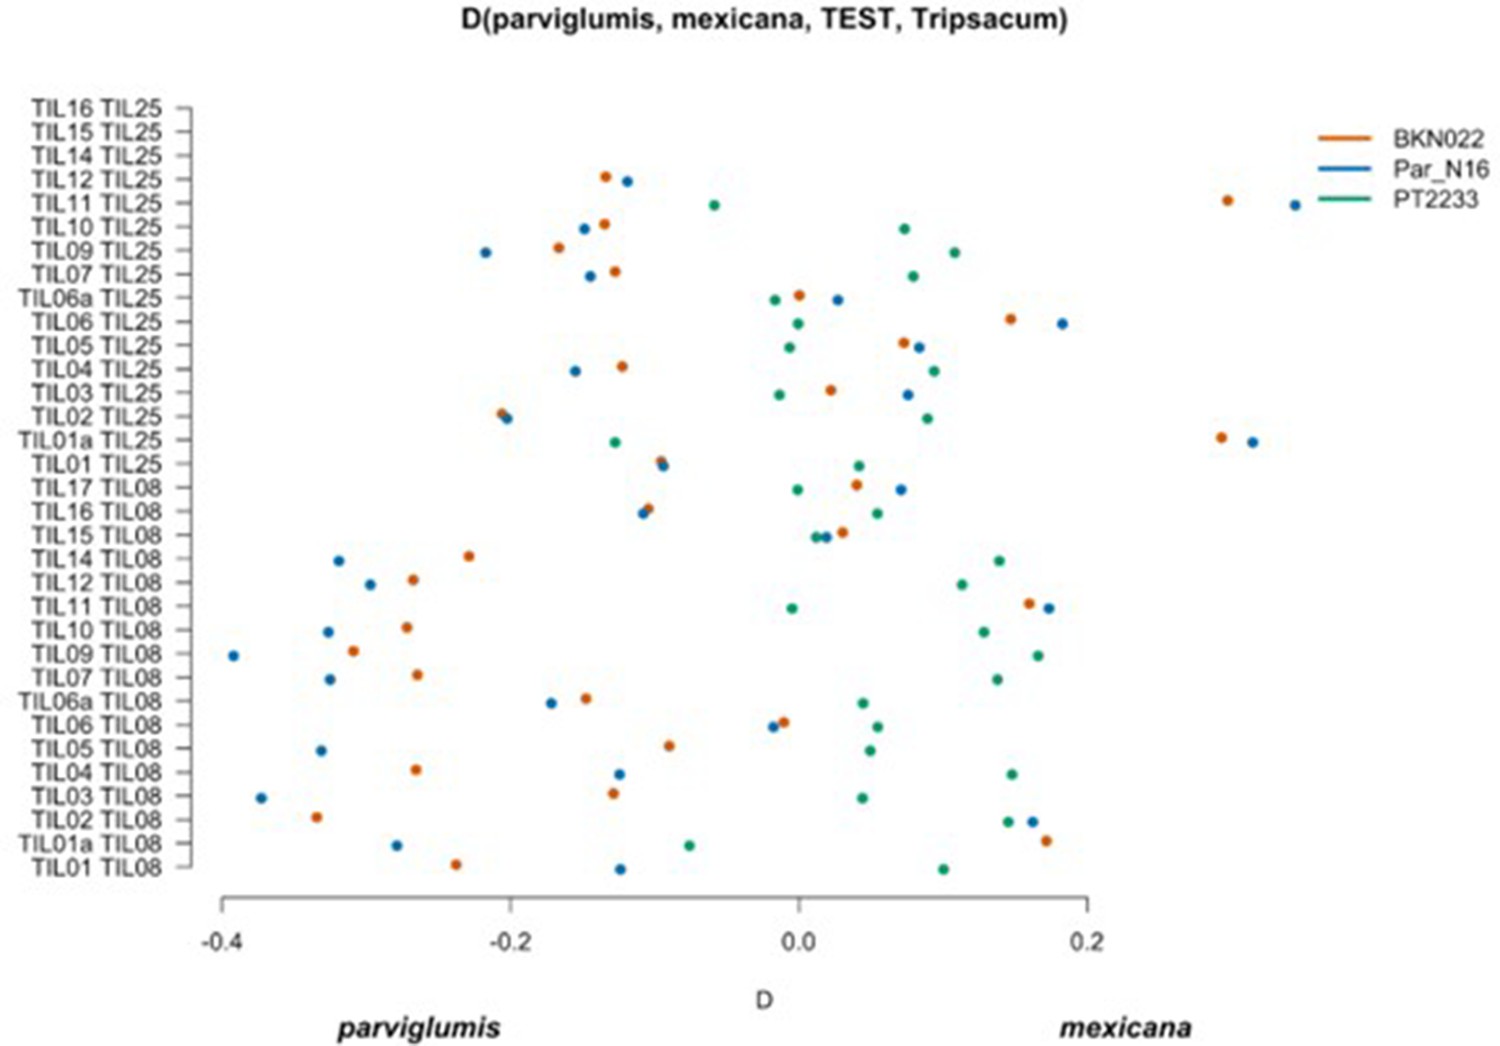
Scatterplot of pairwise mexicana and parviglumis computations of Par_N16, BKN022, and PT2233 D-statistics in the form D(parviglumis, mexicana, TEST, outgroup).
Genetic comparison of Par_N16 to teosinte parviglumis and mexicana accessions. D-statistics were calculated in the form D (parviglumis, mexicana, TEST, outgroup) (Figure 4—figure supplement 1) by comparing 64,118 variant sites shared between Par_N16, Palomero toluqueño (PT2233), or Reventador (BKN022), and the corresponding SNP variants from teosinte parviglumis (TIL01-TIL07, TIL09-17) and two teosinte mexicana (TIL25, TIL08) accessions. The graph shows the total number of pairwise comparisons (n=34) yielding a negative (parviglumis) or positive (mexicana) introgression (Figure 4—figure supplement 2—source data 1). Lines in each dot reflect standard deviation calculated from 100 jackknife replicates.
-
Figure 4—figure supplement 2—source data 1
D-statistic values for each pairwise combination of (parviglumis, mexicana, TEST, outgroup).
- https://cdn.elifesciences.org/articles/83149/elife-83149-fig4-figsupp2-data1-v2.xlsx
Figure 4—figure supplement 3
Scatterplot of pairwise mexicana and parviglumis computations of Par_N16, BKN022, and PT2233 D-statistics in the form D(parviglumis, mexicana, TEST, outgroup) in which only transversions are included.
Genetic comparison of Par_N16 to teosinte parviglumis and mexicana accessions. D-statistics were calculated in the form D(parviglumis, mexicana, TEST, outgroup) (Figure 4—figure supplement 1) by comparing 64,118 variant sites shared between Par_N16, Palomero toluqueño (PT2233), or Reventador (NAY15), and the corresponding SNP variants from teosinte parviglumis (TIL01-TIL07, TIL09-17) and two teosinte mexicana (TIL25, TIL08) accessions. The graph shows the total number of pairwise comparisons (n=34) yielding a negative (parviglumis) or positive (mexicana) introgression (Figure 4—figure supplement 3—source data 1). Lines in each dot reflect standard deviation calculated from 100 jackknife replicates.
-
Figure 4—figure supplement 3—source data 1
D-statistic values for each pairwise combination of (parviglumis, mexicana, TEST, outgroup) including only transversions.
- https://cdn.elifesciences.org/articles/83149/elife-83149-fig4-figsupp3-data1-v2.xlsx
Figure 4—figure supplement 4
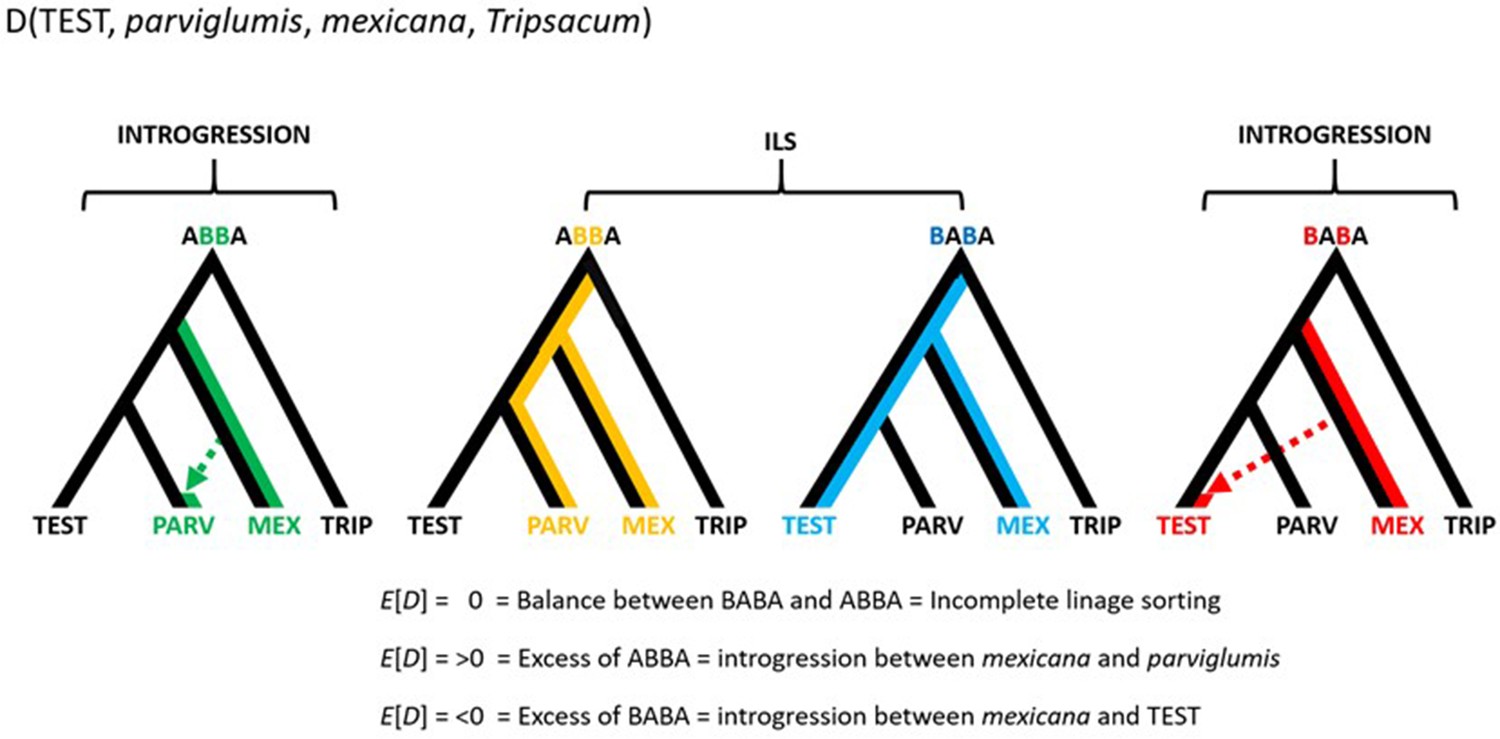
Conceptual representation of the hypothesis testing in the form D(TEST, parviglumis, mexicana, Tripsacum).
The approach makes use of three focal populations; the one being tested (TEST), parviglumis (PARV) and mexicana (MEX), rooted over the outgroup Tripsacum (TRIP). An excess of ABBA sites results in D>0 which suggests that gene flow between mexicana and parviglumis is higher than the gene flow between mexicana and TEST. Meanwhile an excess of BABA sites results in D<0 which suggests that gene flow between mexicana and parviglumis is lower than the gene flow between mexicana and TEST. D=0, given by the same ratio of ABBA and BABA sites reflects ILS and/or the balanced gene flow between the pairs (1) mexicana and parviglumis and (2) mexicana and TEST.
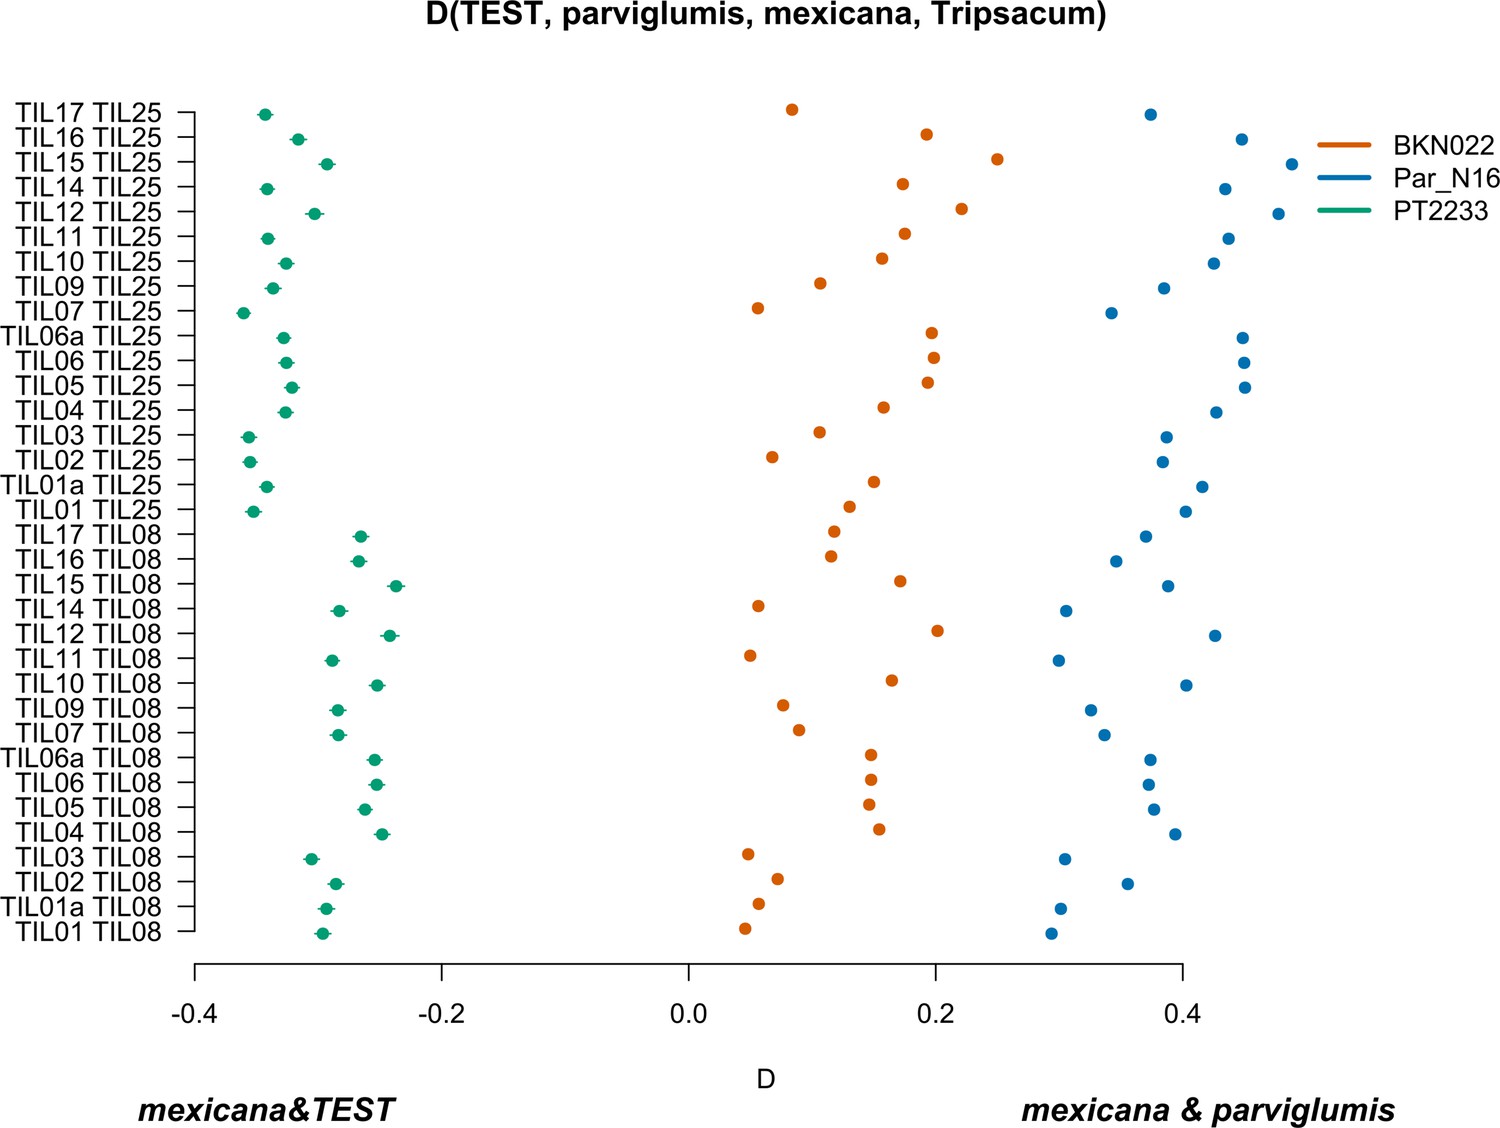
Figure 4—figure supplement 5
Scatterplot of pairwise mexicana and parviglumis computations of Par_N16, BKN022, and PT2233 D-statistics in the form D(TEST, parviglumis, mexicana, outgroup) in which only transversions are included.
Genetic comparison of Par_N16 to teosinte parviglumis and mexicana accessions. D-statistics were calculated in the form D(TEST, parviglumis, mexicana, outgroup) (Figure 4—figure supplement 4) by comparing 64,118 variant sites shared between Par_N16, Palomero toluqueño (PT2233), or Reventador (BKN022), and the corresponding SNP variants from teosinte parviglumis (TIL01-TIL07, TIL09-17) and two teosinte mexicana (TIL25, TIL08) accessions. The graph shows the total number of pairwise comparisons (n=34) yielding a negative (mexicana and test) or positive (mexicana and parviglumis) introgression (Figure 4—figure supplement 5—source data 1). Lines in each dot reflect standard deviation calculated from 100 jackknife replicates.
-
Figure 4—figure supplement 5—source data 1
D-statistic values for each pairwise combination of (TEST, parviglumis, mexicana, outgroup) including only transversions.
- https://cdn.elifesciences.org/articles/83149/elife-83149-fig4-figsupp5-data1-v2.xlsx
Figure 5 with 2 supplements
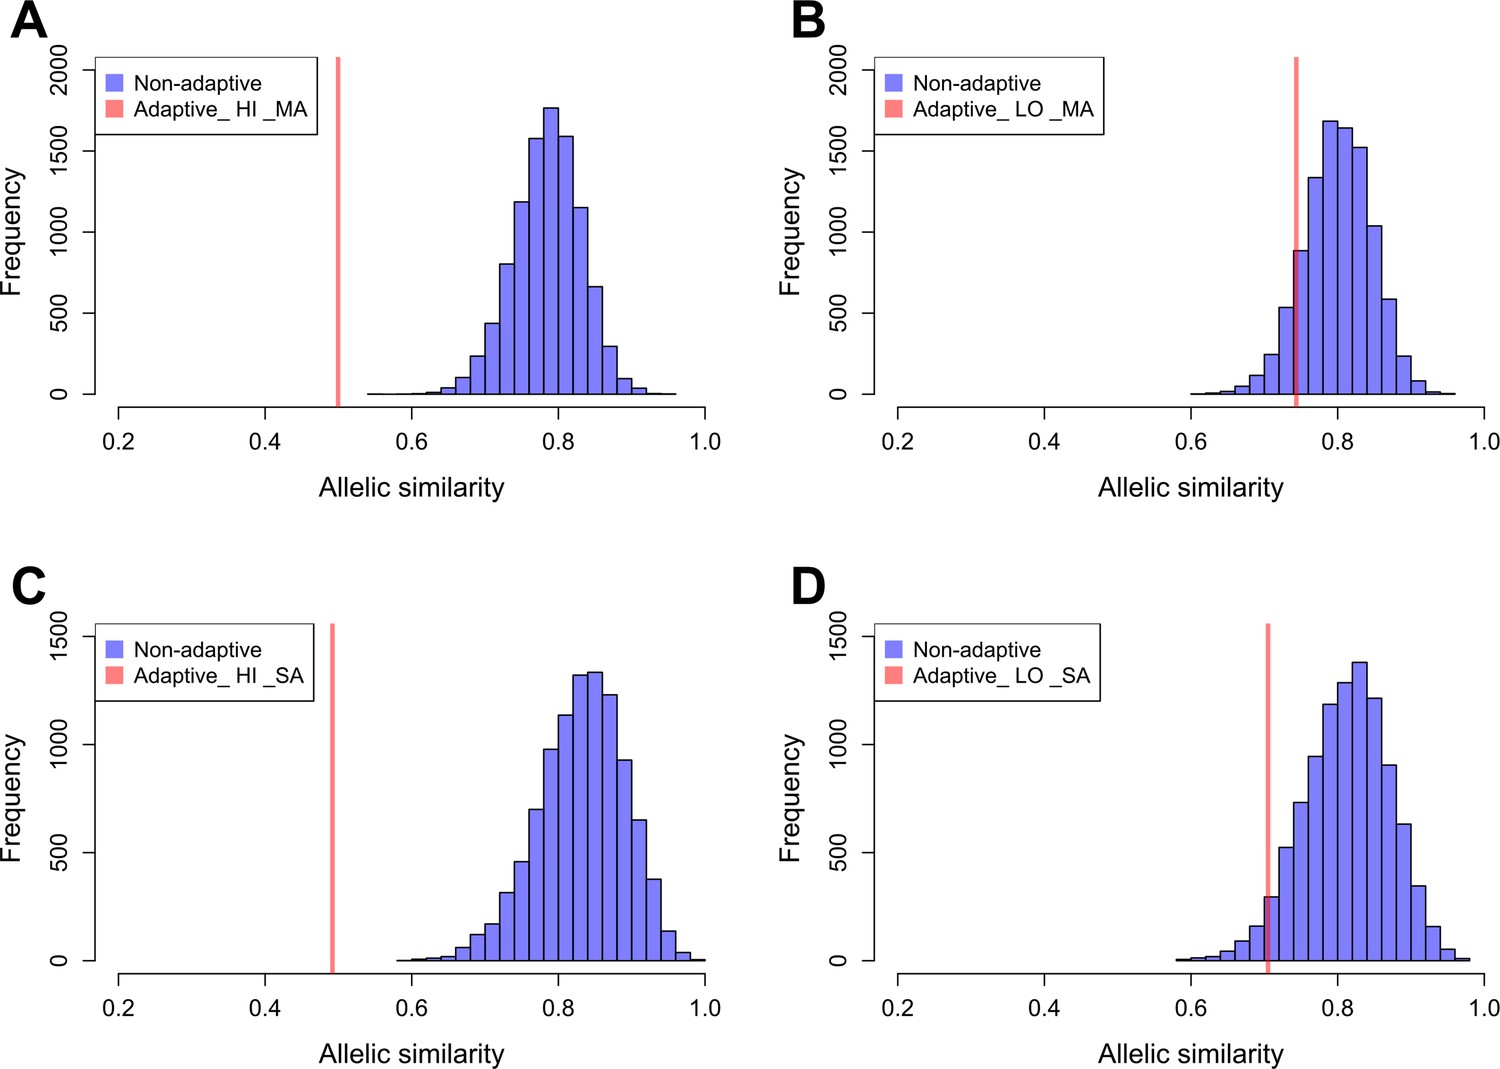
Allelic similarities between Par_N16 and landraces from Mesoamerica (MA) and South America (SA).
Comparisons involved genome-wide non-adaptive SNPs (blue distributions) and SNPs with significant FST implicated as adaptive (red lines) at intersected sites between Par_N16 and the reference dataset (Takuno et al., 2015). HI, highlands; LO, lowlands; MA, Mesoamerica; SA, South America. In the Y axis is the count of the random samples showing a given allelic similarity; in the X axis is the allelic similarity between Par_N16 and the test population in the intersected sites. (A), the mean genome-wide allelic similarity between Par_N16 and highland MA landraces in non-adaptive SNPs is 0.785; the corresponding allelic similarity in adaptive SNPs is 0.4995. (B), the mean genome-wide allelic similarity between Par_N16 and lowland MA landraces in non-adaptive SNPs is 0.8; the corresponding allelic similarity in adaptive SNPs is 0.7436. (C), the mean genome-wide allelic similarity between Par_N16 and highland SA landraces in non-adaptive SNPs is 0.831; the corresponding allelic similarity in adaptive SNPs is 0.4918. (D), the mean genome-wide allelic similarity between Par_N16 and lowland SA landraces in non-adaptive SNPs is 0.812; the corresponding allelic similarity in adaptive SNPs is 0.705 (Figure 5—source data 1).
-
Figure 5—source data 1
Source data for Figure 5A–D.
Figure 5A: Allelic similarity between Par_N16 and SNPs with significant FST implicated as adaptive to Mesoamerican highland landraces. Adaptive, from a list of 668 adaptive SNPs; Non-adaptive, from random lists of 32 non-adaptive SNPs. Figure 5B: Allelic similarity between Par_N16 and SNPs with significant FST implicated as adaptive to Mesoamerican lowland landraces. Adaptive, from a list of 668 adaptive SNPs; Non-adaptive, from random lists of 32 non-adaptive SNPs. Figure 5C: Allelic similarity between Par_N16 and SNPs with significant FST implicated as adaptive to South American highland landraces. Adaptive, from a list of 390 adaptive SNPs; Non-adaptive, from random lists of 20 non-adaptive SNPs. Figure 5D: Allelic similarity between Par_N16 and SNPs with significant FST implicated as adaptive to South American lowland landraces. Adaptive, from a list of 390 adaptive SNPs; Non-adaptive, from random lists of 20 non-adaptive SNPs.
- https://cdn.elifesciences.org/articles/83149/elife-83149-fig5-data1-v2.xlsx
Figure 5—figure supplement 1
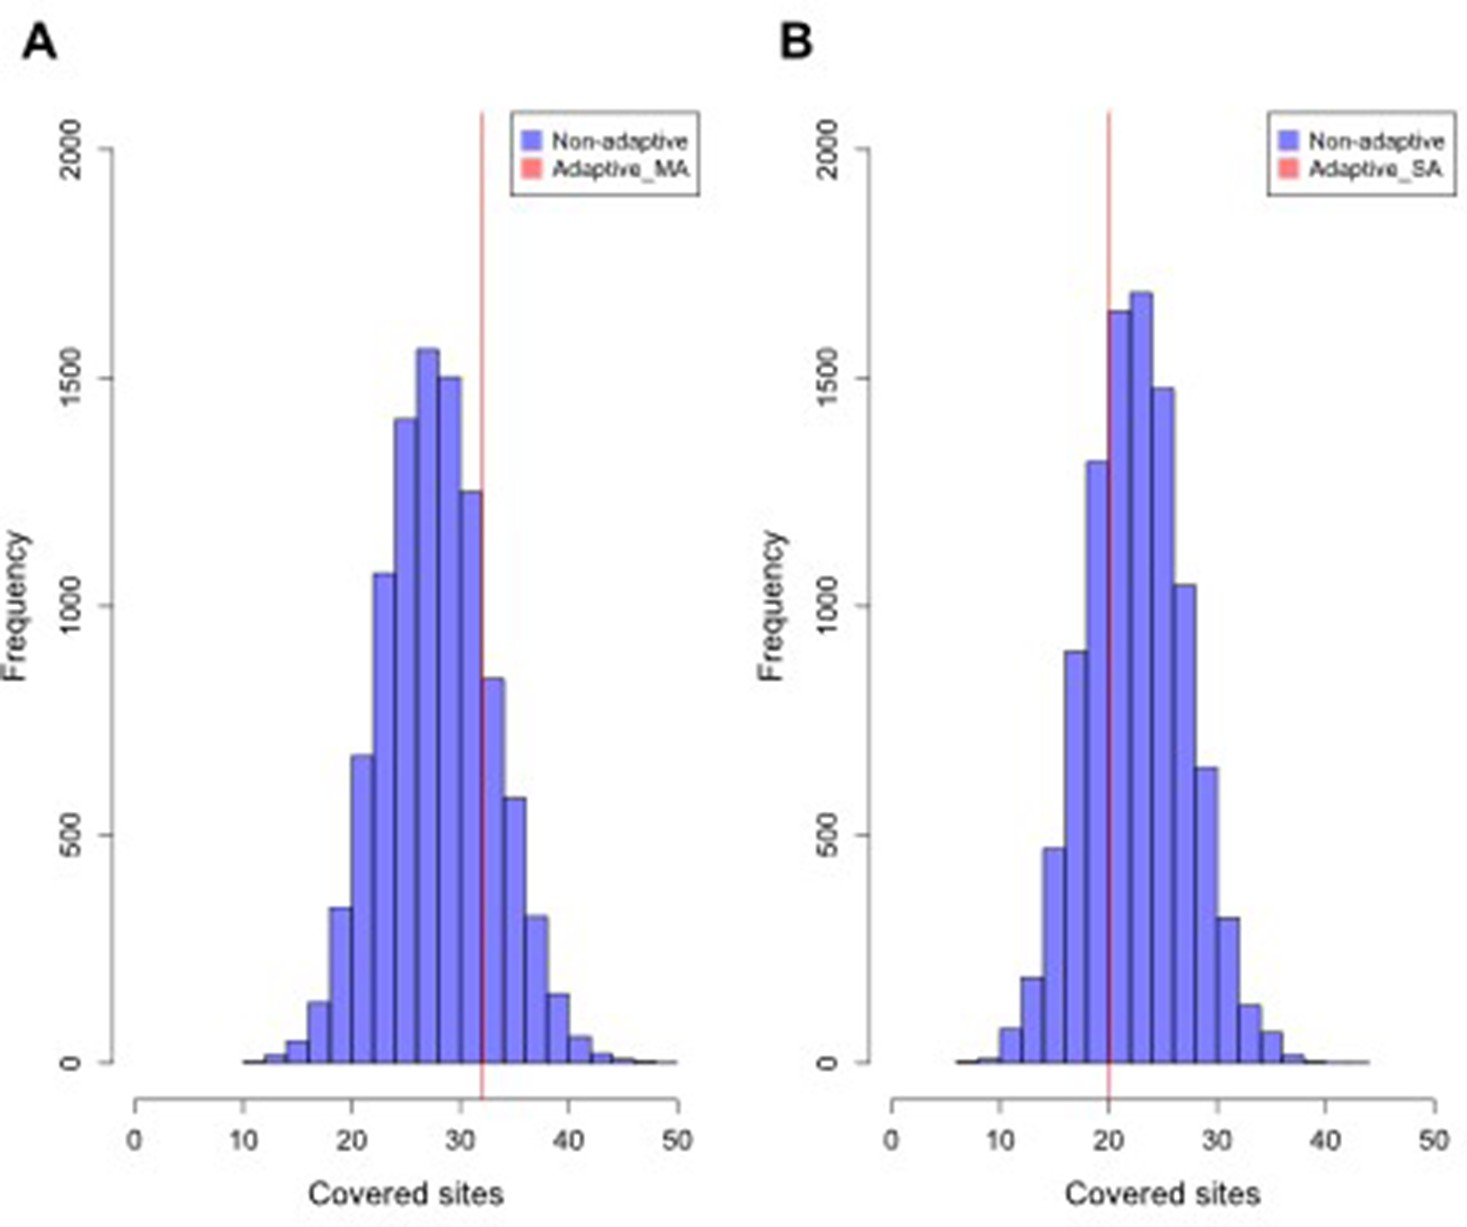
Distribution of intersected SNPs between Par_N16 and landraces from Mesoamerica (MA) and South America (SA).
Intersections involved genome-wide non-adaptive SNPs (Non-adaptive; blue distributions) and SNPs with significant FST implicated as adaptive (Adaptive; red lines) between Par_N16 and the reference dataset (Takuno et al., 2015). HI, highlands; LO, lowlands; MA, Mesoamerica; SA, South America. In the Y axis is the count of the random samples showing a given number of intersected (covered) sites; in the X axis is the number of intersected (covered) sites between Par_N16 and the test population. (A) The genome-wide average of covered MA non-adaptive SNPs in Par_N16 is 28.32; the corresponding coverage of adaptive SNPs is 32. (B) The genome-wide average of covered SA non-adaptive SNPs in Par_N16 is 23.02; the corresponding coverage of adaptive SNPs is 20.
-
Figure 5—figure supplement 1—source data 1
Distribution of intersected SNPs between Par_N16 and landraces from Mesoamerica (MA) and South America (SA).
- https://cdn.elifesciences.org/articles/83149/elife-83149-fig5-figsupp1-data1-v2.xlsx
Figure 5—figure supplement 2
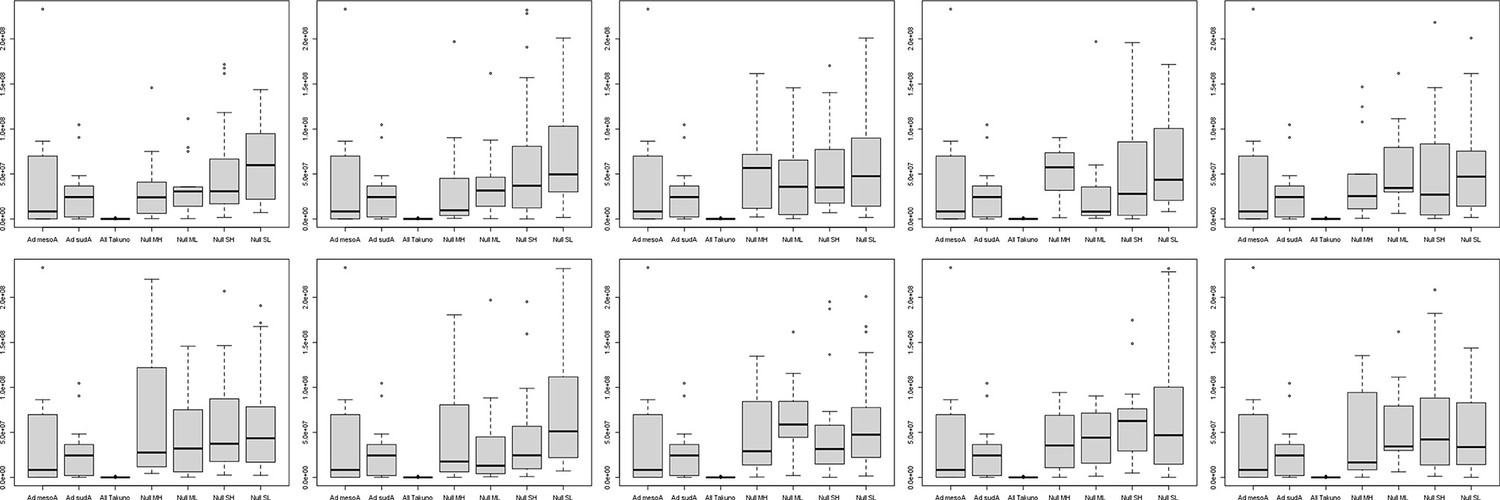
Distribution of distances between SNPs in ten random samples of background SNPs.
Tables
Table 1
Radiocarbon and calibrated dates of maize specimens from Paredones.
| Lab no. | Site | Associated Dating no. | Unit / stratum | 14 C years BP | 95.4% probablity | δ13C value | Dated Material |
|---|---|---|---|---|---|---|---|
| Par_N1 | Paredones | OS86020 | 22/18 | 5900±40 | 6775–6504 | –10.3 | Husk/shank fragment attached to cob |
| Par_N9 | Paredones | AA86932 | 20/6b-18 | 4770±35 | 5582–5321 | –23.5 | Husk fragment attached to cob* |
| Par_N16 | Paredones | AA86937 | 20/6b-18 | 4849±31 | 5603–5333 | –25.8 | Wood charcoal in associated hearth† |
-
*
Aberrant δ13C assay. Attachment to cob and molecular data confirm maize.
-
†
Maize cob directly associated with hearth.
Table 2
Paleogenomic characterization of three ancient maize samples from Paredones.
| Par_N1 | Par_N9 | Par_N16 | |
|---|---|---|---|
| Total number of raw reads | 623,686,255 | 423,856,284 | 851,330,235 |
| Total number of quality sequences | 622,438,882 | 423,472,877 | 850,326,750 |
| Number of sequences mapping to genome | 1,320,284 | 1,034,544 | 15,023,803 |
| Number of sequences mapping to repetitive regions | 441,442 | 351,883 | 5,228,275 |
| Number of sequences mapping to the unique genome | 878,842 | 682,661 | 9,795,586 |
| Total length (Mb) | 52.2 | 40.80 | 471.65 |
| Average read length (bp) | 59.41 | 59.90 | 48.15 |
| Total coverage (Mb) | 16.90 | 12.100 | 334.36 |
| Average quality (Phred) | 31.9 | 32.1 | 34 |
| Error rate (mismatches / bases mapped (cigar)) | 1.19E-02 | 9.59E-03 | 0.01059832 |
Table 3
Total number of unique genomic sites covered at variable depths in ancient Paredones samples.
| Depth | Par_N1 | Par_N9 | Par_N16 |
|---|---|---|---|
| 1 | 15,679,844 | 11,436,116 | 278,622,390 |
| 2 | 1,068,931 | 583,349 | 44,373,018 |
| 3 | 130,670 | 60,892 | 7,898,502 |
| 4 | 24,923 | 11,685 | 1,875,328 |
| 5 | 8,010 | 5291 | 644,804 |
| 6 | 3759 | 2309 | 299,729 |
| 7 | 2892 | 1189 | 167,142 |
| 8 | 1423 | 967 | 103,162 |
| 9 | 1026 | 837 | 68,272 |
| 10 | 869 | 774 | 47,003 |
| >10 | 10,419 | 9341 | 155,805 |
Table 4
Number of SNPs and genotype calls recovered from ancient Paredones samples.
| Par-N1 | Par-N9 | Par-N16 | Par-N16 transversions | ||
|---|---|---|---|---|---|
| Total number of SNPs | 21,123 | 15,554 | 275,990 | Total number of SNPs | 275,990 |
| Transitions C->T | 7505 | 5766 | 41,811 | Transitions C<->T | 76,990 |
| Transitions G->A | 7527 | 5617 | 41,669 | Transitions G<->A | 76,909 |
| INDELS | 609 | 423 | 19,790 | INDELS | 19,790 |
| Quality SNPs | 5482 | 3748 | 192,510 | Quality SNPs | 102,302 |
| Genotype calls included in HapMap3 | 2886 | 1888 | 121842 | Genotype calls included in HapMap3 | 64,118 |
Additional files
-
Supplementary file 1
Description of all accessions included in the phylogenetic analysis.
- https://cdn.elifesciences.org/articles/83149/elife-83149-supp1-v2.xlsx
-
Supplementary file 2
Median distances between the 20 South American adaptive SNPs (left) and the 32 Mesoamerican adaptive SNPs (right) covered in Par_N16.
- https://cdn.elifesciences.org/articles/83149/elife-83149-supp2-v2.xlsx
-
Supplementary file 3
(A) Allele frequency of highland and lowland Mesoamerican landraces at sites intersected with Par_N16 from 668 adaptive SNPs (2A).
(B) Allele frequency of highland and lowland South American landraces at sites intersected with Par_N16 from 390 adaptive SNPs.
- https://cdn.elifesciences.org/articles/83149/elife-83149-supp3-v2.xlsx
-
MDAR checklist
- https://cdn.elifesciences.org/articles/83149/elife-83149-mdarchecklist1-v2.docx
Download links
A two-part list of links to download the article, or parts of the article, in various formats.
Downloads (link to download the article as PDF)
Open citations (links to open the citations from this article in various online reference manager services)
Cite this article (links to download the citations from this article in formats compatible with various reference manager tools)
Domestication and lowland adaptation of coastal preceramic maize from Paredones, Peru
eLife 12:e83149.
https://doi.org/10.7554/eLife.83149


