Inferential eye movement control while following dynamic gaze
- Department of Psychological and Brain Sciences, Institute for Collaborative Biotechnologies, University of California, Santa Barbara, United States
- Department of Psychological and Brain Sciences, Department of Electrical and Computer Engineering, Department of Computer Science, Institute for Collaborative Biotechnologies, University of California, Santa Barbara, United States
Figures
Figure 1 with 1 supplement
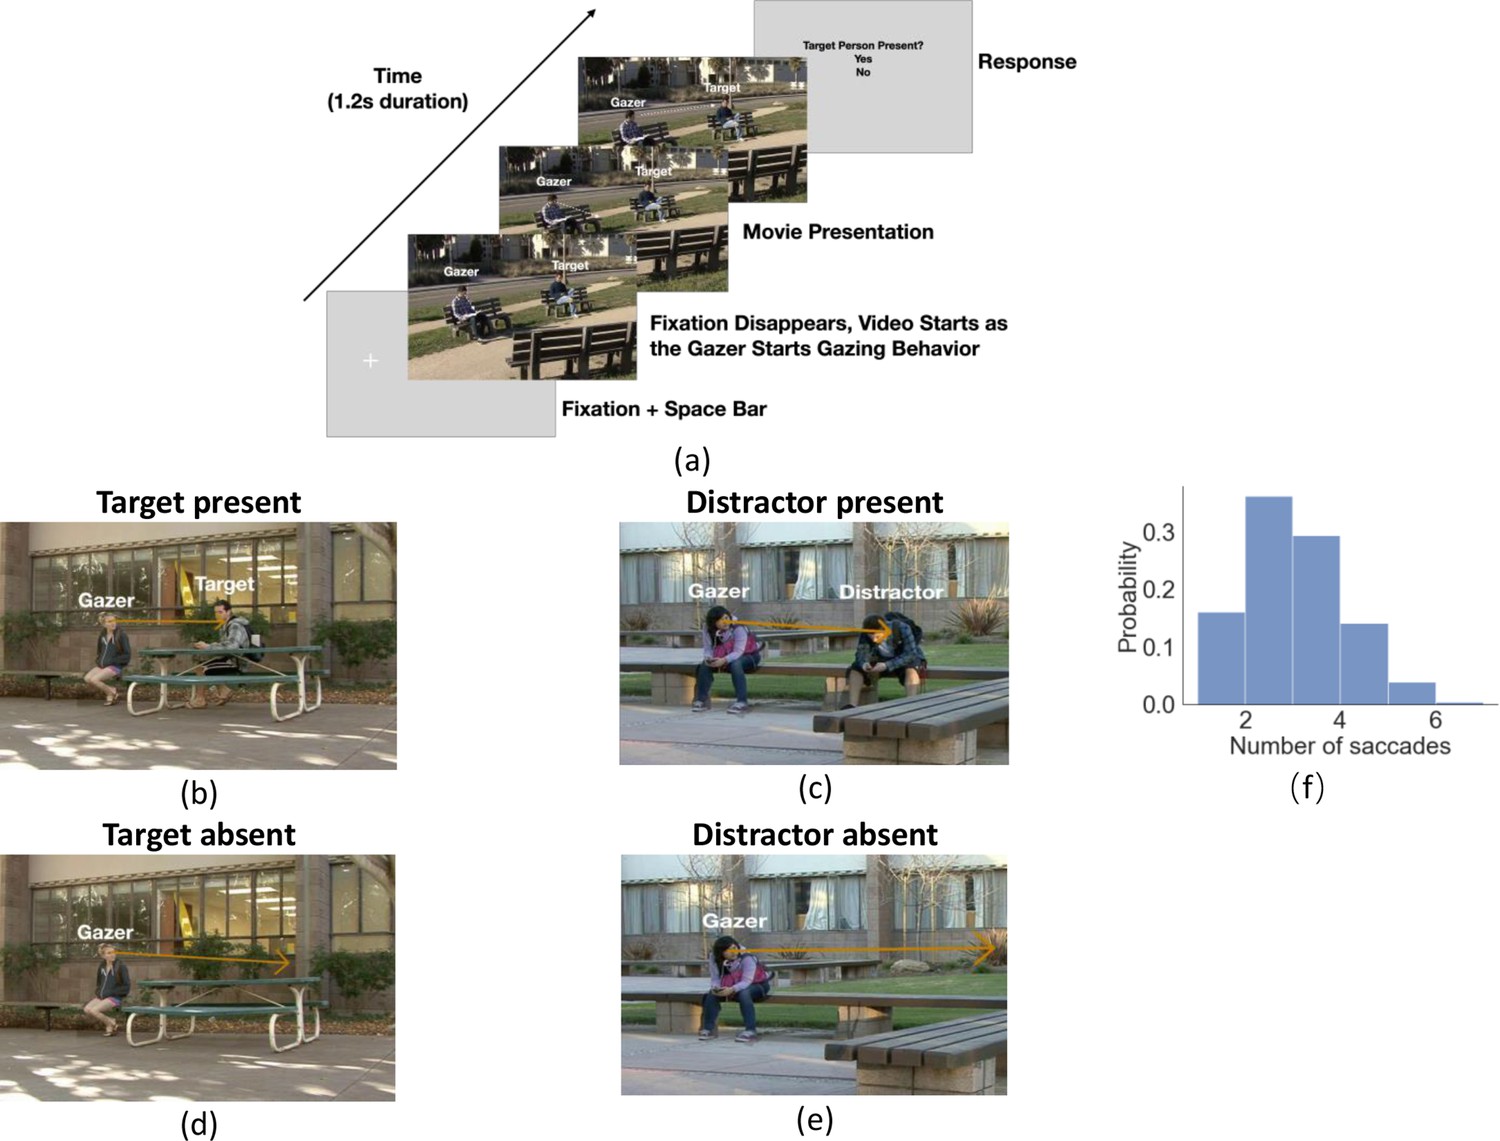
Experiment workflow and example trials.
(a) Timeline for each trial. The participants fixated on the fixation cross and pressed the space bar to initialize the trial. The cross was located at the gazer’s head, and the trial would not start if the eye fixation moved away from the cross by 1.5°. The cross disappeared as the video started with the gazer initiating their head movement to look at the designated gazed person (25% target present and 25% distractor present and 50% gaze goal absent). Participants were instructed to follow the gaze of the person in the video, which lasted 1.2 s. After the end of the video, a response image was presented and the observers selected ‘Yes’ or ‘No’ to respond to whether the target person was present or not in the video. The target person was the same throughout the trials but appeared with different clothing across trials. (b-e) Example video frames of the gazer looking at the gaze goal (distractor or target) either with the person present (b, c) or absent (digitally deleted, d, e). The orange arrow vector is the gaze estimation from a deep neural network model, with details presented in the following section. Note that all the text annotations and arrows are just for illustration purposes and were not presented during experiments. (f) Histogram of the number of saccades participants executed per trial.
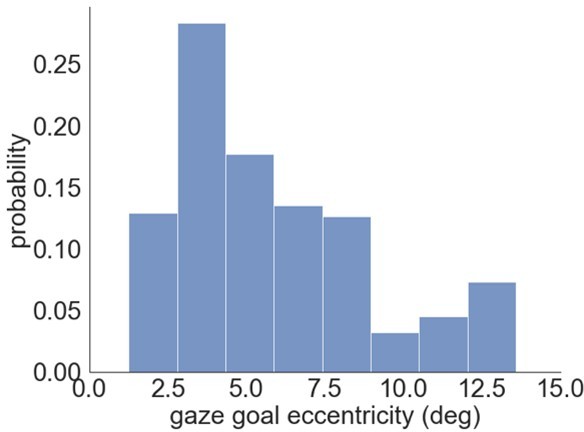
Figure 1—figure supplement 1

Histogram of gazed person eccentricities relative to the gazer’s position.
Figure 2
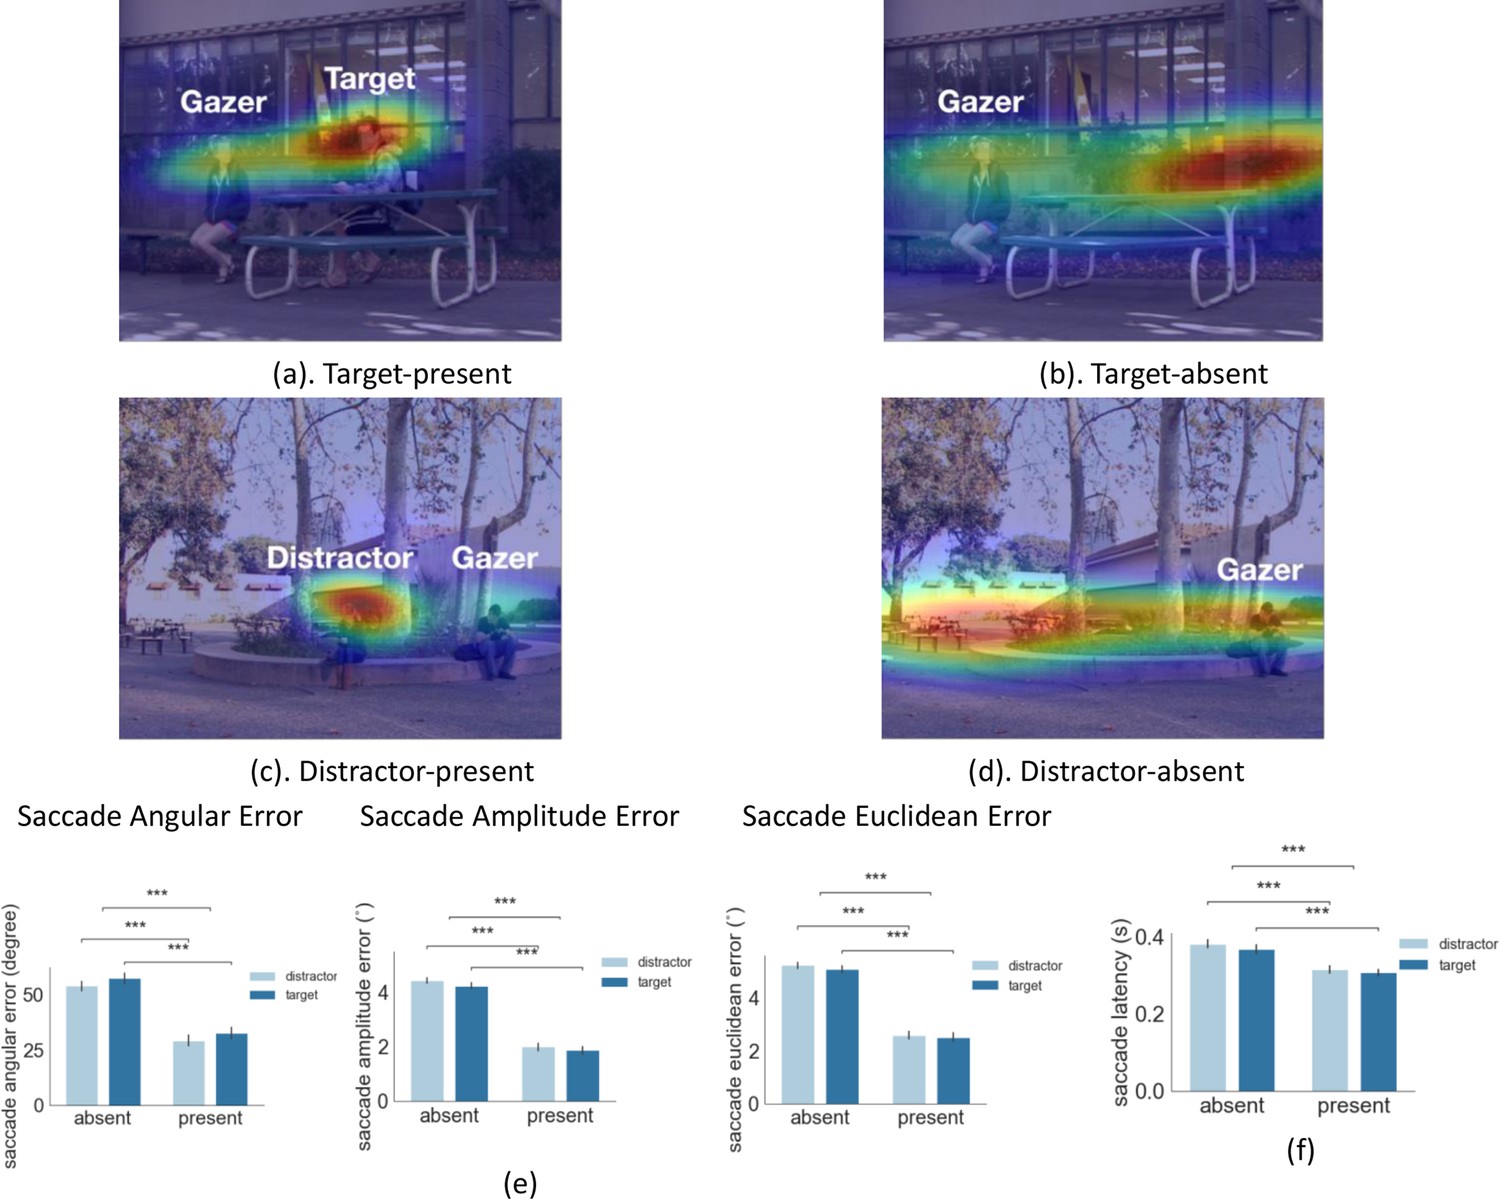
Examples of first gaze-following saccade errors and latency.
(a-d) Examples of first gaze-following saccade endpoint density maps for target-present combining data across all observers. (e) First gaze-following saccade endpoint angular error (degrees), amplitude error (degrees of visual angle°), and Euclidean error (degrees of visual angle°) relative to the gaze goal (person’s head center). (f) First gaze-following saccade latency for target/distractor present or absent at the gaze goal.
Figure 3 with 1 supplement
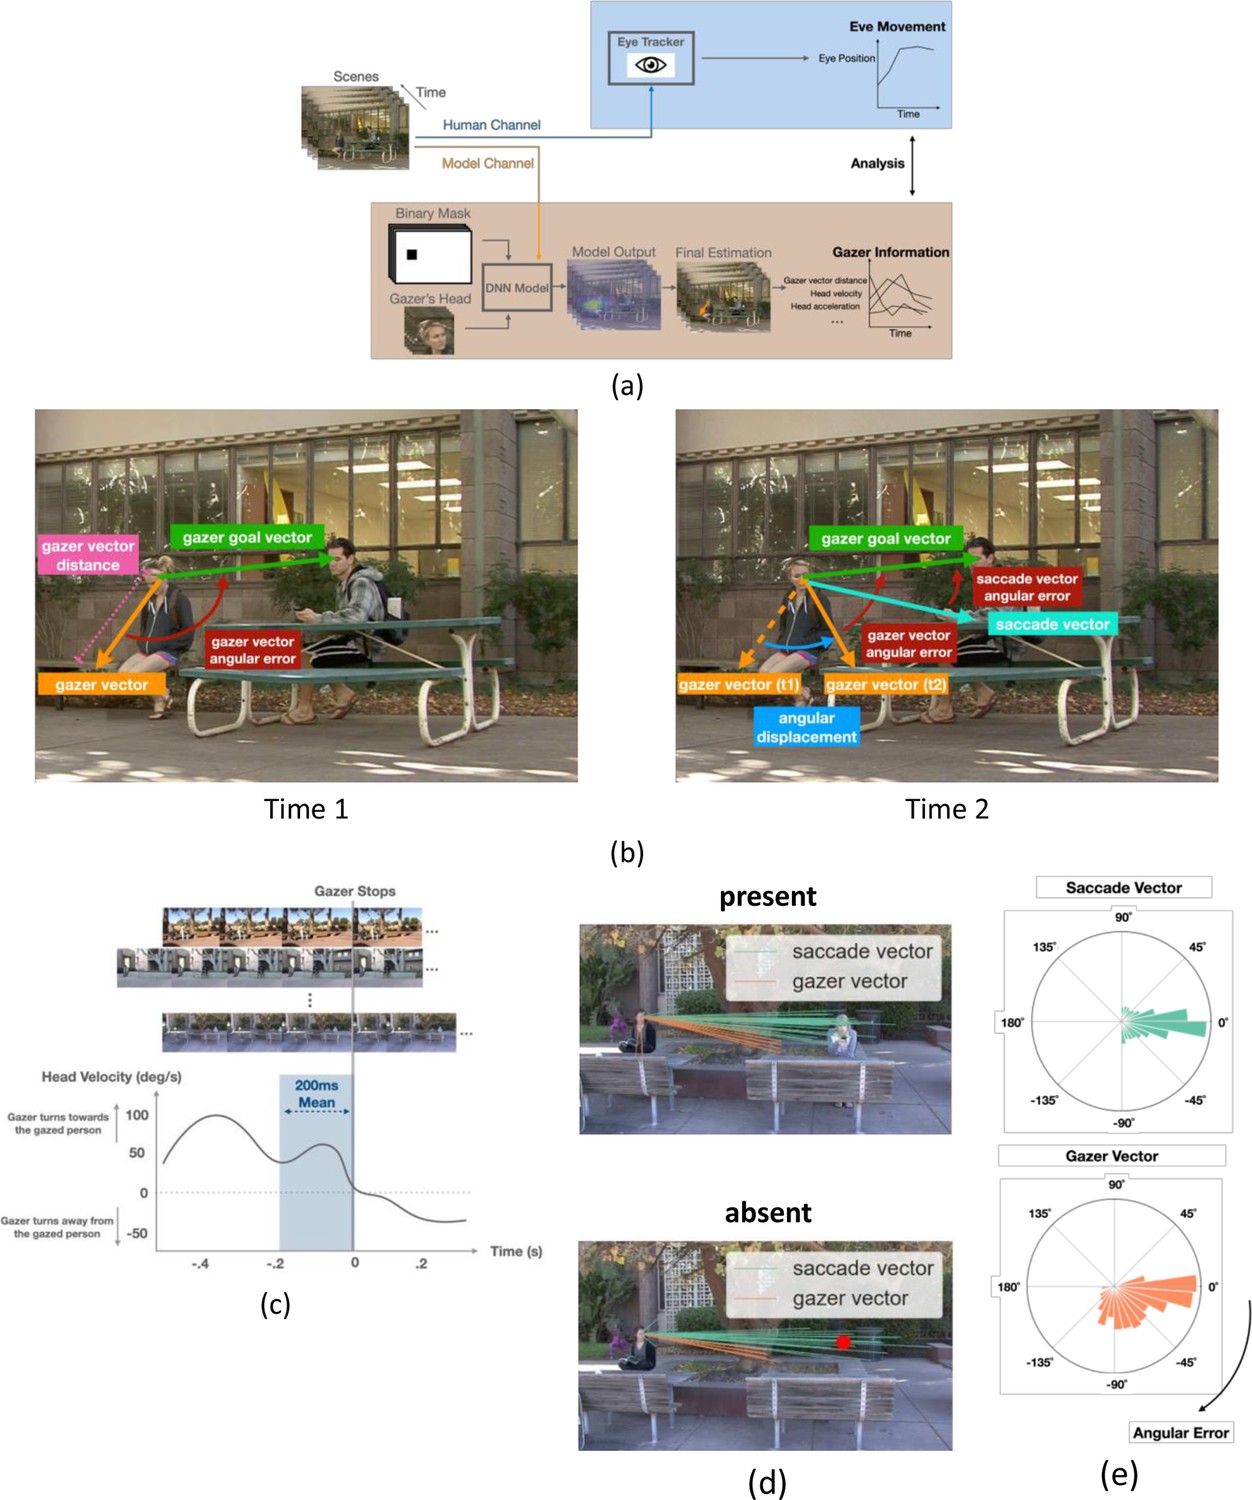
AI model analysis, definitions of saccade vectors and gaze vectors, and head velocity over time.
(a) Workflow for AI model for gaze estimation (Chong et al., 2020). The model takes individual frames, paired with a binary mask that indicates the gazer’s head location within the scene, and a cropped image of the gazer’s head, to produce a probability heatmap. The pixel location with the highest probability was taken as the final estimated gazed location and gazer vector endpoint (orange arrow in final estimation image). We computed various frame-to-frame gaze features based on the gazer vectors and related them to the dynamics of observers’ eye movements during gaze-following. (b) Examples of the initial gazer vector, the gazer vector distance, the gazer goal vector, the angular displacement, and angular errors. The gazer vector distance was the vector length indicating how far away the estimated gazed location (by the gazer) was from the gazer. The gazer goal vector is the vector whose start point was the gazer’s head centroid and the endpoint was the gazer goal location. The angular displacement is the angle between the current gazer vector and the initial gazer vector position. The angular error is the angle between the current gazer/saccade vector and the gazer goal vector. (c) Estimation of the typical head velocities right before (200ms interval) the gazer’s head stops moving. Velocities were obtained by aligning all videos relative to the gaze stop time and averaging the head velocities. Head velocity = 0 at time = 0. (d) The first saccade vectors (teal lines) and corresponding gazer vectors (orange lines) at the saccade initiation times for all observers and trials for the same video (top: gaze goal present condition, bottom: gaze goal absent condition). (e) Histogram of angular errors for first saccade vectors and gazer vectors at the saccade initiation times for all trials/videos and observers. All vectors were registered relative to the gazer goal vector (the horizontal direction to the right represents 0 angular error).
Figure 3—figure supplement 1
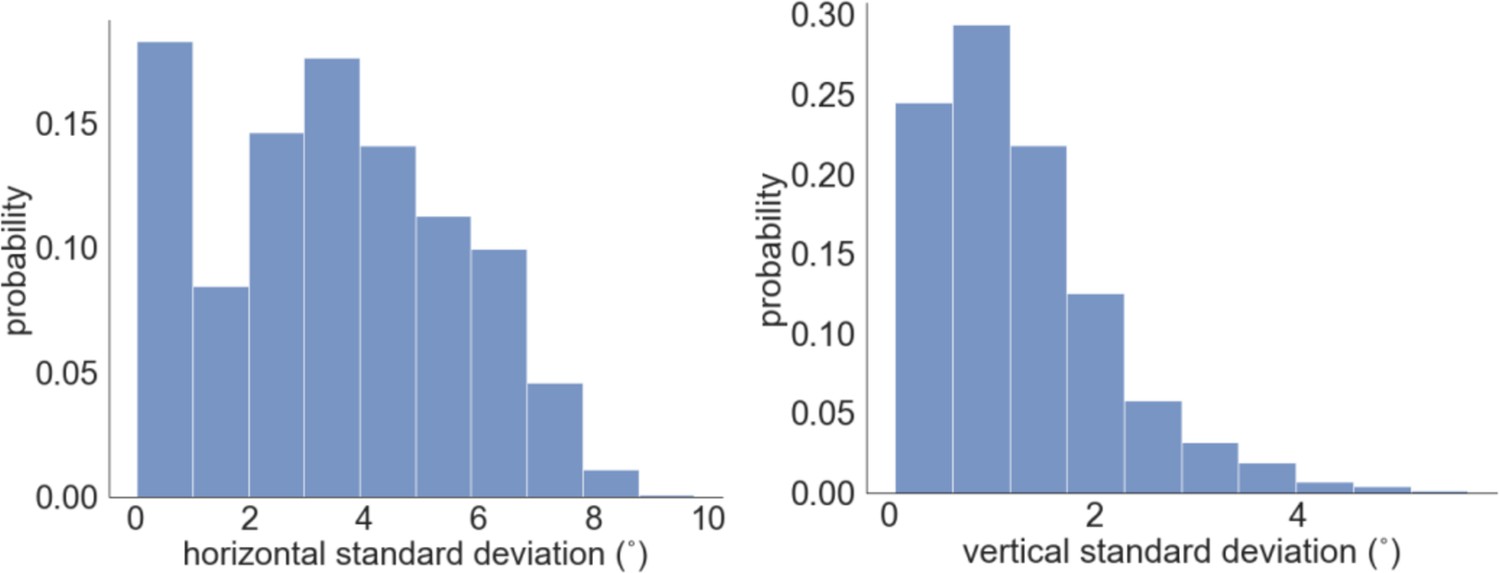
Histograms of gaze goal estimation standard deviations across human gaze annotations in the horizontal direction (left) and in the vertical direction (right).
Figure 4 with 1 supplement
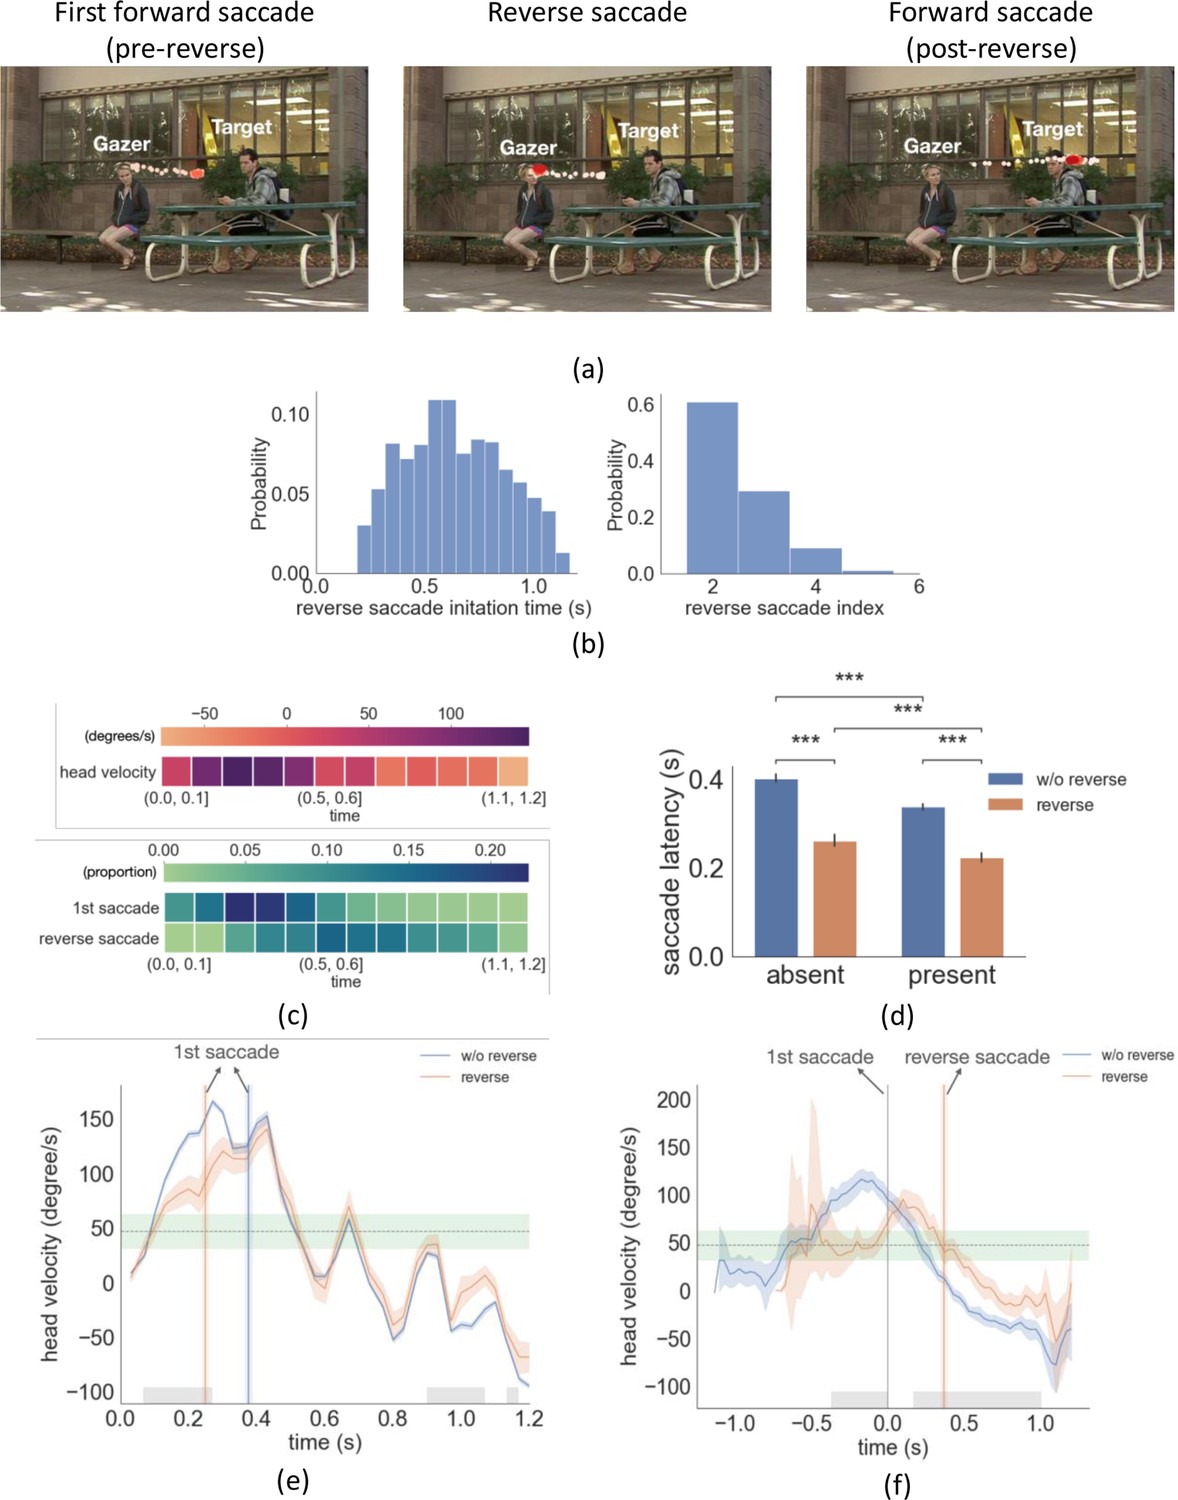
Example trial with reverse saccade, distributions of saccade time and latency, head velocity difference between trials with reverse saccades and trials without reverse saccades.
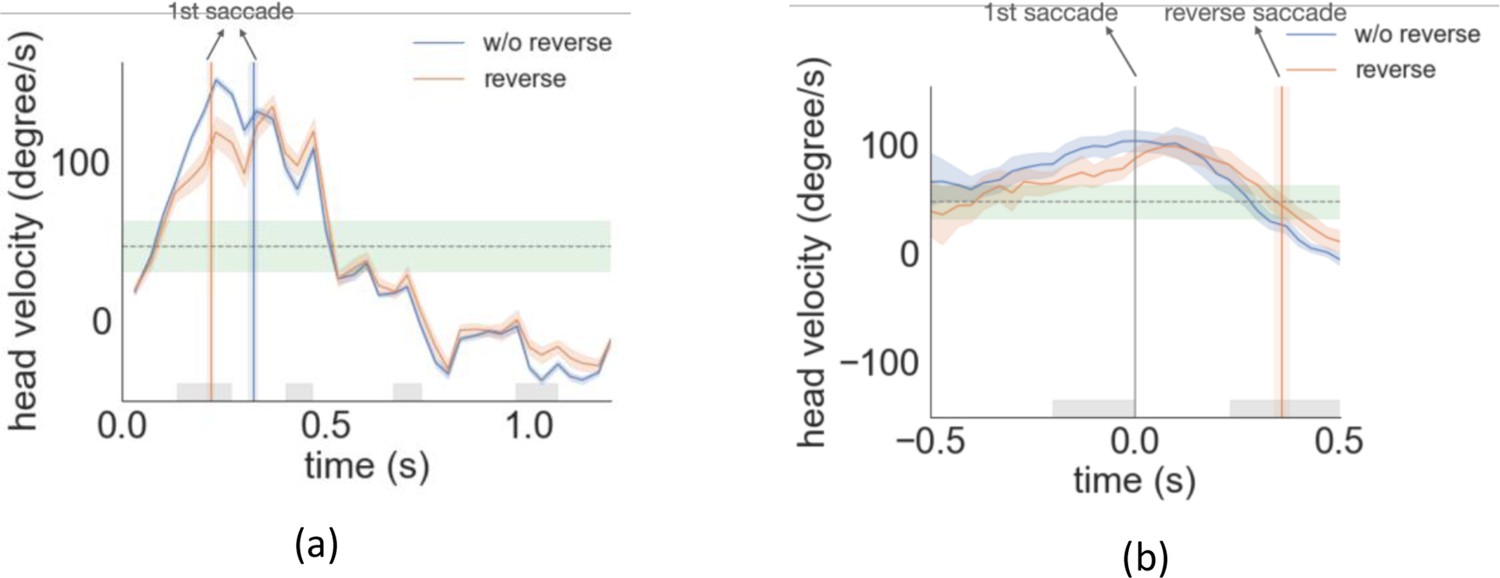
(a) An example of eye movement trace for three saccades over time. A first gaze-following saccade, followed by a reverse saccade, and another post-reverse saccade gaze-following saccade. The light red to dark red represents the order in time (see video demo at https://osf.io/yd2nc). (b) Histogram of the reverse saccade initiation time and reverse saccade index (2nd, 3rd, etc.). (c) Heatmaps represent the first saccade and reverse saccade frequency, and the gazer’s head velocity over time (d) Saccade latency separated by three conditions and reverse saccade trials. (e) Gazer’s head rotation velocity vs. time separated for reverse saccade and non-reverse saccade trials. Shaded areas are the 95% bootstrapped confidence interval. Positive velocity represents the head moving toward the gazed person’s location. The vertical lines are the mean first saccade latency. The gray area shows the statistical significance under the cluster-based permutation test. The green area represents the 95% confidence interval of the velocity right before the gazer’s head stops moving across all movies. (f) The same figure as (e) except that head velocity was aligned at the initiation time of the first saccade. (g) The proportion correct for linear support vectore machine (SVM)models trained to predict whether a movie was in the upper 50 %/or lower 50% of movies based on the number ofreverse saccades. The x-axis is the time range from the movie used to train the SVM model. The first saccade latency and reverse saccade latencies are marked as dashed lines as references. (h) The head velocity aligned with the first saccade initiation time at t=0, separately for trials with frozen frames and without.
Figure 4—figure supplement 1
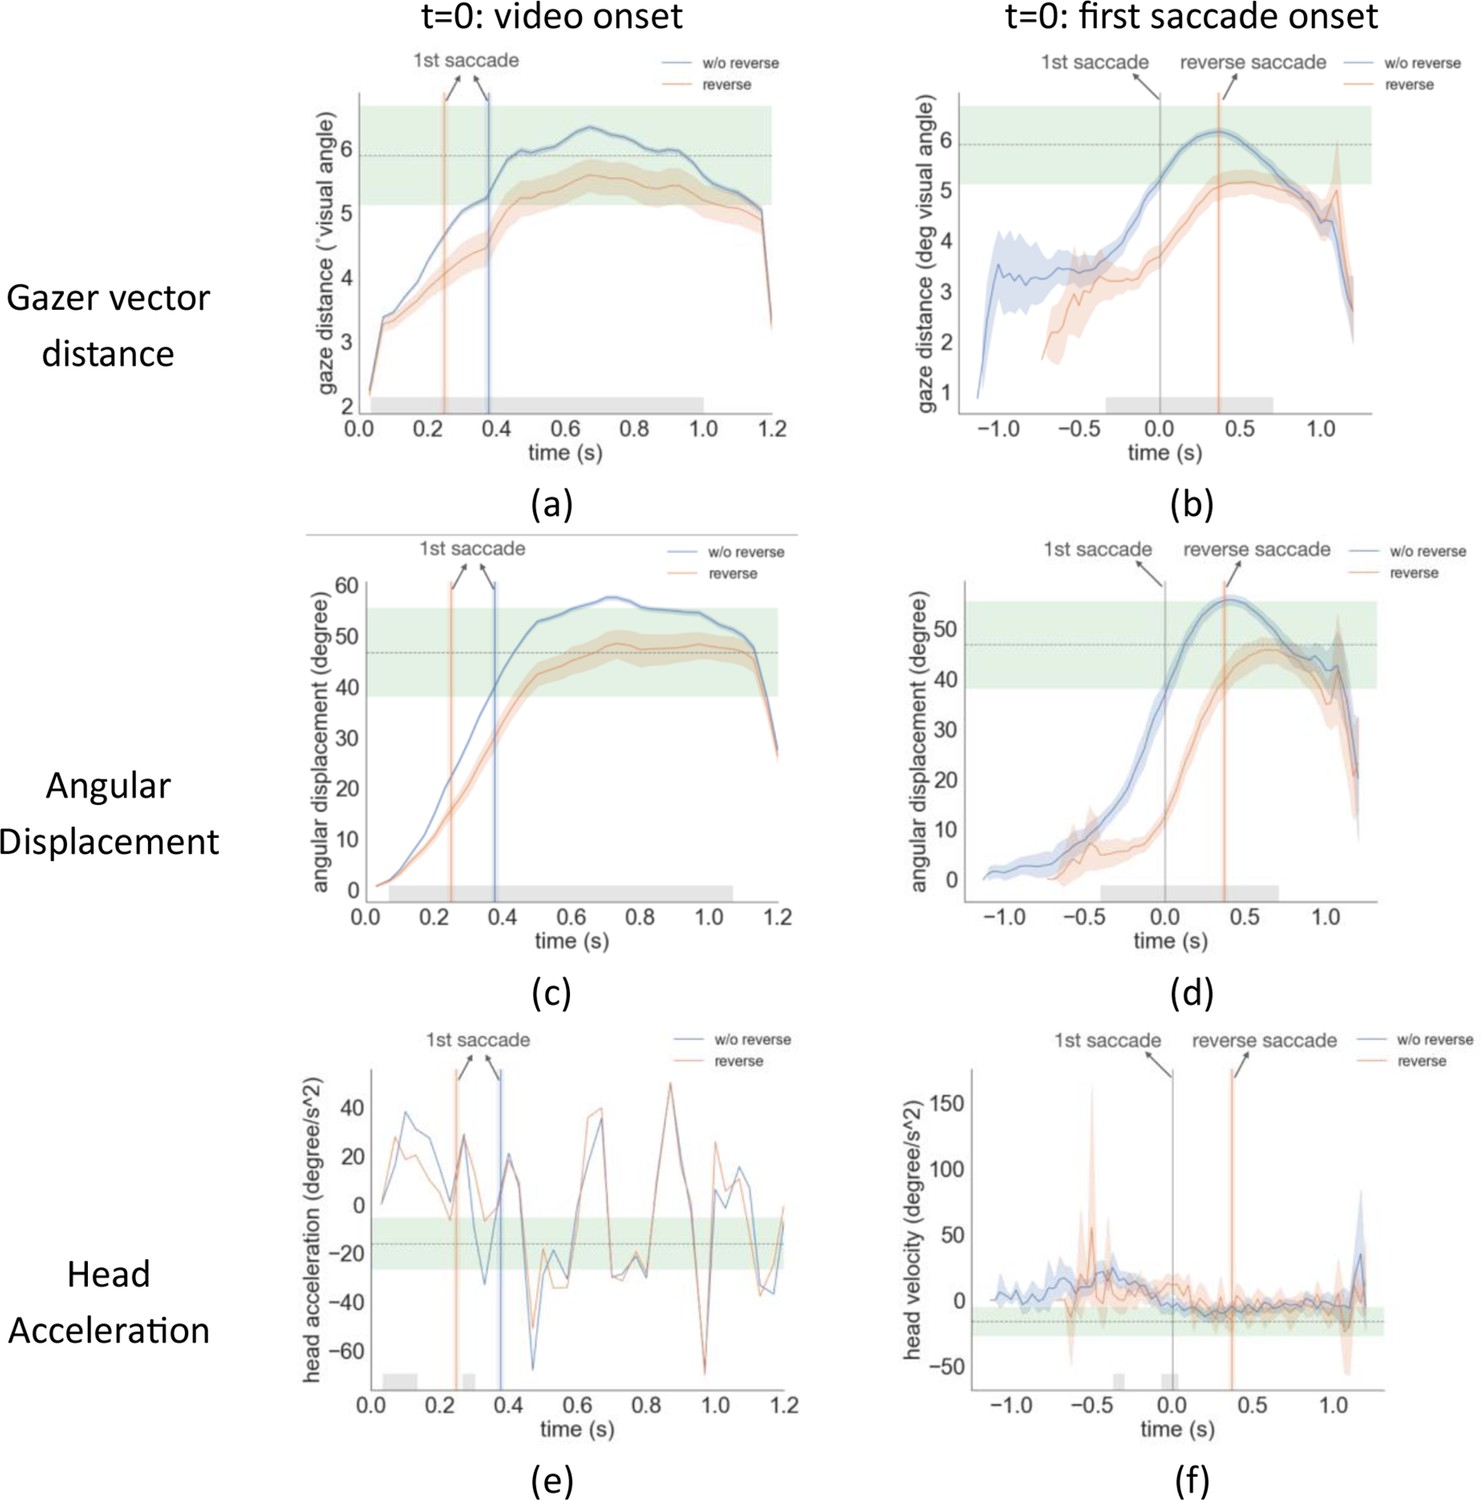
Gazer vector distance, angular displacement, and head acceleration over time, averaged across videos with t=0 aligned with video onset (left column) and t=0 aligned with first saccade onset (right column).
The shaded area was the 95% bootstrapped confidence interval. The gray area was significant under the cluster-based permutation test. The green area was the 95% confidence interval of each gaze variable right before the gazer’s head stops moving across all movies.
Figure 5
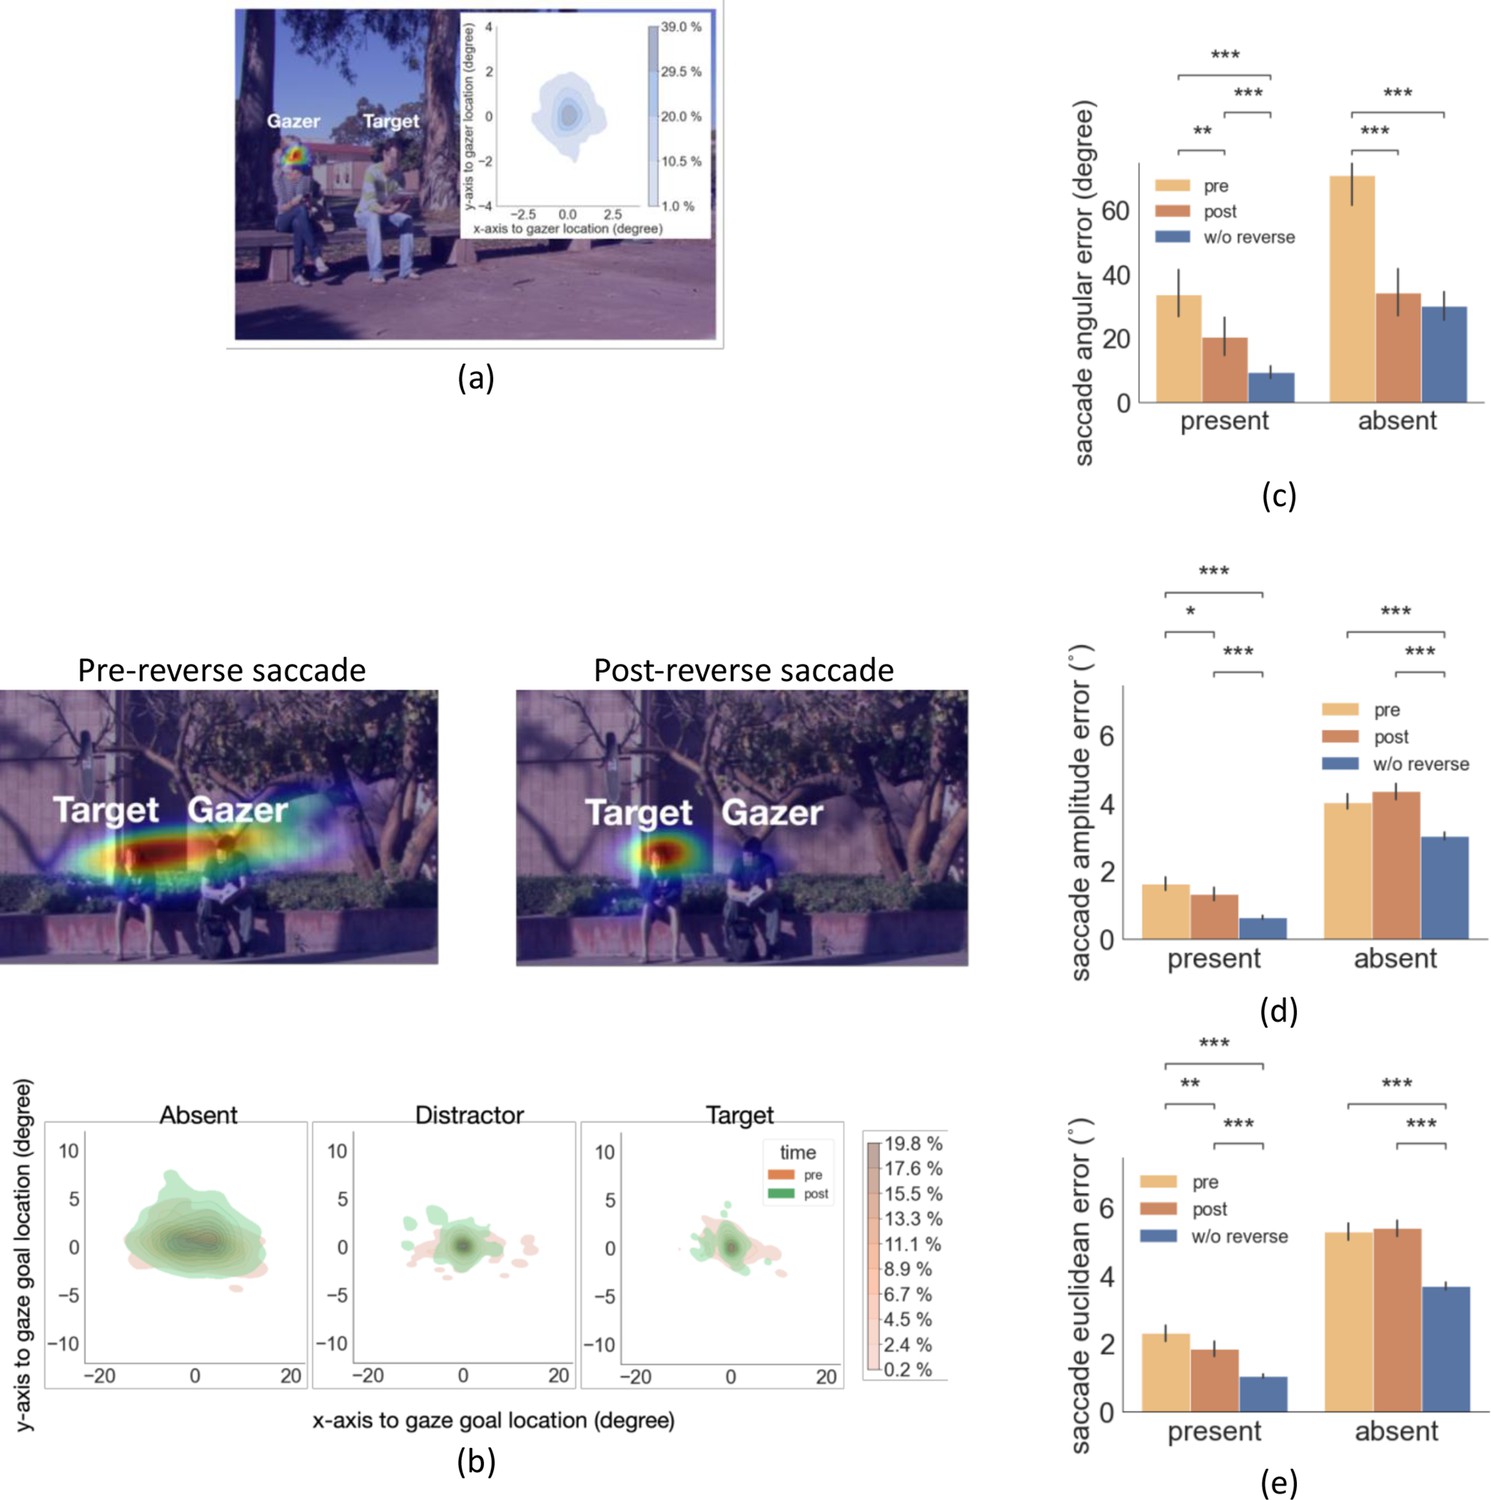
Distribution of reverse saccade landing positions and saccade errors.
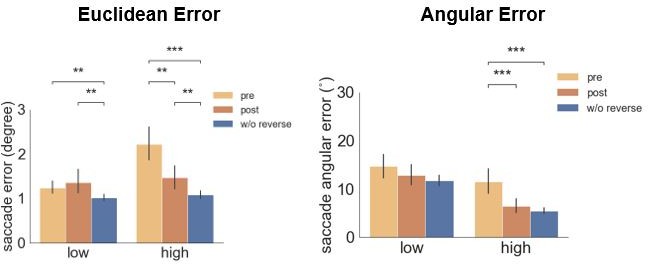
(a) Density map of reverse saccade endpoint locations overlayed on an example image. The density map of all reverse saccade locations registered across videos relative to the gazer’s head location at origin (0,0) is shown on the top right. Colorbar shows the proportion of saccades falling in each region. (b) Top: Density map of gaze-following saccade location pre- and post-reverse saccade overlaying on an example image. Bottom: Density map of all saccades pre- and post-reverse saccades registered relative to the gazed person’s head locaton at origin (0,0). Colorbar shows the proportion of saccades falling in each region. (c-e) The saccade angular error (angular difference between the saccade vector relative to the gaze goal vector), the saccade amplitude error (amplitude difference between the saccade vector relative to the gaze goal vector), and the saccade Euclidean error (relative to the gazed location, center of the head) for pre- and post-reverse saccades. Trials with no reverse saccade were treated as the baseline conditon.
Figure 6 with 2 supplements
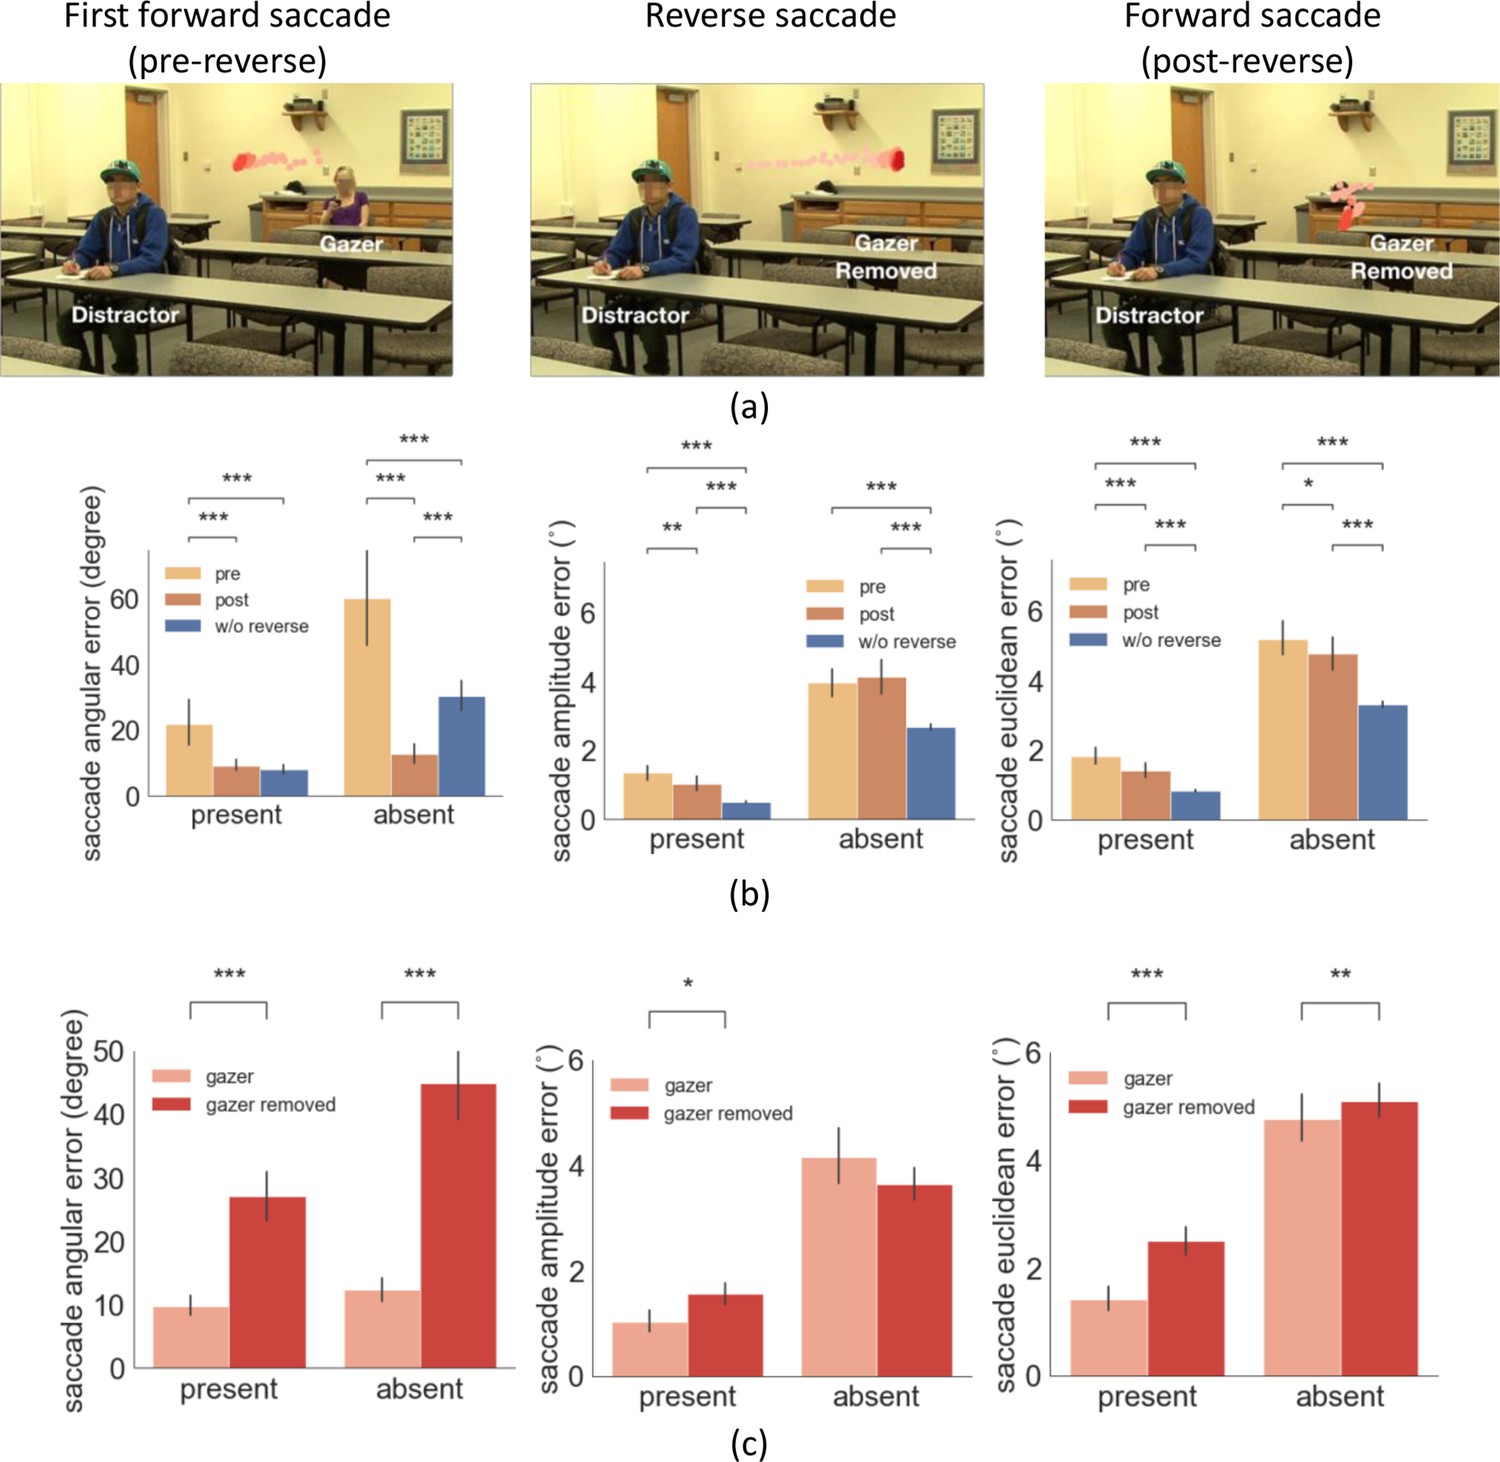
Example trial of reverse saccade when the gazer was removed and saccade errors.
(a) Example of eye movement trace over time when the gazer was erased triggered by the detection of a reverse saccade. The light red to dark red represents the order in time (see video demo at https://osf.io/etqbw). (b) The saccade angular error (angular difference between saccade vector relative to gaze goal vector), the saccade amplitude error (amplitude difference between saccade vector relative to gaze goal vector), and the saccade Euclidean error (saccade endpoint location relative to gazed person’s head) in trials without gazer removed pre-reverse saccade vs. post-reverse saccade vs. baseline trials (w/o reverse saccades). (c) The saccade angular error, saccade amplitude error, and the saccade Euclidean error post reverse saccade with gazer removed vs. gazer unaltered.
Figure 6—figure supplement 1
Gazer’s head velocity averaged across all videos aligned (t=0) relative to the start of the videos (a) and aligned relative to the first saccade initiation time (b) for experiment 2.
Figure 6—figure supplement 2

The proportion of trials that have the first saccade moving towards the gaze goal for the absent and the present condition in the free-viewing experiment.
Figure 7

The minimum difference in degrees of visual angle that can be detected with a t-test at a significance level of 0.05.
The graph shows the minimum detectable difference as a function of the number of trials per observer. Different lines correspond to different numbers of observers. Estimates are based on a database of 400 subjects and eye movements to faces.
Author response image 1
Histogram of eccentricity (distance between) gazer head and the gaze goal.
Author response image 2
Author response image 3
Videos
Video 1
Example trial with reverse saccade (white dot represents gaze position, yellow arrow represents gaze vector).
Video 2
Example trial with reverse saccade when the gazer was removed (white dot represents gaze position, yellow arrow represents gaze vector).
Video 3
Example trial when the gazer was frozen after the first gaze-following saccade (white dot represents gaze position, yellow arrow represents gaze vector).
Additional files
Download links
A two-part list of links to download the article, or parts of the article, in various formats.
Downloads (link to download the article as PDF)
Open citations (links to open the citations from this article in various online reference manager services)
Cite this article (links to download the citations from this article in formats compatible with various reference manager tools)
Inferential eye movement control while following dynamic gaze
eLife 12:e83187.
https://doi.org/10.7554/eLife.83187


