Motor actions are spatially organized in motor and dorsal premotor cortex
- Department of Neurobiology, University of Pittsburgh, United States
- Systems Neuroscience Center, University of Pittsburgh, United States
- Center for the Neural Basis of Cognition, United States
- Center for Neuroscience, University of Pittsburgh, United States
- Department of Bioengineering, University of Pittsburgh, United States
Figures
Figure 1
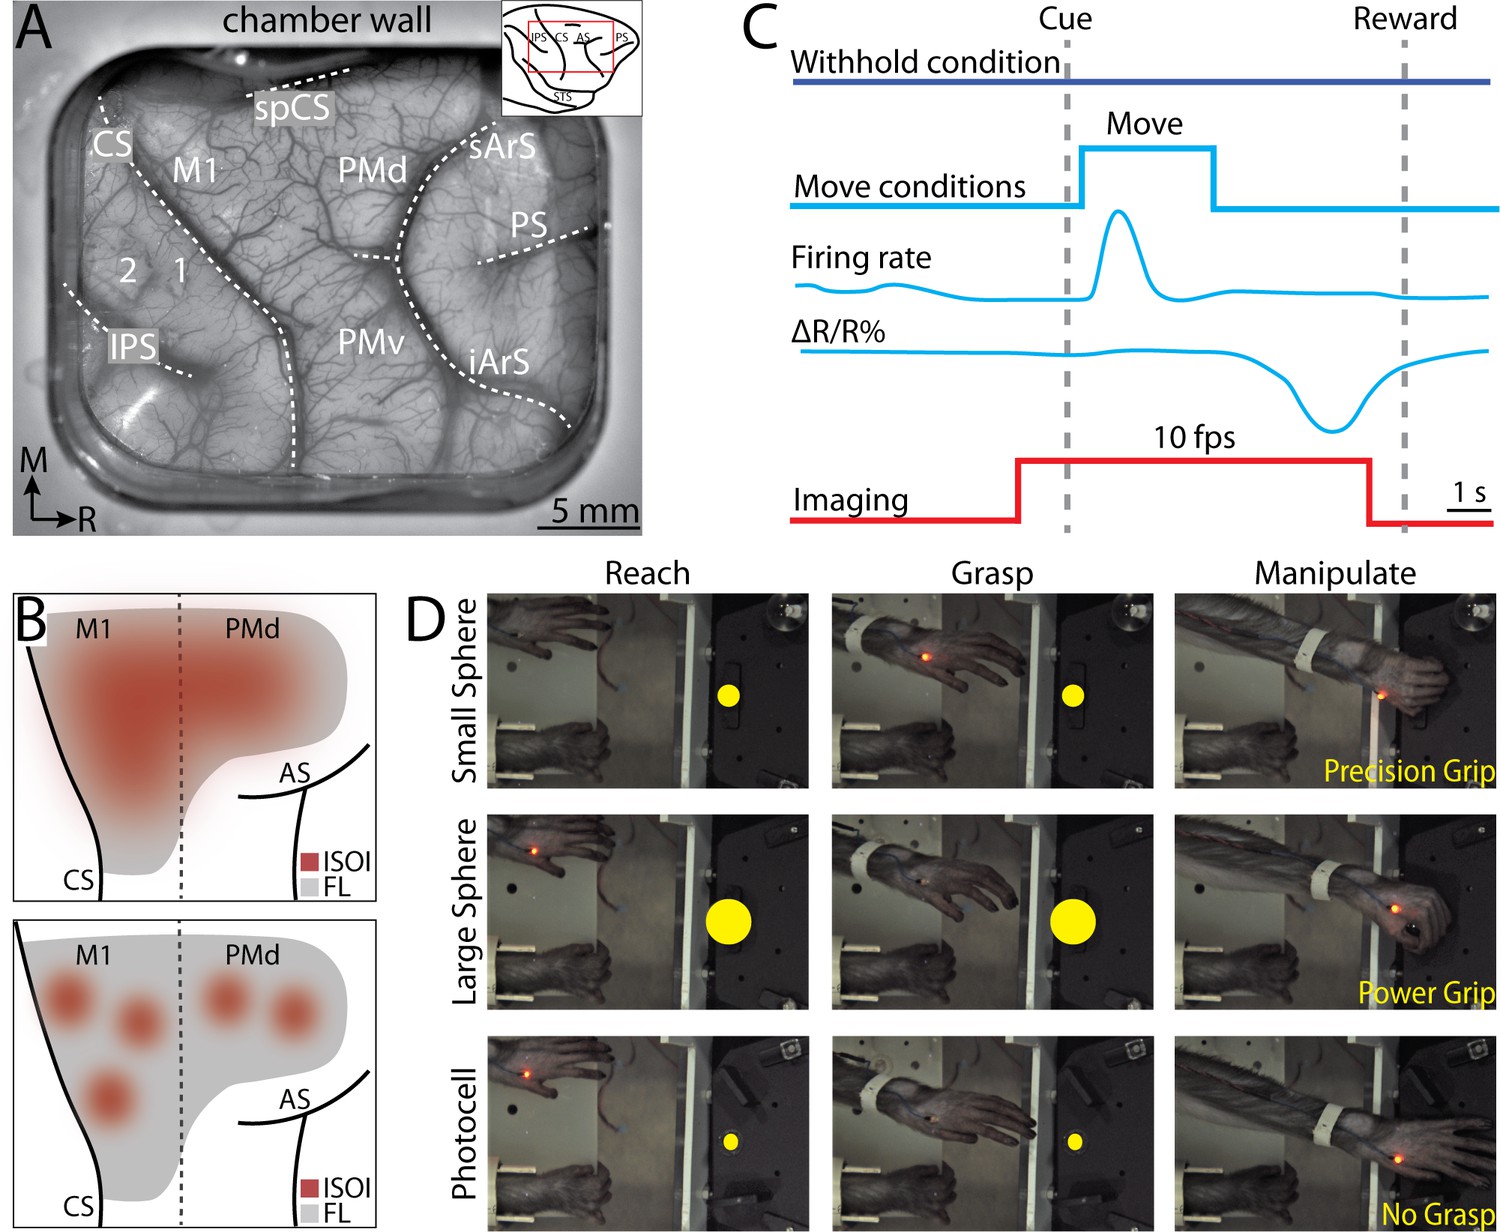
Intrinsic signal optical imaging during instructed arm and hand actions.
(A) Chronic recording chamber provides access to motor and somatosensory cortical areas in the right hemisphere. Native dura is replaced with transparent membrane. Dashed lines mark: central sulcus (CS), intraparietal sulcus (IPS), and arcuate sulcus (AS). Inset shows approximate location of chamber (red rectangle). (B) Schematic of potential results. Dotted line separates motor (M1) from premotor areas. Forelimb representation (FL) is gray. Red patches are clusters of pixels that darkened (i.e., negative reflectance) after task-related increase in neural activity. (Top) Pixels reporting activity are in a large patch that overlaps most of FL. (Bottom) Pixels reporting activity are in several small patches that collectively overlap a smaller portion of FL than the patch in A. (C) Relative timing in task conditions. Blue square pulse indicates movement period, whereas there was no movement in the withhold condition. Increase in neural firing coincides with movement and precedes reflectance change (ΔR/R%) measured with intrinsic signal optical imaging (ISOI). Red pulse depicts ISOI acquisition in all conditions (10 frames/s). (D) Still frames from three phases (columns) in the three movement conditions (rows). Task was performed with the left forelimb and the right forelimb was restrained. Yellow circles were not visible to the monkey but were digitally added here to facilitate visualization of the three targets.
Figure 2
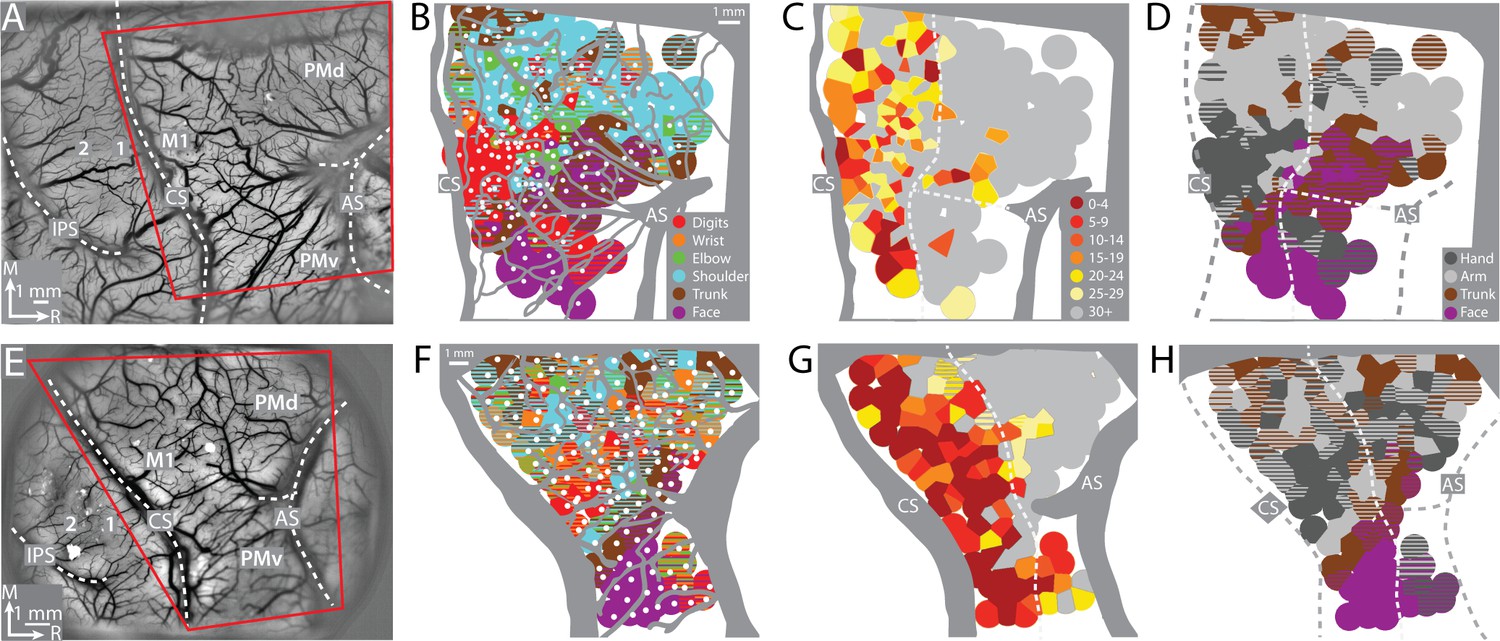
Motor map organization in motor (M1) and dorsal premotor (PMd).
(A–D) Right hemisphere of monkey G. (A) Cropped image of a chronically implanted recording chamber. Blood vessels and cortical landmarks are visible through the transparent membrane. Red outline is the field-of-view in subsequent panels and figures. (B) Major blood vessels and chamber walls are masked in gray. White dots are intracortical microstimulation (ICMS) sites (n = 218). Voronoi tiles (0.75 mm radius) are color coded according to ICMS-evoked movement. Striped tiles represent dual movements. (C) Same motor map from (B) colored according to current amplitude (μA) for evoking movements. Border between M1 and premotor cortex is drawn at the transition from low (<30 μA) to high (>30 μA) current thresholds. (D) Same motor map as (A), but here wrist and digit sites are classified as hand, and shoulder and elbow sites are classified as arm. (E–H) Same as top row, but for right hemisphere of monkey S. Motor map has 158 ICMS sites.
Figure 3 with 1 supplement
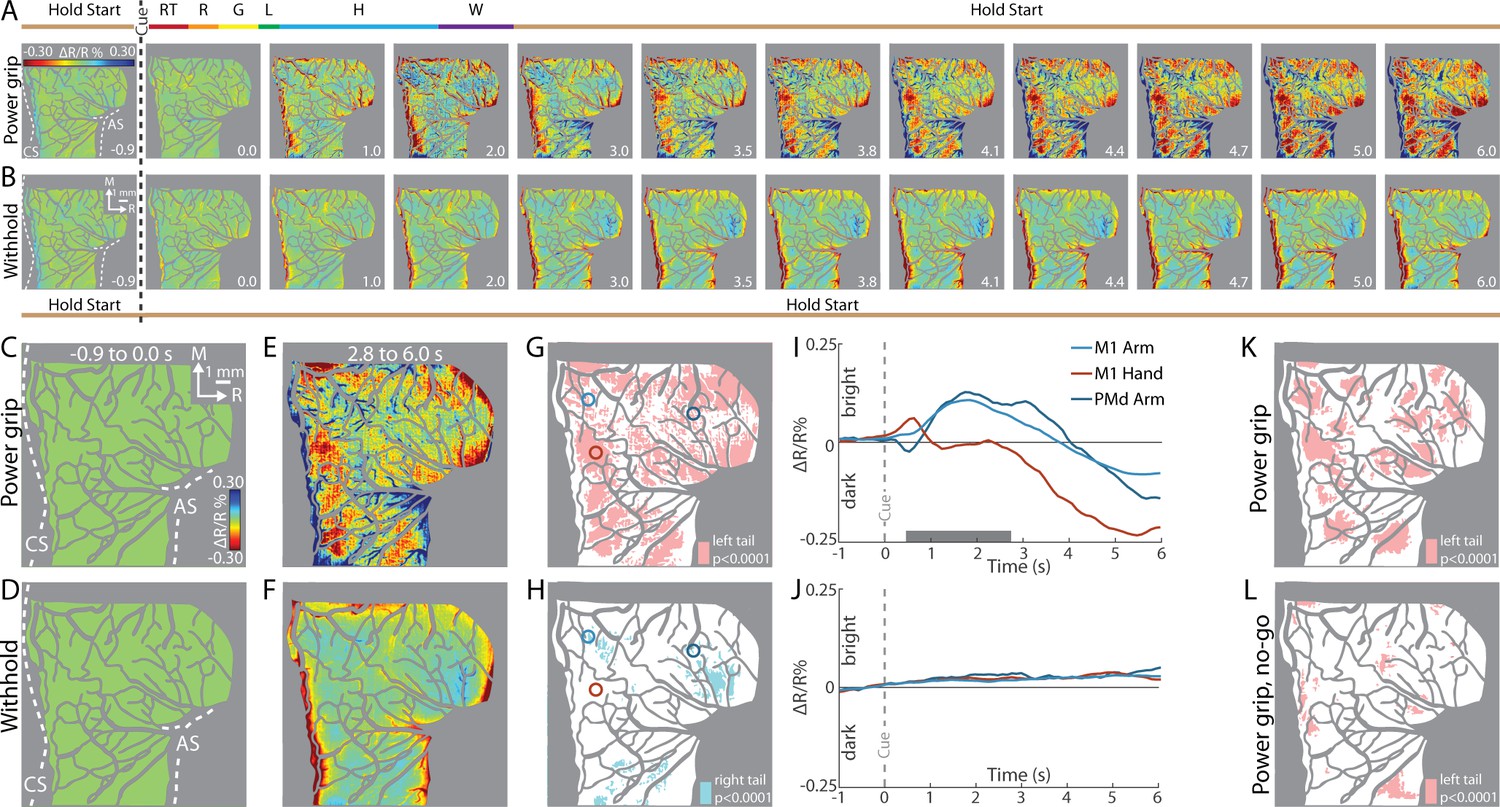
Intrinsic signal optical imaging (ISOI) detects movement-related activity in motor (M1) and dorsal premotor (PMd).
(A, B) Average time series from a representative session (36 trials/condition, monkey G). (A) Timeline of average trial from the power grip condition. Hold start = hand in start position. Other phases include reaction time (RT), reach (R), grasp (G), lift (L), hold (H), and withdraw (W). Select frames with time (seconds from cue onset) in bottom right. Reflectance change was clipped to the median pixel value ±0.3 standard deviation (SD). Clusters of pixels started to darken (hot colors) at 3.5 s and gradually increased in size and intensity. (B) Matching frames from the withhold condition. Color scale is same as (A). (C, D) Baseline frames in the power grip and withhold conditions. (E) Movement frame in the power grip condition: mean of 33 frames captured from movement completion until end of trial. (F) Temporally matched mean frame from the withhold condition. (G) Thresholded map from the power grip condition. Red pixels were significantly darker (t-test, left tail, p < 0.0001) in (E) than in (C). Colored circles (0.40 mm radius) are regions-of-interest (ROIs) placed in M1 hand, M1 arm, and PMd arm. (H) Thresholded map from the withhold condition. Cyan pixels were brighter (t-test, right tail, p < 0.0001) in (F) than in (D). (I) Time courses of reflectance change in the power grip condition. Line colors match the ROIs. Negative values indicate pixel darkening. Gray horizontal bar depicts mean movement duration. (J) Same as (I), but for the withhold condition. (K) Thresholded map from the power grip condition (2 sessions, 159 trials). Red pixels darkened after movement as compared to baseline (t-test, left tail, p < 0.0001). (L) Thresholded map from the no-go condition (2 sessions, 159 trials). Only a small number of pixels darkened in M1 and PMd.
Figure 3—figure supplement 1
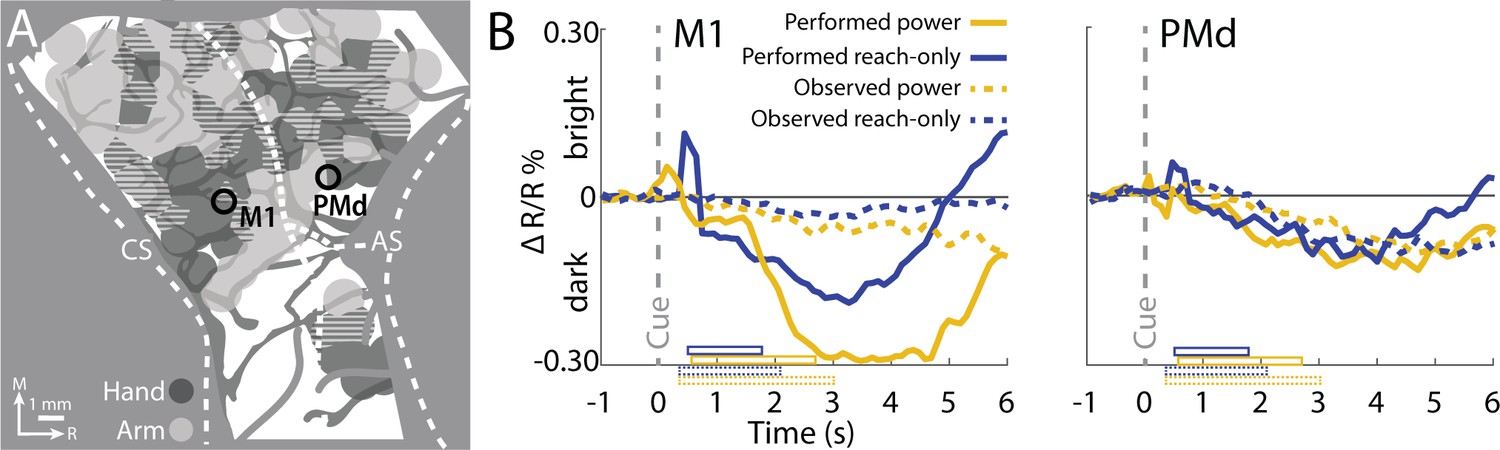
Movement observation drives reflectance change in dorsal premotor (PMd) but not in motor (M1).
(A) Regions-of-interest (ROIs) in M1 and PMd (0.4 mm radius, monkey S). (B) Time courses from 2 movement execution conditions (35 trials/condition) and 2 movement observation conditions (81 trials/condition). Horizontal bars show average movement duration for each condition.
Figure 4
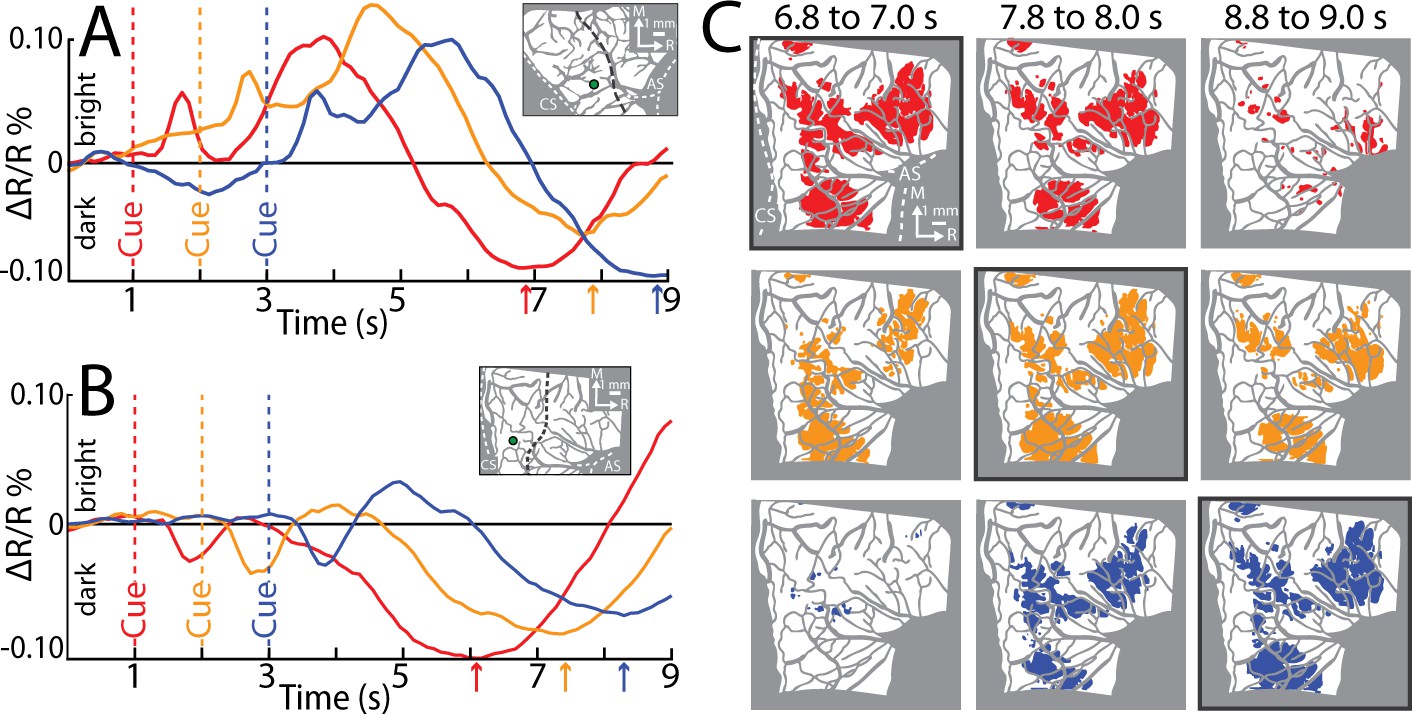
Reflectance change is locked to movement.
(A) Time course of reflectance change in motor (M1). Average of 2 sessions (95 trials/condition, monkey S). Inset shows region-of-interest (ROI; 0.40 mm radius). Line plot colors match cue condition (dashed line). Arrows point to negative peaks. (B) Same as (A), but for monkey G (1 session, 44 trials/condition). (C) Thresholded maps from the data in (B). Each map is an average of 3 frames and reports activity from different time points in relation to Cue. Colored pixels darkened in the movement frame as compared to baseline (t-test, p < 0.0001). Pixel colors match cue condition (1 condition/row). A black border is drawn around the thresholded map that is +5.8 to +6.0 s from Cue.
Figure 5 with 2 supplements
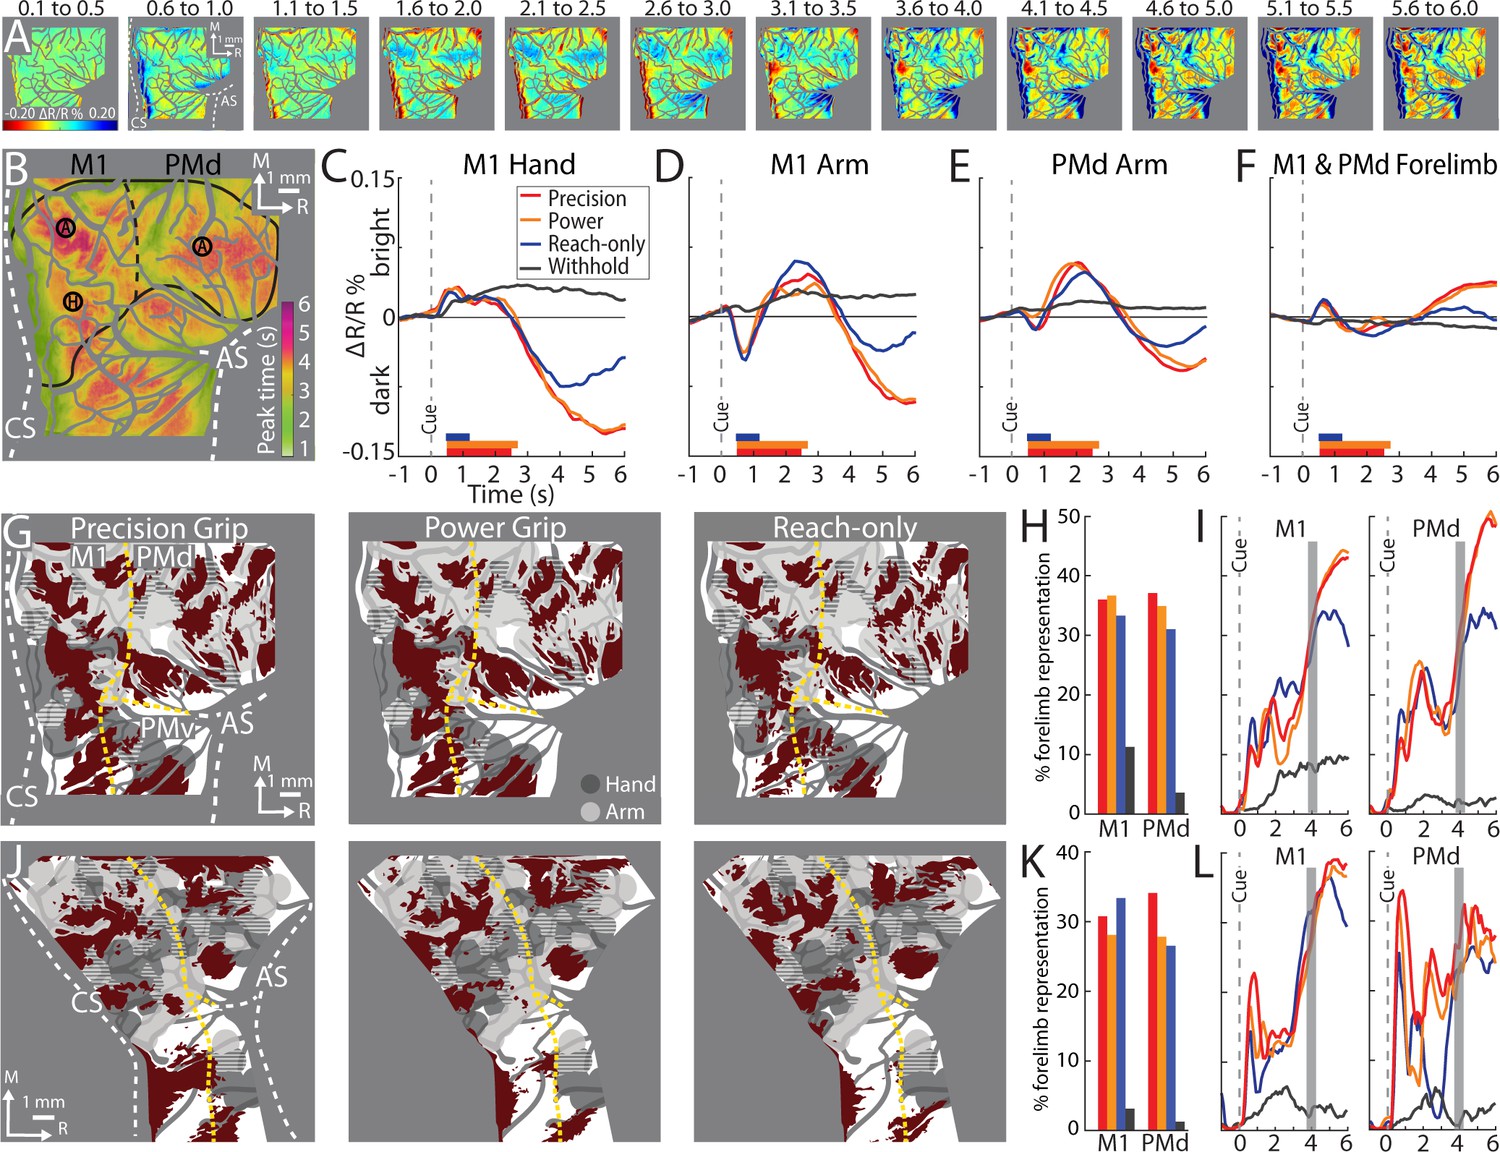
Average time series reveal consistent features of cortical activity.
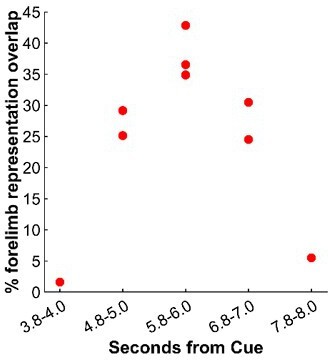
(A) Average time series for precision grip (8 sessions, 404 trials, monkey G). Each frame is the average of five successive frames, averaged across trials. Time above each frame is seconds from cue onset. Reflectance change was clipped to the [median ± standard deviation (SD)] pixel value across frames. Patches started to form at 3.1–3.5 s. (B) Full field-of-view (FOV) colored according to the time (seconds from Cue) that pixels reached maximal negative reflectance. Hot colored pixels peaked relatively late. Black circles (0.40 mm radius) in motor (M1) and dorsal premotor (PMd) are regions-of-interest (ROIs) placed in arm “A“ and hand “H zones. The forelimb representations are outlined in black with the dotted line separating M1 from PMd. The entire outline is also used an ROI. (C–F) Each plot is based on one of the ROIs in (B). Horizontal bars on x-axis show the average movement duration of each condition. (G) Thresholded maps for each condition superimposed on the forelimb motor map. Red pixels darkened in the post-movement frame (5-frame average) as compared to the baseline frame (t-test, p < 0.0001). Dashed yellow lines mark cortical borders. (H) Percentage of forelimb representations with red pixels from (G). Bar colors match (C). (I) Same quantification in (H) expressed as a function of trial duration. Thresholded maps were generated at every time point (0.1 s) with a t-test (p < 0.0001) comparison of the frame at the time point and the baseline frame. (J–L) Same as (G–I), but for monkey S.
Figure 5—figure supplement 1
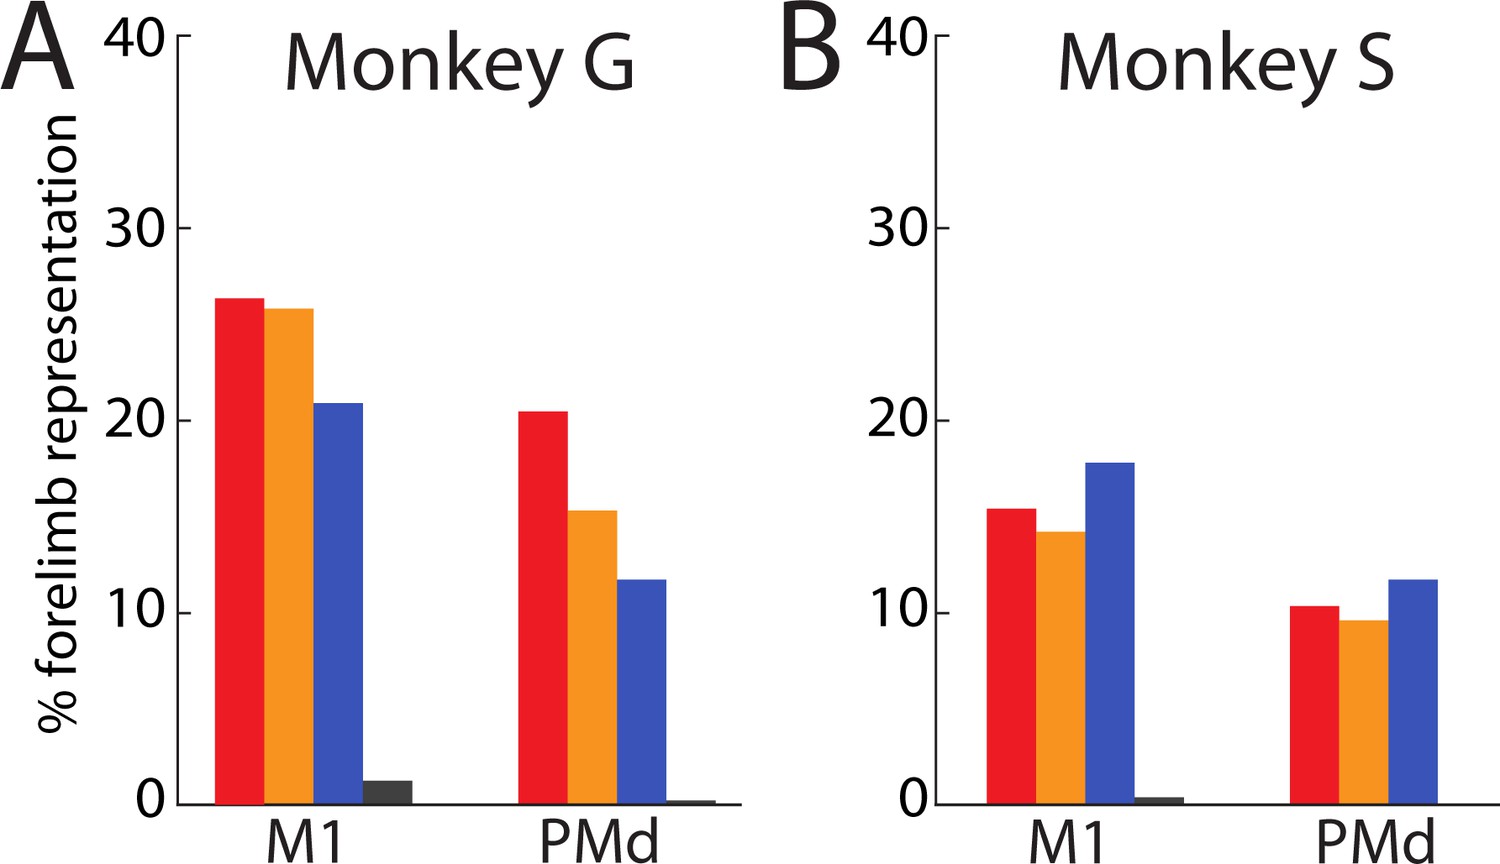
Thresholded maps corrected for multiple comparisons overlap small parts of the forelimb representations.
(A, B) Same as Figure 5H, K but quantified here from a threshold corrected for multiple comparisons (p < 1e−7).
Figure 5—figure supplement 2
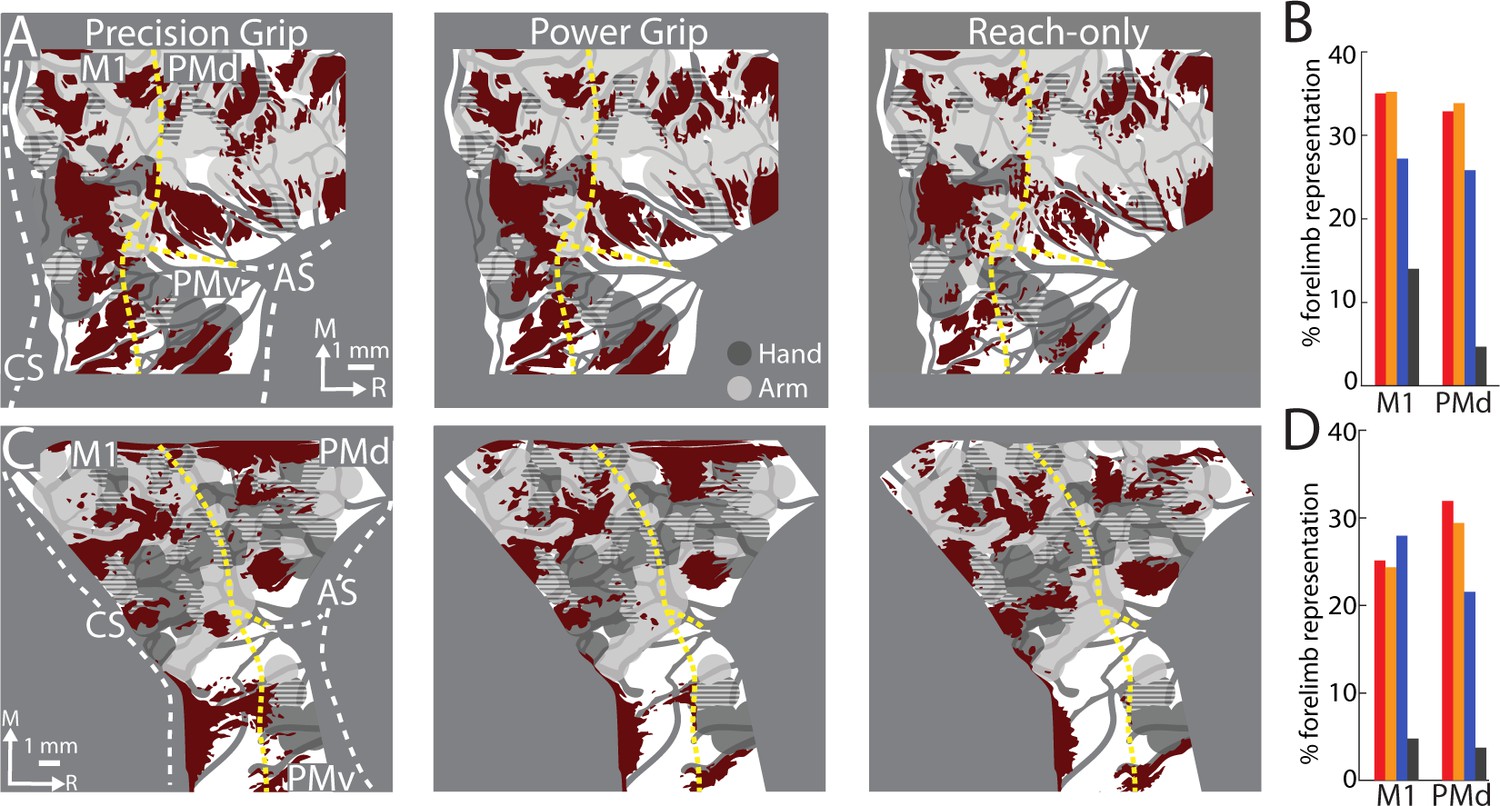
Thresholded maps from all post-movement frames overlap small parts of the forelimb representations.
(A–D) Same as Figure 5G–H and J–K, but the movement frame here was an average of 39 frames (+2.2 to +6.0 s from Cue).
Figure 6
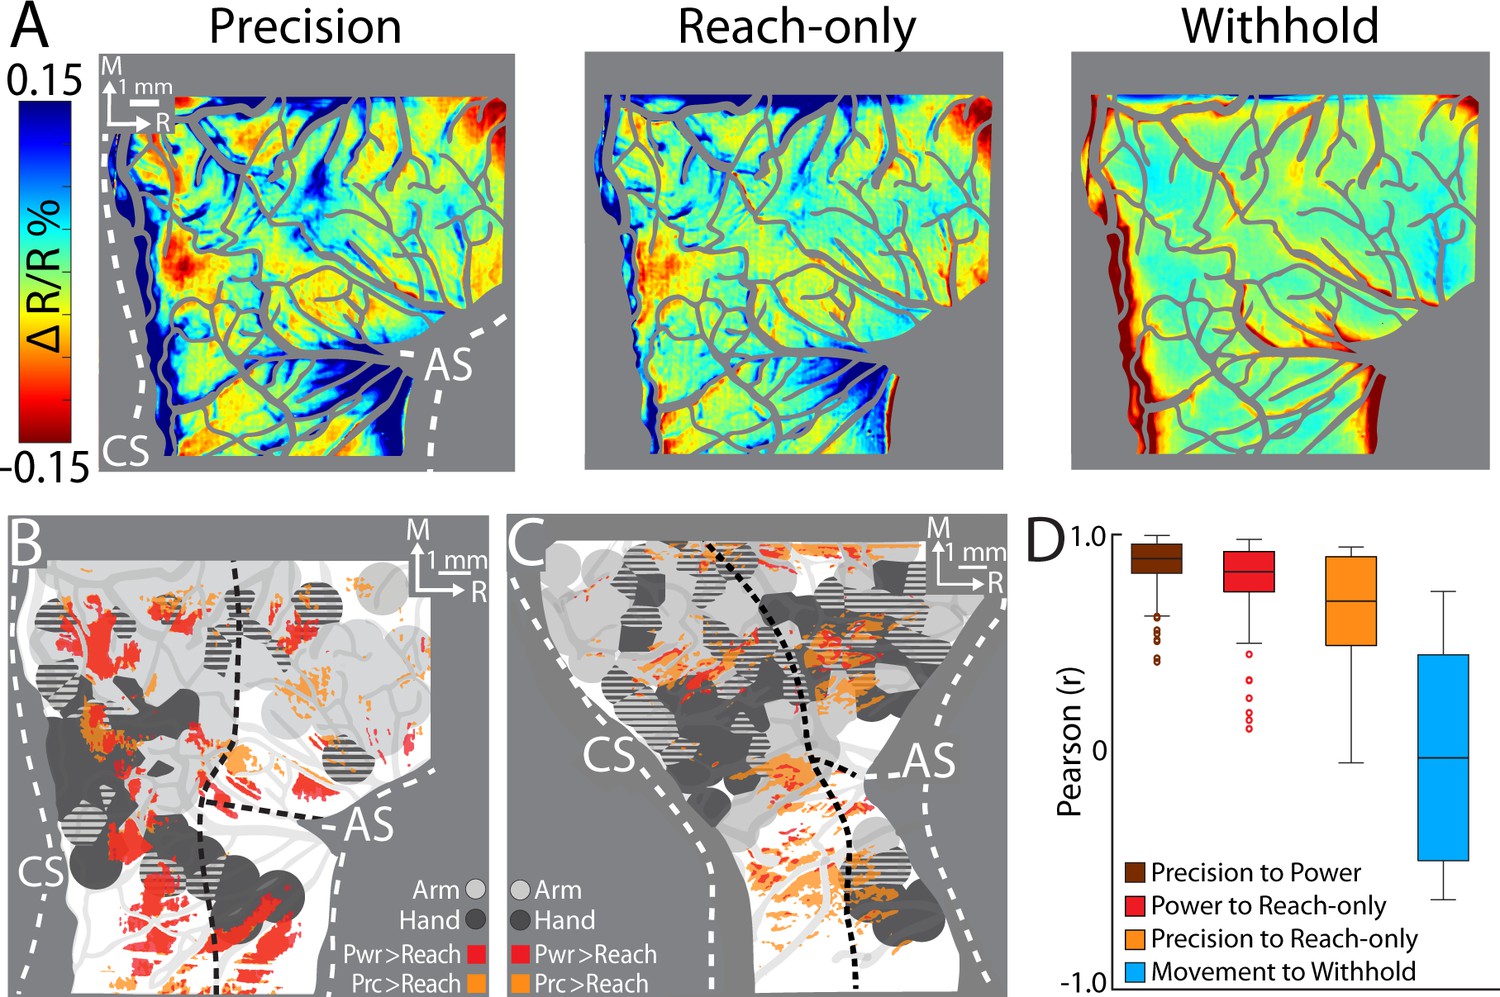
Comparing cortical activity between conditions.
(A) Movement frames (+2.2 to +6.0 s from Cue) averaged across conditions (n = 326–358 trials, monkey G). Reflectance change was clipped to the median pixel value ±1.5 standard deviation (SD) among all conditions. (B) Thresholded maps from two paired-comparisons. Red and orange pixels flag locations that darkened significantly in the power (pwr) and precision (prc) conditions, respectively, over the reach-only (t-test, p < 0.001). Dashed black lines mark cortical area borders. (C) Same as (B) for monkey S. (D) Cross-correlation distributions of trial averaged frames for conditions pairs. A data point here is the coefficient from cross-correlating (zero lag) one trial averaged frame of a condition with the time-matched frame of another condition. Each box, therefore, included 78 points (39 frames × 2 monkeys). The top and bottom of each box are the first and third quartiles of the data; whiskers span 1.5× the interquartile range. The blue box includes 234 points from comparing three movement conditions to the withhold condition (39 frames × 3 comparisons × 2 monkeys).
Figure 7
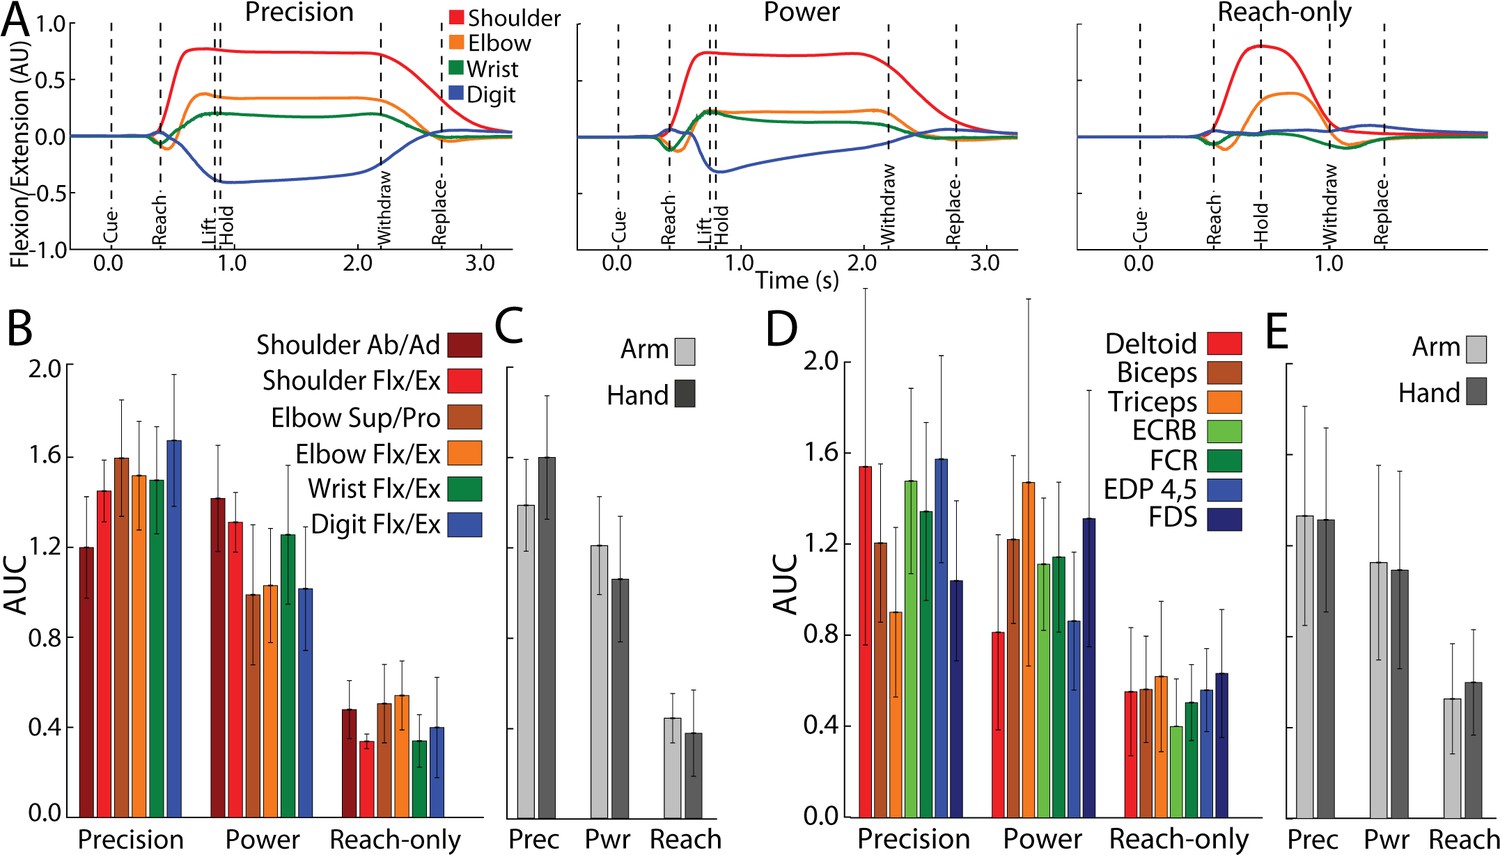
Forelimb activity scales across conditions.
(A) Mean flexion/extension changes in two arm joints and two hand joints as a function of time in the three movement conditions (5–15 sessions, 143–405 trials, monkey G). Y-axis scale is arbitrary units (AU). (B) Area under the curve (AUC, mean ± standard deviation [SD]) for joint activity from trials in (A). (C) Pooled AUC (mean ± SD) for joint activity in the three conditions. Shoulder and elbow joints were classified as arm. Wrist and digit joints were classified as hand. (D, E) Same as (B, C), but for muscle activity (6–14 sessions, 308–595 trials, monkey G). Deltoid, biceps and triceps were classified as arm. ECRB (extensor carpi radialis brevis), EDP (extensor digitorum profondus), FCR (flexor carpi radialis) and FDS (flexor digitorum superficialis) were cassified as hand.
Author response image 1

Author response image 2
Videos
Video 1
Pixel darkening in intrinsic signal optical imaging (ISOI) lags movement.
Left: Representative trial from the precision grip condition filmed from overhead (monkey G). The task was performed with left forelimb and the right forelimb was restrained. Video plays at half-speed. Time in bottom right is relative to start of ISOI acquisition; Cue onset was at 1.0 s. Movement started at 1.3 s and was complete by 3.6 s. Right: Average ISOI time series (8 sessions, 404 trials) from the same condition. In addition to the image processing described in the methods, frames were temporally smoothed with a 5-frame sliding window. Note, that patches did not form until movement completion.
Additional files
Download links
A two-part list of links to download the article, or parts of the article, in various formats.
Downloads (link to download the article as PDF)
Open citations (links to open the citations from this article in various online reference manager services)
Cite this article (links to download the citations from this article in formats compatible with various reference manager tools)
Motor actions are spatially organized in motor and dorsal premotor cortex
eLife 12:e83196.
https://doi.org/10.7554/eLife.83196


