Pharmacometrics of high-dose ivermectin in early COVID-19 from an open label, randomized, controlled adaptive platform trial (PLATCOV)
- Mahidol Oxford Tropical Medicine Research Unit, Faculty of Tropical Medicine, Mahidol University, Thailand
- Centre for Tropical Medicine and Global Health, Nuffield Department of Medicine, Oxford University, United Kingdom
- Department of Tropical Hygiene, Faculty of Tropical Medicine, Mahidol University, Thailand
- Department of Clinical Tropical Medicine, Faculty of Tropical Medicine, Mahidol University, Thailand
- Bangplee Hospital, Ministry of Public Health, Thailand
- Department of Molecular Tropical Medicine and Genetics, Faculty of Tropical Medicine, Mahidol University, Thailand
- Faculty of Medicine, Navamindradhiraj University, Thailand
- Faculty of Science and Health Technology, Navamindradhiraj University, Thailand
- Department of Biochemistry and Immunology, Universidade Federal de Minas Gerais, Brazil
Figures
Figure 1 with 1 supplement
Summary of patient characteristics included in the mITT population (n=96).
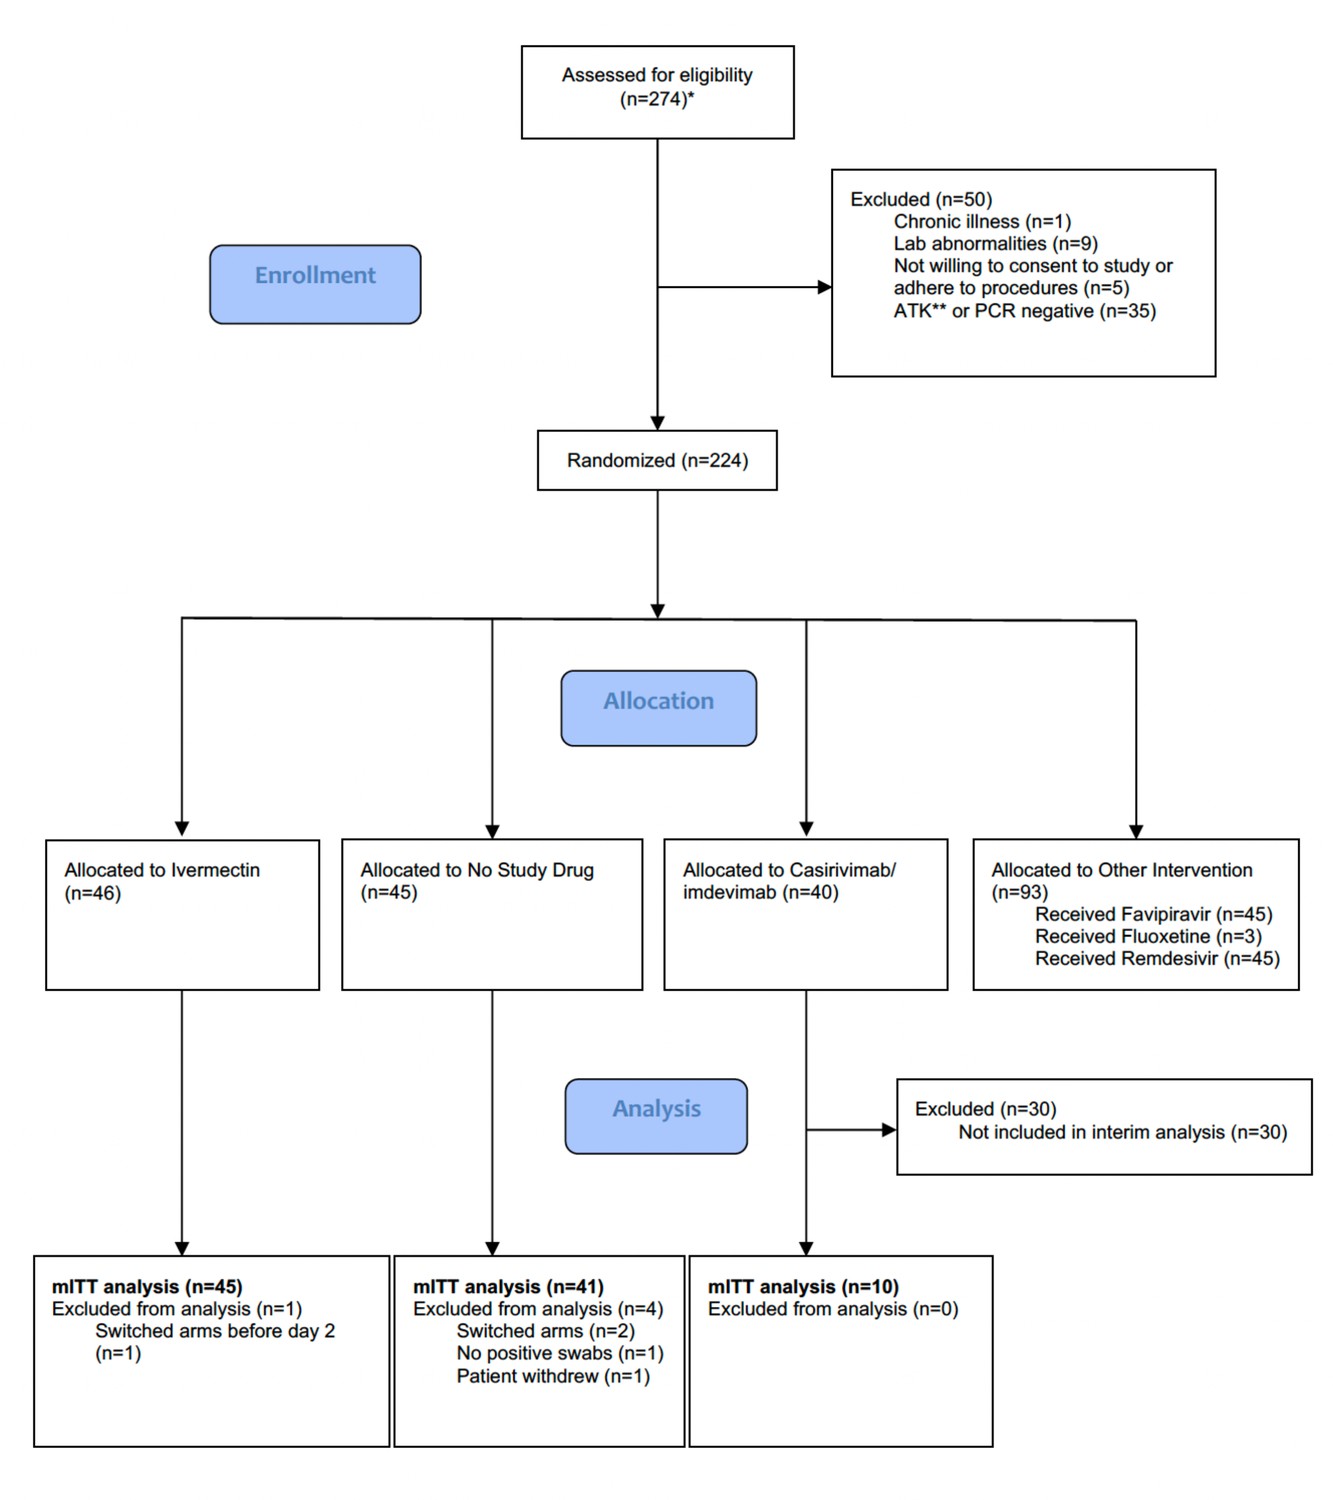
Study CONSORT diagram for the ivermectin analysis. *Prescreening occurred in the hospitals’ Acute Respiratory Infection (ARI) units. Potentially eligible participants (based on age, duration of symptoms, reported comorbidities, and a willingness to consider study participation) were selected by the ARI Nurses to be contacted by the study team. As a result, a high proportion of those assessed for eligibility participated in the study. **SARS CoV-2 Antigen Test Kit (STANDARD Q COVID-19 Ag Test, SD Biosensor, Suwon-si, Republic of Korea). mITT, modified intention-to-treat.
Figure 1—figure supplement 1
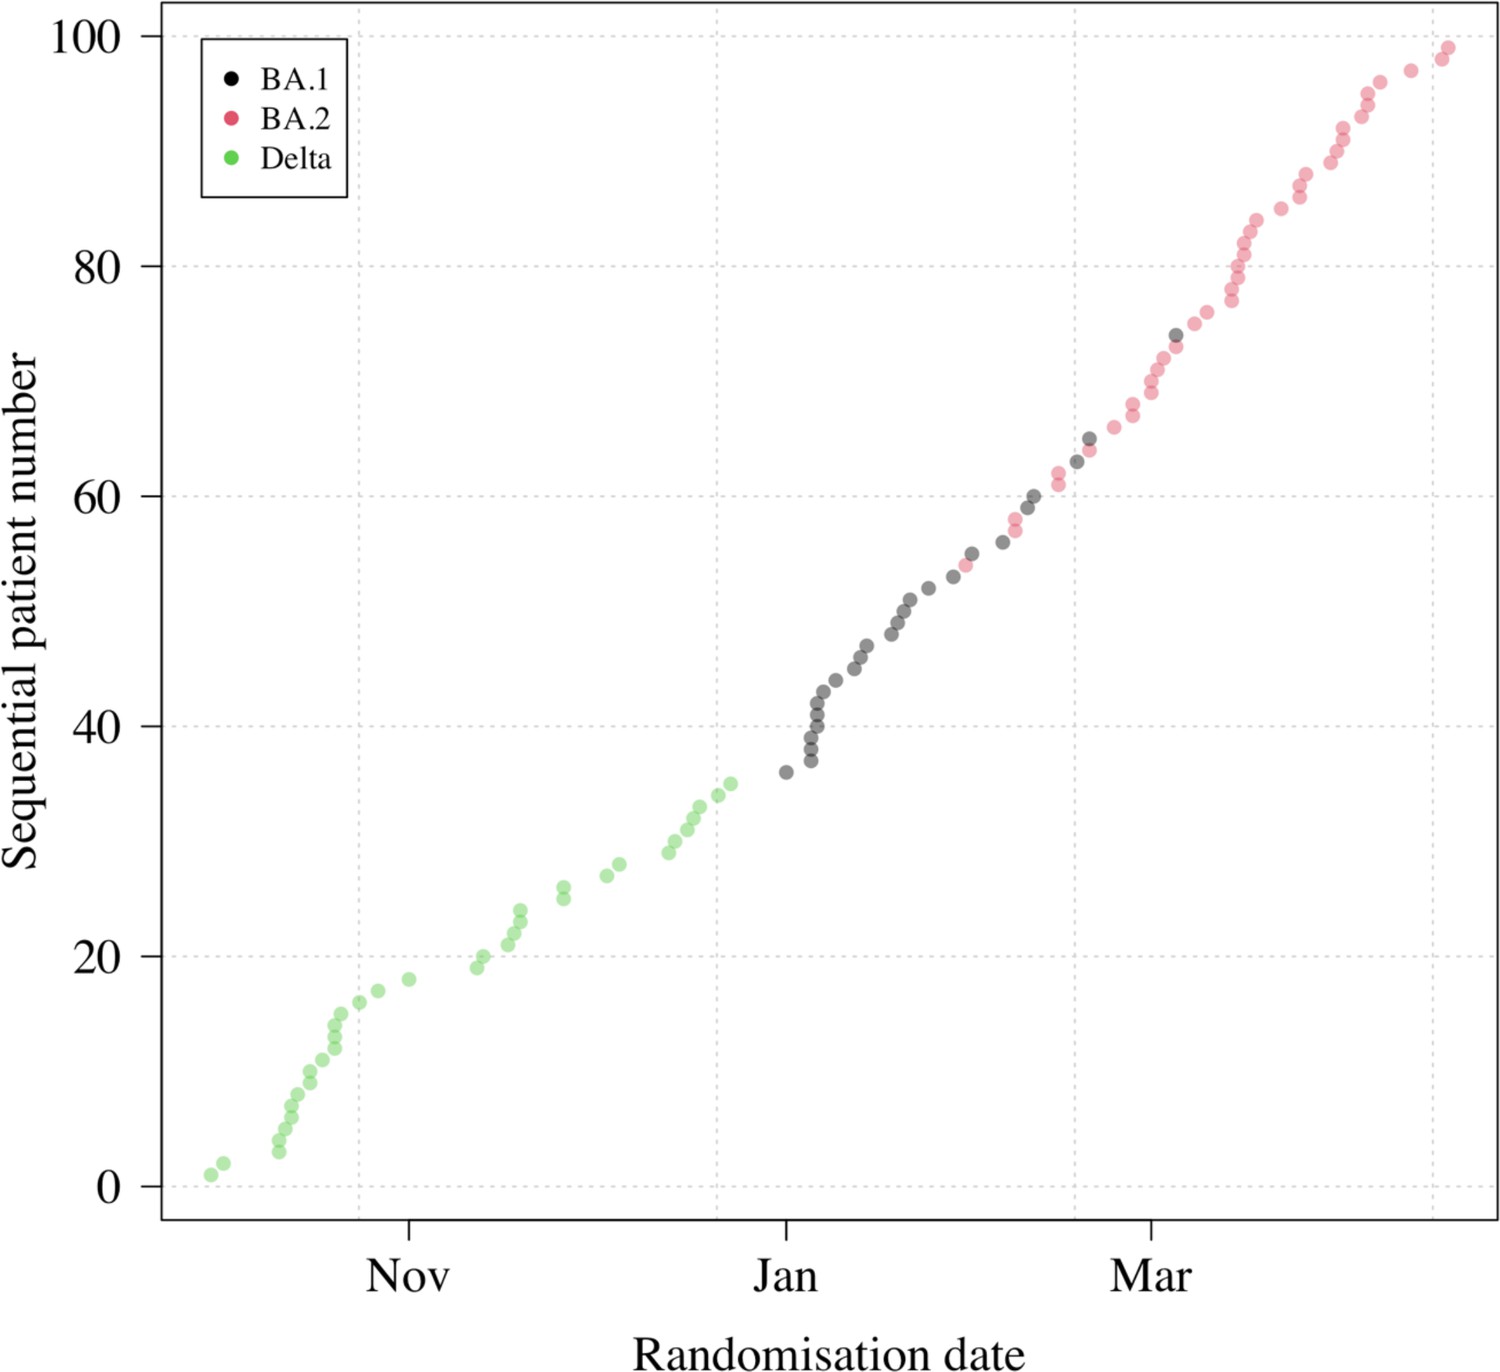
Randomization dates and virus variants of all patients with available PCR data (n=99).
This excludes two patients: one who had no detectable virus (likely an enrolment error); and one who left the study following randomization (no swabs were taken). All patients included in the analysis had their virus genotyped (none were imputed).
Figure 2
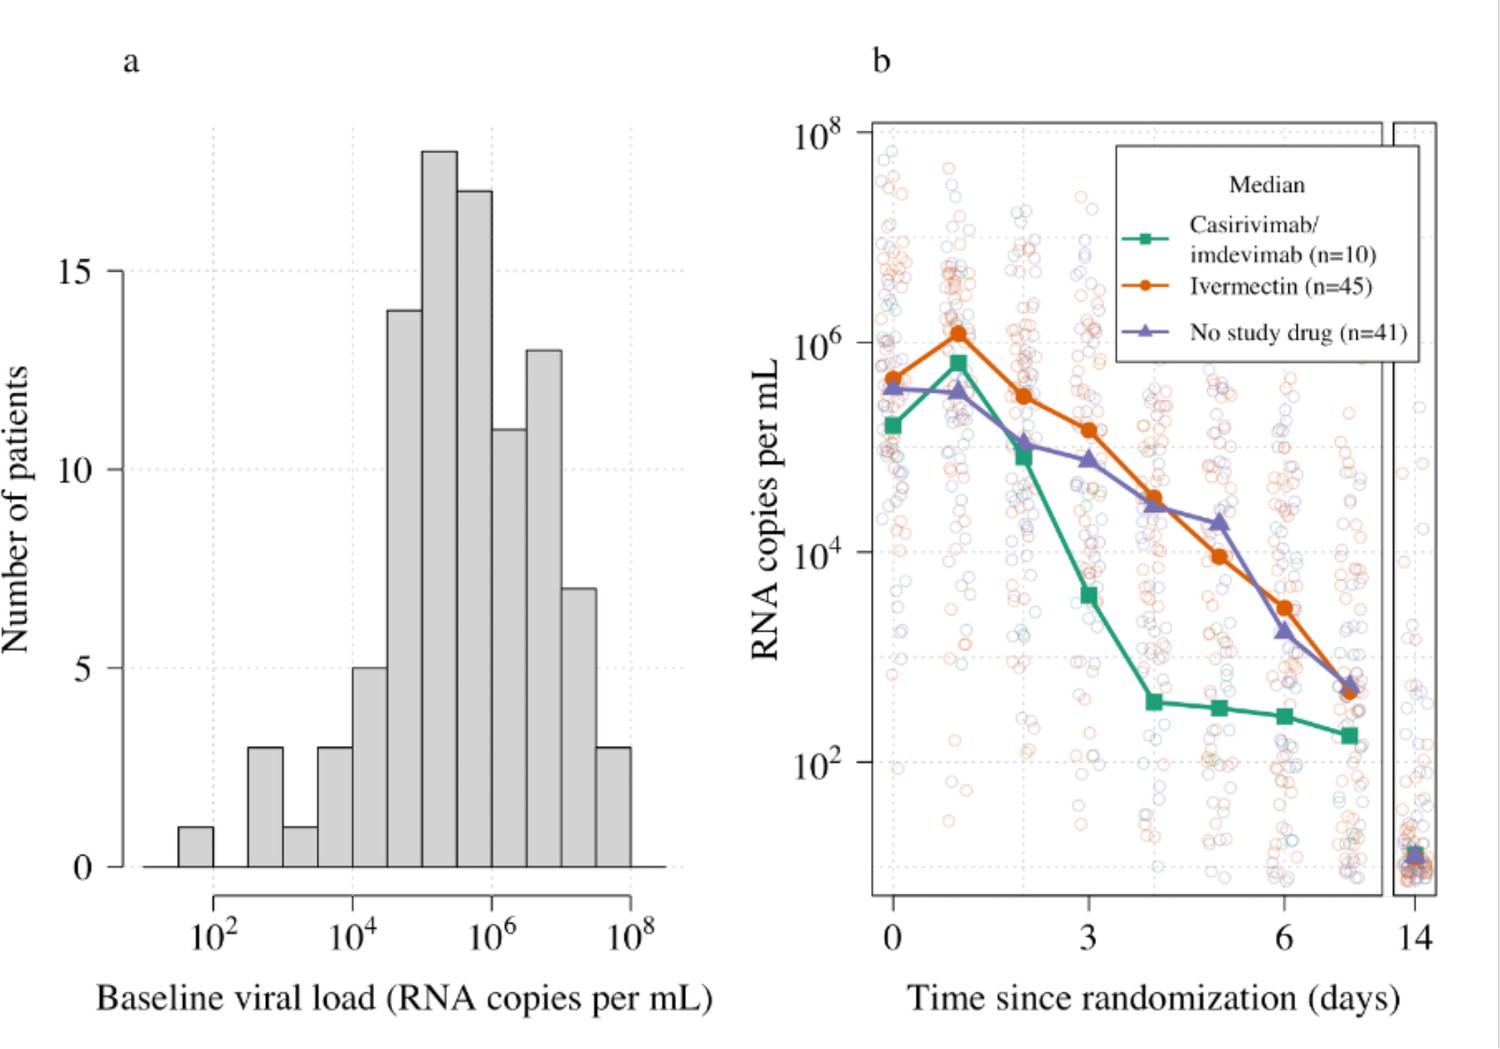
Summary of oropharyngeal viral load data in the analysis data set (n=96).
(a) Distribution of viral loads at randomization (median of 4 swabs per patient). (b) Individual serial viral load data with x-axis jitter. Median values by study arm are overlaid. The day 14 samples are not used in the primary analysis.
Figure 3
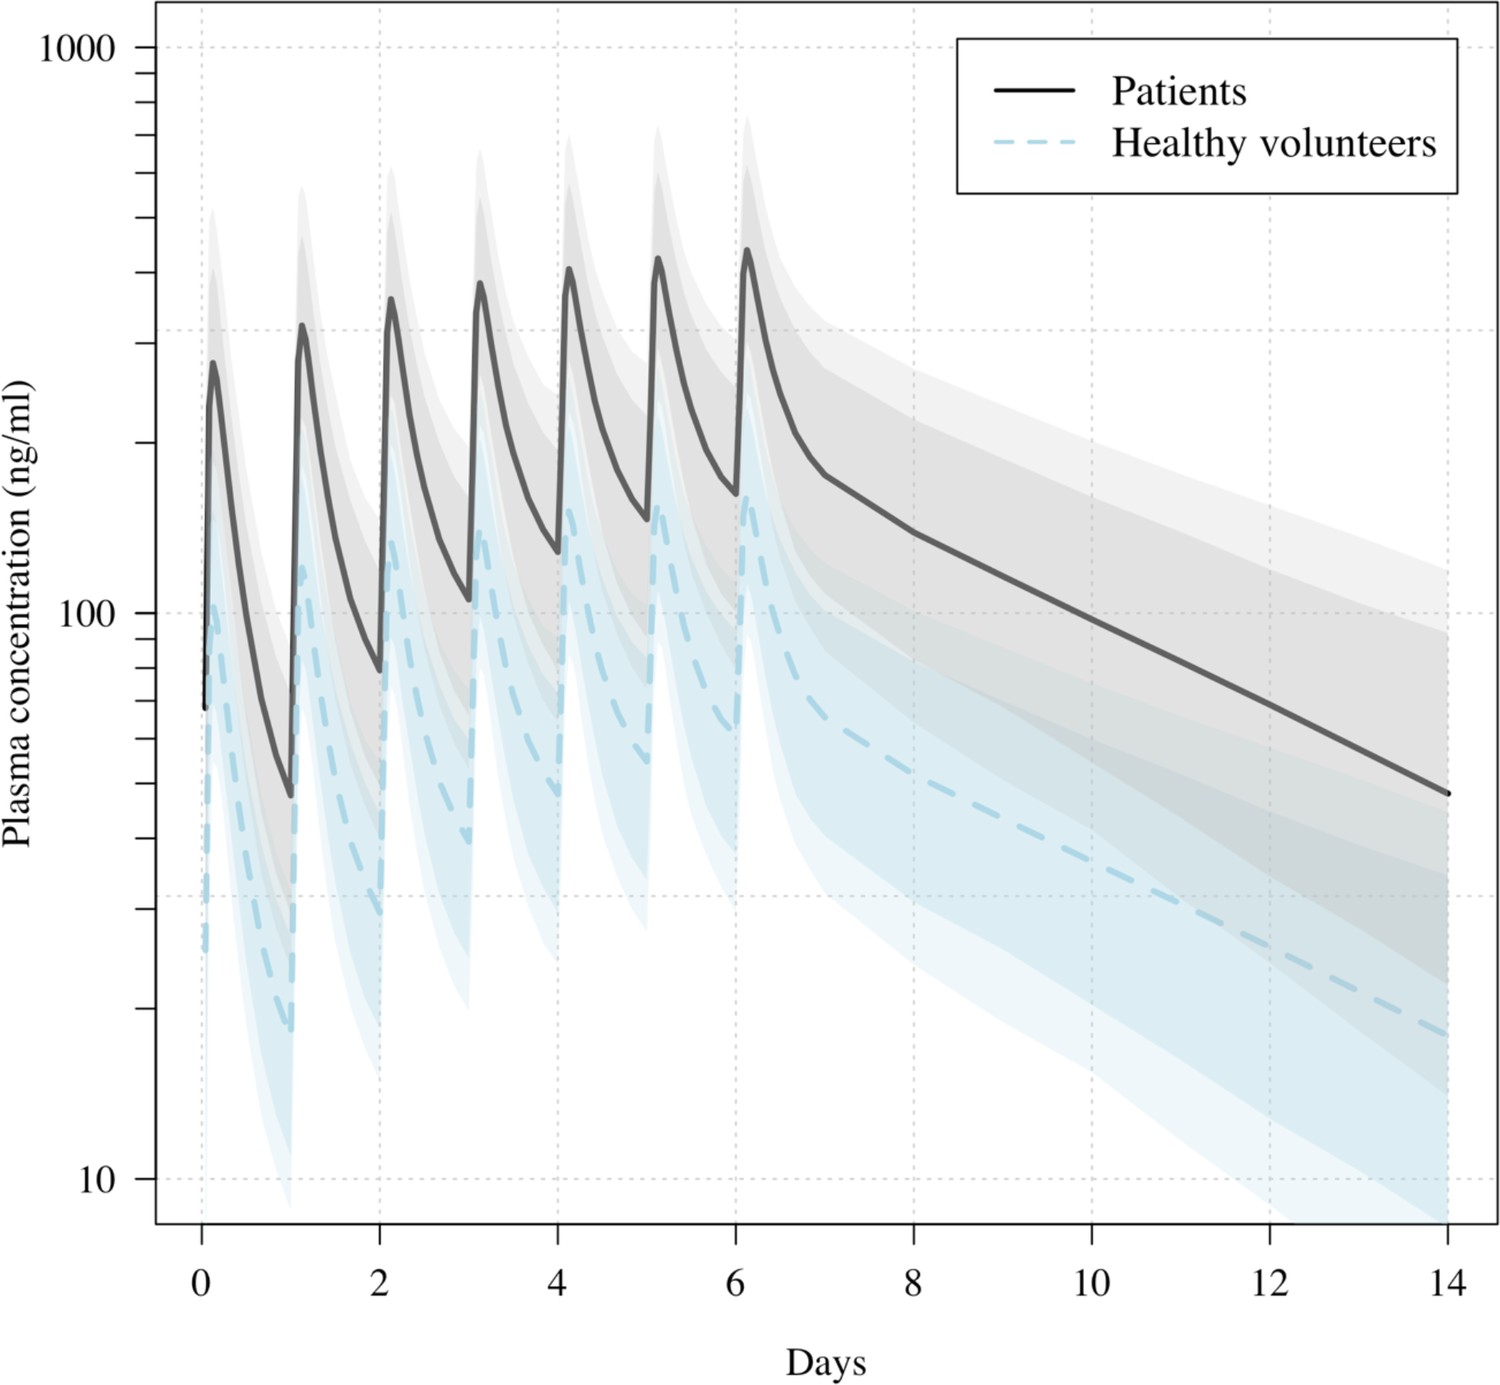
Predicted ivermectin plasma concentrations over time under the population PK model fit to data from healthy volunteers (Kobylinski et al., 2020), and the ivermectin patients in the PLATCOV study.
Mean predicted concentrations with 80% and 95% confidence intervals are shown for daily dosing of 600 μg/kg ivermectin in a 70 kg adult over 1 week for patients (thick line) and healthy volunteers (dashed line). The mean relative bioavailability in patients compared to healthy volunteers was estimated as 2.6.
Figure 4 with 3 supplements
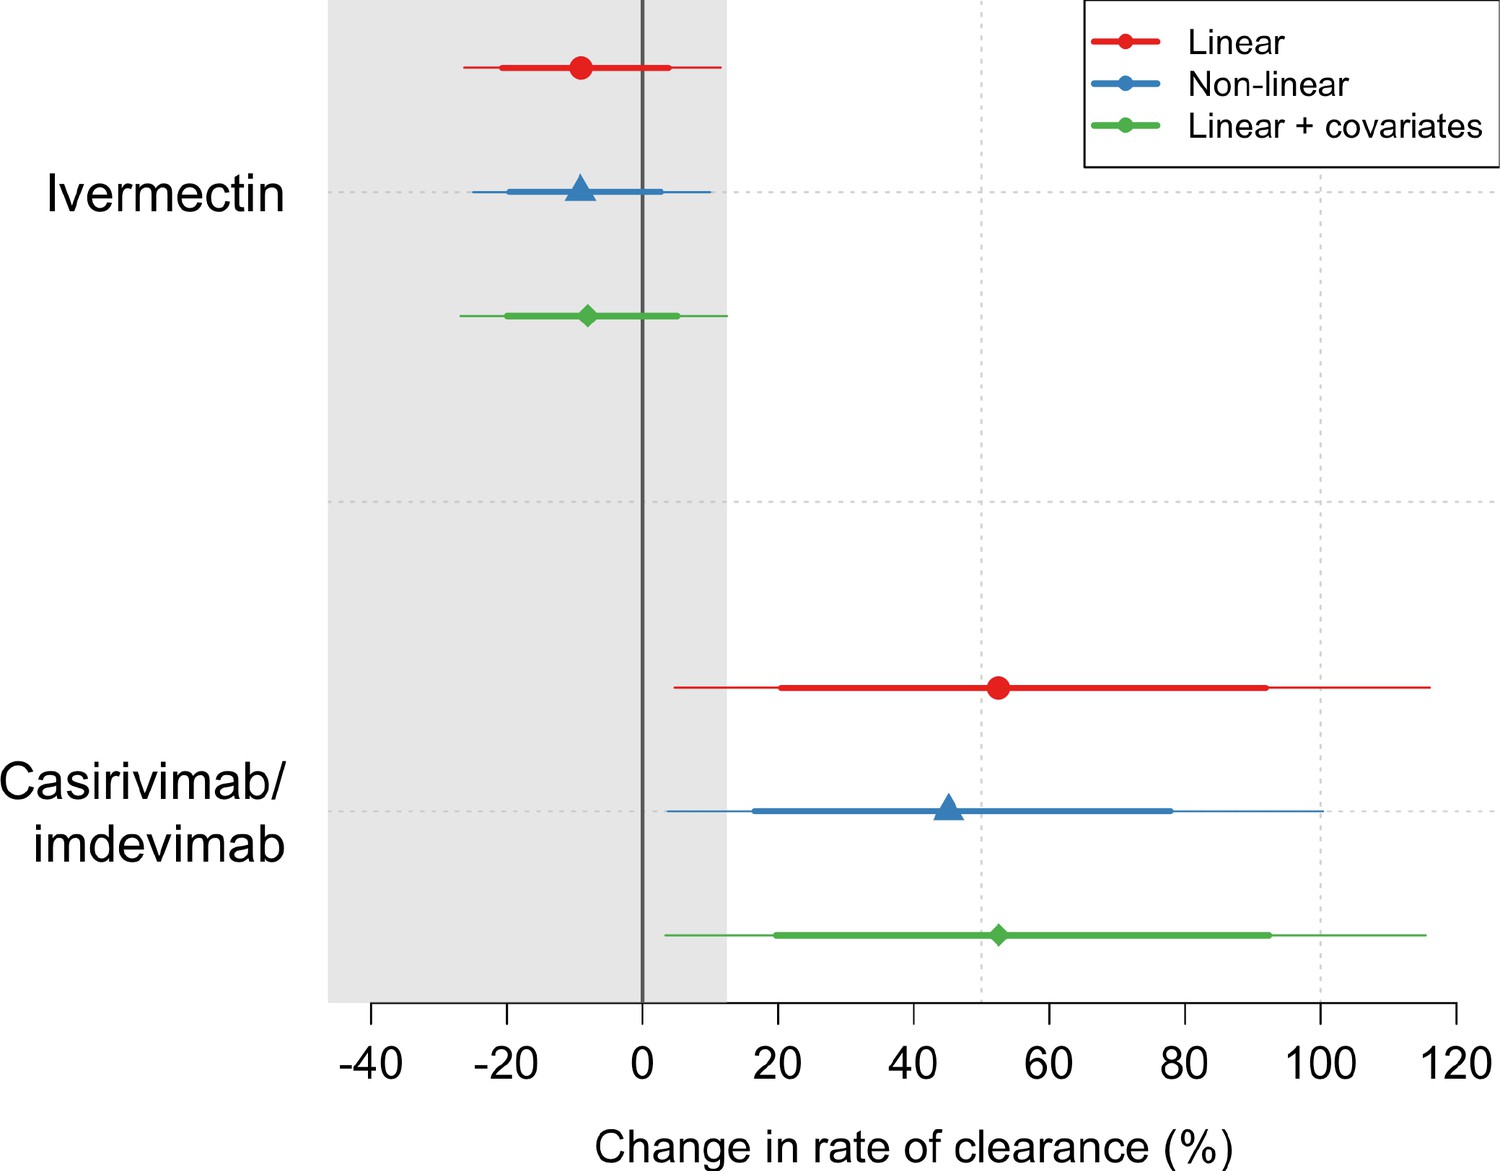
Treatment effects mean posterior estimates of the differences in the rate of viral clearance (thick dots) compared to the no study drug arm.
80% (thick lines) and 95% (thin lines) credible intervals under three hierarchical Bayesian models are shown. The gray area shows the futility zone (<12.5% increase in the rate of viral clearance). Results from three models are shown. The main model used to report effect estimates in the text is the linear model (red).
Figure 4—figure supplement 1
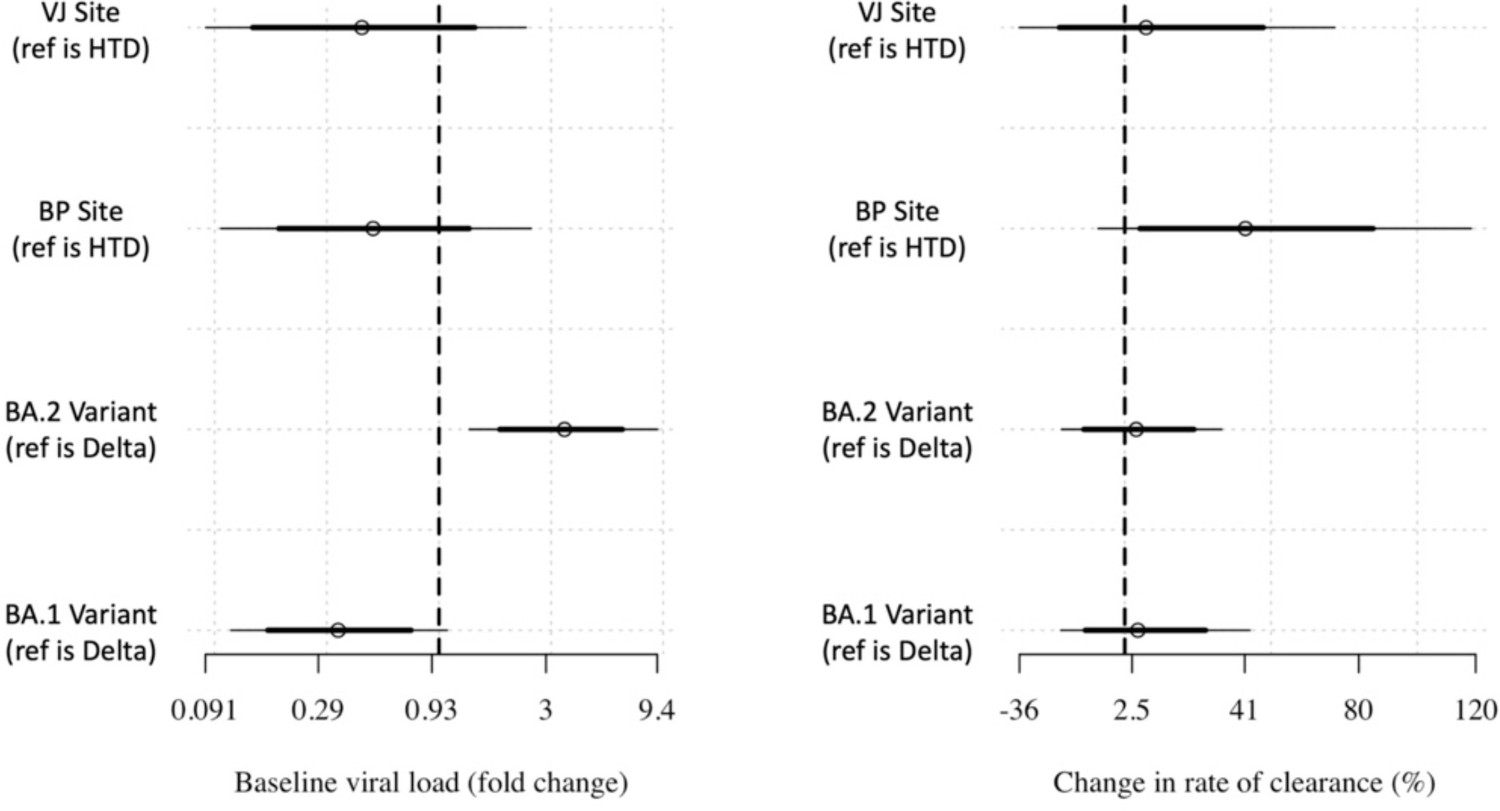
Covariate effects estimated for the main analytical linear model.
Figure 4—figure supplement 2
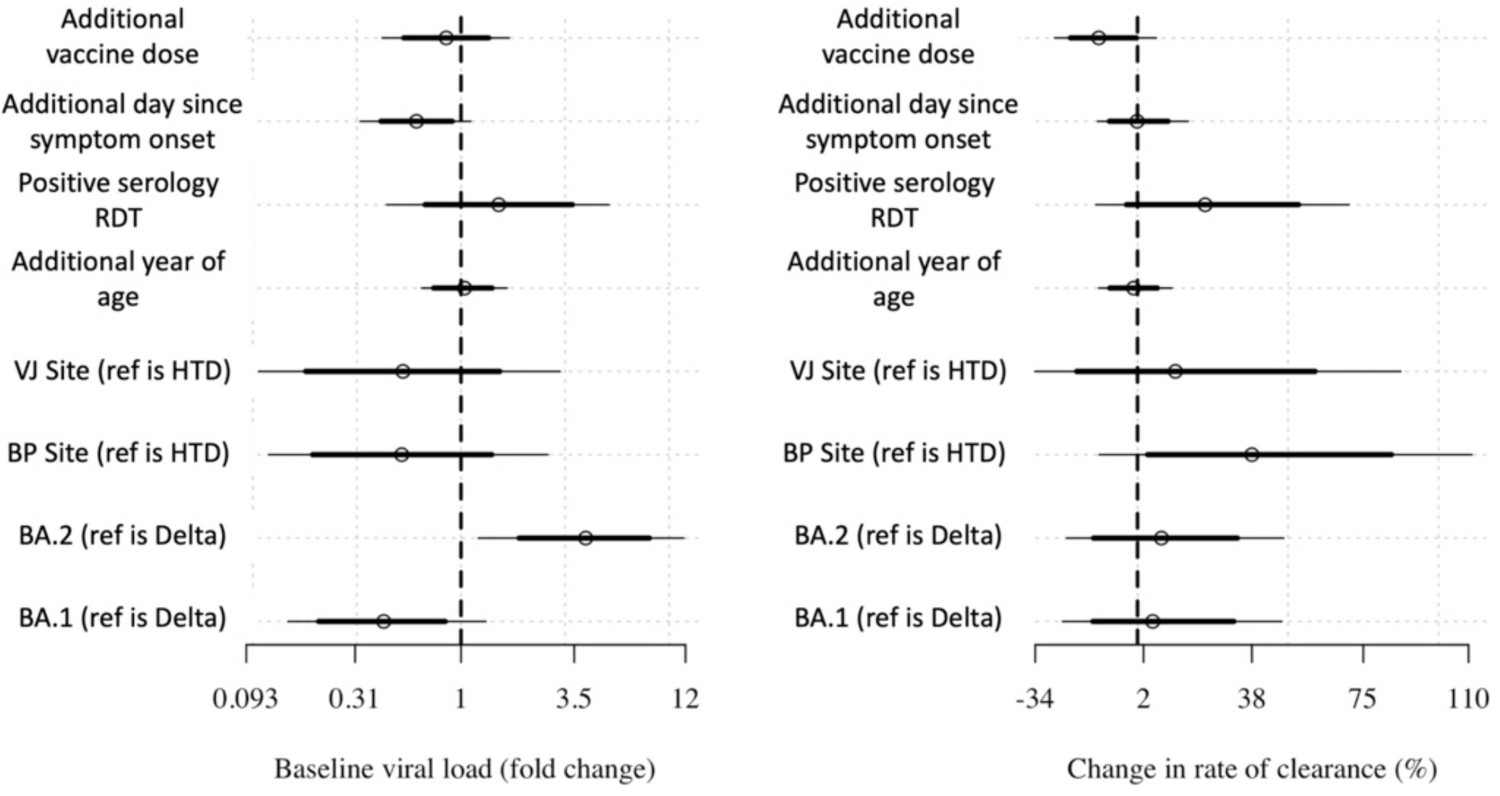
Covariate effects on the intercept and slope.
Covariate effects on intercept (left) and slope (right) for the linear model with additional covariate adjustment.
Figure 4—figure supplement 3
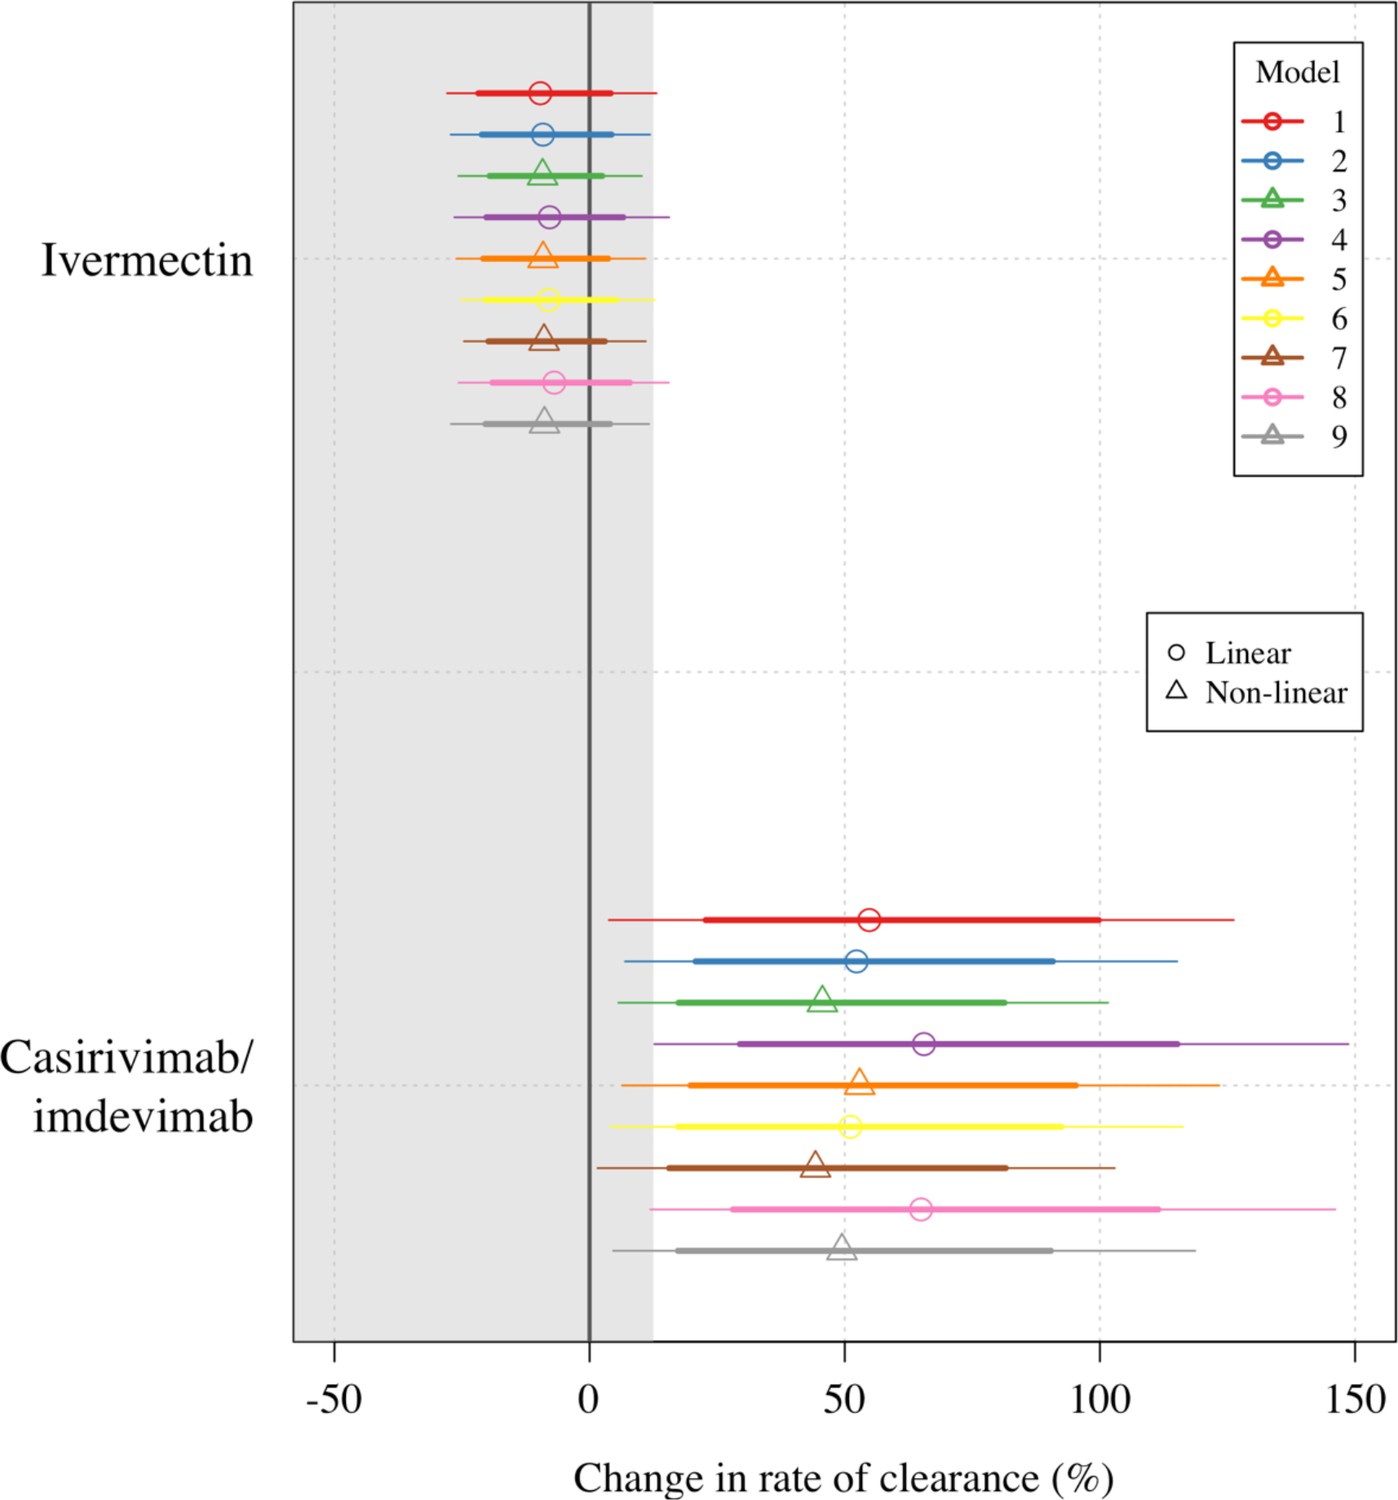
Treatment effect estimates for all nine models fit to the data.
Circles/triangles show the mean posterior estimates (circles: linear models; triangles: nonlinear models); thick lines: 80% credible intervals; thin lines: 95% credible intervals. A description of each model is given in the Statistical analysis section above.
Figure 5 with 2 supplements
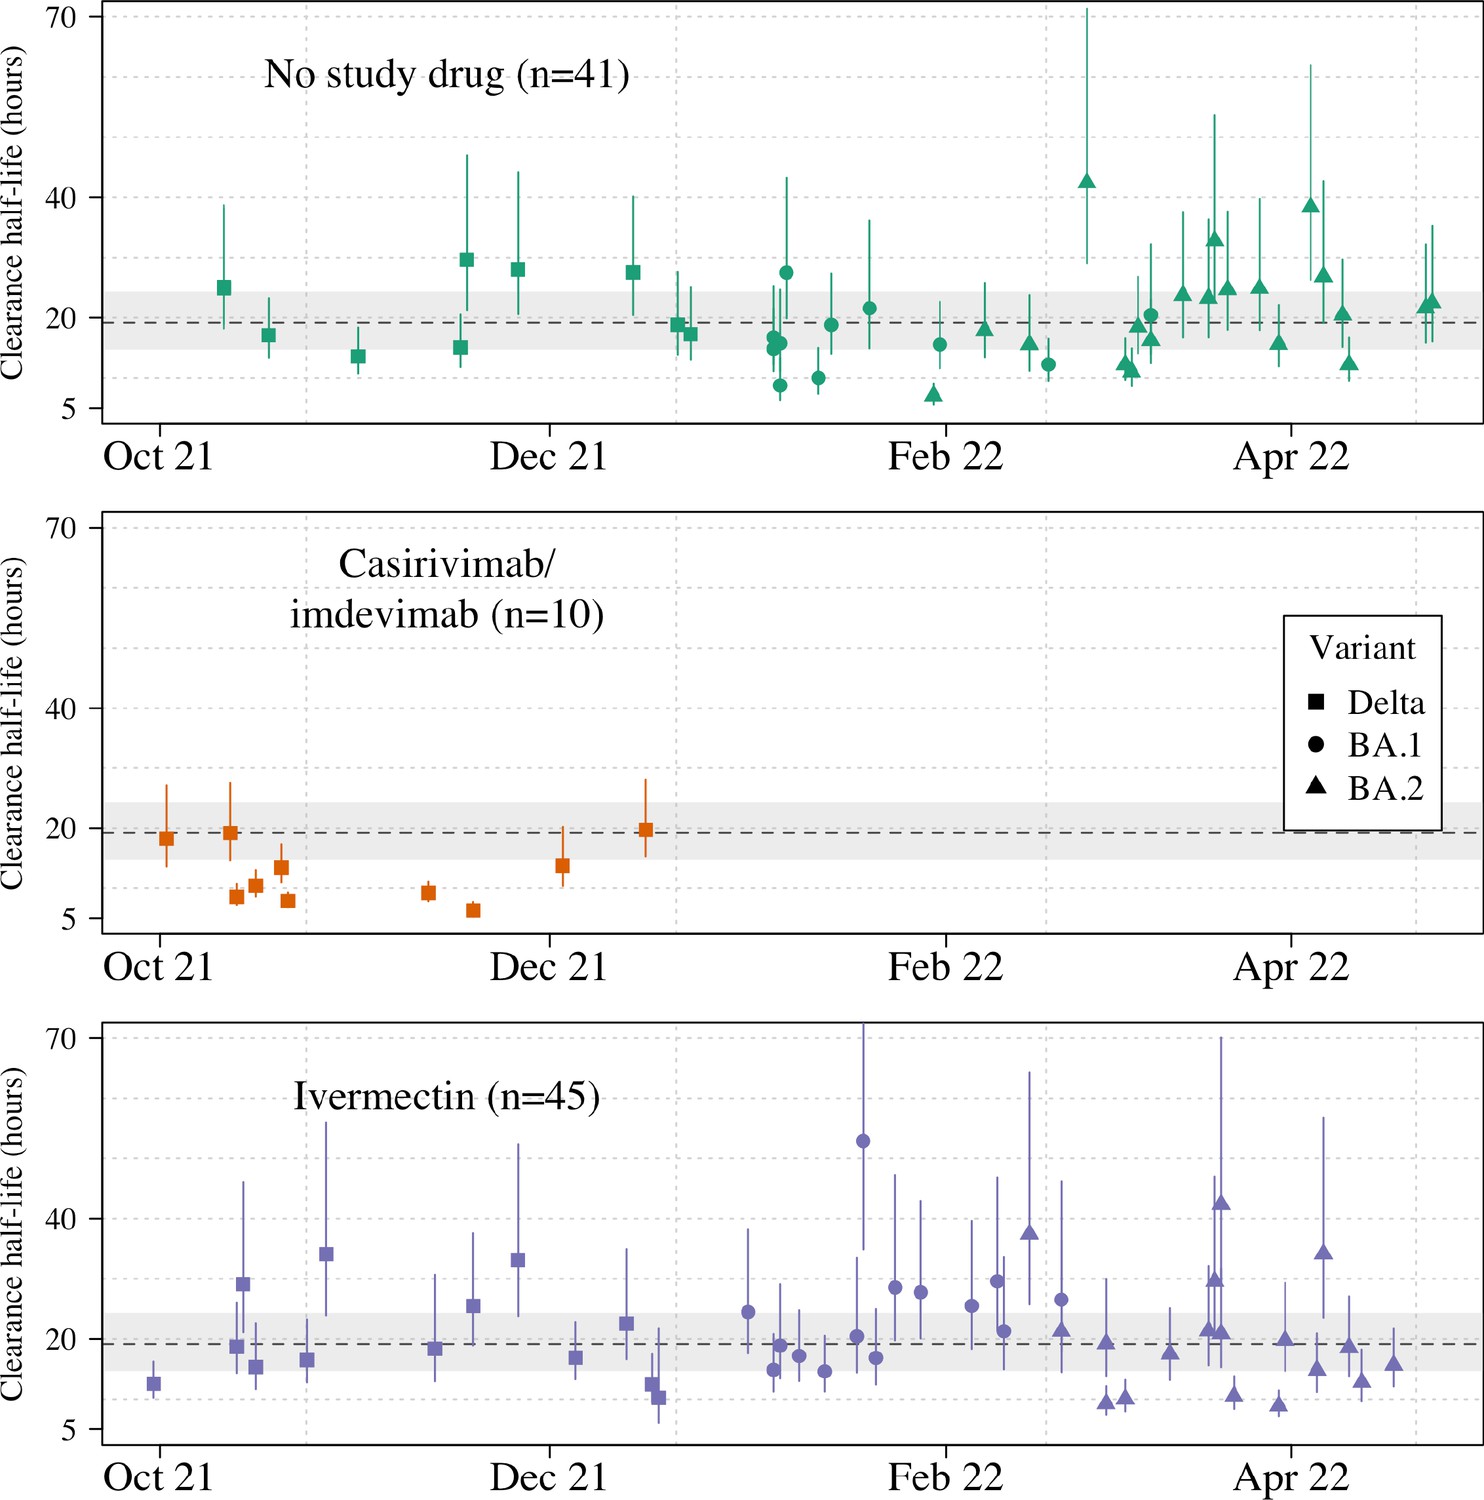
Individual patient virus clearance half-life estimates over time.
The individual oropharyngeal virus clearance half-life mean posterior estimates with 95% credible intervals (lines) are shown (squares/circles/triangles corresponding to the virus genotype: temporarily Delta, Omicron BA.1, Omicron BA.2, respectively). The model estimated mean clearance half-life (95%CI) in untreated patients is shown by the grey line (dashed line-shaded area).
Figure 5—figure supplement 1
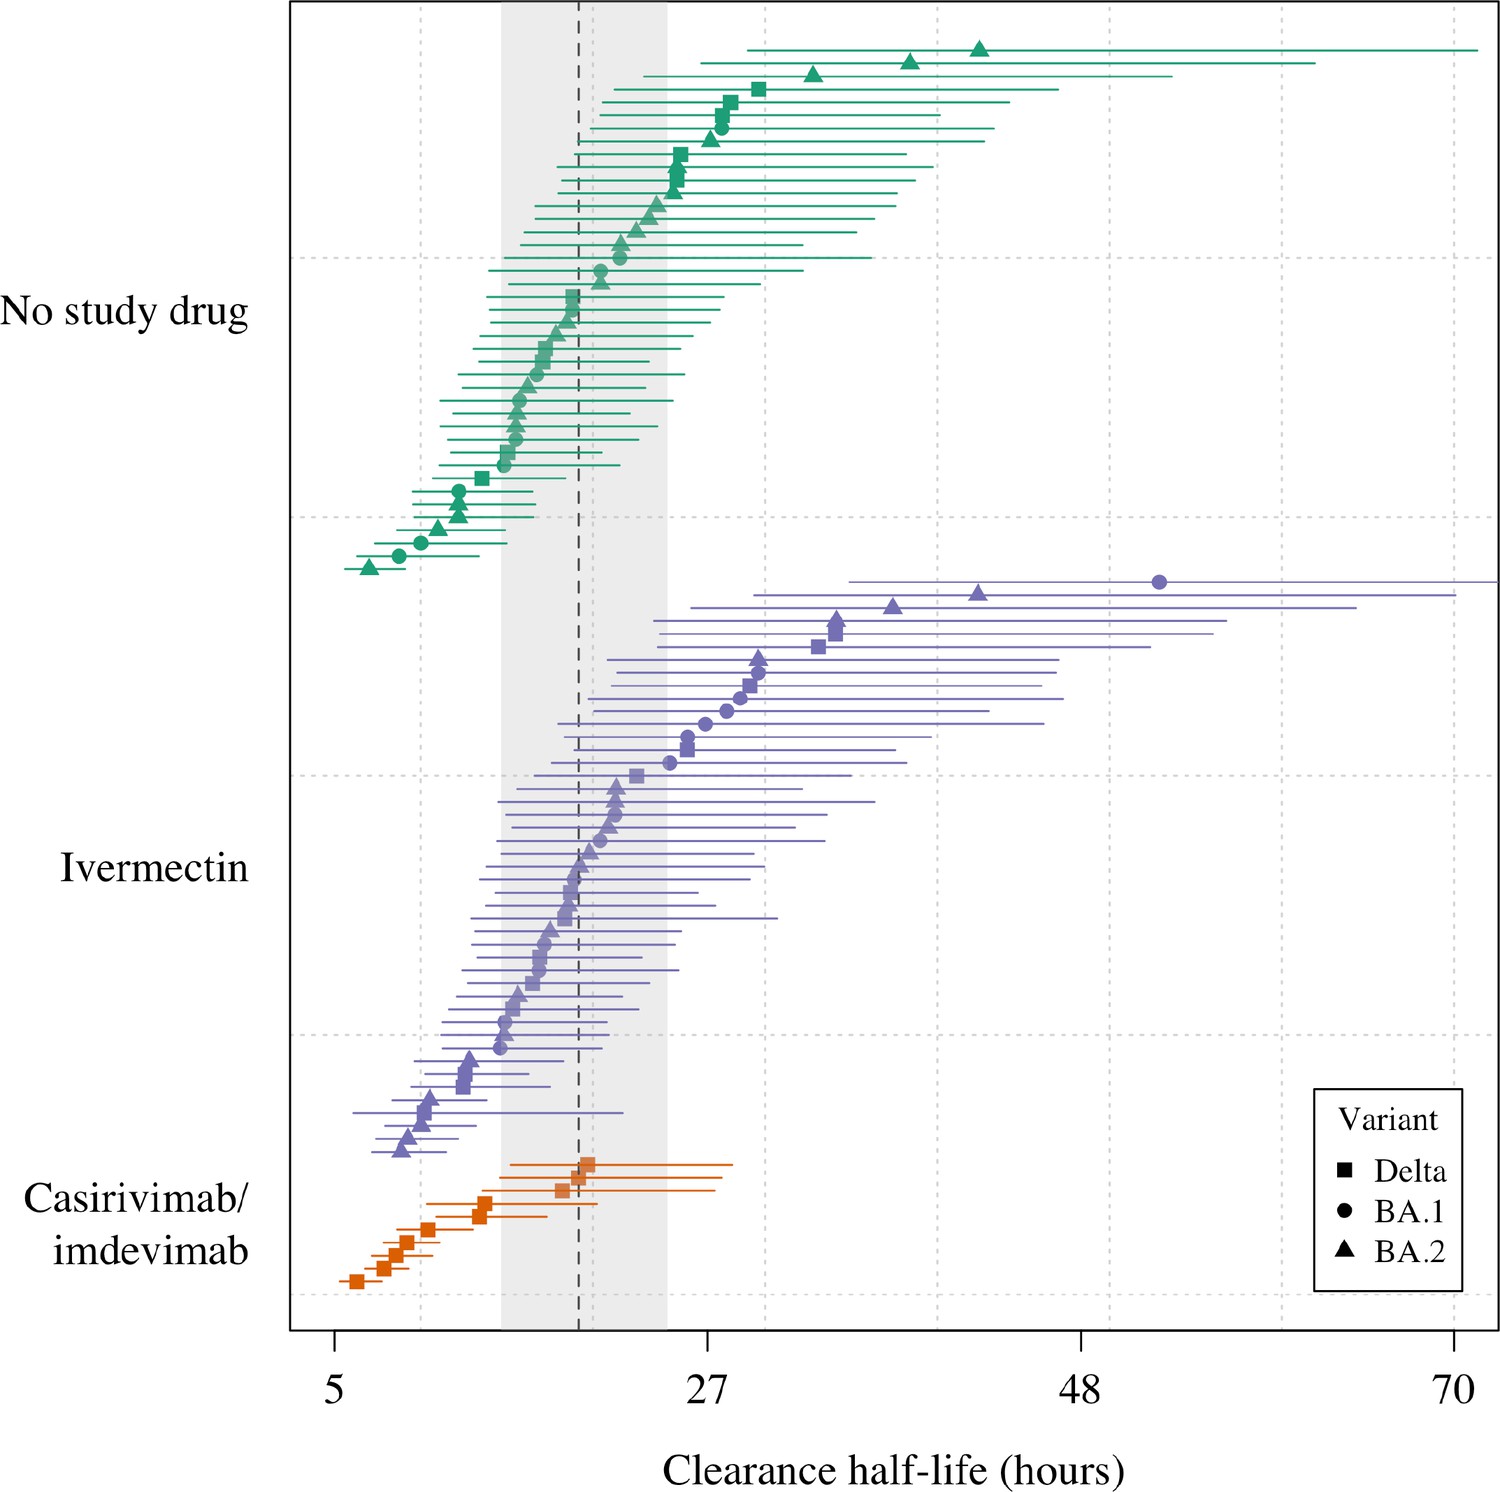
Estimated clearance half-lives in all patients in the mITT population (n=96), grouped by treatment arm and in order of decreasing rate of clearance.
The mean posterior estimated virus clearance half-lives are shown by the squares/circles/triangles (corresponding to the Delta, BA.1, and BA.2 variants, respectively). The vertical dashed line shows the posterior mean population virus clearance half-life (the gray shaded area is the 95% credible interval).
Figure 5—figure supplement 2
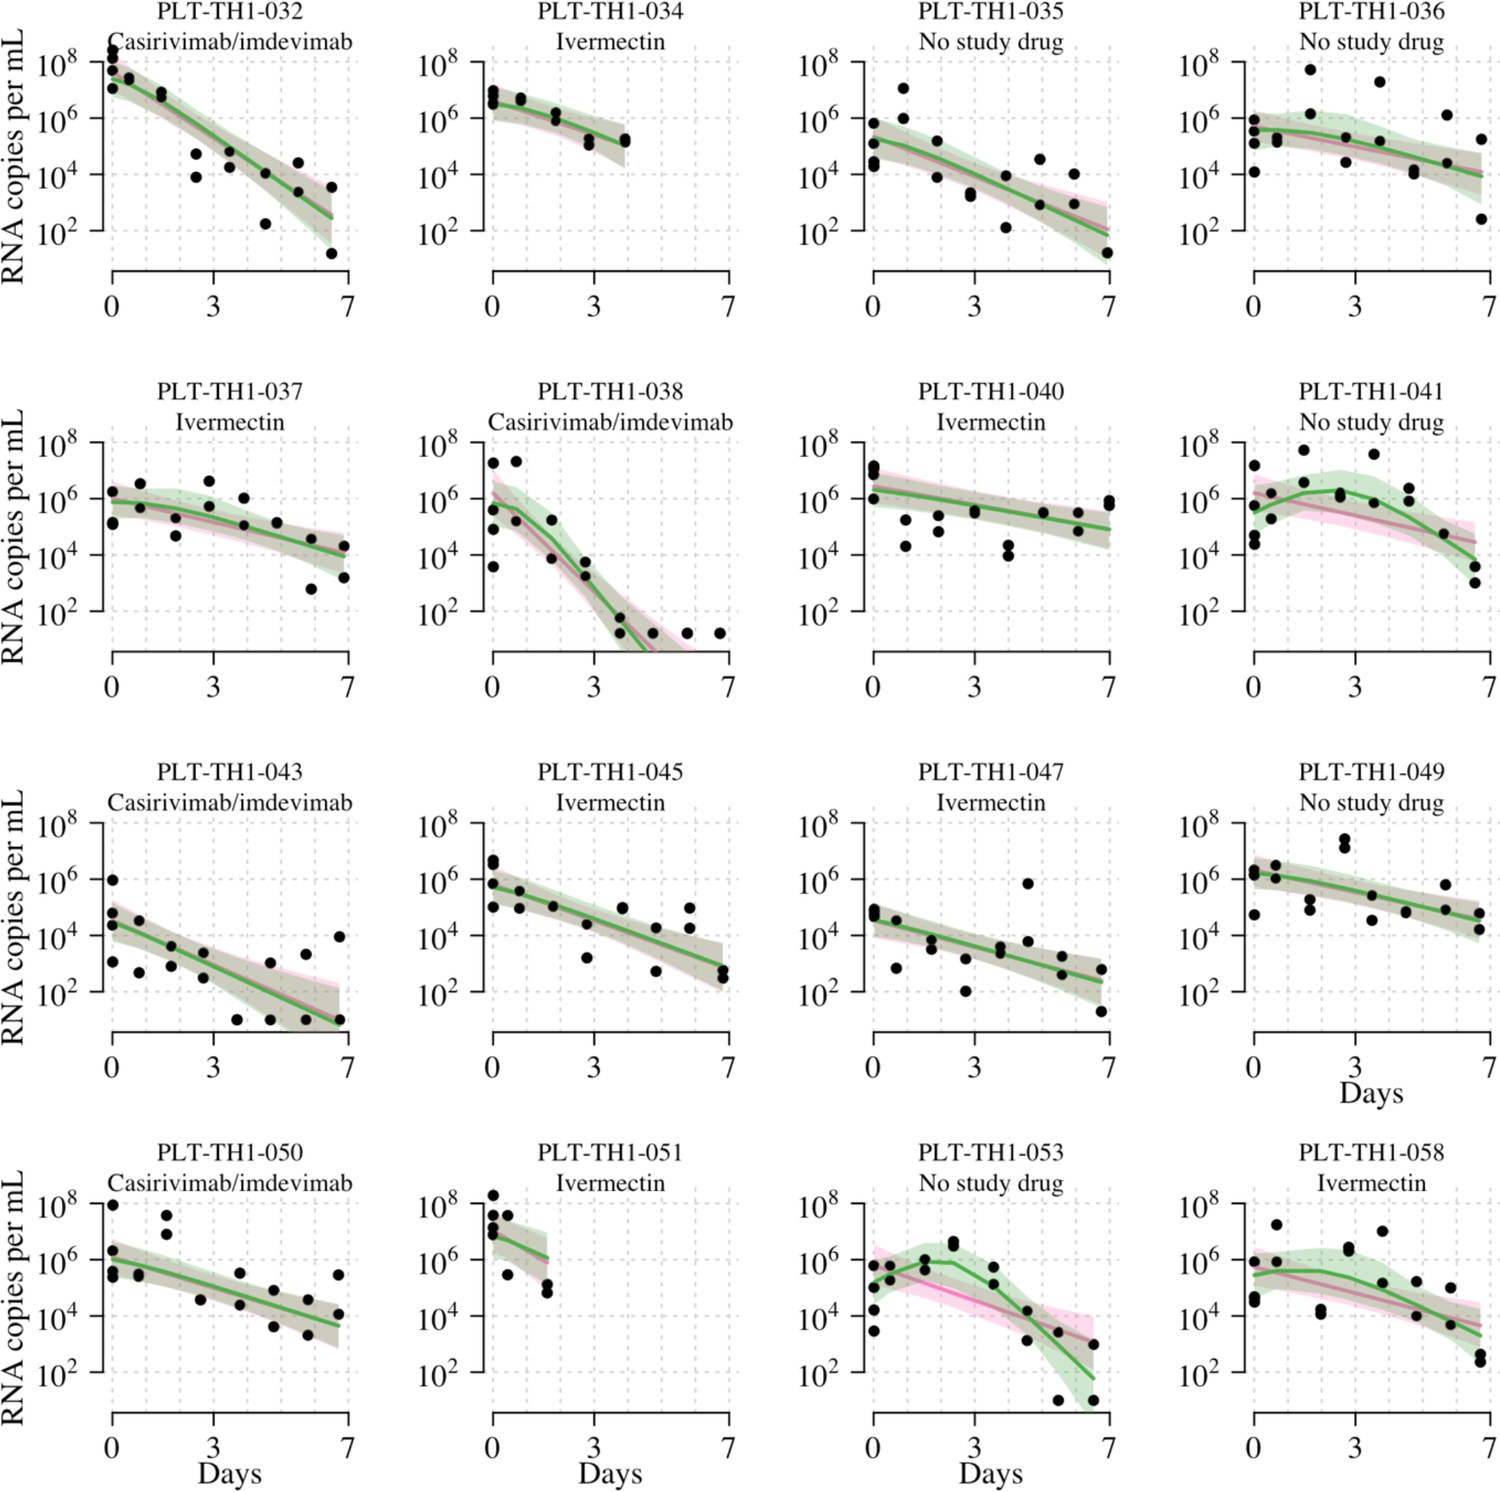
Individual fits to the serial qPCR data under the two main Bayesian hierarchical models (pink: linear model with RNase P adjustment; green: nonlinear model with RNase P adjustment).
Lines show mean fits; shaded areas show 95% credible intervals around fits. Black circles show viral load measurements for each independent swab. Only follow-up data included in the mITT analysis data set are shown (e.g., for patients who switched medication after day 2, we only show data up until the switch, i.e., the data that were used for the analysis). Site codes: TH1=HTD, TH57=BP, TH58=VJ.
Tables
Table 1
Ivermectin dosing table.
Daily dose of ivermectin given to patients based on weight.
| Weight in kg | Number of 6 mg tablets | Dose in mg | Dose in mg/kg |
|---|---|---|---|
| 40 to <50 | 4 | 24 | 0.49–0.6 |
| 50 to <60 | 5 | 30 | 0.51–0.6 |
| 60 to <70 | 6 | 36 | 0.52–0.6 |
| 70 to <80 | 7 | 42 | 0.53–0.6 |
| 80 to <90 | 8 | 48 | 0.54–0.6 |
| 90 to <100 | 9 | 54 | 0.55–0.6 |
| ≥100 | 10 | 60 | ≤0.6 |
Table 2
Summary of patient characteristics included in the mITT population (n=96).
| Treatment arm | Number (total n=96) | Age median,years(range) | Baseline viral load mean log10 copies per mL(range) | Vaccine doses received previously median (range) | Antibody positive at baseline from rapid test (%)* | Male (%) | Sites | ||
|---|---|---|---|---|---|---|---|---|---|
| HTD(n=87) | BP(n=5) | VJ(n=4) | |||||||
| Casirivimab/imdevimab | 10 | 26.5 (18–31) | 5.5 (3.7–7.8) | 2 (0–3) | 50 | 20 | 10 | 0 | 0 |
| Ivermectin | 45 | 29 (19–45) | 5.7 (1.9–7.6) | 2 (0–4) | 78 | 47 | 41 | 2 | 2 |
| No study drug | 41 | 27 (20–43) | 5.5 (3–7.7) | 2 (2–4) | 90 | 44 | 36 | 3 | 2 |
-
*
Defined as IgM or IgG present at enrolment on the rapid antibody test (BIOSYNEX COVID-19 BSS IgM/IgG, Illkirch-Graffenstaden, France) used as per manufacturer’s instructions.
-
HTD: Hospital for Tropical Diseases; BP: Bangplee Hospital; VJ: Vajira Hospital.
Additional files
-
MDAR checklist
- https://cdn.elifesciences.org/articles/83201/elife-83201-mdarchecklist1-v2.docx
-
Supplementary file 1
Summary of adverse events (grade 3 and above).
- https://cdn.elifesciences.org/articles/83201/elife-83201-supp1-v2.xlsx
-
Supplementary file 2
Summary of Serious Adverse Events.
- https://cdn.elifesciences.org/articles/83201/elife-83201-supp2-v2.xlsx
Download links
A two-part list of links to download the article, or parts of the article, in various formats.
Downloads (link to download the article as PDF)
Open citations (links to open the citations from this article in various online reference manager services)
Cite this article (links to download the citations from this article in formats compatible with various reference manager tools)
Pharmacometrics of high-dose ivermectin in early COVID-19 from an open label, randomized, controlled adaptive platform trial (PLATCOV)
eLife 12:e83201.
https://doi.org/10.7554/eLife.83201


