Palmitoylation regulates neuropilin-2 localization and function in cortical neurons and conveys specificity to semaphorin signaling via palmitoyl acyltransferases
- The Solomon H Snyder Department of Neuroscience, Johns Hopkins University School of Medicine, United States
- Department of Physiology,University of Seville, Spain
- McKusick-Nathans Institute of Genetic Medicine and Department of Pediatrics, The Johns Hopkins University School of Medicine, United States
- Department of Neurobiology, Howard Hughes Medical Institute, Harvard Medical School, United States
Figures
Figure 1
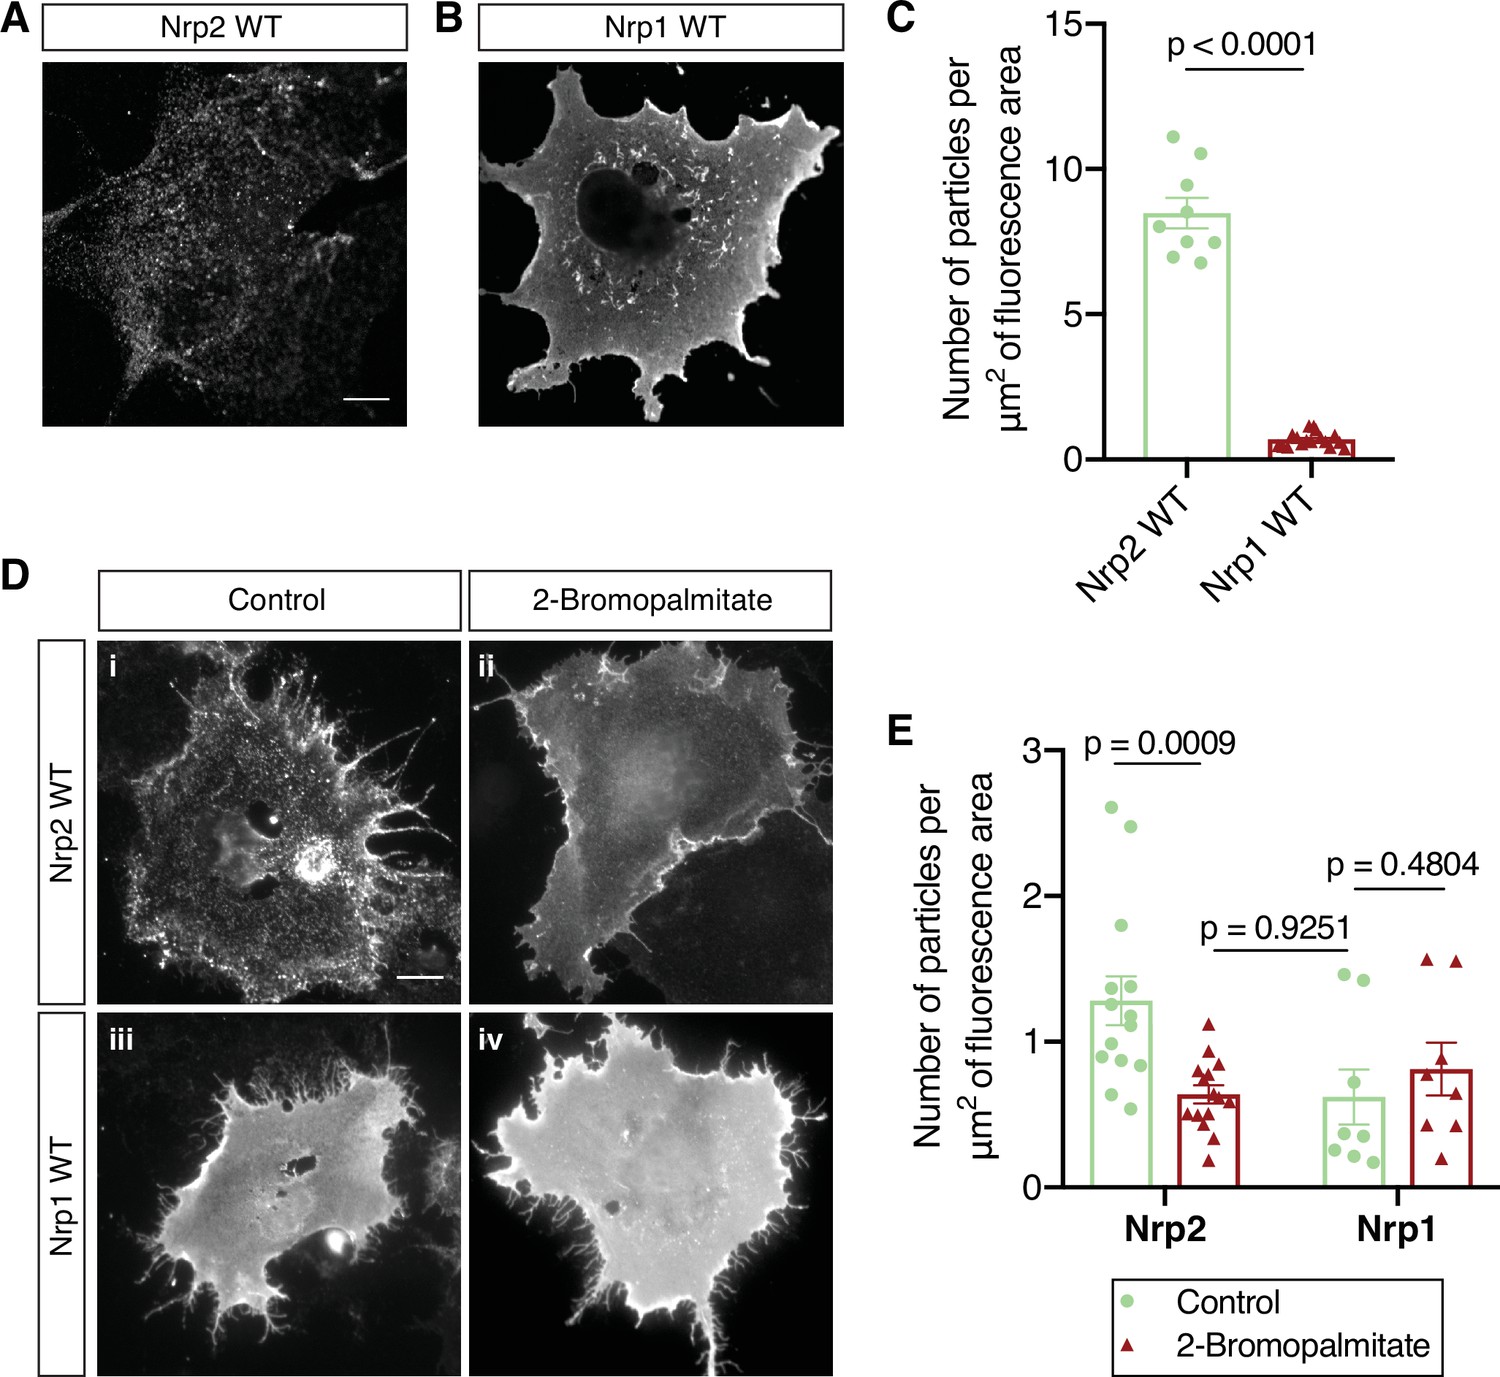
Distinct cell surface localization patterns of neuropilin-2 (Nrp2) and Nrp1 are abolished by global inhibition of palmitoylation.
(A–C) Surface localization of Nrp2 and Nrp1 in COS-7 cells expressing exogenous flag-tagged Nrp2 wild-type (WT) (A) or Nrp1 WT (B). Cells were subjected to surface staining with a flag antibody to visualize cell surface protein. Representative images (single plane) are shown for each protein. Nrp2 appears clustered, whereas Nrp1 appears diffusely localized on the cell surface. Scale bar, 12 μm. (C) Quantification of protein clustering, expressed as the number of particles per μm2 of fluorescence area (Clustering analysis, see Materials and methods). Data are plotted in a scatter dot plot with mean ± SEM (SEM, standard error of the mean). Two-tailed t test; Nrp2, n=9; Nrp1, n=17, where n is the number of cells analyzed. (D, E) Effects of 2-bromopalmitate on cell surface Nrp localization in heterologous cells. COS-7 cells expressing exogenous flag-tagged WT Nrp2 or Nrp1 were treated overnight with medium containing either 10 μM 2-bromopalmitate (ii, iv) or the same concentration of solvent (i, iii). Cells were subjected to surface staining with a flag antibody. Representative images (single plane) are shown for each protein. Upon control treatment, Nrp2 appears highly clustered (i), while Nrp1 has an even diffuse distribution on the plasma membrane (iii). Upon treatment with 2-bromopalmitate, Nrp2 assumes diffuse distribution (ii), similar to Nrp1 (iv). Scale bar, 20 μm. (E) Quantification of protein clustering shown in (D), as mentioned above. Data are plotted in a scatter dot plot with mean ± SEM. Two-tailed t test; Nrp2 control, n=14; Nrp2 2-bromopalmitate, n=15; Nrp1 control, n=8; Nrp1 2-bromopalmitate, n=8, where n is the number of cells analyzed.
-
Figure 1—source data 1
Raw data for Figure 1C.
- https://cdn.elifesciences.org/articles/83217/elife-83217-fig1-data1-v1.xlsx
-
Figure 1—source data 2
Raw data for Figure 1E.
- https://cdn.elifesciences.org/articles/83217/elife-83217-fig1-data2-v1.xlsx
Figure 2 with 1 supplement
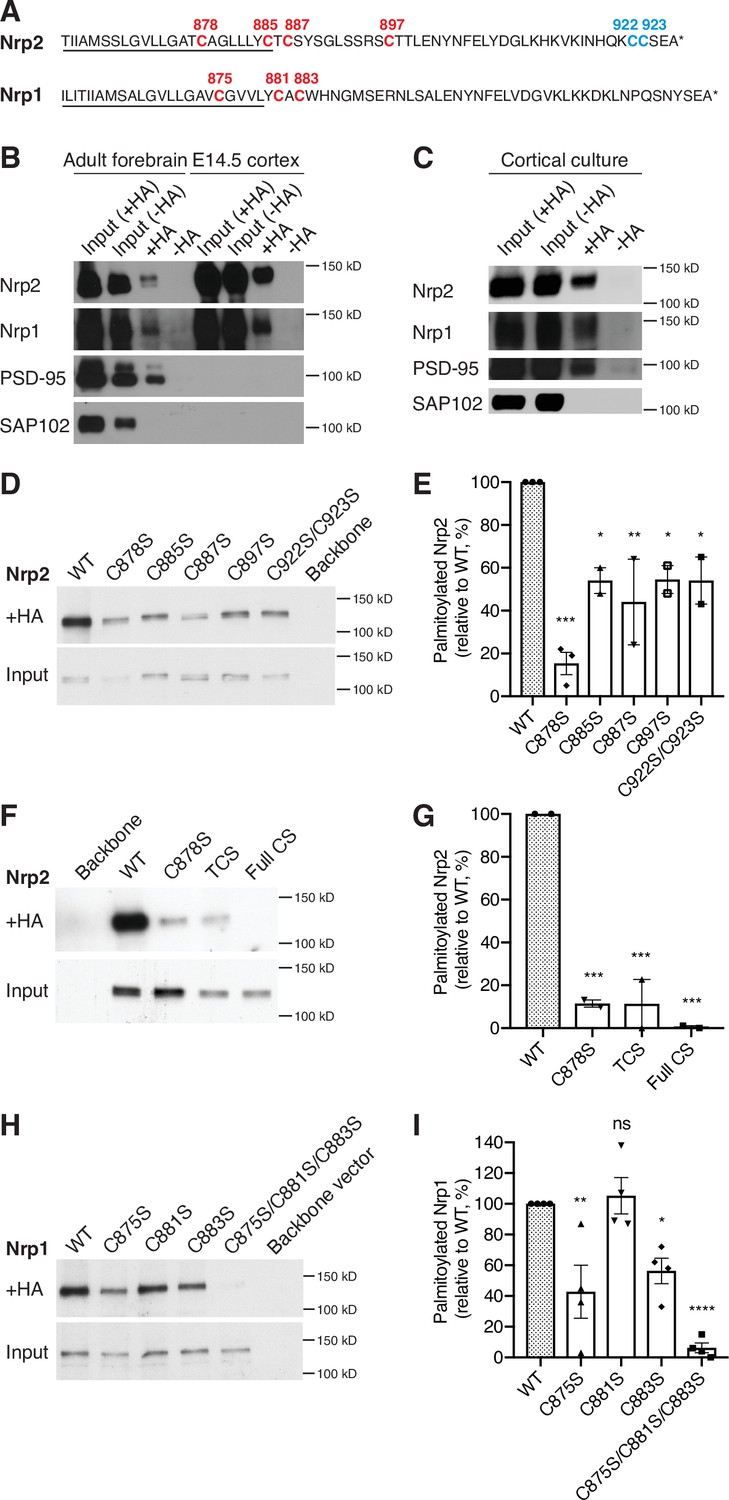
Neuropilins are palmitoylated in deep layer primary cortical neurons and in the mouse brain.
(A) Amino acid sequence of transmembrane (underlined) and cytoplasmic domains of neuropilin-2 (Nrp2) and Nrp1, as predicted by Ensembl genome database. Both Nrp2 and Nrp1 harbor cysteine residues in their transmembrane and juxtamembrane domains (depicted in red), whereas Nrp2 also possesses a C-terminal di-cysteine motif (depicted in blue). Cysteine numeration accords with their position in the amino acid sequence of Mus musculus Nrp2 (Nrp2-202, isoform A17, ENSMUST00000063594.13) for Nrp2 and M. musculus Nrp1 (Nrp1-201, ENSMUST00000026917.10) for Nrp1. (B, C) Acyl-biotin exchange (ABE) performed on adult mouse forebrain or embryonic day 14.5 (E14.5) cerebral cortex (B) and on E14.5 days in vitro (DIV)28 cortical neuron cultures (C). Western blots show endogenous proteins that are detected with protein-specific antibodies. Hydroxylamine-treated (+HA) samples show palmitoylated protein, while -HA samples serve as a negative control. Separate inputs were taken from the samples that were then processed with +HA or -HA buffer; therefore ‘Input (+HA)’ represents the input of +HA sample and ‘Input (-HA)’ represents the input of -HA sample. Both Nrp2 and Nrp1 are palmitoylated in the adult mouse forebrain, in E14.5 cerebral cortex and in cortical neuron cultures, similar to postsynaptic density protein 95 (PSD-95) that serves as a positive palmitoylation control, as shown by the presence of signal in the +HA sample and the absence of signal in the -HA control sample. Synapse-associated protein 102 (SAP102), known not to be palmitoylated, serves as a negative control for palmitoylation and it is not palmitoylated. At E14.5, no PSD-95 or SAP102 are detected in the mouse cerebral cortex, apparently due to the very low expression of these synaptic markers at this stage of development. (D, E) ABE on neuroblastoma-2a (Neuro-2a) cells expressing flag-tagged Nrp2 wild-type (WT) or CS point mutants. (D) Nrp2 immunoblots show palmitoylated (+HA) and input samples. -HA samples (not shown) were also included in the experiment. (E) Quantification of palmitoylated protein levels (fraction of the protein that is palmitoylated) calculated as the ratio of +HA to the respective input and plotted in a scatter dot plot with mean ± SEM (n=2–3 experiments). Palmitolyated WT Nrp2 is set at 100% and CS mutants are expressed as a percentage of WT. The cysteine residue C878 stands out as a major Nrp2 palmitate acceptor site. One-way analysis of variance (ANOVA) followed by Dunnett’s test for multiple comparisons (Nrp2 CS mutants are compared to Nrp2 WT [set at 100%]: C878S, p=0.0002; C885S, p=0.0189; C887S, p=0.0062; C897S, p=0.0200; C922S/C923S, p=0.0189). (F, G) ABE on Neuro-2a cells expressing flag-tagged Nrp2 WT or various CS mutants. (F) Nrp2 immunoblots show palmitoylated (+HA) and input samples. -HA samples (not shown) were also included in the experiment. (G) Quantification of palmitoylated protein levels (as explained above), plotted in scatter dot plots with mean ± SEM (n=2 experiments). The Nrp2 transmembrane and membrane-proximal cysteines are major palmitoylation sites. One-way ANOVA followed by Dunnett’s test for multiple comparisons (Nrp2 CS mutants are compared to Nrp2 WT [set at 100%]: C878S, p=0.0009; TCS, p=0.0009; Full CS, p=0.0006). (H, I) ABE on Neuro-2a cells expressing flag-tagged Nrp1 WT or CS point mutants. (H) Nrp1 immunoblots show palmitoylated (+HA) and input samples. -HA samples (not shown) were also included in the experiment. (I) Quantification of palmitoylated protein levels (as explained above), plotted in scatter dot plot including mean ± SEM (n=4 experiments). Nrp1 is palmitoylated mostly on cysteines C875 and C883. One-way ANOVA followed by Dunnett’s test for multiple comparisons (Nrp1 CS mutants are compared to Nrp1 WT (set at 100%): C875S, p=0.0042; C881S, p=0.9877; C883S, p=0.0272; C875S/C881S/C883S, p<0.0001; ns, not significant).
-
Figure 2—source data 1
Raw, unedited blot from Figure 2B.
- https://cdn.elifesciences.org/articles/83217/elife-83217-fig2-data1-v1.pdf
-
Figure 2—source data 2
Raw, unedited blot from Figure 2B.
- https://cdn.elifesciences.org/articles/83217/elife-83217-fig2-data2-v1.pdf
-
Figure 2—source data 3
Raw, unedited blot from Figure 2B.
- https://cdn.elifesciences.org/articles/83217/elife-83217-fig2-data3-v1.pdf
-
Figure 2—source data 4
Raw, labeled blot from Figure 2B.
- https://cdn.elifesciences.org/articles/83217/elife-83217-fig2-data4-v1.pdf
-
Figure 2—source data 5
Raw, labeled blot from Figure 2B.
- https://cdn.elifesciences.org/articles/83217/elife-83217-fig2-data5-v1.pdf
-
Figure 2—source data 6
Raw, labeled blot from Figure 2B.
- https://cdn.elifesciences.org/articles/83217/elife-83217-fig2-data6-v1.pdf
-
Figure 2—source data 7
Raw, unedited blot from Figure 2C.
- https://cdn.elifesciences.org/articles/83217/elife-83217-fig2-data7-v1.pdf
-
Figure 2—source data 8
Raw, unedited blot from Figure 2C.
- https://cdn.elifesciences.org/articles/83217/elife-83217-fig2-data8-v1.pdf
-
Figure 2—source data 9
Raw, unedited blot from Figure 2C.
- https://cdn.elifesciences.org/articles/83217/elife-83217-fig2-data9-v1.pdf
-
Figure 2—source data 10
Raw, unedited blot from Figure 2C.
- https://cdn.elifesciences.org/articles/83217/elife-83217-fig2-data10-v1.pdf
-
Figure 2—source data 11
Raw, labeled blot from Figure 2C.
- https://cdn.elifesciences.org/articles/83217/elife-83217-fig2-data11-v1.pdf
-
Figure 2—source data 12
Raw, labeled blot from Figure 2C.
- https://cdn.elifesciences.org/articles/83217/elife-83217-fig2-data12-v1.pdf
-
Figure 2—source data 13
Raw, labeled blot from Figure 2C.
- https://cdn.elifesciences.org/articles/83217/elife-83217-fig2-data13-v1.pdf
-
Figure 2—source data 14
Raw, labeled blot from Figure 2C.
- https://cdn.elifesciences.org/articles/83217/elife-83217-fig2-data14-v1.pdf
-
Figure 2—source data 15
Raw, unedited blot from Figure 2D.
- https://cdn.elifesciences.org/articles/83217/elife-83217-fig2-data15-v1.pdf
-
Figure 2—source data 16
Raw, labeled blot from Figure 2D.
- https://cdn.elifesciences.org/articles/83217/elife-83217-fig2-data16-v1.pdf
-
Figure 2—source data 17
Raw data for Figure 2E.
- https://cdn.elifesciences.org/articles/83217/elife-83217-fig2-data17-v1.xlsx
-
Figure 2—source data 18
Raw, unedited blot from Figure 2F.
- https://cdn.elifesciences.org/articles/83217/elife-83217-fig2-data18-v1.pdf
-
Figure 2—source data 19
Raw, unedited blot from Figure 2F.
- https://cdn.elifesciences.org/articles/83217/elife-83217-fig2-data19-v1.pdf
-
Figure 2—source data 20
Raw, labeled blot from Figure 2F.
- https://cdn.elifesciences.org/articles/83217/elife-83217-fig2-data20-v1.pdf
-
Figure 2—source data 21
Raw, labeled blot from Figure 2F.
- https://cdn.elifesciences.org/articles/83217/elife-83217-fig2-data21-v1.pdf
-
Figure 2—source data 22
Raw data for Figure 2G.
- https://cdn.elifesciences.org/articles/83217/elife-83217-fig2-data22-v1.xlsx
-
Figure 2—source data 23
Raw, unedited blot from Figure 2H.
- https://cdn.elifesciences.org/articles/83217/elife-83217-fig2-data23-v1.pdf
-
Figure 2—source data 24
Raw, labeled blot from Figure 2H.
- https://cdn.elifesciences.org/articles/83217/elife-83217-fig2-data24-v1.pdf
-
Figure 2—source data 25
Raw data for Figure 2I.
- https://cdn.elifesciences.org/articles/83217/elife-83217-fig2-data25-v1.xlsx
Figure 2—figure supplement 1
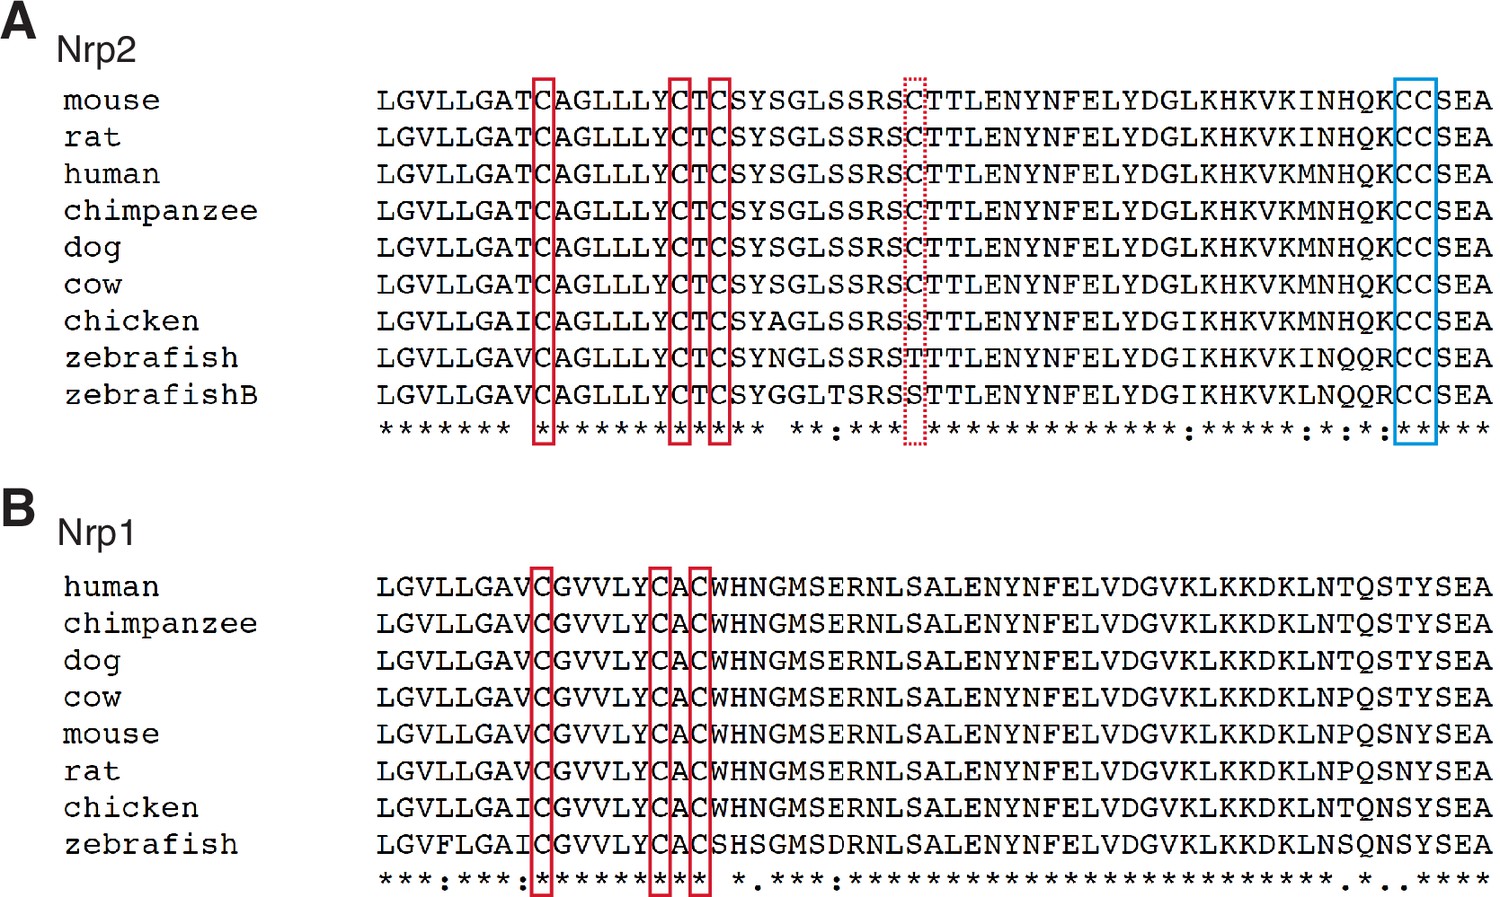
Conserved cysteine residues lie in the transmembrane and cytoplasmic domains of neuropilins.
(A) Neuropilin-2 (Nrp2) cross-species amino acid sequence alignment of transmembrane and cytoplasmic domains, by the use of ClustalW software, reveals highly conserved cysteine residues across species. The three transmembrane/juxtamembrane cysteines (surrounded by red boxes) and the two C-terminal cysteines (surrounded by a blue box) are highly conserved, while the cytoplasmic cysteine in the middle (surrounded by dashed red box) is partially conserved. (B) Nrp1 cross-species amino acid sequence alignment of transmembrane and cytoplasmic domains, as mentioned above, reveals highly conserved cysteine residues (surrounded by red boxes) across species.
Figure 3 with 4 supplements
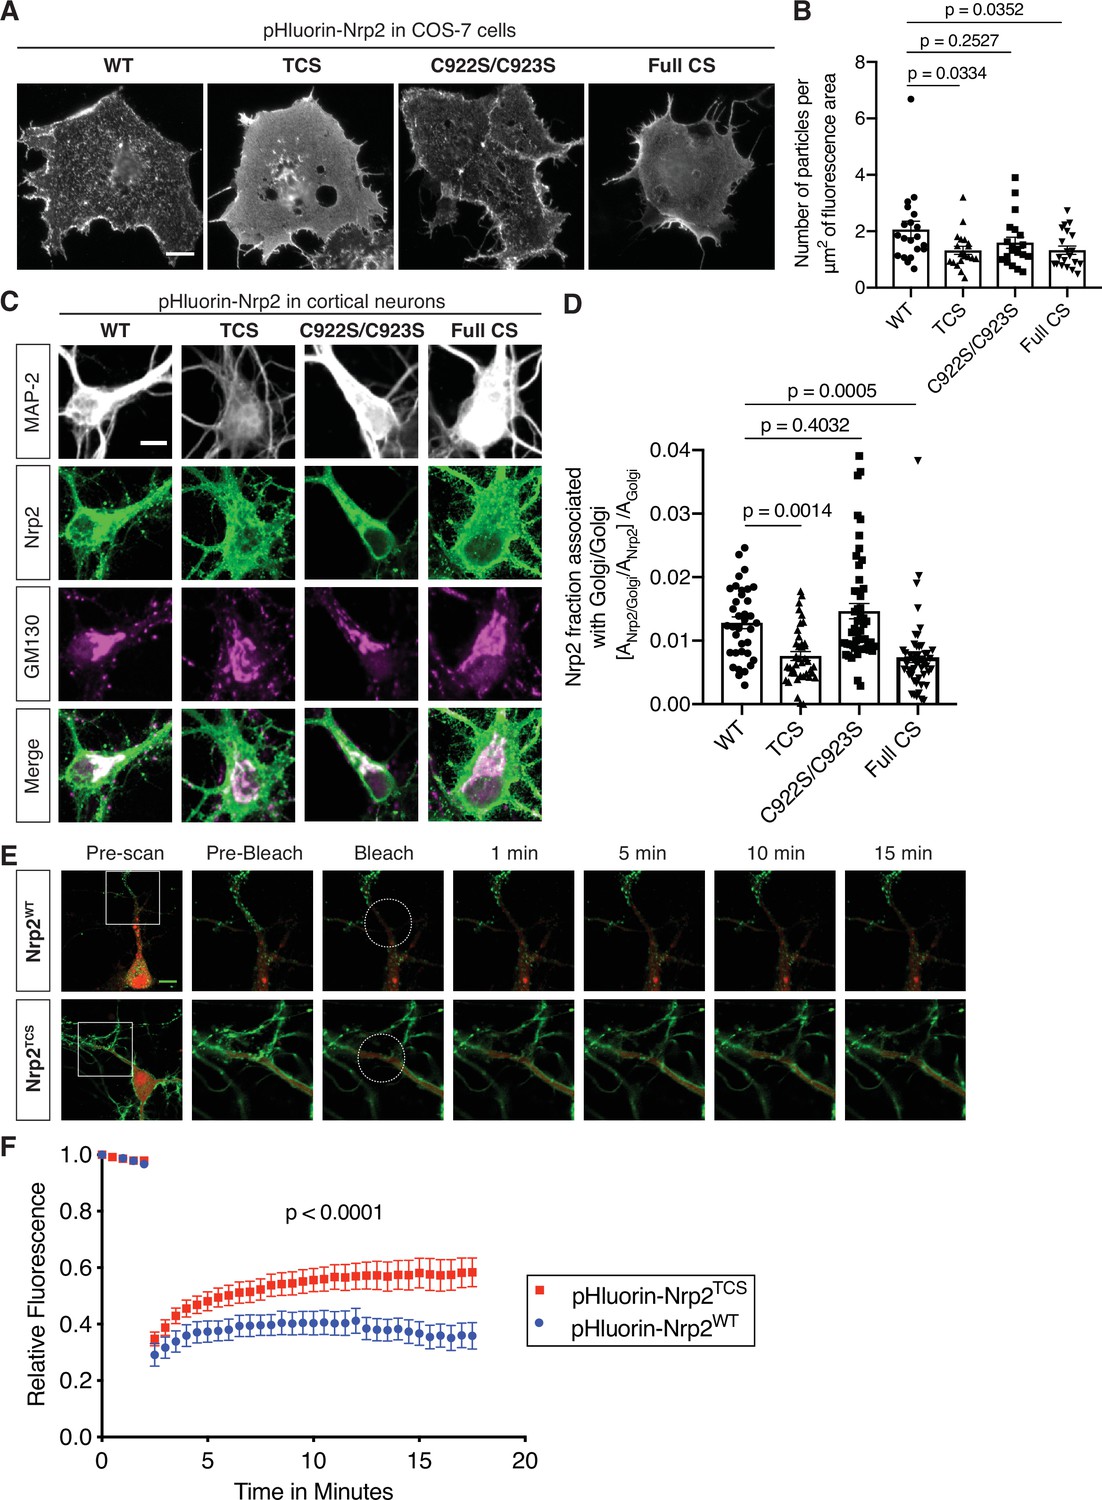
Differential requirements for distinct neuropilin-2 (Nrp2) palmitoyl acceptor cysteines in regulating subcellular Nrp2 localization and trafficking.
(A, B) Effects of Nrp2 cysteines on Nrp2 protein cell surface localization in heterologous cells. (A) Panels show COS-7 cells expressing pHluorin-tagged Nrp2 wild-type (WT) or various cysteine-to-serine (CS) mutants and subjected to Nrp2 surface staining with a GFP antibody. Scale bar, 15 μm. (B) Quantification of protein clustering with particle analysis (as mentioned earlier), expressed as number of particles per μm2 of fluorescence area and plotted in scatter dot plot including mean ± SEM. WT and C922S/C923S Nrp2 proteins are distributed in the form of smaller particles (puncta), whereas triple CS (TCS) and Full CS Nrp2 proteins localize on the surface as large protein clusters. One-way analysis of variance (ANOVA) followed by Dunnett’s test for multiple comparisons; n=20 cells for each plasmid. (C, D) Effects of Nrp2 cysteines on Nrp2 localization at the Golgi apparatus in cortical neuron cultures. Assessment of colocalization of pHluorin-tagged Nrp2 WT or CS mutants with the Golgi apparatus marker Golgi matrix protein 130 (GM130) in embryonic day 14.5 (E14.5) days in vitro (DIV)17 Nrp2-/- primary cortical neurons. (C) Representative images of neurons (single plane) expressing different Nrp2 proteins. Nrp2 here is visualized via EGFP immunofluorescence, and the signal represents total Nrp2 (surface and intracellular). In merged panels, the regions where Nrp2 and GM130 puncta of similar intensity colocalize appear white. Nrp2 WT and C922S/C923S exhibit very strong association with Golgi cisternae. By contrast, Nrp2 TCS or Full CS colocalize with the Golgi to a significantly lesser extent. Of note, following Nrp2 staining, neurons expressing Full CS Nrp2 appear ‘hairy’; this is a common phenotype of this Nrp2 CS mutant, indicative of its diffuse distribution in all membranes including filopodia. Scale bar, 7 μm. (D) Quantification of the colocalization between Nrp2 and GM130, expressed as the fraction of Nrp2 associated with Golgi [ANrp2/Golgi/ANrp2] normalized to the quantity of Golgi (Golgi Area, AGolgi) present in each neuron ([ANrp2/Golgi/ANrp2]/AGolgi) (see Materials and methods). Columns show pooled data from independent cultures plotted in scatter dot plot including mean ± SEM. One-way ANOVA (p<0.0001) followed by Dunnett’s test for multiple comparisons; WT, 36 neurons; TCS, 40 neurons; C922S/C923S, 50 neurons; Full CS, 50 neurons. (E, F) Fluorescence recovery after photobleaching (FRAP) analysis, on E14.5 DIV10 WT cortical neurons expressing pHluorin-tagged Nrp2 WT or TCS plasmids. (E) Time-lapse image sequences are shown for each Nrp2 protein. Pre-bleach and post-bleach panels depict the areas surrounded by the white squares in pre-scan panels. White dashed circles delineate the region of interest (ROI) selected for photobleaching. Note the higher diffusibility of Nrp2TCS compared to Nrp2WT and the difference in their surface distributions that appear diffuse and clustered, respectively. Scale bar, 10 μm. (F) Quantitative analysis of fluorescence recovery kinetics after photobleaching. Pooled data are plotted as mean ± SEM. Extra sum-of-squares F test; WT: 7 neurons, Rmax = 0.4463, T1/2=1.242e-016; TCS: 8 neurons, Rmax = 0.5824, T1/2=1.348e-016, where Rmax is maximum recovery.
-
Figure 3—source data 1
Raw data for Figure 3B.
- https://cdn.elifesciences.org/articles/83217/elife-83217-fig3-data1-v1.xlsx
-
Figure 3—source data 2
Raw data for Figure 3D.
- https://cdn.elifesciences.org/articles/83217/elife-83217-fig3-data2-v1.xlsx
-
Figure 3—source data 3
Raw data for Figure 3F.
- https://cdn.elifesciences.org/articles/83217/elife-83217-fig3-data3-v1.xlsx
Figure 3—figure supplement 1
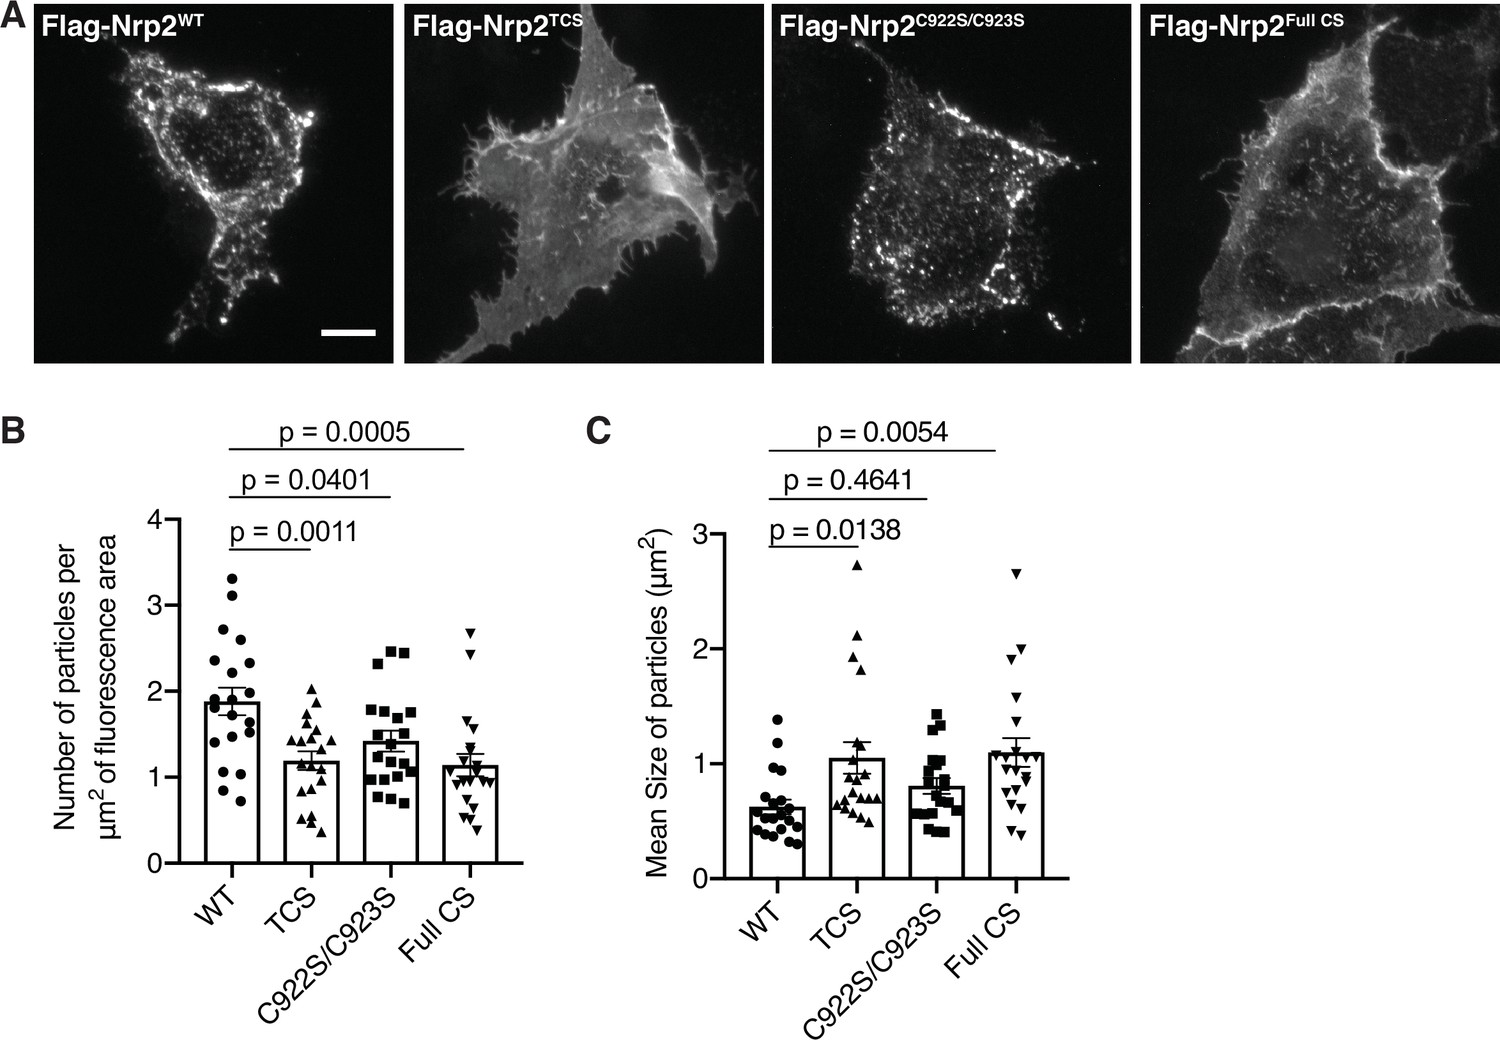
Distinct requirements for neuropilin-2 (Nrp2) palmitoyl acceptor cysteines in Nrp2 cell surface distribution in COS-7 cells.
(A–C) Cell surface localization of Nrp2 protein in heterologous cells. (A) Panels show COS-7 cells expressing flag-tagged Nrp2 wild-type (WT) or various cysteine-to-serine (CS) mutants, subjected to Nrp2 surface staining with a flag antibody. Scale bar, 15 μm. (B, C) Quantification of protein clustering with particle analysis, presented as number of particles (clusters) per μm2 of fluorescence area (B) and as mean particle size (area in μm2, each cell gave a mean particle size) (C). Cumulative data are plotted in scatter dot plots with mean ± SEM. WT and C922S/C923S Nrp2 are distributed in the form of smaller clusters (puncta), whereas triple CS (TCS) and Full CS localize on the surface as larger clusters indicative of a diffuse distribution pattern. One-way analysis of variance (ANOVA) followed by Dunnett’s test for multiple comparisons; a total of 20 cells analyzed for each plasmid.
-
Figure 3—figure supplement 1—source data 1
Raw data for Figure 3—figure supplement 1B and C.
- https://cdn.elifesciences.org/articles/83217/elife-83217-fig3-figsupp1-data1-v1.xlsx
Figure 3—figure supplement 2
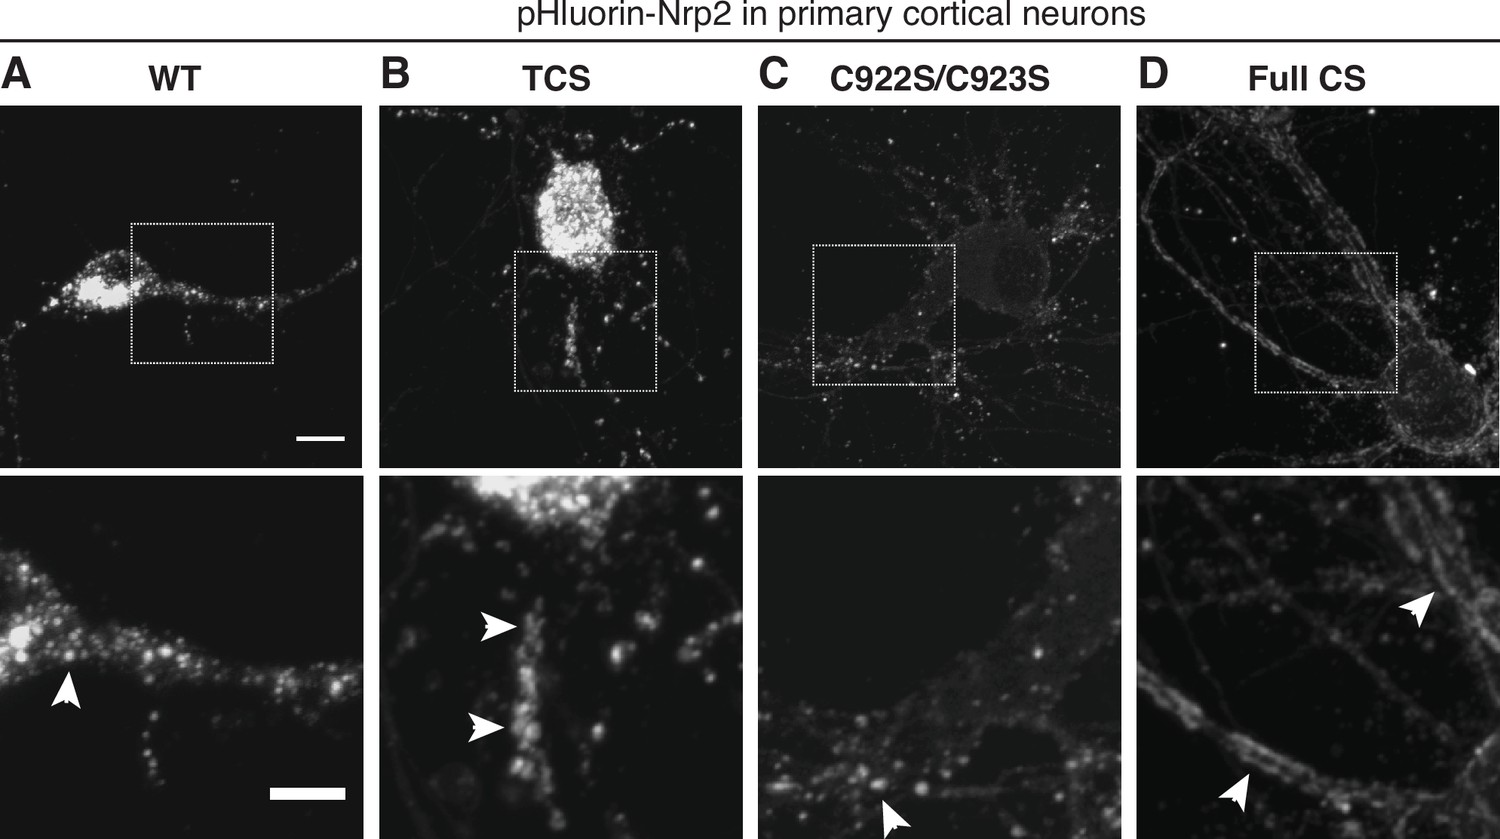
Severe defects in the cell surface localization of palmitoylation-deficient neuropilin-2 (Nrp2) in primary cortical neurons.
(A–D) Surface localization of Nrp2 lacking palmitoyl acceptor cysteines in embryonic day 14.5 (E14.5) days in vitro (DIV)16 cortical neuron cultures. Primary cortical neurons were transfected with pHluorin-tagged Nrp2 wild-type (WT) or cysteine-to-serine (CS) mutants and at DIV16 they were imaged live to visualize protein localized on the plasma membrane. Top panels show representative images of neurons expressing each plasmid; each image is the 3D projection of a confocal stack. Bottom panels show the zoomed-in view of the areas surrounded by rectangles in top panels. WT (A) and C-terminal CS (C) Nrp2 proteins are punctate (arrowheads mark puncta), whereas Nrp2 triple CS (TCS) (B) is mostly distributed in the form of larger clusters resembling clumps (arrowheads) and to a much lesser extent in the form of puncta. Outstandingly, palmitoylation-deficient Nrp2 Full CS (D) has almost completely lost clustering and diffuses over the entire cell surface, making a pattern reminiscent of ‘tram track’ (marked by arrowheads). Scale bars: top panels, 8 μm; bottom panels, 5 μm.
Figure 3—figure supplement 3
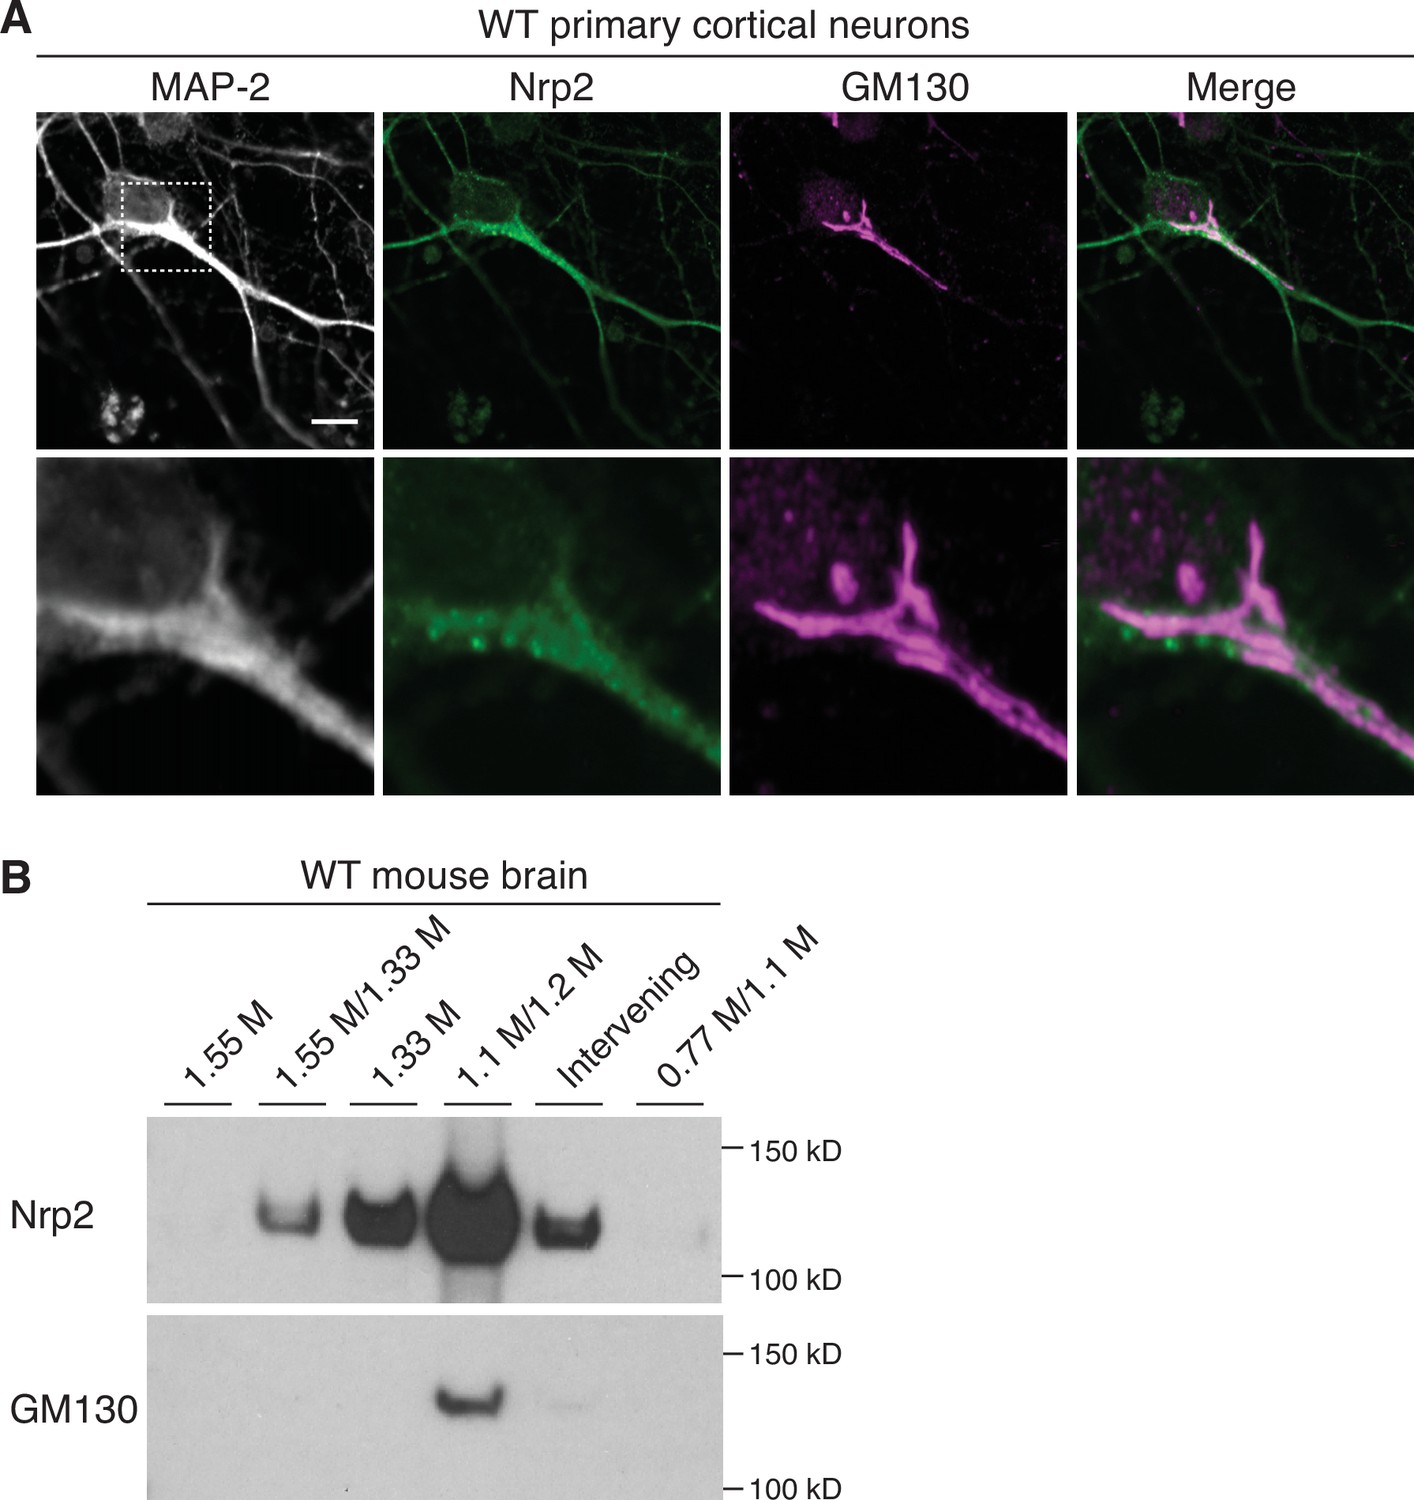
Neuropilin-2 (Nrp2) is enriched in the Golgi apparatus in neural tissue.
(A) Wild-type primary cortical neurons immunostained with antibodies against Nrp2 and the cis-Golgi marker Golgi matrix protein 130 (GM130). Endogenous Nrp2 robustly colocalizes with somatic Golgi and dendritic Golgi membranes, as shown in the overlaid image (merge). Bottom row shows a zoomed-in view of the area surrounded by the dashed rectangle in top row images. Scale bar, 7 μm. (B) Golgi isolation preparations made from adult mouse whole brain, analyzed with western blotting using antibodies directed against Nrp2 and GM130. Endogenous Nrp2 is highly enriched in the GM130-positive fraction (1.1M/1.2M).
-
Figure 3—figure supplement 3—source data 1
Raw, unedited blot from Figure 3—figure supplement 3B.
- https://cdn.elifesciences.org/articles/83217/elife-83217-fig3-figsupp3-data1-v1.pdf
-
Figure 3—figure supplement 3—source data 2
Raw, unedited blot from Figure 3—figure supplement 3B.
- https://cdn.elifesciences.org/articles/83217/elife-83217-fig3-figsupp3-data2-v1.pdf
-
Figure 3—figure supplement 3—source data 3
Raw, labeled blot from Figure 3—figure supplement 3B.
- https://cdn.elifesciences.org/articles/83217/elife-83217-fig3-figsupp3-data3-v1.pdf
-
Figure 3—figure supplement 3—source data 4
Raw, labeled blot from Figure 3—figure supplement 3B.
- https://cdn.elifesciences.org/articles/83217/elife-83217-fig3-figsupp3-data4-v1.pdf
Figure 3—figure supplement 4
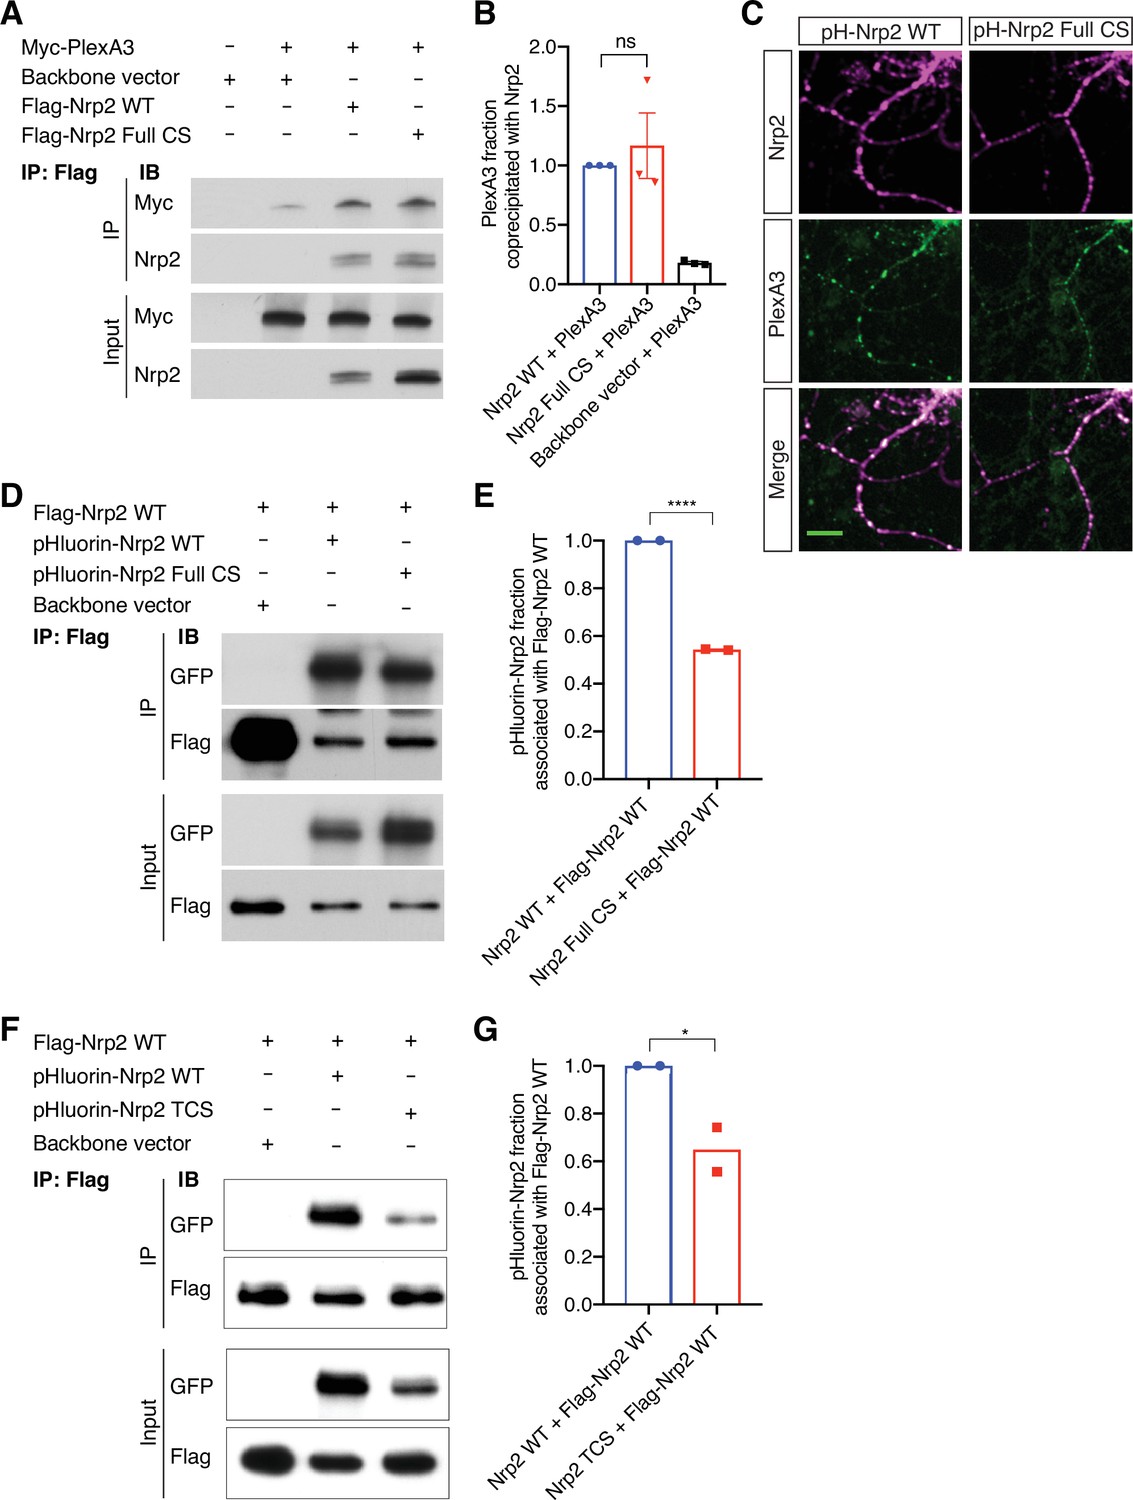
Neuropilin-2 (Nrp2) palmitoyl acceptor cysteines are not required for Nrp2/plexinA3 (PlexA3) association but are required for proper Nrp2 homo-oligomerization.
(A, B) Effects of Nrp2 palmitoyl acceptor cysteines on Nrp2/PlexA3 complex formation assessed by coimmunoprecipitation experiments. HEK293T cells were co-transfected with myc-tagged PlexA3 and either wild-type (WT) Nrp2 or Full cysteine-to-serine (CS) Nrp2 or backbone vector. (A) Immunoblotting against the myc epitope tag shows that PlexA3 is coimmunoprecipitated with WT or Full CS Nrp2 to similar degrees. (B) Quantification of PlexA3 fraction immunoprecipitated, calculated as the ratio IP/Input. This fraction is set at 1.0 for Nrp2 WT and the fraction for Full CS Nrp2 sample is expressed relative to that. Data are plotted in dot plots with mean ± SEM. Two-tailed t test, p=0.5781; ns, not significant; n=3 experiments. (C) Association of PlexA3 with Nrp2 in DIV21 WT primary cortical neurons transfected with pHluorin-tagged Nrp2 WT or Full CS and subjected to immunofluorescence against GFP (Nrp2 epitope tag) and endogenous PlexA3. Both WT and Full CS Nrp2 proteins (magenta) display strong association with PlexA3 (green), shown as white in overlaid images (merge). Scale bar, 20 μm. (D, E) Assessment of the effect of cysteines on the ability of Nrp2 to homo-oligomerize. (D) Western blots of coimmunoprecipitation experiments in HEK293T cells co-transfected with flag-tagged WT Nrp2 and either pHluorin-tagged WT Nrp2 or pHluorin-tagged Full CS Nrp2 or backbone vector. Flag-tagged WT Nrp2 was immunoprecipitated with a flag antibody and samples were immunoblotted with flag or GFP antibody. (E) Quantification of the fraction of pHluorin-tagged Nrp2 (WT or Full CS) that is associated with flag-tagged Nrp2 WT. This fraction is set at 1.0 for WT and Full CS is expressed relative to that. Full CS Nrp2 associates with WT Nrp2 to a significantly lesser extent than WT Nrp2 does. Data are plotted in dot plots with mean ± SEM. Two-tailed t test, ****p<0.0001, n=2 experiments. (F, G) Assessment of the effect of cysteines on the ability of Nrp2 to homo-oligomerize. (F) Western blots of coimmunoprecipitation experiments in HEK293T cells co-transfected with flag-tagged WT Nrp2 and either pHluorin-tagged WT Nrp2 or pHluorin-tagged triple CS (TCS) Nrp2 or backbone vector. Flag-tagged WT Nrp2 was immunoprecipitated with a flag antibody and samples were immunoblotted with flag or GFP antibody. (G) Quantification of the fraction of pHluorin-tagged Nrp2 (WT or TCS) that is associated with flag-tagged Nrp2 WT. This fraction is set at 1.0 for WT and TCS is expressed relative to that. TCS Nrp2 associates with WT Nrp2 less than WT Nrp2 does. Data are plotted in dot plots with mean ± SEM. One-tailed t test, *p=0.0317, n=2 experiments.
-
Figure 3—figure supplement 4—source data 1
Raw, unedited blot from Figure 3—figure supplement 4A.
- https://cdn.elifesciences.org/articles/83217/elife-83217-fig3-figsupp4-data1-v1.pdf
-
Figure 3—figure supplement 4—source data 2
Raw, unedited blot from Figure 3—figure supplement 4A.
- https://cdn.elifesciences.org/articles/83217/elife-83217-fig3-figsupp4-data2-v1.pdf
-
Figure 3—figure supplement 4—source data 3
Raw, unedited blot from Figure 3—figure supplement 4A.
- https://cdn.elifesciences.org/articles/83217/elife-83217-fig3-figsupp4-data3-v1.pdf
-
Figure 3—figure supplement 4—source data 4
Raw, unedited blot from Figure 3—figure supplement 4A.
- https://cdn.elifesciences.org/articles/83217/elife-83217-fig3-figsupp4-data4-v1.pdf
-
Figure 3—figure supplement 4—source data 5
Raw, labeled blot from Figure 3—figure supplement 4A.
- https://cdn.elifesciences.org/articles/83217/elife-83217-fig3-figsupp4-data5-v1.pdf
-
Figure 3—figure supplement 4—source data 6
Raw, labeled blot from Figure 3—figure supplement 4A.
- https://cdn.elifesciences.org/articles/83217/elife-83217-fig3-figsupp4-data6-v1.pdf
-
Figure 3—figure supplement 4—source data 7
Raw, labeled blot from Figure 3—figure supplement 4A.
- https://cdn.elifesciences.org/articles/83217/elife-83217-fig3-figsupp4-data7-v1.pdf
-
Figure 3—figure supplement 4—source data 8
Raw, labeled blot from Figure 3—figure supplement 4A.
- https://cdn.elifesciences.org/articles/83217/elife-83217-fig3-figsupp4-data8-v1.pdf
-
Figure 3—figure supplement 4—source data 9
Raw data for Figure 3—figure supplement 4B.
- https://cdn.elifesciences.org/articles/83217/elife-83217-fig3-figsupp4-data9-v1.xlsx
-
Figure 3—figure supplement 4—source data 10
Raw, unedited blot from Figure 3—figure supplement 4D.
- https://cdn.elifesciences.org/articles/83217/elife-83217-fig3-figsupp4-data10-v1.pdf
-
Figure 3—figure supplement 4—source data 11
Raw, unedited blot from Figure 3—figure supplement 4D.
- https://cdn.elifesciences.org/articles/83217/elife-83217-fig3-figsupp4-data11-v1.pdf
-
Figure 3—figure supplement 4—source data 12
Raw, unedited blot from Figure 3—figure supplement 4D.
- https://cdn.elifesciences.org/articles/83217/elife-83217-fig3-figsupp4-data12-v1.pdf
-
Figure 3—figure supplement 4—source data 13
Raw, labeled blot from Figure 3—figure supplement 4D.
- https://cdn.elifesciences.org/articles/83217/elife-83217-fig3-figsupp4-data13-v1.pdf
-
Figure 3—figure supplement 4—source data 14
Raw, labeled blot from Figure 3—figure supplement 4D.
- https://cdn.elifesciences.org/articles/83217/elife-83217-fig3-figsupp4-data14-v1.pdf
-
Figure 3—figure supplement 4—source data 15
Raw, labeled blot from Figure 3—figure supplement 4D.
- https://cdn.elifesciences.org/articles/83217/elife-83217-fig3-figsupp4-data15-v1.pdf
-
Figure 3—figure supplement 4—source data 16
Raw data for Figure 3—figure supplement 4E.
- https://cdn.elifesciences.org/articles/83217/elife-83217-fig3-figsupp4-data16-v1.xlsx
-
Figure 3—figure supplement 4—source data 17
Raw, unedited blot from Figure 3—figure supplement 4F.
- https://cdn.elifesciences.org/articles/83217/elife-83217-fig3-figsupp4-data17-v1.pdf
-
Figure 3—figure supplement 4—source data 18
Raw, unedited blot from Figure 3—figure supplement 4F.
- https://cdn.elifesciences.org/articles/83217/elife-83217-fig3-figsupp4-data18-v1.pdf
-
Figure 3—figure supplement 4—source data 19
Raw, unedited blot from Figure 3—figure supplement 4F.
- https://cdn.elifesciences.org/articles/83217/elife-83217-fig3-figsupp4-data19-v1.pdf
-
Figure 3—figure supplement 4—source data 20
Raw, labeled blot from Figure 3—figure supplement 4F.
- https://cdn.elifesciences.org/articles/83217/elife-83217-fig3-figsupp4-data20-v1.pdf
-
Figure 3—figure supplement 4—source data 21
Raw, labeled blot from Figure 3—figure supplement 4F.
- https://cdn.elifesciences.org/articles/83217/elife-83217-fig3-figsupp4-data21-v1.pdf
-
Figure 3—figure supplement 4—source data 22
Raw, labeled blot from Figure 3—figure supplement 4F.
- https://cdn.elifesciences.org/articles/83217/elife-83217-fig3-figsupp4-data22-v1.pdf
-
Figure 3—figure supplement 4—source data 23
Raw data for Figure 3—figure supplement 4G.
- https://cdn.elifesciences.org/articles/83217/elife-83217-fig3-figsupp4-data23-v1.xlsx
Figure 4 with 1 supplement

Select neuropilin-2 (Nrp2) cysteines are required for semaphorin 3F (Sema3F)/Nrp2-dependent dendritic spine pruning in deep layer primary cortical neurons.
(A–D) Rescuing in vitro the Nrp2-/- dendritic spine phenotype to assess the role of individual Nrp2 cysteines in Sema3F/Nrp2-dependent dendritic spine collapse. E14.5 Nrp2-/- primary cortical neurons were transfected with various flag-Nrp2-ires-EGFP expression plasmids, including wild-type (WT) and cysteine-to-serine (CS) point mutants. At days in vitro (DIV)21 they were treated with 5 nM Sema3F-AP or 5 nM AP alone, for 6 hr, and next subjected to EGFP immunofluorescence to visualize neuronal architecture. (A) Representative images of neurons expressing the indicated plasmid and treated with either Sema3F-AP or AP. Images represent the 3D projection of a confocal stack. Scale bar in (A), 7 μm. (B, C) Quantification of dendritic spines, counted along the 0–50 μm apical dendritic segment and presented as number of spines per μm. Cumulative data from independent experiments are plotted in dot plots with mean ± SEM. The rescue ability of each Nrp2 protein is assessed in two ways: the ability of AP-treated neurons expressing each Nrp2 protein to constrain spines compared to AP-treated neurons expressing the backbone vector only (control) (B) and the ability of neurons expressing each Nrp2 protein to respond to Sema3F-AP compared to AP (control) (C) Graph in (B): One-way analysis of variance (ANOVA) (p<0.0001) followed by Bonferroni’s test for multiple comparisons (compared to EGFP only: WT, p<0.0001; C878S, p=0.1215; C885S, p>0.9999; C887S, p=0.0628; C897S, p<0.0001; C922S/C923S, p<0.0001). Graph in (C): Two-way ANOVA (p<0.0001) followed by Sidak’s test for multiple comparisons (Sema3F-AP vs. AP: EGFP only, p=0.4885; WT, p=0.0074; C878S, p=0.3555; C885S, p<0.0001; C887S, p=0.9985; C897S, p=0.3308; C922S/C923S, p=0.0017). (D) Graphic summary of the ability of Nrp2 proteins tested above to rescue the Nrp2-/- dendritic spine density phenotype in cortical neurons. WT and C922S/C923S Nrp2 proteins constrain dendritic spines, whereas certain Nrp2 CS mutants have either compromised (C885S, C897S) or abolished (C878S, C887S) rescue ability. Sema3F-AP treated: EGFP only, n=44; WT, n=63; C878S, n=39; C885S, n=46; C887S, n=60; C897S, n=38; C922S/C923S, n=53. AP treated: EGFP only, n=55; WT, n=67; C878S, n=26; C885S, n=36; C887S, n=53; C897S, n=36; C922S/C923S, n=64, where n is the number of neurons analyzed for each condition. (E, F) Sema3F enhances endogenous Nrp2 palmitoylation in cortical neuron cultures. ABE on DIV18 primary cortical neurons treated with either 5 nM Sema3F-AP, 5 nM AP (control), or 5 nM Sema3A-AP (additional control). (E) Immunoblots show palmitoylated (+HA) and input samples. -HA samples were processed in parallel with no evidence of non-specific signal (not shown). (F) Quantification of palmitoylated Nrp2 levels, calculated as the ratio of +HA to the respective input. Sema3F-AP and Sema3A-AP conditions are expressed relative to AP control (set at 100%). Cumulative data are plotted in dot plots with mean ± SEM. One-way ANOVA followed by Dunnett’s test for multiple comparisons; Sema3A-AP vs. AP, p=0.8531 (AP and Sema3F-AP, n=5 experiments; Sema3A-AP, n=2 experiments).
-
Figure 4—source data 1
Raw data for Figure 4B and C.
- https://cdn.elifesciences.org/articles/83217/elife-83217-fig4-data1-v1.xlsx
-
Figure 4—source data 2
Raw, unedited blot from Figure 4E.
- https://cdn.elifesciences.org/articles/83217/elife-83217-fig4-data2-v1.pdf
-
Figure 4—source data 3
Raw, labeled blot from Figure 4E.
- https://cdn.elifesciences.org/articles/83217/elife-83217-fig4-data3-v1.pdf
-
Figure 4—source data 4
Raw data for Figure 4F.
- https://cdn.elifesciences.org/articles/83217/elife-83217-fig4-data4-v1.xlsx
Figure 4—figure supplement 1
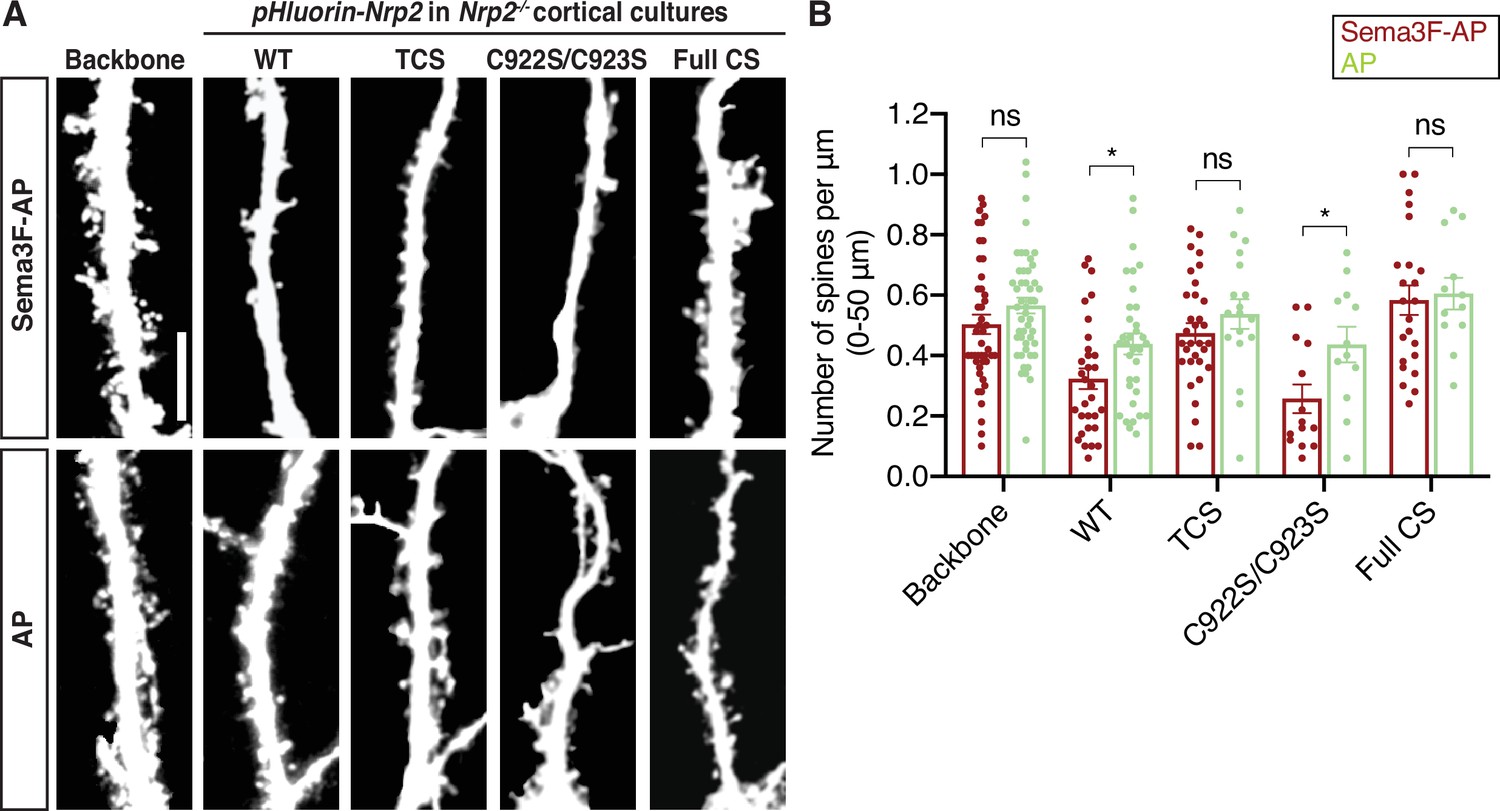
Semaphorin 3F (Sema3F)/neuropilin-2 (Nrp2)-dependent dendritic spine pruning in deep layer cortical neurons depends on distinct Nrp2 cysteine clusters.
(A, B) Rescuing in vitro the Nrp2-/- dendritic spine phenotype to assess the role of different Nrp2 cysteine motifs in Sema3F/Nrp2-dependent dendritic spine retraction. Embryonic day 14.5 (E14.5) Nrp2-/- primary cortical neurons were transfected with various pHluorin-tagged Nrp2-ires-dsRED expression plasmids, including wild-type (WT), triple CS (TCS), C922S/C923S, and Full CS. At days in vitro (DIV)21 they were treated with 5 nM Sema3F-AP or AP, for 6 hr, and next subjected to immunofluorescence. (A) Representative images of neurons (3D projection of a confocal stack) expressing the indicated plasmid and treated with either Sema3F-AP or AP. Scale bar, 10 μm. (B) Quantification of dendritic spines, counted along the 0–50 μm apical dendritic segment and presented as number of spines per μm. Cumulative data from independent experiments are plotted in scatter dot plots with mean ± SEM. The graph shows two columns for each plasmid, one for spine density in AP-treated neurons and one for spine density in Sema3F-AP-treated neurons. The rescue ability of each Nrp2 protein is evidenced by the ability of Nrp2-/- neurons expressing each (the same) Nrp2 plasmid to exhibit spine pruning in response to Sema3F-AP as compared to AP treatment (control). Number of neurons analyzed: Sema3F-AP treated: Backbone, 45; WT, 31; TCS, 32; C922S/C923S, 14; Full CS, 23; and AP treated: Backbone, 48; WT, 34; TCS, 18; C922S/C923S, 12; Full CS, 12. Two-tailed t test for Sema3F-AP vs. AP for each tested plasmid: Backbone, p=0.1321; WT, p=0.0222; TCS, p=0.2729; C992S/C923S; p=0.0251; Full CS, p=0.7842; ns, not significant, p≥0.05; (analysis of variance [ANOVA] could not be reliably performed because of the greatly unequal size-number of neurons of different conditions).
-
Figure 4—figure supplement 1—source data 1
Raw data for Figure 4—figure supplement 1B.
- https://cdn.elifesciences.org/articles/83217/elife-83217-fig4-figsupp1-data1-v1.xlsx
Figure 5
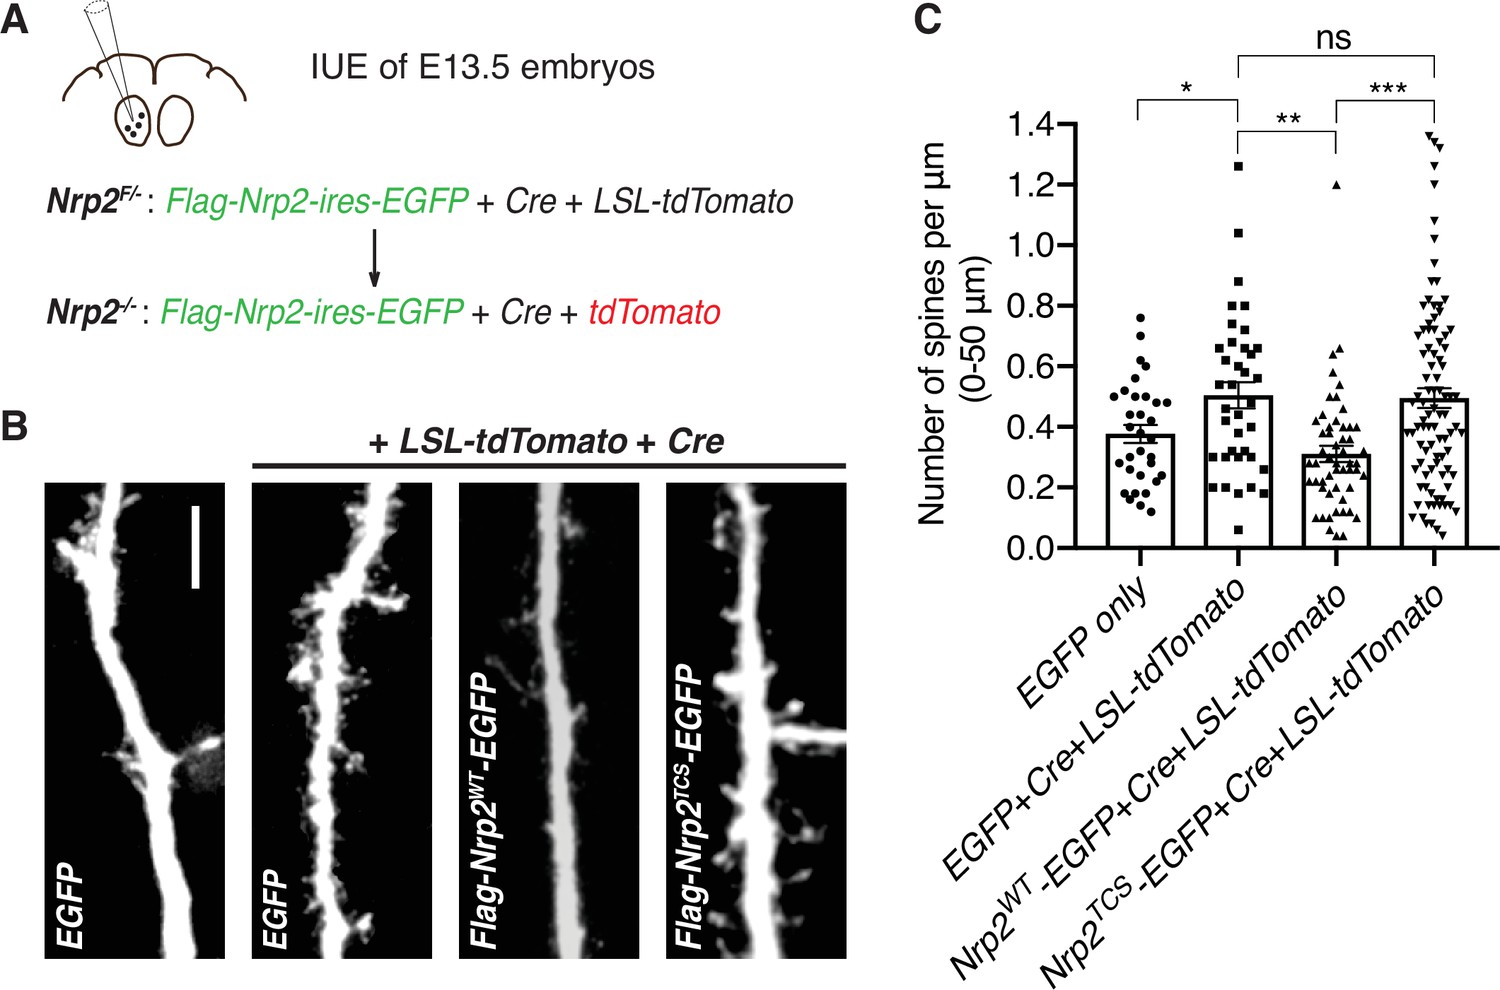
Transmembrane/juxtamembrane neuropilin-2 (Nrp2) cysteines are required in vivo for Nrp2-dependent dendritic spine pruning in deep layer cortical pyramidal neurons.
(A–C) Rescuing in vivo the Nrp2-/- dendritic spine phenotype to assess the role of membrane-associated Nrp2 cysteines in semaphorin 3F (Sema3F)/Nrp2-dependent dendritic spine retraction in layer V cortical pyramidal neurons in the mouse brain. (A) Schematic representation of the in utero electroporation (IUE) experimental approach. Embryonic day 13.5 (E13.5) Nrp2F/- embryos were electroporated in utero either with EGFP or with [EGFP+Cre+loxP-STOP-loxP-tdTomato (LSL-tdTomato)] to excise the floxed Nrp2 allele and render individual neurons Nrp2-/-. Floxed tdTomato (LSL-tdTomato) serves as a reporter of Cre activity. These two electroporations serve as controls to assess the utility of this approach in reproducing the Nrp2-/- spine density phenotype. Next, embryos were electroporated with either [flag-Nrp2WT-ires-EGFP+Cre+LSL-tdTomato] or [flag-Nrp2TCS-ires-EGFP+Cre+LSL-tdTomato] to assess the ability of wild-type (WT) or triple cysteine-to-serine (TCS) Nrp2 to constrain supernumerary dendritic spines resulting from Nrp2 deletion. All mice were analyzed on postnatal day 28 (P28). (B) Representative images of apical dendrites of electroporated layer V pyramidal neurons, which represent the 3D projection of a confocal stack, expressing the indicated combinations of plasmids. Scale bar, 7 μm. (C) Quantification of dendritic spines, counted along the proximal 50 μm (relative to the cell body) of the apical dendrite and presented as number of spines per μm. Cumulative data from IUE experiments (n≥3 mouse brains analyzed per scheme of injected plasmids) are plotted in scatter dot plots with mean ± SEM. One-way analysis of variance (ANOVA) (p=0.0001) followed by Tukey’s test for multiple comparisons; EGFP only vs. [EGFP+Cre+LSL-tdTomato], p=0.0204; [EGFP+Cre+LSL-tdTomato] vs. [flag-Nrp2WT-ires-EGFP+Cre+LSL-tdTomato], p=0.0032; [EGFP+Cre+LSL-tdTomato] vs. [flag-Nrp2TCS-ires-EGFP+Cre+LSL-tdTomato], p=0.9975; [flag-Nrp2WT-ires-EGFP+Cre+LSL-tdTomato] vs. [flag-Nrp2TCS-ires-EGFP+Cre+LSL-tdTomato], p=0.0003. EGFP only, 32 neurons; [EGFP +Cre+LSL-tdTomato], 37 neurons; [flag-Nrp2WT-ires-EGFP+Cre+LSL-tdTomato], 53 neurons; [flag-Nrp2TCS-ires-EGFP+Cre+LSL-tdTomato], 92 neurons.
-
Figure 5—source data 1
Raw data for Figure 5C.
- https://cdn.elifesciences.org/articles/83217/elife-83217-fig5-data1-v1.xlsx
Figure 6 with 1 supplement

ZDHHC15 regulates neuropilin-2 (Nrp2) palmitoylation and function, but not Nrp1, in deep layer primary cortical neurons.
(A–C) Acyl-biotin exchange (ABE) performed on embryonic day 14.5 (E14.5) days in vitro (DIV)12 wild-type (WT) C57BL/6J or Zdhhc15-KO primary cortical neurons. (A) Representative immunoblots of palmitoylated (+HA) and input samples for Nrp2 and Nrp1. (B, C) Quantification of palmitoylated Nrp2 (B) or Nrp1 (C), calculated as the ratio of palmitoylated protein (+HA) to the respective input; this ratio is set at 100% for WT neurons and the ratio for Zdhhc15-KO neurons is expressed as a percentage of the WT. In each ABE experiment, three different biological samples for each genotype (I, II, III are derived from different cortical cultures/mice and represent biological replicas) were processed in parallel and averaged in order to control for intraexperimental reproducibility and for potential differences in endogenous protein expression among samples. Nrp2, n=3 ABE experiments; Nrp1, n=2 ABE experiments. Cumulative data are plotted in scatter dot plots with mean ± SEM. Two-tailed t test; Nrp2 mean: WT = 100%, Zdhhc15-KO=49.64%; Nrp1 mean: WT = 100%, Zdhhc15-KO=113%. (D–F) Assessment of the ability of WT C57BL/6J or Zdhhc15-KO primary cortical neurons to respond to semaphorin 3F (Sema3F) by excess dendritic spine pruning. Neurons were transfected with an EGFP-expressing plasmid, and at DIV21 they were treated with 5 nM Sema3F-AP or 5 nM AP (control) for 6 hr, followed by EGFP immunofluorescence to visualize neuronal morphology. (D) Representative images are shown for WT and Zdhhc15-KO neurons. Scale bar, 7 μm. (E, F) Quantification of dendritic spines, counted along the proximal 50 μm (from cell body) on the largest dendrite, presented as number of spines per μm and plotted in scatter dot plots including mean ± SEM. Note that WT neurons exhibit significant Sema3F-induced spine retraction, whereas Zdhhc15-KO neurons invariably display no response to Sema3F-AP (compared to AP). Two-tailed t test; WT: n=3 experiments; Sema3F-AP, 78 neurons; AP, 119 neurons. Zdhhc15-KO: n=3 experiments; Sema3F-AP, 144 neurons; AP, 147 neurons. (G–I) Assessment of the ability of WT C57BL/6J or Zdhhc15-KO primary cortical neurons to respond to Sema3A by elaborating their dendritic tree. E14.5 primary cortical neurons treated at DIV12 with 5 nM Sema3A-AP or 5 nM AP (control) for 6 hr and subjected to microtubule-associated protein 2 (MAP2) immunofluorescence. (G) Representative images are shown for each genotype and represent the 3D projection of a confocal stack. Scale bar, 20 μm. (H, I) Quantitative assessment of dendritic arborization with Sholl analysis, presented as number of intersections at various distances from the center of the cell body, and plotted as mean ± SEM for each distance. Both WT and Zdhhc15-KO cortical neurons exhibit a more elaborate perisomatic dendritic arbor following Sema3A-AP treatment compared to AP (control) treatment. WT: n=2 experiments; Sema3A-AP, 72 neurons; AP, 62 neurons. Zdhhc15-KO: n=3 experiments; Sema3A-AP, 77 neurons; AP, 110 neurons. Multiple t tests: (H), ***p<0.001, **p=0.0043; (I), **p=0.003, *p=0.046.
-
Figure 6—source data 1
Raw, unedited blot from Figure 6A.
- https://cdn.elifesciences.org/articles/83217/elife-83217-fig6-data1-v1.pdf
-
Figure 6—source data 2
Raw, unedited blot from Figure 6A.
- https://cdn.elifesciences.org/articles/83217/elife-83217-fig6-data2-v1.pdf
-
Figure 6—source data 3
Raw, labeled blot from Figure 6A.
- https://cdn.elifesciences.org/articles/83217/elife-83217-fig6-data3-v1.pdf
-
Figure 6—source data 4
Raw, labeled blot from Figure 6A.
- https://cdn.elifesciences.org/articles/83217/elife-83217-fig6-data4-v1.pdf
-
Figure 6—source data 5
Raw data for Figure 6B.
- https://cdn.elifesciences.org/articles/83217/elife-83217-fig6-data5-v1.xlsx
-
Figure 6—source data 6
Raw data for Figure 6C.
- https://cdn.elifesciences.org/articles/83217/elife-83217-fig6-data6-v1.xlsx
-
Figure 6—source data 7
Raw data for Figure 6E.
- https://cdn.elifesciences.org/articles/83217/elife-83217-fig6-data7-v1.xlsx
-
Figure 6—source data 8
Raw data for Figure 6F.
- https://cdn.elifesciences.org/articles/83217/elife-83217-fig6-data8-v1.xlsx
-
Figure 6—source data 9
Raw data for Figure 6H.
- https://cdn.elifesciences.org/articles/83217/elife-83217-fig6-data9-v1.xlsx
-
Figure 6—source data 10
Raw data for Figure 6I.
- https://cdn.elifesciences.org/articles/83217/elife-83217-fig6-data10-v1.xlsx
Figure 6—figure supplement 1
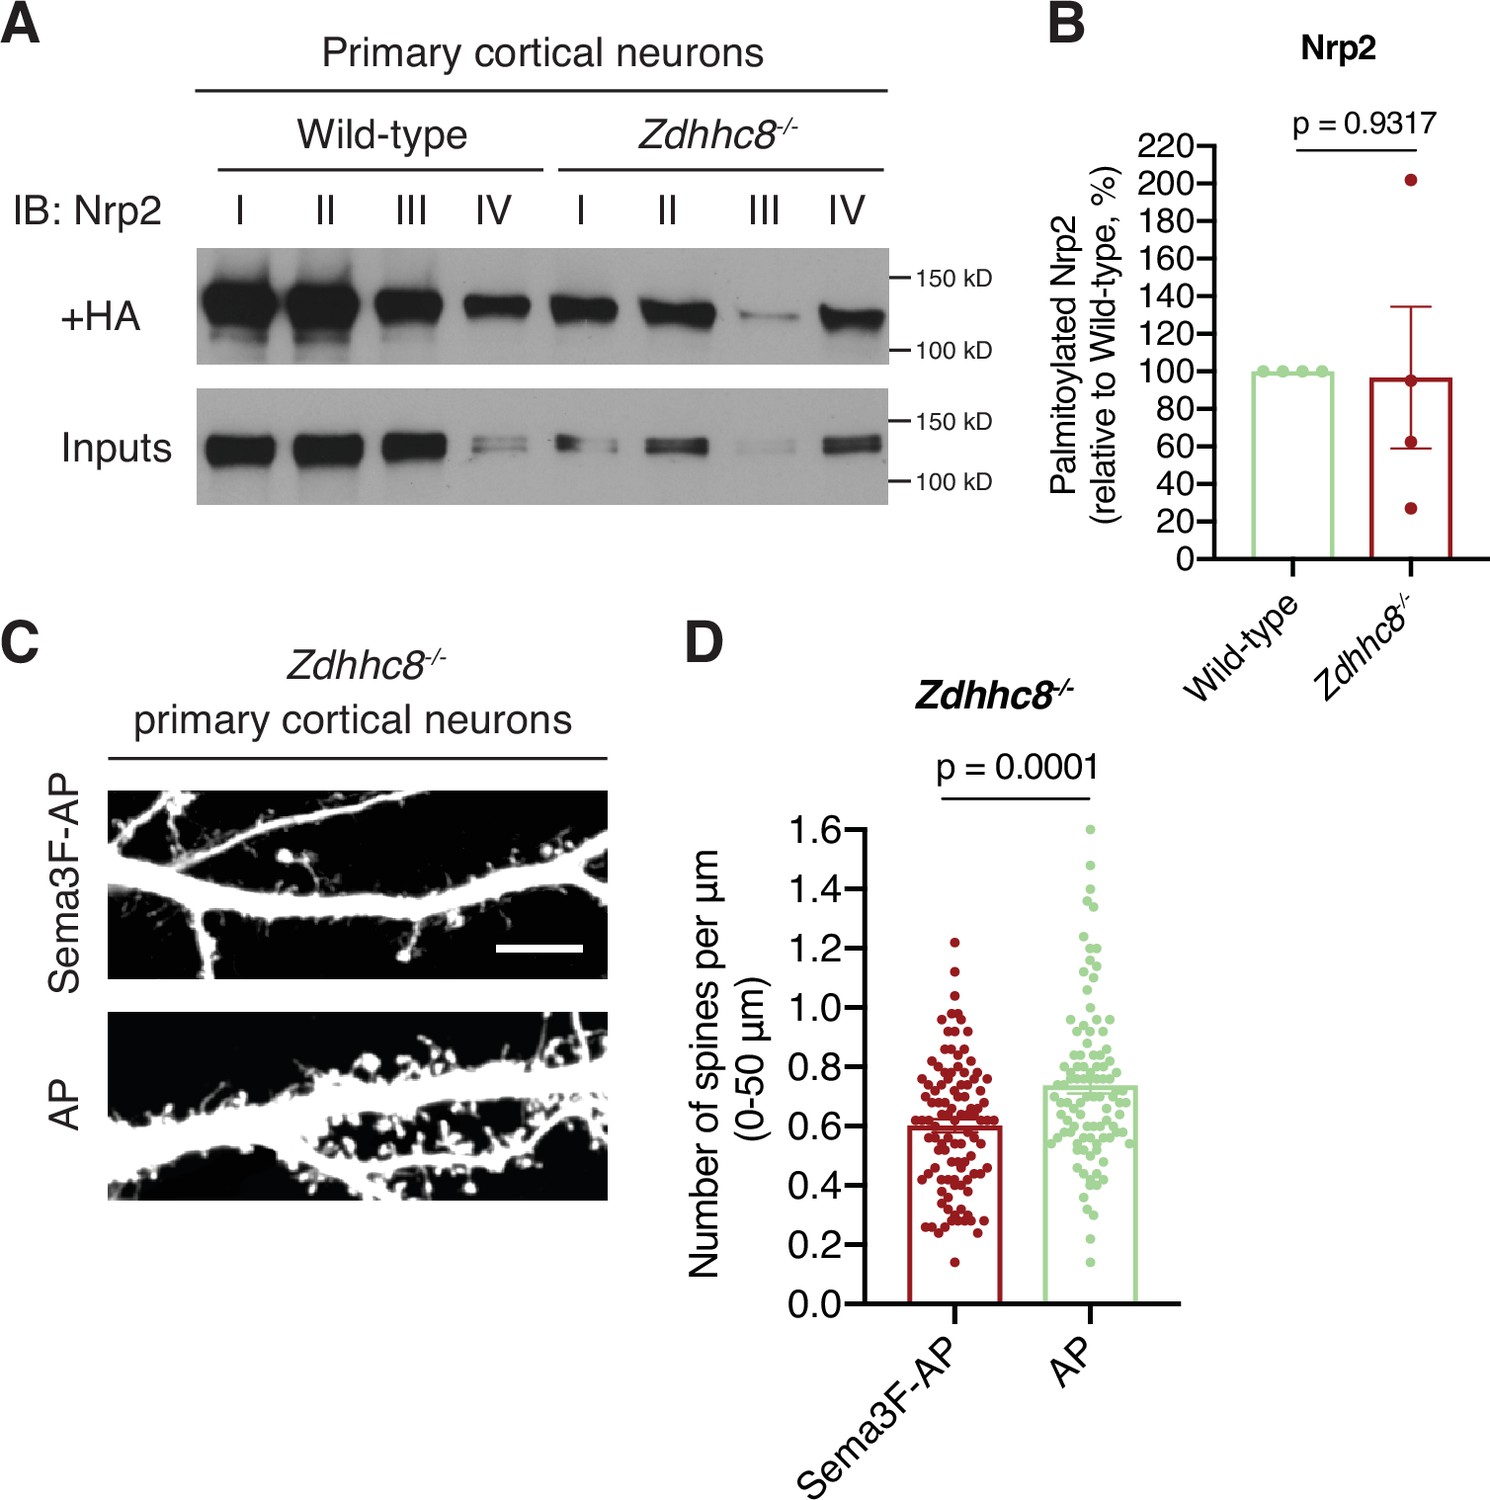
Neuropilin-2 (Nrp2) is not a substrate of palmitoyl acyltransferase ZDHHC8 in deep layer primary cortical neurons.
(A, B) Acyl-biotin exchange (ABE) performed on E14.5 days in vitro (DIV)12 wild-type C57BL/6J or Zdhhc8-/- primary cortical neurons to assess Nrp2 palmitoylation levels. (A) Nrp2 immunoblotting of palmitoylated (+HA) and input samples (I, II, III, IV represent biological replicas). (B) Quantification of palmitoylated Nrp2 levels, calculated as the ratio of +HA to the respective input; this ratio for Zdhhc8-/- neurons is expressed as a percentage of that in wild-type (set at 100%). Pooled data are plotted in scatter dot plot with mean ± SEM (n=4 pairs of samples, wild-type vs. Zdhhc8-/-). These experiments reveal no consistent difference in Nrp2 palmitoylation between wild-type and Zdhhc8-/- cultured cortical neurons. Two-tailed t test (high variability likely results from the differences in inputs and, possibly, also from inter-experimental variability). (C, D) Semaphorin 3F (Sema3F) causes dendritic spine pruning on DIV21 Zdhhc8-/- deep layer cortical neurons in culture. (C) Representative images are shown for each treatment group (Sema3F-AP and AP control group) and constitute the 3D projection of a confocal stack. Scale bar, 7 μm. (D) Quantification of spines along the proximal 50 μm on the largest dendrite (extending distally from the cell body), presented as number of spines per μm and plotted in scatter dot plot with mean ± SEM (n=2 experiments). Two-tailed t test; Sema3F-AP: 103 neurons, AP: 99 neurons.
-
Figure 6—figure supplement 1—source data 1
Raw, unedited blot from Figure 6—figure supplement 1A.
- https://cdn.elifesciences.org/articles/83217/elife-83217-fig6-figsupp1-data1-v1.pdf
-
Figure 6—figure supplement 1—source data 2
Raw, labeled blot from Figure 6—figure supplement 1A.
- https://cdn.elifesciences.org/articles/83217/elife-83217-fig6-figsupp1-data2-v1.pdf
-
Figure 6—figure supplement 1—source data 3
Raw data for Figure 6—figure supplement 1B.
- https://cdn.elifesciences.org/articles/83217/elife-83217-fig6-figsupp1-data3-v1.xlsx
-
Figure 6—figure supplement 1—source data 4
Raw data for Figure 6—figure supplement 1D.
- https://cdn.elifesciences.org/articles/83217/elife-83217-fig6-figsupp1-data4-v1.xlsx
Figure 7 with 1 supplement
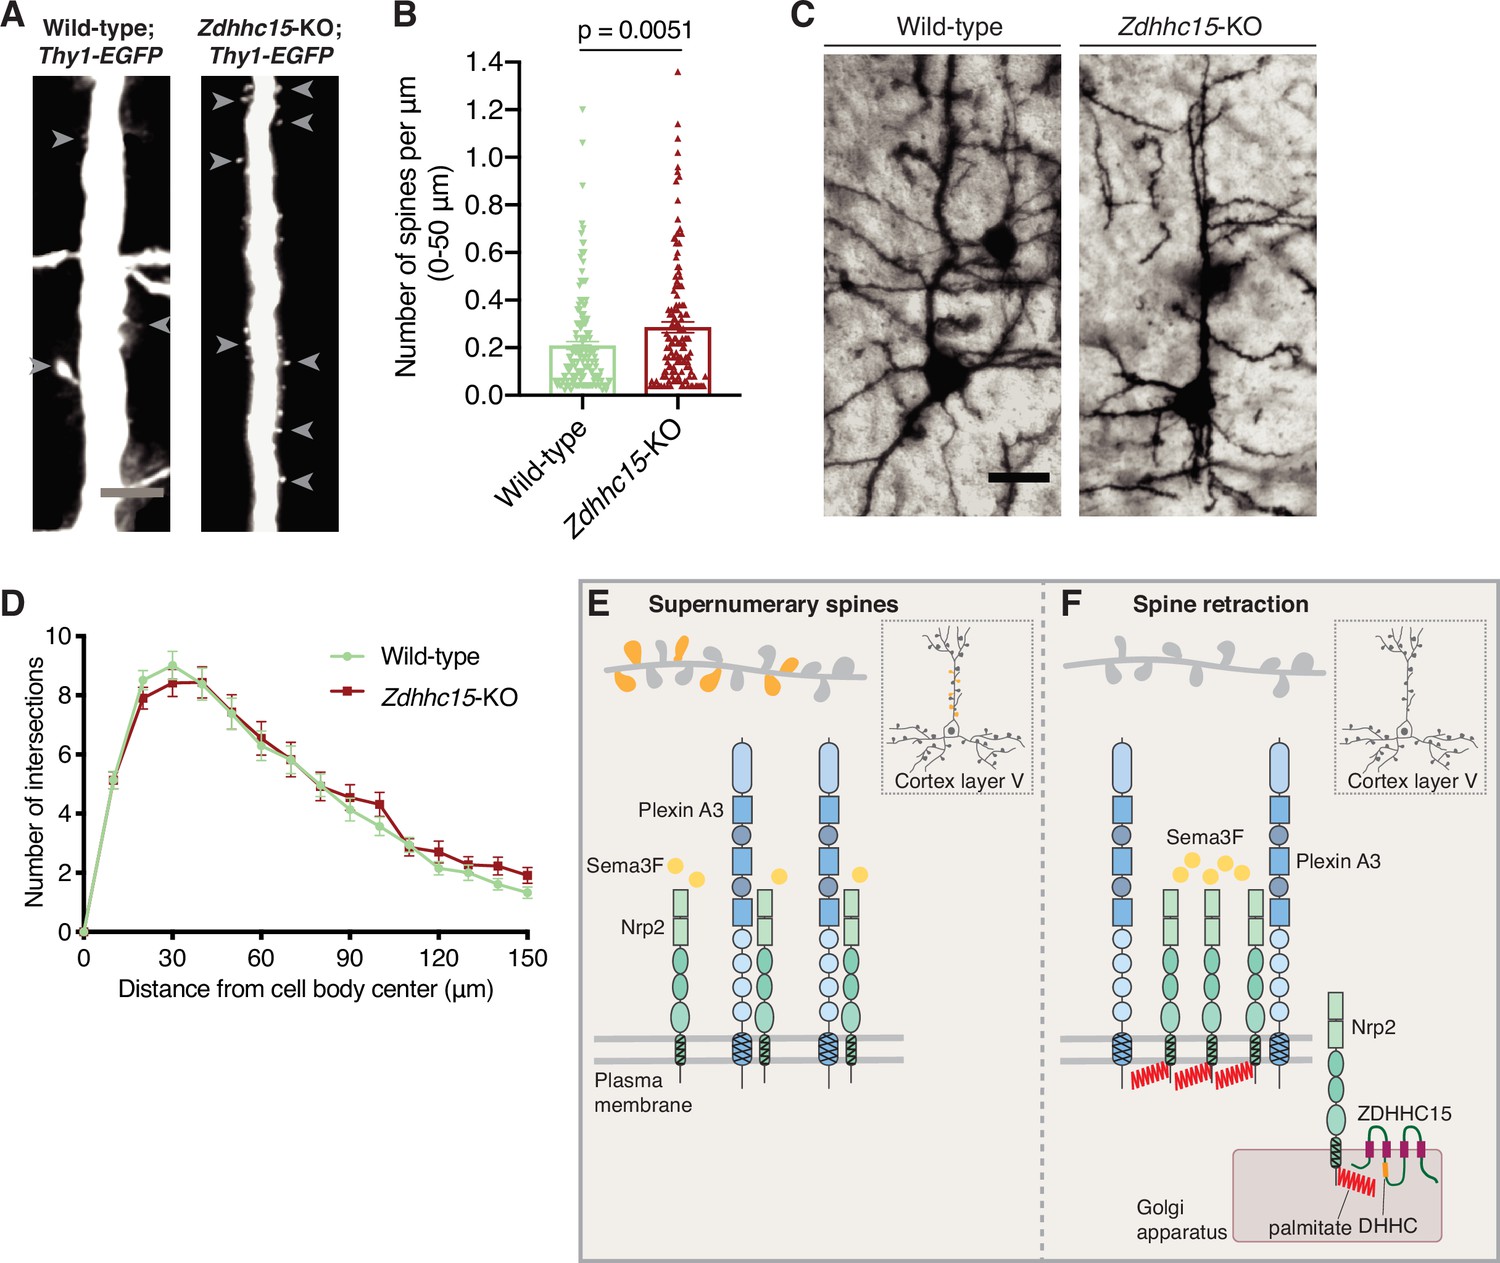
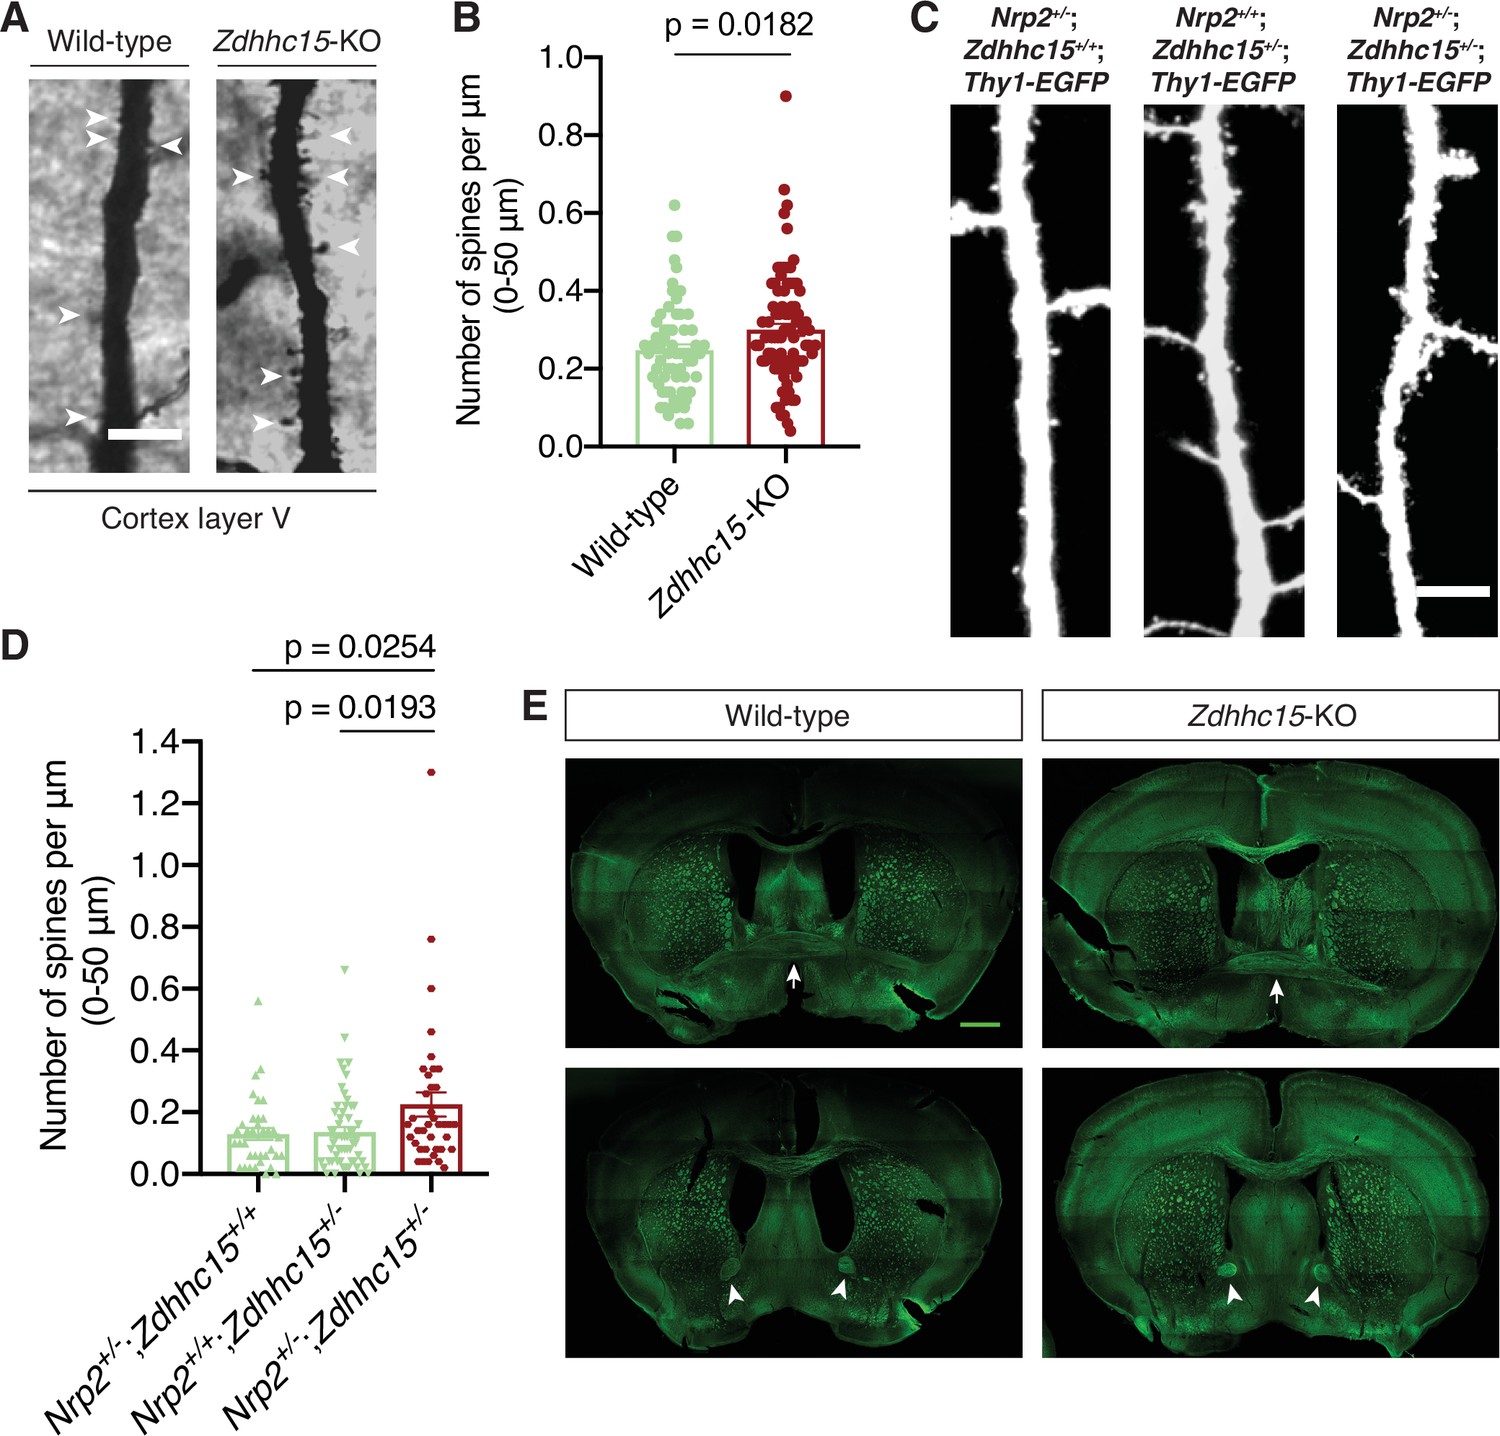
Selective effects of palmitoyl acyltransferase ZDHHC15 on layer V cortical pyramidal neuron morphology.
(A, B) Assessment of dendritic spine density on the apical dendrite of layer V cortical pyramidal neurons in postnatal day 28 (P28) brains of wild-type;Thy1-EGFP and Zdhhc15-KO;Thy1-EGFP littermates. (A) Panels show representative images of the apical dendrite of Thy1-EGFP-labeled layer V cortical pyramidal neurons for each genotype following EGFP immunofluorescence. Scale bar, 7 μm. (B) Quantification of dendritic spines, counted along the proximal 50 μm (relative to the cell body) of the apical dendrite, presented as number of spines per μm, and plotted in scatter dot plots including mean ± SEM. Two-tailed t test; n=4 pairs of mice-littermates, wild-type vs. Zdhhc15-KO. Wild-type;Thy1-EGFP: 161 neurons, Zdhhc15-KO;Thy1-EGFP: 139 neurons. (C, D) Assessment of dendritic arborization of layer V cortical pyramidal neurons in wild-type and Zdhhc15-KO brains labeled using Golgi staining. (C) Representative images are shown for each genotype and are the 3D projection of a confocal stack. Scale bar, 30 μm. (D) Quantification of dendritic arborization using Sholl analysis reveals no significant difference in dendritic arbor complexity between wild-type and Zdhhc15-KO layer V pyramidal neurons of the cerebral cortex. Cumulative data are presented as number of intersections at various distances from the cell body, and are plotted as mean ± SEM. Multiple t tests; n=3 pairs of mice-littermates, wild-type vs. Zdhhc15-KO; wild-type: 72 neurons, Zdhhc15-KO: 64 neurons. (E, F) Schematic illustration of the effects of neuropilin-2 (Nrp2) palmitoylation on Nrp2 subcellular localization, surface distribution, and semaphorin 3F (Sema3F)/Nrp2-dependent dendritic spine pruning in deep layer cortical pyramidal neurons. (E) Unpalmitoylated Nrp2 is diffusely distributed over the entire plasma membrane and unable to constrain excess dendritic spines (depicted in dark yellow) along the apical dendrite of layer V cortical pyramidal neurons (the inset depicts a pyramidal neuron of the cerebral cortex). (F) Palmitoylation on transmembrane/juxtamembrane Nrp2 cysteines, mediated in part by ZDHHC15 in the Golgi apparatus and enhanced by Sema3F, enables Nrp2 clustering on distinct plasma membrane domains and Sema3F/Nrp2-dependent pruning of supernumerary dendritic spines on the apical dendrite of layer V pyramidal neurons of the cerebral cortex during postnatal development.
-
Figure 7—source data 1
Raw data for Figure 7B.
- https://cdn.elifesciences.org/articles/83217/elife-83217-fig7-data1-v1.xlsx
-
Figure 7—source data 2
Raw data for Figure 7D.
- https://cdn.elifesciences.org/articles/83217/elife-83217-fig7-data2-v1.xlsx
Figure 7—figure supplement 1
Selective effects of ZDHHC15 on neuropilin-2 (Nrp2)-dependent developmental processes in the mouse brain.
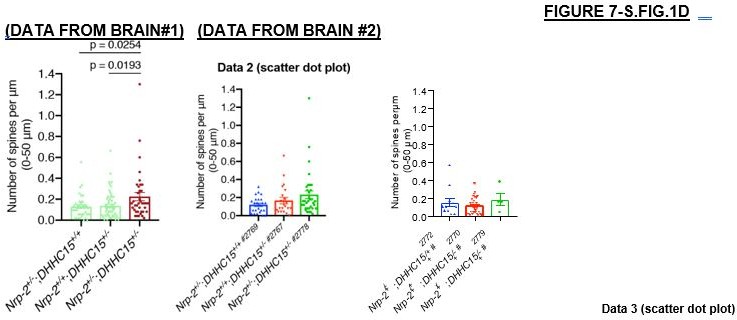
(A, B) Analysis of dendritic spine density on layer V cortical pyramidal neurons of adult wild-type and Zdhhc15-KO brains labeled with Golgi staining. (A) Representative images are shown for each genotype and constitute the 3D projections of confocal stacks. White arrowheads point to dendritic spines. Scale bar, 7 μm. (B) Quantification of dendritic spines, counted along the proximal 50 μm (relative to the cell body) on neurons’ apical dendrite. Data from independent experiments (n=3 pairs of mice-littermates, wild-type vs. Zdhhc15-KO) are presented as number of spines per μm and plotted in scatter dot plot with mean ± SEM. Two-tailed t test; wild-type, 65 neurons; Zdhhc15-KO, 85 neurons. (C, D) Genetic interaction analysis in vivo between Nrp2 and Zdhhc15 for the Nrp2 mutant dendritic spine density phenotype in layer V cortical pyramidal neurons. Littermates of three different genotypes were analyzed on P33: the single heterozygotes Nrp2+/-;Zdhhc15+/+;Thy1-EGFP and Nrp2+/+;Zdhhc15+/-;Thy1-EGFP and the transheterozygote Nrp2+/-;Zdhhc15+/-;Thy1-EGFP. (C) Panels show representative images of apical dendrites of Thy1-EGFP-labeled layer V cortical pyramidal neurons harboring the indicated genotype, visualized with EGFP immunofluorescence. Scale bar, 7 μm. (D) Quantification of the genetic interaction experiment between Nrp2 and Zdhhc15. Dendritic spines were counted along the 0–50 μm apical dendritic segment and are presented as number of spines per μm2 in scatter dot plot including mean ± SEM (n=2 brains/4 cerebral hemispheres per genotype). This is a low ‘n’ owing to the rarity of these animals, since only littermates that harbored each of the three genetic configurations and expressed Thy1-GFP were analyzed; further, since Zdhhc15 is located at the X chromosome, these mice had to be females to allow study of dose-dependent effects. Nrp2+/-;Zdhhc15+/+;Thy1-EGFP: 36 neurons. Nrp2+/+;Zdhhc15+/-;Thy1-EGFP: 57 neurons. Nrp2+/-;Zdhhc15+/-;Thy1-EGFP: 38 neurons. One-way analysis of variance (ANOVA) followed by Dunnett’s test for multiple comparisons. (E) Neurofilament (2H3) staining on coronal brain sections of adult wild-type and Zdhhc15-KO mice reveals intact midline crossing fibers (marked by white arrows) and anterior limb (marked by white arrowheads) of the anterior commissure in both wild-type and Zdhhc15 mutant mice (observed in all mice analyzed, n=3 mice per genotype). Brain sections are imaged with tile scan (the horizontal and vertical lines represent artifacts of tile scan). Scale bar, 800 μm.
-
Figure 7—figure supplement 1—source data 1
Raw data for Figure 7—figure supplement 1B.
- https://cdn.elifesciences.org/articles/83217/elife-83217-fig7-figsupp1-data1-v1.xlsx
-
Figure 7—figure supplement 1—source data 2
Raw data for Figure 7—figure supplement 1D.
- https://cdn.elifesciences.org/articles/83217/elife-83217-fig7-figsupp1-data2-v1.xlsx
Author response image 1
Videos
Video 1
Neuropilin-2 (Nrp2) localizes on the plasma membrane of primary cortical neurons in numerous discrete puncta. Time-lapse imaging of a neuron expressing pHluorin-tagged Nrp2 WT. Scale bar, 8 μm.
Video 2
Trafficking dynamics of pHluorin-tagged Nrp2 WT in primary cortical neurons visualized with fluorescence recovery after photobleaching (FRAP) (from Figure 3E).
Video 3
Trafficking dynamics of pHluorin-tagged Nrp2 TCS in primary cortical neurons visualized wtih fluorescence recovery after photobleaching (FRAP) (From Figure 3E).
Additional files
Download links
A two-part list of links to download the article, or parts of the article, in various formats.
Downloads (link to download the article as PDF)
Open citations (links to open the citations from this article in various online reference manager services)
Cite this article (links to download the citations from this article in formats compatible with various reference manager tools)
Palmitoylation regulates neuropilin-2 localization and function in cortical neurons and conveys specificity to semaphorin signaling via palmitoyl acyltransferases
eLife 12:e83217.
https://doi.org/10.7554/eLife.83217


