Dynamic top-down biasing implements rapid adaptive changes to individual movements
- Center for Integrative Neuroscience and Howard Hughes Medical Institute, University of California, San Francisco, United States
Figures
Figure 1 with 2 supplements
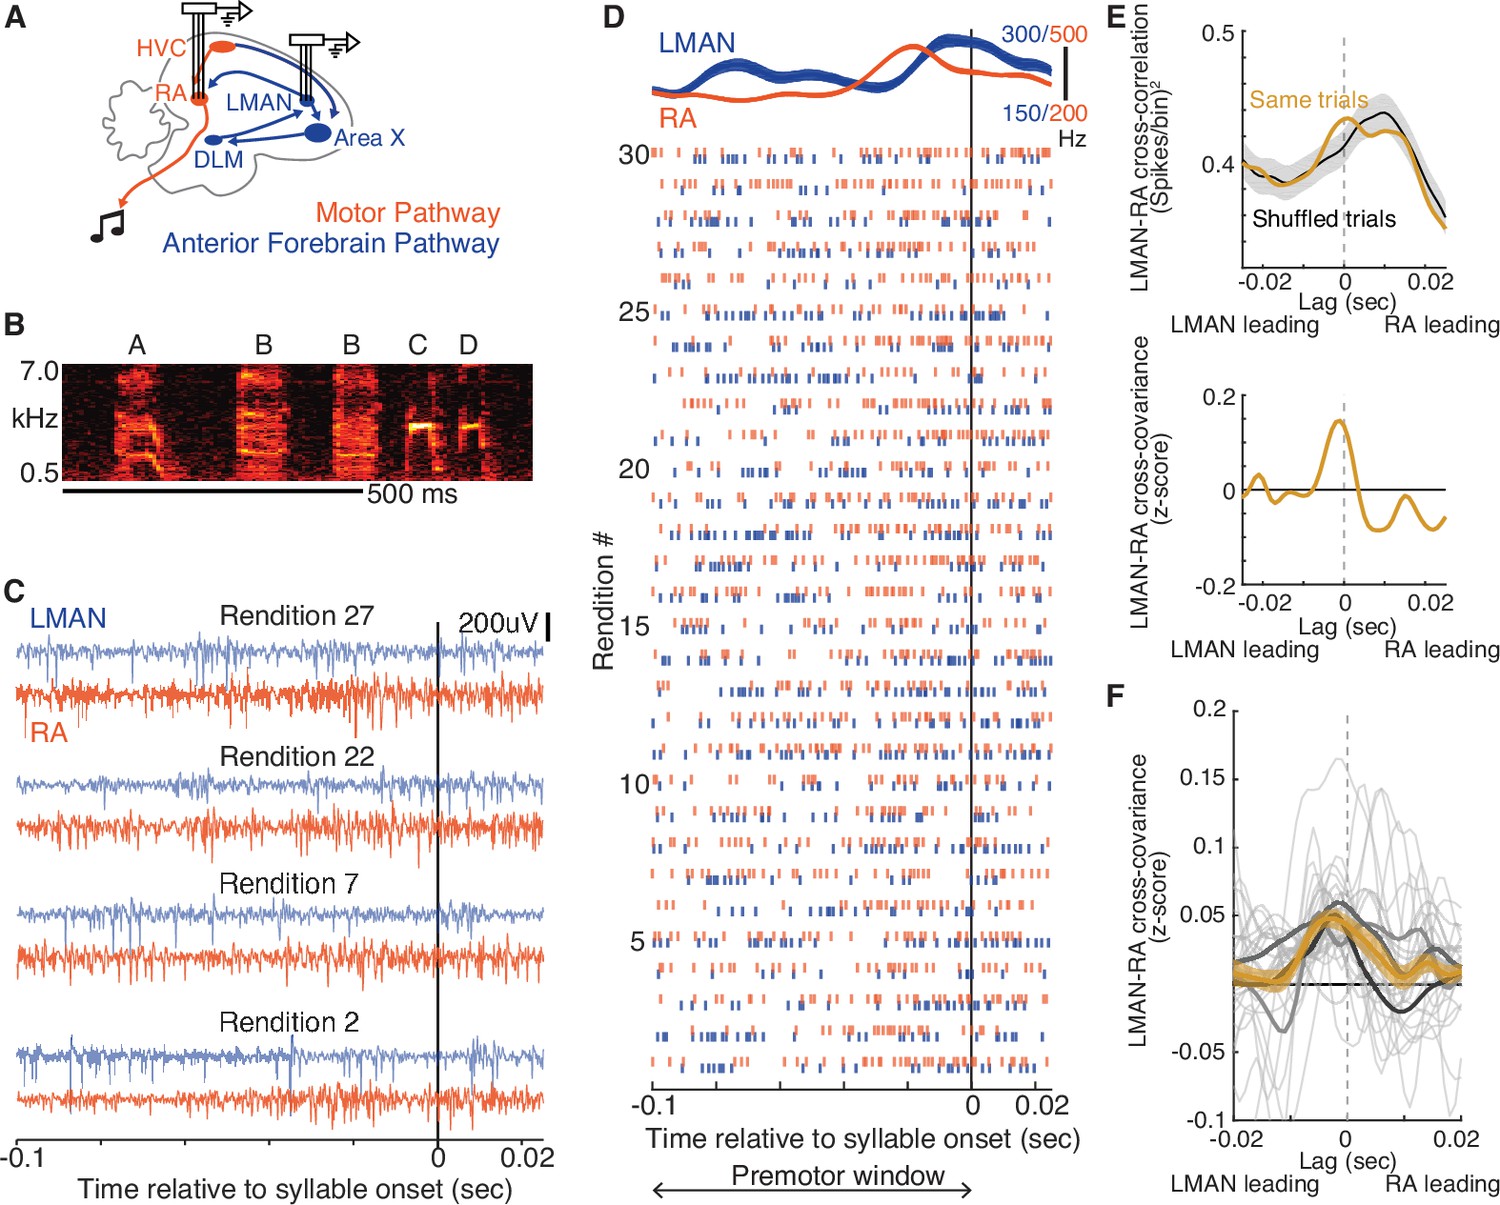
LMAN-leading co-fluctuations of LMAN and RA activity are present during singing.
(A) Schematic of song system circuitry implicated in the production and learning of birdsong. This study focuses on hypothesized top-down signals from LMAN (lateral magnocellular nucleus of the anterior nidopallium), the output nucleus of the Anterior Forebrain Pathway (blue), to RA (robust nucleus of the arcopallium) in the Motor Pathway (red). RA sends projections to brainstem motor nuclei. Recordings of multi-unit activity were made using multi-electrode arrays chronically implanted in LMAN and RA. DLM, medial dorsolateral nucleus of thalamus. HVC and Area X are used as proper names. (B) Spectrogram of a single bout of a motif ‘ABBCD’ A motif is a specific sequence of syllables that is consistently sung across bouts and is unique to a bird (see Methods). Scale bar, 500 ms. (C) Example paired recordings in LMAN and RA across four renditions (numbered to match those in panel D) aligned to the onset of a single syllable, filtered in the spike band (300–3000 Hz). (D) Raster plot representing spikes for the same pair of LMAN and RA sites shown in panel C, across 30 renditions, ordered chronologically and aligned to syllable onset. Above the raster plot are the mean (± SEM) smoothed firing rates. ‘Premotor window’ refers to the time window of neural activity used for calculating the cross-covariance between LMAN and RA spike trains. (E) Calculation of normalized cross-covariance for the example sites and syllable in panels C and D. Top: cross-correlation between LMAN and RA was calculated using spike trains for both concurrent trials (Same trial) and a control dataset in which LMAN and RA activity patterns were shuffled between adjacent renditions (‘Shuffled trials’, mean ± standard error of the mean [SEM]). We used this shuffling procedure to estimate the cross-correlation between the mean activity patterns in LMAN and RA (i.e., eliminating the contribution of rendition-by-rendition variation that is shared between LMAN and RA, see Methods). Bottom: the mean of the shuffle-computed cross-correlation functions (Shuffled trials) was subtracted from the actual cross-correlation function (Same trials) to compute cross-covariance. We then divided the cross-covariance by the standard deviation of the shuffled cross-correlations to compute a normalized cross-covariance (measured in z-score). (F) LMAN–RA cross-covariance across all syllables and pairs of LMAN and RA sites during baseline singing. The light gray curves represent individual syllables (N = 27), averaged over all simultaneously recorded pairs of LMAN and RA sites (N = 38 total LMAN–RA site pairs, 3 birds). Mean ± SEM cross-covariance (across syllables, with each syllable contributing its mean over recording site pairs) is shown for individual birds (dark gray) and all data (orange).
Figure 1—figure supplement 1
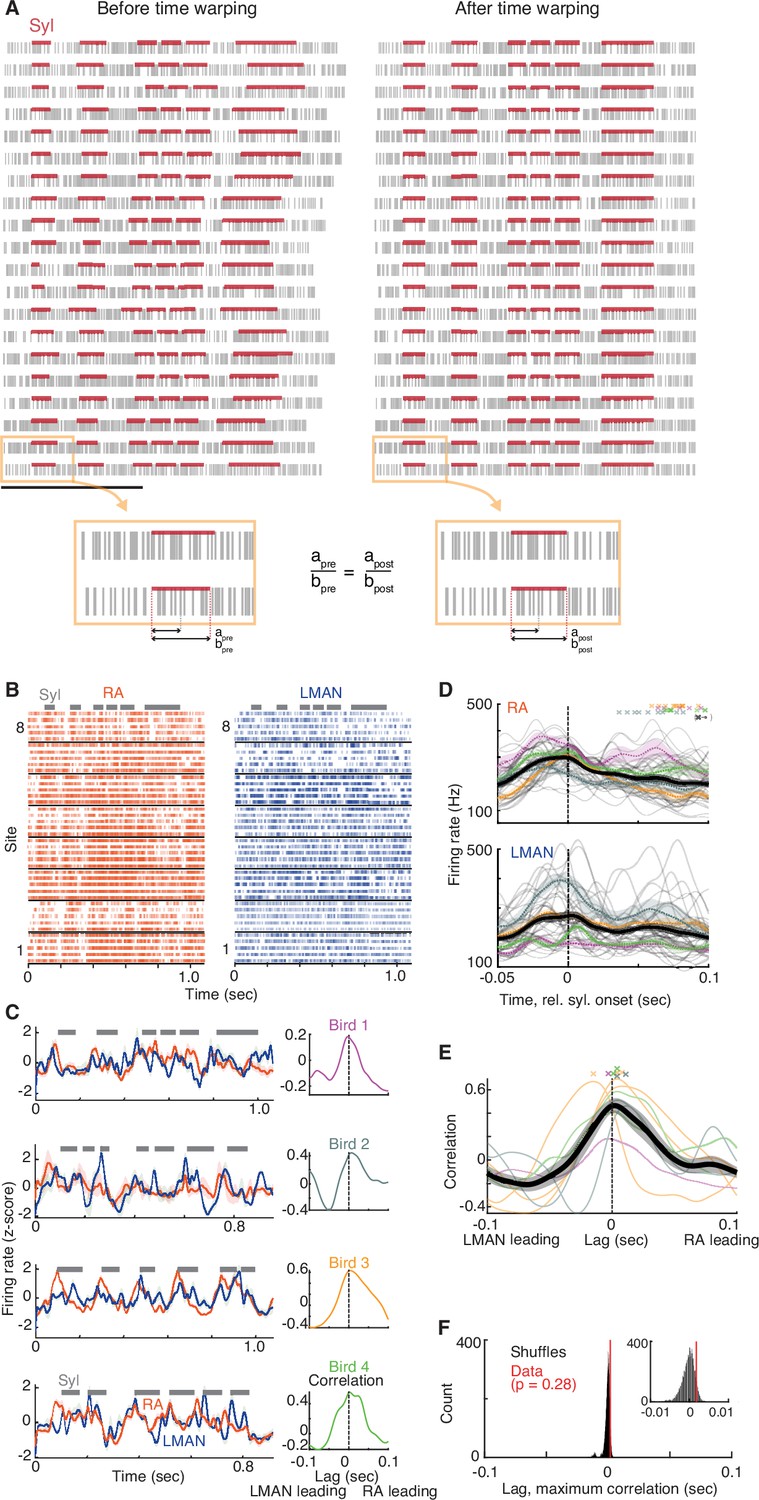
LMAN and RA average activity patterns align to each other with time lag close to zero.
(A) Linear time warping methodology. Linear time warping was used to align all renditions of a given motif (across all LMAN and RA recordings) to a single reference rendition. Raster of spike times before (left) and after (right) time warping, for 20 example renditions (rows) of an example motif. Horizontal red bars represent times of syllables in this motif. Time warping aligns the spike times for all renditions to a common median ‘reference’ rendition of this motif (see Methods). The bottom two panels illustrate in detail that this time-warping procedure shifts each spike’s time such that the spike’s fractional time within its containing segment (either syllable or gap) remains unchanged after shifting (i.e., satisfying the constraint apre/bpre = apost/bpost). (B) Raster plots of spiking activity for eight example RA (left) and LMAN (right) sites aligned to a single motif, with five renditions shown for each site. Syllables are represented by gray horizontal bars. (C) Left column, mean LMAN (blue) and RA (red) activity over all recorded sites, for four example song motifs (rows, each from a different bird). Syllables are indicated by gray bars. Right column, cross-correlation between mean LMAN and RA firing rate traces for the data on the left. N = 8 LMAN sites and 12 RA sites (for the motif for Bird 1), 3 LMAN and 5 RA (Bird 2), 9 LMAN and 15 RA (Bird 3), and 10 LMAN and 20 RA (Bird 4). The cross-correlation between LMAN and RA activity quantifies the relationship between rendition-averaged firing patterns in LMAN and RA; this differs from the cross-covariance measure used in the main text, which quantifies the rendition-by-rendition relationship between deviations in LMAN and RA activity from their respective means (i.e., co-fluctuations in activity). (D) Mean activity aligned to syllable onsets for all RA (top) and LMAN (bottom) sites. Thick, dark trace is mean ± standard error of the mean (SEM) activity taken over all syllables [N = 39 (range 6–14 across birds), each represented as a thin gray trace showing mean across sites], extracted from all motifs (N = 8 motifs for 4 birds, range 1–3 per bird). Colored, dashed traces show mean for each bird. Crosses on top panel represent the offset time of each syllable. The black ‘x’ indicates that offsets for four syllables are off the graph, at timepoints 0.11 (orange), 0.12 (orange), 0.11 (blue), and 0.19 (purple) s. (E) Cross-correlation functions for all song motifs. Thin traces represent cross-correlations for each motif, colored by bird (same as panel C). Thick trace represents mean ± SEM across motifs (N = 8 motifs). Crosses on top represent times of maximum correlation for each motif. N = 30 LMAN, 52 RA sites total (range 3–10 LMAN, 5–20 RA across 4 birds). (F) The time lag between LMAN and RA average activity patterns is not significantly different from zero. Comparison of the mean time lag of maximum correlation (red line, mean of cross marks in panel D) to a null distribution of time lags, representing the null hypothesis that there is no consistent non-zero time lag between LMAN and RA average activity patterns, estimated by recomputing (10,000 times) the mean time lag of maximum correlation after shuffling the brain area ‘labels’associated with each rendition-averaged firing rate trace (see Methods).
Figure 1—figure supplement 2

Histological verification of electrode locations.
Post-mortem histology was used to confirm locations of electrodes for recording and stimulation experiments (see Methods). Example micrograph of brain section stained against calcitonin gene-related peptide (green), showing locations of recording electrode tips (white outline, marked by lesion) dorsal to LMAN and RA (black outline). The location of electrodes in this image confirms that electrodes entered LMAN and RA when lowered during experiments.
Figure 2 with 2 supplements
LMAN–RA co-fluctuations are enhanced during learning.
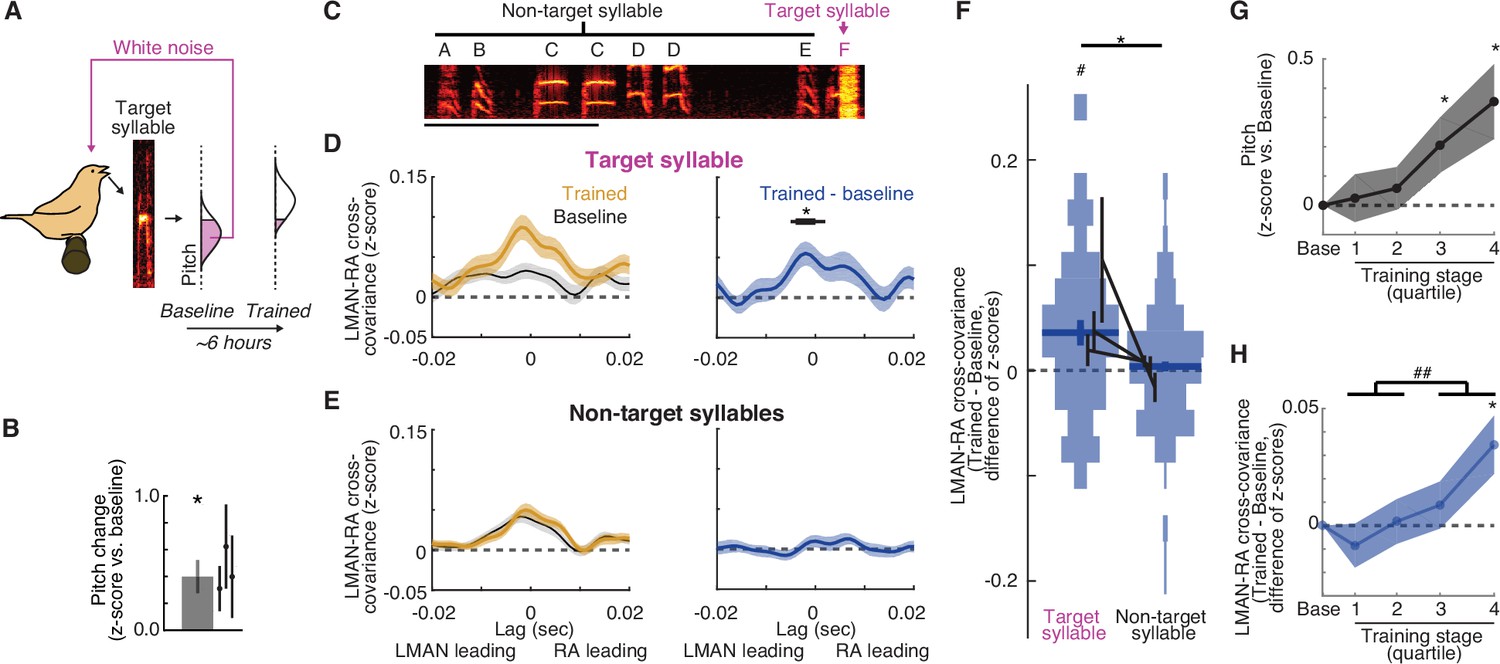
(A) Pitch training paradigm. White noise (WN) feedback is delivered during renditions of a specific target syllable when its pitch is either below or above a threshold (pink fill in ‘pitch’ histogram), depending on whether the objective is to train pitch shifts up or down, respectively. The schematic shows training for upward pitch shifts. Over the course of training (3–10 hr, mean ~6 hr), birds progressively modify pitch in the direction that escapes WN so that in this example the ‘Trained’ distribution is shifted upwards relative to ‘Baseline’. (B) Summary of the magnitude of pitch change across experiments (mean ± standard error of the mean [SEM], N = 11 experimental trajectories over 3 birds); individual points represent the mean for individual birds. *p < 0.05, Wilcoxon signed-rank test. (C) Spectrogram of a song bout in an example experiment, with the syllable ‘F’ targeted with pitch-contingent WN. Scale bar, 500 ms; y-axis, 0.5–7.0 kHz. (D) Change in cross-covariance during learning for target syllables. Left: mean ± SEM cross-covariance for ‘Baseline’and ‘Trained’ periods (last quarter of renditions during the training session) across experiments (N = 38 LMAN–RA site pairs, 11 experiments, 3 birds). Right: mean ± SEM change in cross-covariance over the course of training. Black bar indicates time bins with values significantly different from zero (thin, p < 0.05; thick, p < 0.005, Wilcoxon signed-rank test). (E) Same as (D), but for non-target syllables. For a given experiment, there was only one target syllable, but multiple non-target syllables (mean, 4.2 syllables). Thus for each LMAN–RA site pair, data were first averaged across all non-target syllables before plotting (N = 38 pairs, 11 experiments, 3 birds). (F) Summary of change in LMAN–RA cross-covariance during training for target and non-target syllables. For each combination of paired LMAN–RA sites and syllables, we computed the average change in cross-covariance (Trained – Baseline) in a 15-ms window centered at the peak of the average end-of-training cross-covariance (−3 ms) [N = 38 (Target) and 158 (Non-target) combinations of paired sites and syllables, across 11 experiments in 3 birds]. *p < 0.05, mixed effects model (fixed intercept and effect of syllable type; random effect of intercept and syllable type grouped by experiment ID). #p < 0.05, mixed effects model (fixed intercept and random effect of intercept grouped by experiment ID). (G) Time course of pitch change. Each training trajectory was analyzed by binning renditions into four training stages with equal numbers of renditions (i.e., quartiles). The average pitch change across experiments is plotted for each training stage (N = 10 experiments in 3 birds; excluding one experiment for which neural data was recorded only during baseline and the end of training.). Spacing of stages along the x-axis maintains the relative timing of stages (time of median rendition for each stage relative to median baseline rendition: stages 1, 2, 3, and 4: 1.02, 2.35, 3.73, and 5.46 hr). *p < 0.05 vs. 0, Wilcoxon signed-rank test. (H) Time course of change in LMAN–RA cross-covariance for the target syllable for the same experiments illustrated in (G) (N = 37 LMAN–RA site pairs, 10 experiments, 3 birds). *p < 0.05 vs. 0, Wilcoxon signed-rank test; ##p < 0.005, last two vs. first two training quartiles.
Figure 2—figure supplement 1

Specificity of enhancement of LMAN–RA co-fluctuations during learning.
(A) LMAN–RA co-fluctuations are enhanced during learning in a manner specific to the target syllable—reproduction of Figure 2F using a shorter duration premotor window (60 ms) for calculating cross-covariance. See legend for Figure 2F. *p < 0.05, mixed effects model (fixed intercept and effect of syllable type; random effect of intercept and syllable type grouped by experiment ID). #p < 0.05, mixed effects model (fixed intercept and random effect of intercept grouped by experiment ID). (B) Change in LMAN–RA cross-covariance was not detected for the non-target syllable sung directly preceding the target syllable in the song sequence. N = 19 LMAN–RA site pairs in 3 birds (represented by colored lines). **p < 0.005, LMAN–RA cross-covariance (trained minus baseline) modeled with fixed effects for intercept and syllable type and random effect for intercept and syllable type grouped by experiment ID. Spectrogram depicts an example experiment; scale bar, 500 ms. (C) Summary of change in LMAN and RA firing rates during training for target and non-target syllables. Firing rates in the training period, computed as mean spikes per second in the same premotor window used for computing LMAN-RA cross-covariance, were normalized by dividing the firing rates at baseline before training onset. Each data point corresponds to activity for a single syllable and recording site (RA: N = 29 Target, 127 Non-target; LMAN: 14 Target, 51 Non-target; across 11 experiments in 3 birds). n.s., not significant, t-test.
Figure 2—figure supplement 2

Lack of detected relationship between baseline activity-pitch correlations and learning-related changes in LMAN–RA cross-covariance.
(A) Change in cross-covariance during learning vs. activity-pitch correlation at baseline, across RA sites. Activity-pitch correlation was calculated as the rendition-by-rendition correlation between spike count (in the same premotor window used for computing LMAN–RA cross-covariance) and syllable pitch, for baseline renditions. For RA sites that were recorded simultaneously with multiple LMAN sites, the change in cross-covariance (y-axis) is the average over all LMAN–RA pairs for that RA site. The colors of points indicate whether the activity-pitch correlation was statistically significant. (B) Same as (A), but plotting the absolute value of the correlation coefficient on the x-axis. (C, D) Same as (A, B), but for LMAN sites. None of the correlations was significant.
Figure 3 with 1 supplement
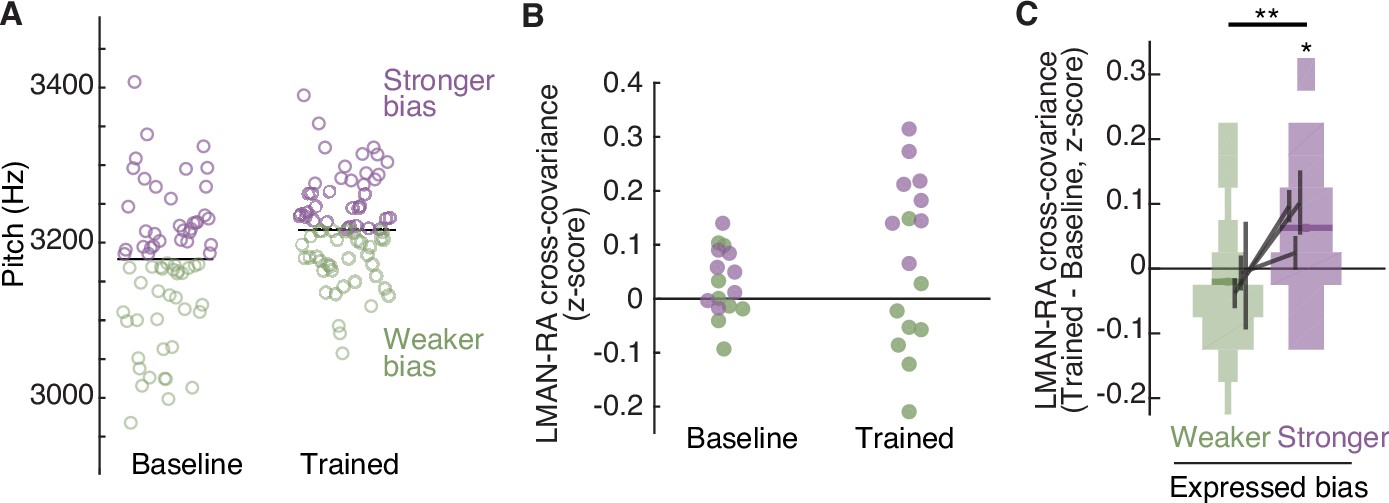
The strength of LMAN–RA co-fluctuations and the strength of adaptive motor bias are associated on a rendition-by-rendition basis.
(A) Example experiment, plotting pitch of individual renditions during baseline and at the end of training in an experiment in which white noise (WN) feedback targeted lower pitch renditions (i.e., training upwards pitch shift). Renditions are split into two groups, ‘Stronger bias’ (purple) and ‘Weaker bias’ (green) based on pitch deviation from the median. Renditions in the ‘stronger’ and ‘weaker’ groups are interleaved in time, and taken from periods with relatively stable pitch, so that any differences in LMAN–RA cross-covariance between these two groups reflects rendition-by-rendition variation, not slower ‘drift’ due to learning. We used the last half of baseline and training renditions. Each data point represents a single syllable rendition. (B) Example experiment (same as in panel A), plotting LMAN–RA cross-covariance for individual pairs of LMAN–RA sites. Each data point represents the mean cross-covariance for renditions with either stronger bias (purple) or weaker bias (green). Thus, each site pair contributes two points to the ‘Baseline’ and two points to the ‘Trained’ data (one purple, one green). The renditions used to calculate cross-covariance are the same as in panel A. Each data point represents a single LMAN–RA site pair. (C) Summary of change in LMAN–RA cross-covariance at the peak of training, relative to baseline (Trained − Baseline), measured separately for renditions expressing ‘stronger’ or ‘weaker’ bias (N = 38 LMAN–RA site pairs, 11 experiments, 3 birds). *p < 0.05, LMAN–RA cross-covariance (Trained – Baseline) modeled with fixed intercept and random intercept grouped by experiment ID. **p < 0.005, Stronger–Weaker modeled with fixed intercept and random intercept grouped by experiment ID.
Figure 3—figure supplement 1

Robustness of the rendition-by-rendition relationship between LMAN–RA co-fluctuations and adaptive motor bias.
(A) The strength of LMAN–RA co-fluctuations and the strength of adaptive motor bias are associated on a rendition-by-rendition basis—reproduction of Figure 3C using a shorter duration premotor window (60ms) for calculating cross-covariance. See legend for Figure 3C. #p < 0.05, LMAN–RA cross-covariance (Trained − Baseline) modeled with fixed intercept and random intercept grouped by experiment ID. *p < 0.005, Stronger–Weaker modeled with fixed intercept and random intercept grouped by experiment ID. (B) The strength of LMAN–RA co-fluctuations and the strength of adaptive motor bias are associated on a rendition-by-rendition basis, for experiments training upwards (left panel) or downwards (right panel) pitch shifts. Each panel shows change in LMAN–RA cross-covariance during training (Trained − Baseline), measured separately for renditions expressing ‘stronger’ or ‘weaker’ learning (up training: N = 23 LMAN–RA site pairs in 6 experiments in 3 birds; down training: 15 LMAN–RA site pairs in 5 experiments in 2 birds). *p < 0.05, Wilcoxon signed-rank test.
Figure 4 with 1 supplement
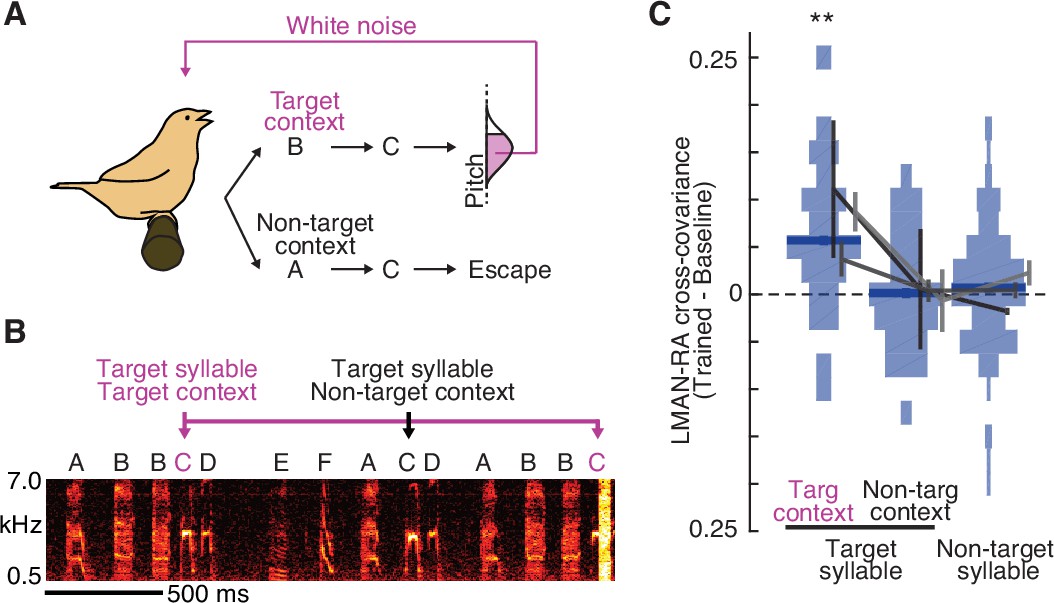
Learning-related increases in LMAN–RA co-fluctuations are context specific.
(A) Schematic of context-dependent training. In this example experiment, pitch-contingent white noise (WN) was provided for renditions of the target syllable (C) only in the ‘Target’ context (BC). WN was never provided when C was sung in ‘Non-target’ contexts (e.g., AC). (B) Spectrogram for the same experiment as in panel A, illustrating pitch-contingent WN delivered only for syllable C in the target context BC. The first rendition of BC escaped WN because its pitch was higher than the threshold defined for this experiment. (C) Summary of change in LMAN–RA cross-covariance during training (N = 24 LMAN–RA site pairs for target syllable, target context, 35 pairs for target syllable, non-target context, and 112 pairs for non-target syllables, 7 experiments, 3 birds). **p < 0.005, mixed effects model (fixed effect of intercept and syllable type; random effect of intercept and syllable type grouped by experiment ID).
Figure 4—figure supplement 1

Learning-related increases in LMAN–RA co-fluctuations are context specific.
Figure 5
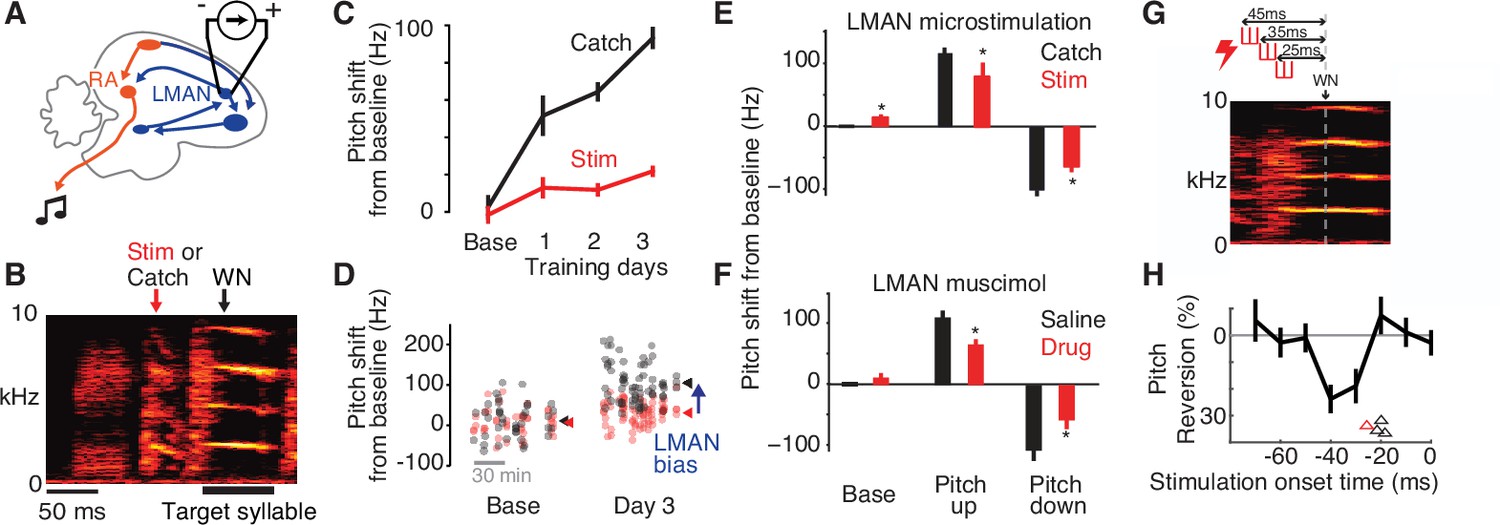
Adaptive bias is eliminated by disrupting LMAN activity in a narrow premotor window.
(A) Schematic of electrical microstimulation in LMAN. Stimulation was used to disrupt LMAN activity at precise times during singing. (B) Experimental design. To test for a causal contribution of LMAN premotor activity to pitch modifications during learning, on randomly interleaved renditions stimulation was either delivered (‘Stim’, 60 ms duration centered 50 ms prior to syllable onset) or withheld (Catch). ‘WN’ marks the average time of WN feedback for this experiment. (C) An example experiment in which pitch was shifted away from baseline over 3 days, with LMAN microstimulation performed during 1–3 hr blocks on the baseline day and 3 subsequent training days, depicting pitch (mean ± standard error of the mean [SEM]) for stimulated (Stim) and non-stimulated (Catch) syllable renditions. (D) Scatterplot showing pitch of individual renditions from the experiment in panel C on randomly interleaved stimulated (red) and catch (black) renditions during baseline and training day 3 (arrowheads, mean pitch). The magnitude of LMAN bias is estimated as the difference between Stim and Catch renditions (blue arrow). (E) Summary of effects of LMAN microstimulation on pitch across all experiments (N = 14 training sessions in 4 birds), plotted for baseline (Base), and training (mean over training days 1–3) for experiments training pitch up or down. *p < 0.05, t-test comparing Catch to Stim. (F) Same as panel E, but for experiments in which LMAN was inactivated pharmacologically using muscimol or lidocaine (Drug). Pharmacological perturbation had quantitatively similar effects on pitch compared to electrical microstimulation in panel E. Data were previously published (Warren et al., 2011). (G) Schematic of experiment using short-duration microstimulation [red hash marks, durations 10 ms (n = 3 experiments) or 15 ms (n = 1)] applied at varying timepoints in the target syllable’s premotor window. Onset timing of stimulation was varied from −65 to +5 ms relative to the expected timepoint of WN delivery (WN). Three example microstimulation trains are shown, with onsets at −45, −35, and −25 ms. (H) Analysis of the temporal latency between short-duration microstimulation and pitch reversion. Black trace shows pitch reversion for the example experiment in Panel G, measured for a single 8ms time bin, caused by stimulation at varying times relative to the time of pitch measurement (‘Stimulation onset time’, time between the centers of the time bins for stimulation and measuring pitch). Arrowheads depict, for each experiment, the minimum latency between stimulation and significant pitch reversion, calculated from continuous pitch contours (red arrowhead refers to the experiment shown in panel G).
Additional files
Download links
A two-part list of links to download the article, or parts of the article, in various formats.
Downloads (link to download the article as PDF)
Open citations (links to open the citations from this article in various online reference manager services)
Cite this article (links to download the citations from this article in formats compatible with various reference manager tools)
Dynamic top-down biasing implements rapid adaptive changes to individual movements
eLife 12:e83223.
https://doi.org/10.7554/eLife.83223


