How inhibitory and excitatory inputs gate output of the inferior olive
- Department of Neuroscience, Erasmus MC, Netherlands
- Netherlands Institute for Neuroscience, Royal Academy of Arts & Sciences, Netherlands
- Faculty of Health Sciences, Universidad Católica Silva Henríquez, Chile
Figures
Figure 1
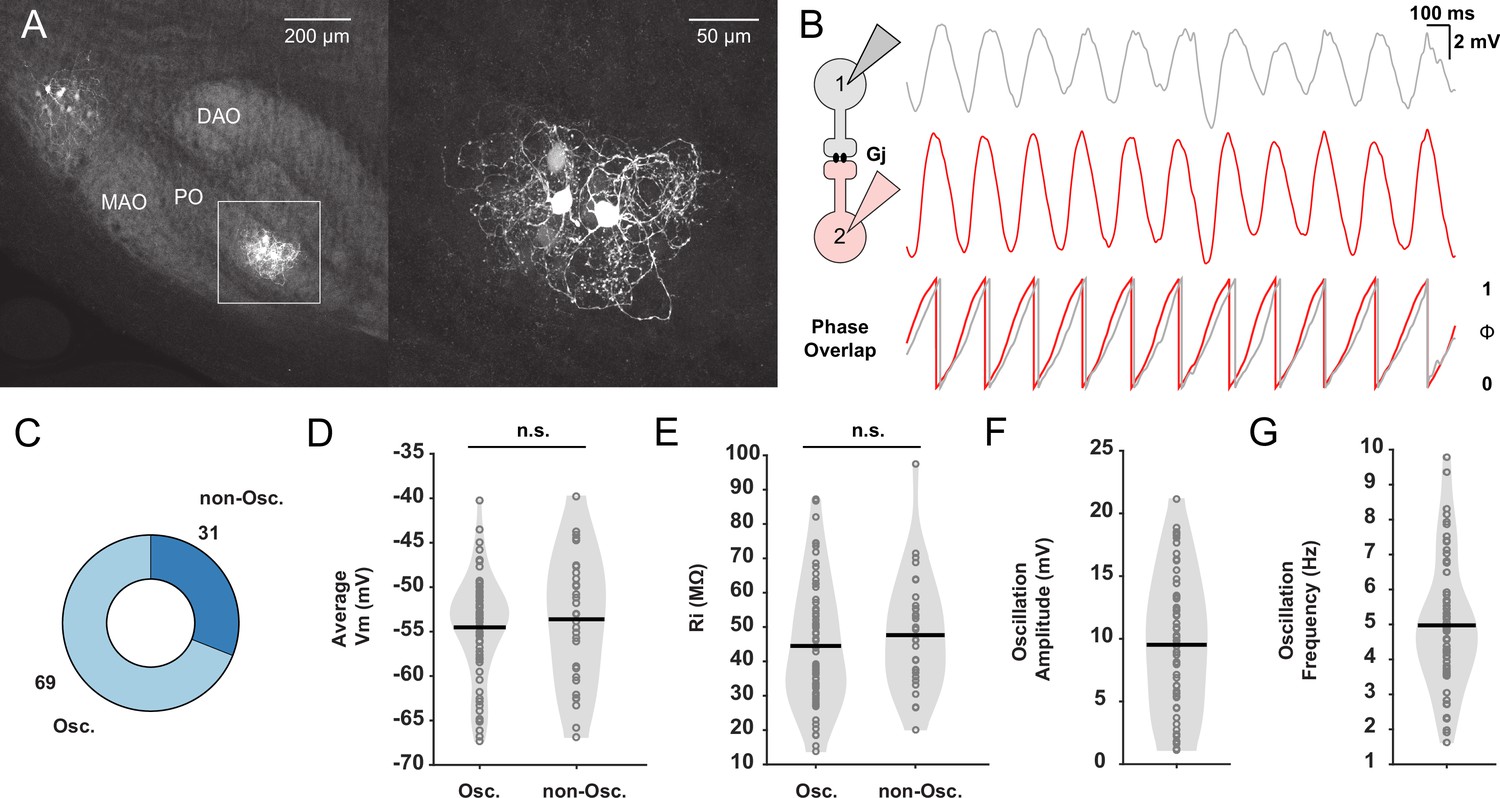
In vitro whole-cell patch-clamp recordings of oscillating and non-oscillating neurons in the inferior olive (IO).
(A) Dye coupling between electrically coupled neurons in the IO was visualized by performing immunostaining on neurons dialyzed with biocytin. Note that the dendrites of the cluster of the labeled olivary neurons are in this case exclusively located in the principal olive (PO) and do not traverse into the medial accessory olive (MAO) or dorsal accessory olive (DAO). Right panel corresponds to inset on the left. (B) Left: Schematic illustrating dual whole-cell patch-clamp recordings of two IO neurons coupled by gap junctions (Gj). Right: Example traces of two IO neurons displaying synchronized subthreshold oscillations (STOs) and the phase of these oscillations with respect to each other underneath. (C) Pie plot showing the proportion (in %) of IO neurons that display STOs (Osc.) or not (non-Osc.). (D) Average membrane potential (Vm) in millivolt (mV) of oscillating and non-oscillating neurons. (E) Input resistance (Rin) in mega-ohm (MΩ), of oscillating and non-oscillating neurons. (F and G) Amplitude (in mV) and frequency (in Hz) of STOs of oscillating IO neurons, respectively. Each open gray circle in panels D to G represents one cell; black lines indicate mean values; and n.s. indicates not significant.
Figure 2 with 2 supplements
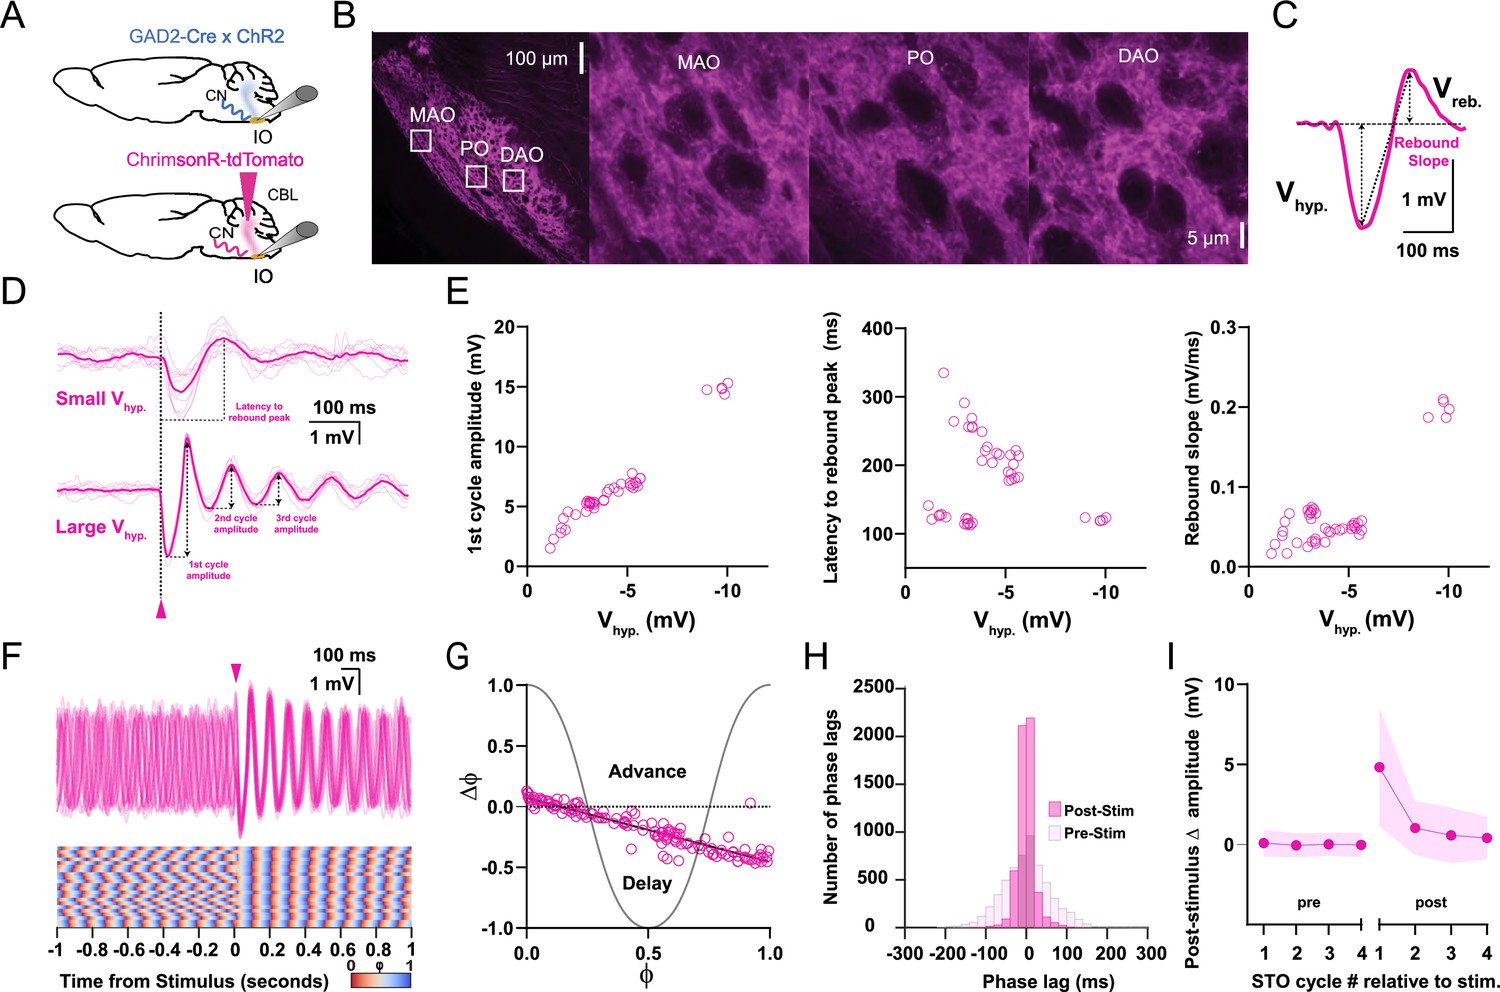
Responses of oscillating and non-oscillating neurons in the inferior olive (IO) to stimulation of GABAergic afferents from the cerebellar nuclei (CN).
(A) Either we expressed ChrimsonR-tdTomato in the CN of wild type mice or we use GAD2Cre/Chr2- H134R-EYFP transgenic mice so as to be able to specifically stimulate the GABAergic input to the IO with optogenetics. (B) Confocal images of a sagittal section of the brainstem comprising the IO. Note that the GABAergic fibers from the CN project to all three olivary subnuclei, including the principal olive (PO), medial accessory olive (MAO), and dorsal accessory olive (DAO). Insets on the left correspond to higher magnifications on the right. (C) Stimulation of CN fibers typically elicits a biphasic response in olivary neurons; this response starts with a hyperpolarizing component (Vhyp) and is followed by a rebound component (Vreb). Arrows denote how the amplitude was measured for each component. (D) Whole-cell patch-clamp recording of an IO neuron that did not oscillate during baseline (i.e., a non-oscillating cell). Note that the cell starts to oscillate upon CN stimulation (pink arrow-head) and that the amplitude of the oscillation (presented as Vhyp) depends on the strength of stimulation (top, weak; bottom, strong). Dark pink traces indicate average responses; light pink traces indicate individual responses. (E) Amplitude of the first cycle of the oscillation (first panel), latency to its peak from the onset of the stimulus (referred to as latency to rebound peak, second panel), and slope of this first cycle (referred to as rebound slope, third panel) following CN stimulation as a function of the amplitude of the hyperpolarizing component (Vhyp). Open pink circles represent individual trials obtained from five cells. Schemes showing how these parameters were calculated are shown in panel D (first cycle amplitude and latency to rebound peak) and panel C (rebound slope was calculated from peak of Vhyp to the peak of Vreb). (F) Superimposed traces of whole-cell patch-clamp recordings of an IO neuron that oscillates during baseline (i.e., an oscillating cell) (top panel). CN stimulation (pink arrow-head) enhances the amplitude of the oscillation and evokes a prominent resetting of the phase (see phase plot in bottom panel). (G) Phase shifts of subthreshold responses (y-axis) evoked by CN stimulation given at particular phases of the oscillations during baseline activity (x-axis). Open pink circles represent individual trials from five cells, together forming the phase plot curve. (H) Histogram showing the distribution of phase lags calculated across trials for three cycles before (pre-stimulus) and three cycles after (post-stimulus) CN stimulation. (I) Changes in amplitude of the four cycles of subthreshold oscillations (STOs) before and after CN stimulation. Shaded areas represent SD.
Figure 2—figure supplement 1
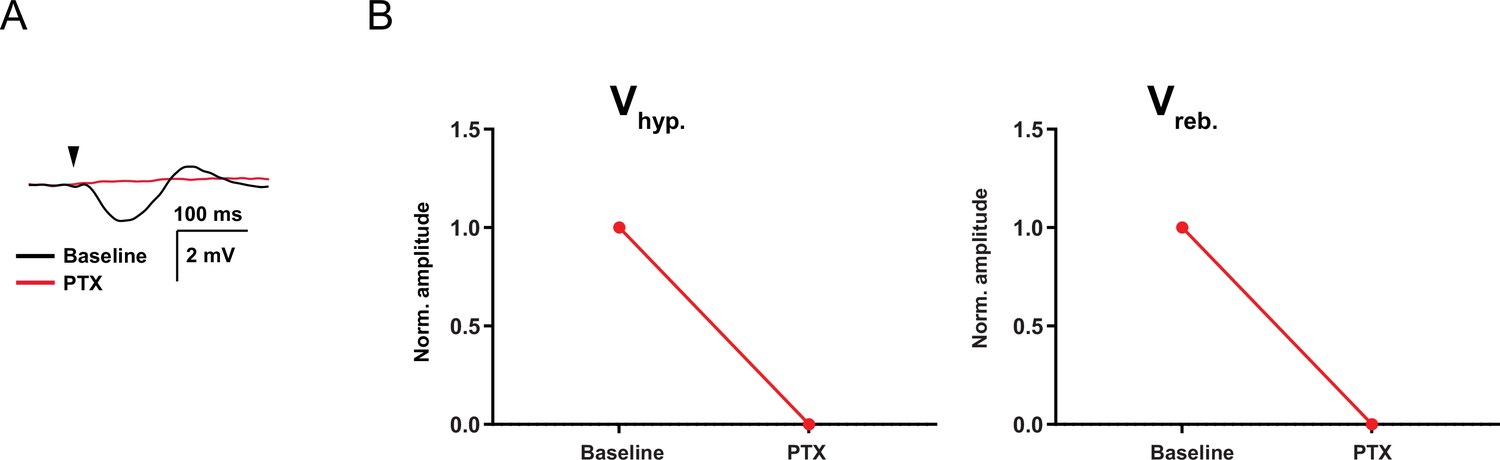
Picrotoxin blocks the cerebellar nuclei (CN) synaptic response.
(A) Example trace of synaptic response to CN inputs before and after the presence of picrotoxin (PTX, 100 µM). (B) Vhyp and Vreb normalized amplitude before (baseline) and after the presence of PTX. Red line indicates the mean.
Figure 2—figure supplement 2
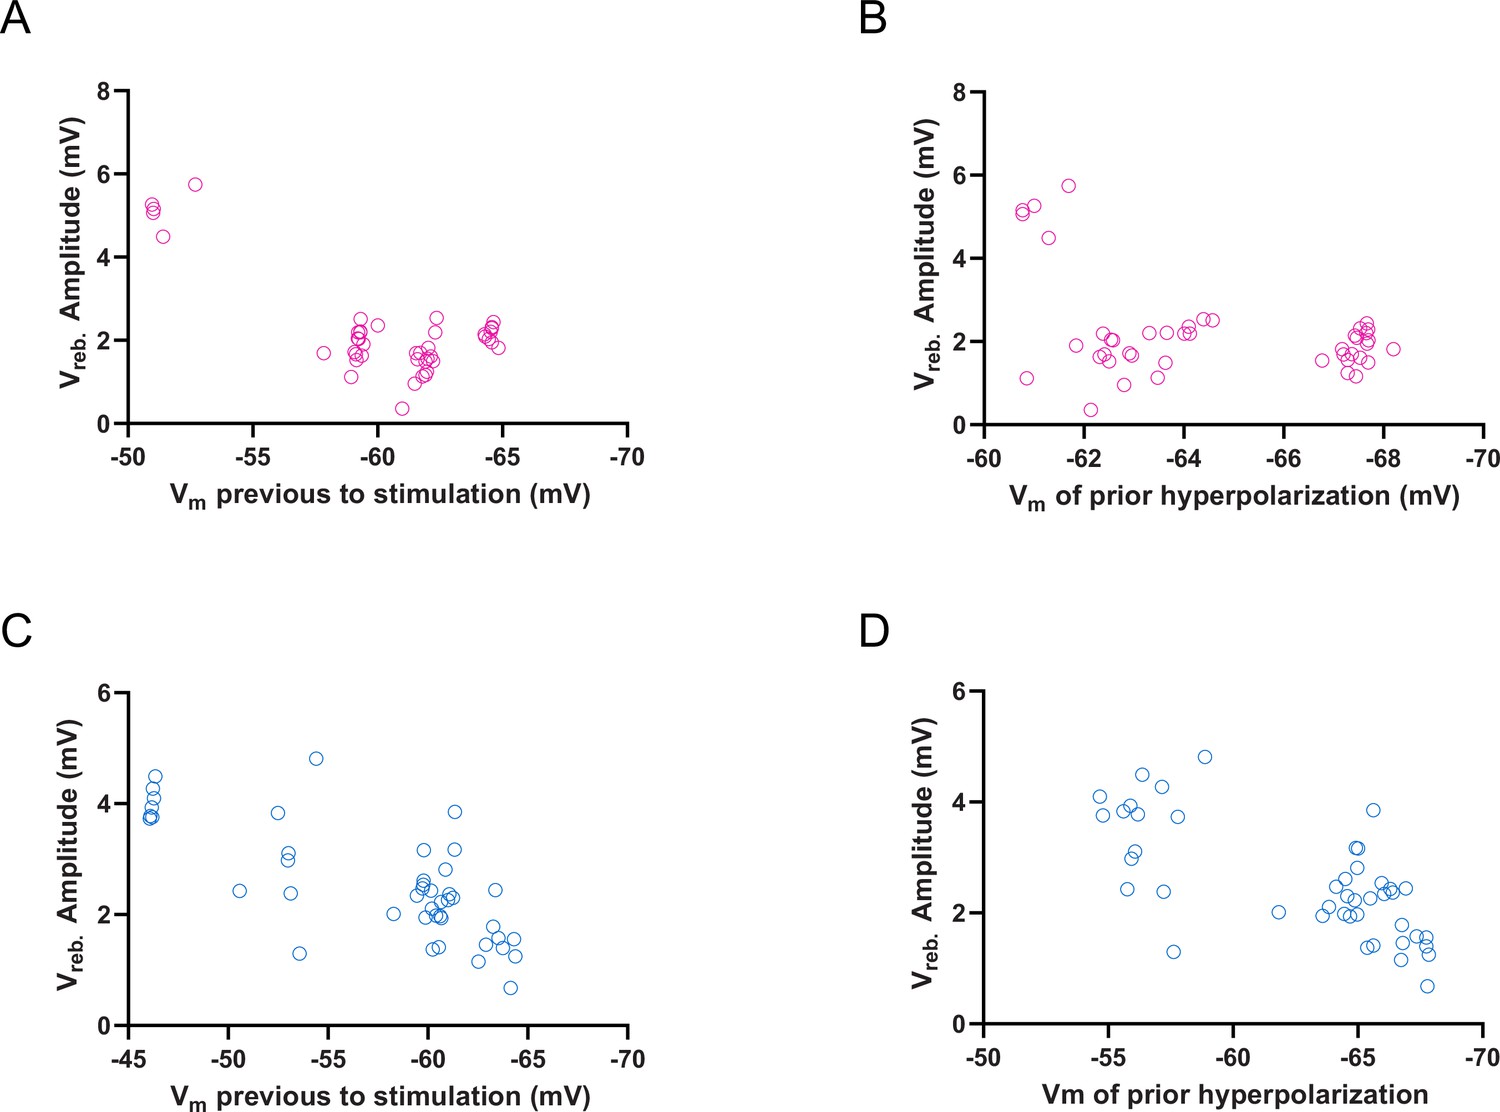
Voltage dependence of the rebound depolarization (Vreb) amplitude of cerebellar nuclei (CN) and mesodiencephalic junction (MDJ) synaptic responses.
(A) Vreb amplitude (mV) of CN synaptic response plotted as a function of membrane voltage (Vm) previous to stimulation. Open purple circles represent individual trials. (B) Vreb amplitude (mV) of CN synaptic response plotted as a function of Vm of prior hyperpolarization. Open purple circles represent individual trials. (C) Vreb amplitude (mV) of MDJ synaptic response plotted as a function of membrane voltage (Vm) previous to stimulation. Open blue circles represent individual trials. (D) Vreb amplitude (mV) of MDJ synaptic response plotted as a function of Vm of prior hyperpolarization. Open blue circles represent individual trials.
Figure 3 with 1 supplement
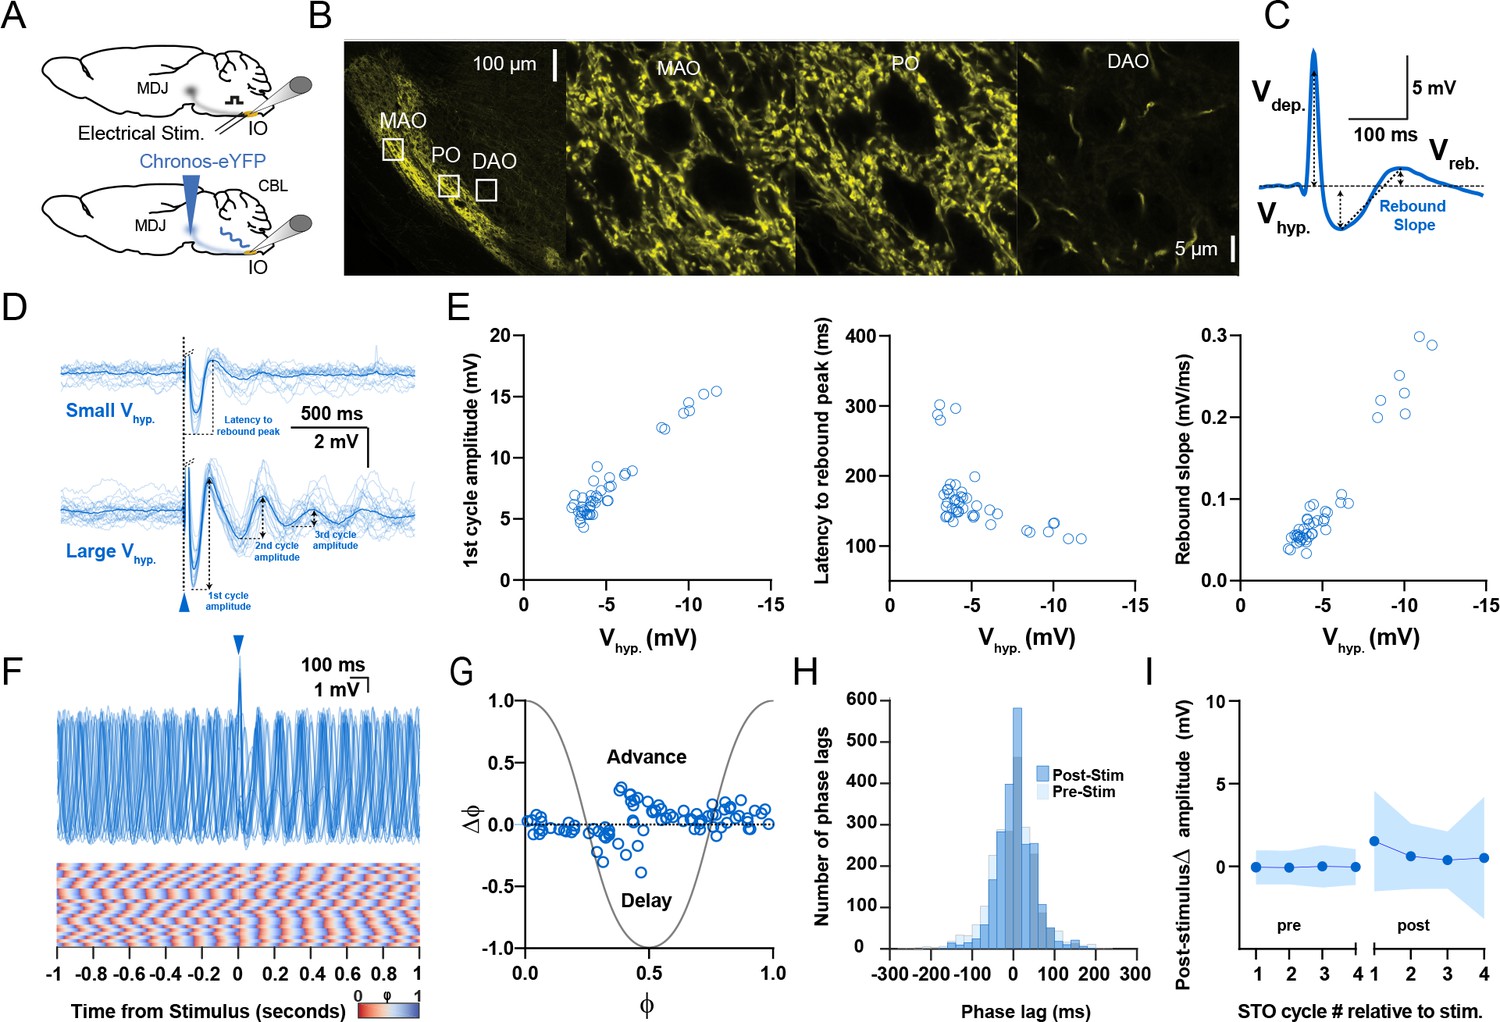
Responses of oscillating and non-oscillating neurons in the inferior olive to stimulation of excitatory afferents from the mesodiencephalic junction (MDJ).
(A) To stimulate neurons in the principal olive (PO) and medial accessory olive (MAO), we used either direct electrical stimulation of the central and medial tegmental tract, respectively (top panel), or optogenetic stimulation following injection of Chronos-eYFP into the MDJ (bottom panel). (B) Confocal images of a sagittal section of the brainstem comprising the different olivary subnuclei. Note that the fibers from the MDJ project prominently to the PO and MAO, but not to the dorsal accessory olive (DAO). Insets on the left correspond to higher magnifications on the right. (C) Stimulation of MDJ fibers typically elicits a multiphasic response in olivary neurons; the response starts with a depolarizing component (Vdep), followed by a hyperpolarizing component (Vhyp) and a rebound component (Vreb). Arrows denote how the amplitude was measured for each component. (D) Whole-cell patch-clamp recordings of a non-oscillating olivary neuron before, during, and after MDJ stimulation, in which synaptic responses with a small Vhyp amplitude elicited virtually no oscillations (top panel), whereas stronger stimulations triggering responses with a larger Vhyp did trigger subthreshold oscillations (STOs) (bottom panel). Dark blue traces indicate average responses; light blue traces indicate individual responses. Part of the depolarizing phase of the synaptic potential (Vdep) has been omitted for clarity in both panels. (E) Amplitude of the first cycle of the oscillation (first panel), latency to its peak from the onset of the stimulus (referred to as latency to rebound peak, second panel), and slope of this first cycle (referred to as rebound slope, third panel) following MDJ stimulation as a function of the amplitude of the hyperpolarizing component (Vhyp). Open blue circles represent individual trials obtained from eight number of cells. Schemes showing how these parameters were calculated are shown in panel D (first cycle amplitude and latency to rebound peak) and panel C (rebound slope was calculated from peak of Vhyp to the peak of Vreb). (F) Superimposed traces of whole-cell patch-clamp recordings of an individual oscillating cell (top panel). In contrast to CN stimulation (Figure 2), MDJ stimulation (blue arrow-head) does not prominently enhance the amplitude of the oscillation. Note that the phase resetting upon MDJ stimulation in the phase plot in the bottom panel is also less clear than that upon CN stimulation. (G) Phase shifts of subthreshold responses (y-axis) evoked by MDJ stimulation given at particular phases of the oscillations during baseline activity (x-axis). Open blue circles represent individual trials from eight cells, together forming the phase plot curve. (H) Histogram showing the distribution of phase lags calculated across trials for three cycles before (pre-stimulus) and three cycles after (post-stimulus) MDJ stimulation. (I) Changes in amplitude of the four cycles of STOs before and after MDJ stimulation. Shaded areas represent SD.
Figure 3—figure supplement 1
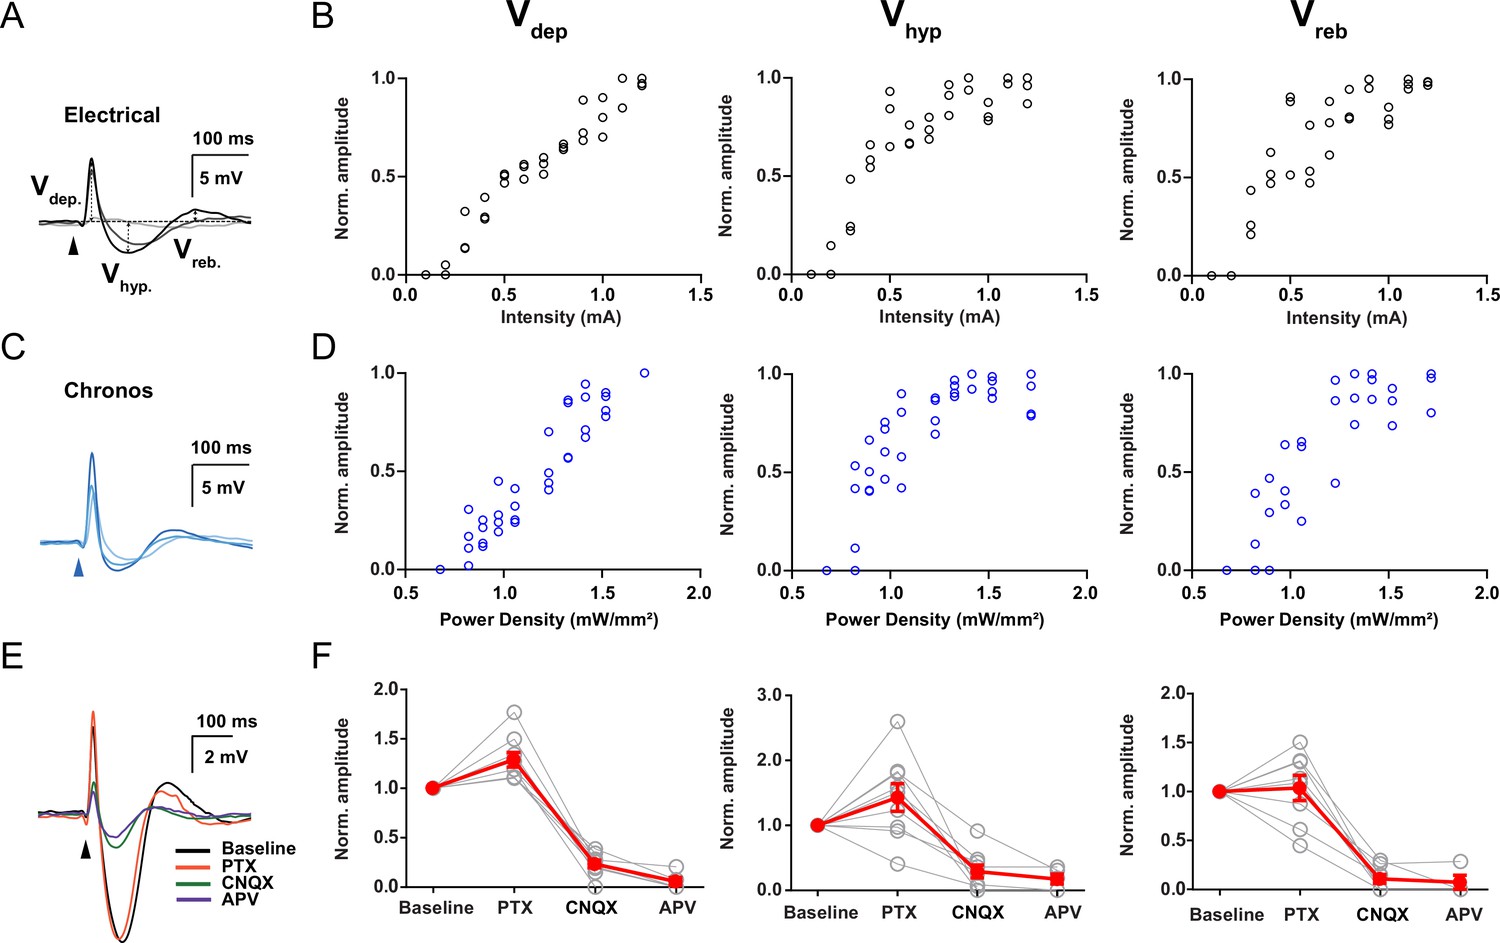
Mesodiencephalic junction (MDJ) evoked synaptic responses in the inferior olive (IO).
(A) Synaptic responses to increasing stimulus intensities using electrical stimulation. Arrows indicate how depolarizing (Vdep), hyperpolarizing (Vhyp), and rebound (Vreb) synaptic components amplitudes were calculated. (B) Vdep, Vhyp, and Vreb amplitudes (mV) plotted as a function of stimulus intensity during electrical stimulation (mA), respectively. Open black circles represent individual trials. (C) Synaptic responses to increasing stimulus intensities using optical stimulation at a wavelength of 470 nm in WT mice transduced with Chronos in the MDJ. (D) Vdep, Vhyp, and Vreb amplitudes (mV) plotted as a function of stimulus intensity during optical stimulation at a wavelength of 470 nm in WT mice transduced with Chronos in the MDJ, respectively. Open blue circles represent individual trials. (E) Example trace of synaptic response to MDJ inputs before and after the presence of picrotoxin (PTX, 100 µM), CNQX (20 µM), and APV (50 µM), which were added sequentially in the same order as presented. (F) Vdep, Vhyp, and Vreb normalized amplitude before (baseline) and after the presence of CNQX, PTX, and APV, respectively. Red lines indicate the mean and light gray lines indicate individual experiments.
Figure 4
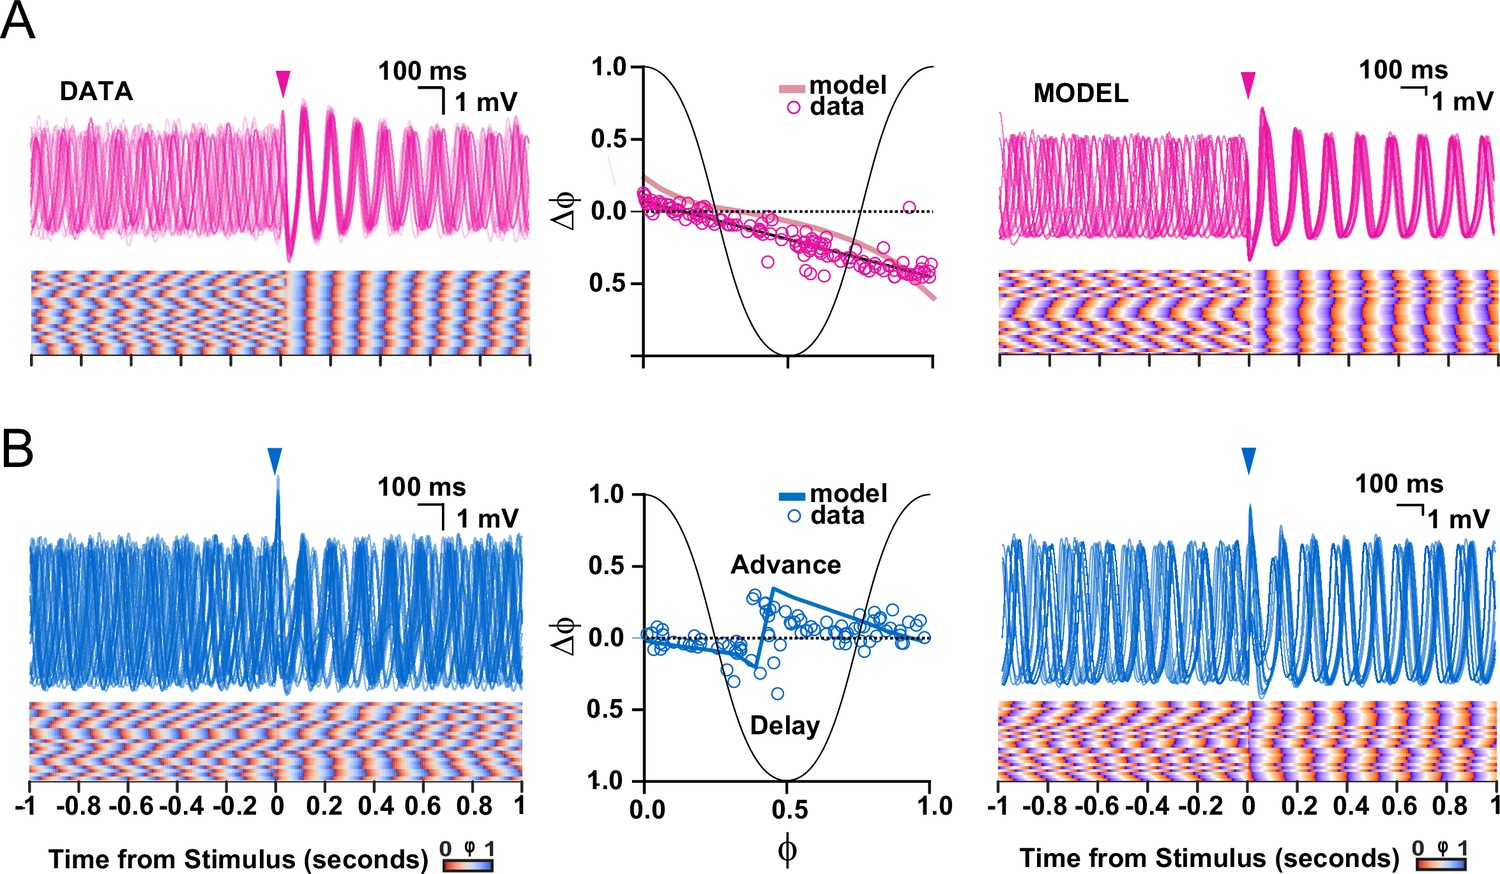
Comparison of subthreshold responses of oscillating olivary neurons obtained with experiments (data) and those found following simulations (model).
(A) Subthreshold oscillatory responses to stimulation of the cerebellar nuclei (onset indicated by pink arrow-heads). Panels on the left and right show subthreshold activity according to the data and model, respectively; middle panel shows phase plot curves for both data and model. (B) As in A, but following stimulation of the mesodiencephalic junction (onset indicated by blue arrow-heads). Note that the model can reproduce both experimental data sets, including the relatively strong and stable phase resetting effect following stimulation from the cerebellar nuclei as compared to that from the mesodiencephalic junction. The experimental data sets in panels A and B correspond to those presented in Figures 2 and 3, respectively.
Figure 5 with 1 supplement
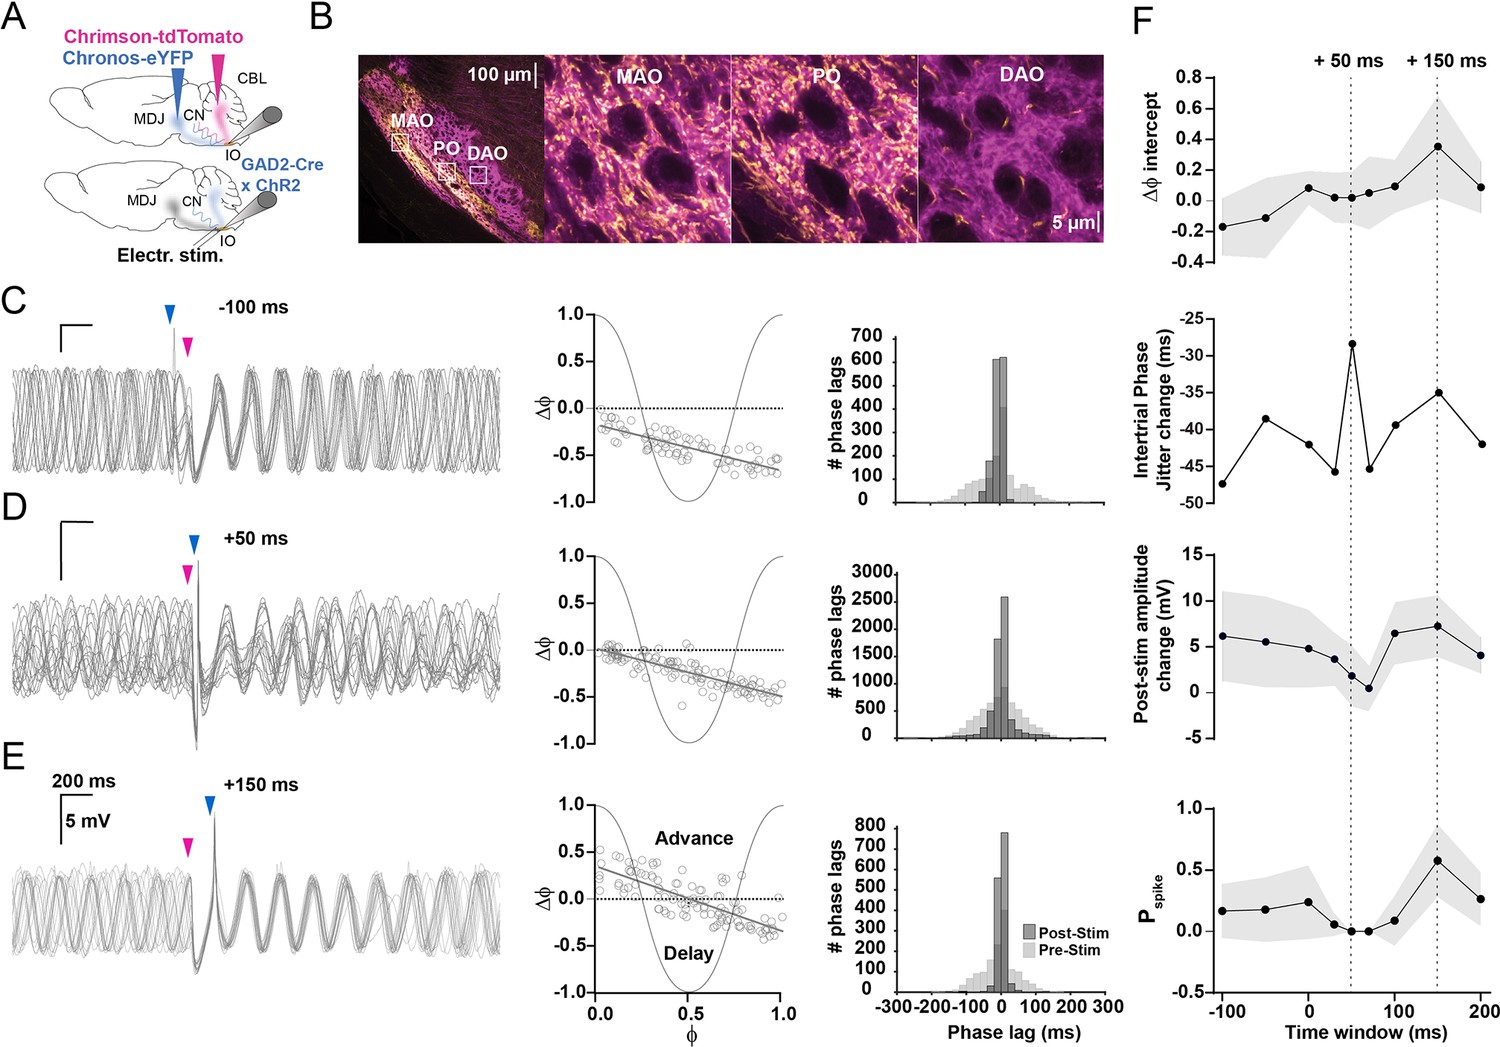
Timing of input from mesodiencephalic junction (MDJ) with respect to that from the cerebellar nuclei (CN) is critical for olivary output.
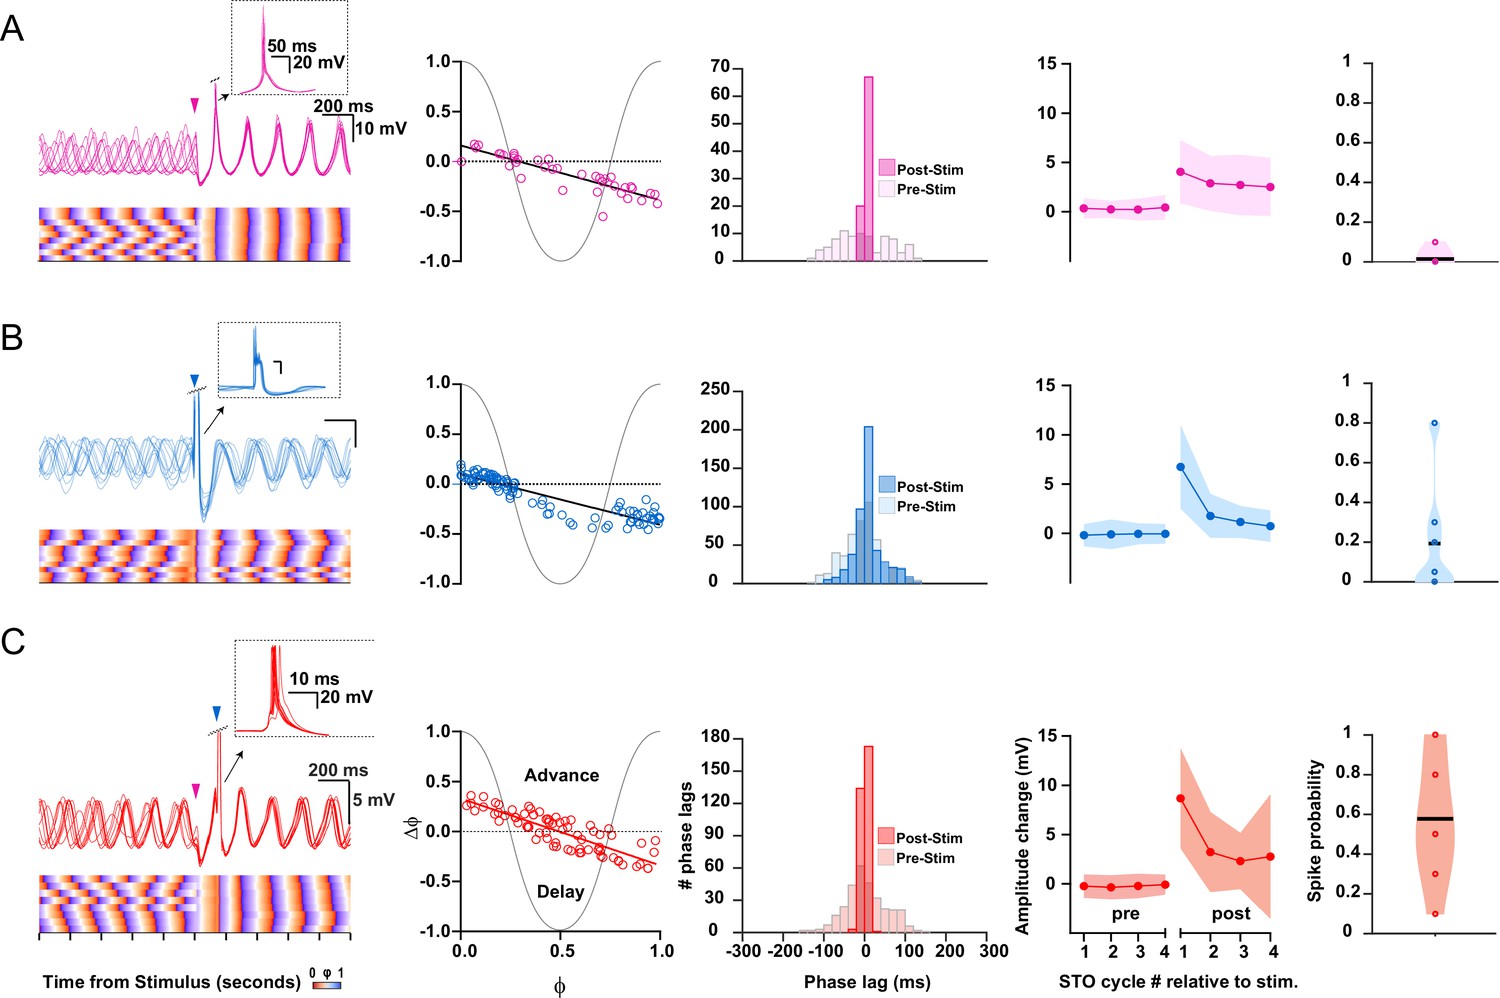
(A) To stimulate the excitatory input from the MDJ to neurons in the principal olive (PO) and medial accessory olive (MAO), we used either optogenetic stimulation using Chronos-eYFP (top) or direct electrical stimulation (bottom panel), while we used ChrimsonR-tdTomato in wild type mice (top) and ChR2-H134R-EYFP (bottom) in Gad2Cre transgenic mice to stimulate their inhibitory input from the CN. (B) Confocal images of a sagittal section of the brainstem comprising the different olivary subnuclei. Note that the PO and MAO, but not the dorsal accessory olive (DAO), receive a prominent input from both the MDJ and CN. Insets on the left correspond to higher magnifications on the right. (C) Whole-cell patch-clamp recordings of an olivary neuron that shows subthreshold oscillations, the phase of which is influenced by the timing of the MDJ input (blue arrow-heads) with respect to that of the input from the CN (pink arrow-heads). Note that the amplitude of the oscillations is minimal and maximal when the MDJ stimulation is preceded by CN stimulation at 50 ms (middle panel) and 150 ms (top panel), respectively. (D) Phase plot curves of olivary activity following MDJ and CN stimulation at the three different time intervals of –100 ms (top), +50 ms (middle), and +150 ms (bottom). (E) Histograms showing the distribution of phase lags calculated across trials for three cycles before (pre-stimulus; light gray) and three cycles after (post-stimulus; dark gray) the sequence of MDJ and CN stimulations that were separated by the same three intervals (–100 ms in top panel, +50 ms in middle panel, and +150 ms at bottom panel). (F) From top to bottom, ΔФ-intercept of phase response curves, intertrial phase jitter change (SDpost-stim – SDpre-stim), post-stimulus amplitude change of the first cycle following the last stimulation, and spike probability, all measured at time intervals of –100 ms, –50 ms, 0 ms, +30 ms, +50 ms, +70 ms, +100 ms, +150 ms, and +200 ms. Dashed lines highlight +50 ms and +150 ms time intervals. Note that the jitter is highest when the inhibition is greatest, that is, at the MDJ-CN interval of +50 ms, and that the spike probability is highest when the ΔФ-intercept and post-stimulus amplitude change are greatest, that is, at the MDJ-CN interval of +150 ms. Shaded areas represent SD.
Figure 5—figure supplement 1
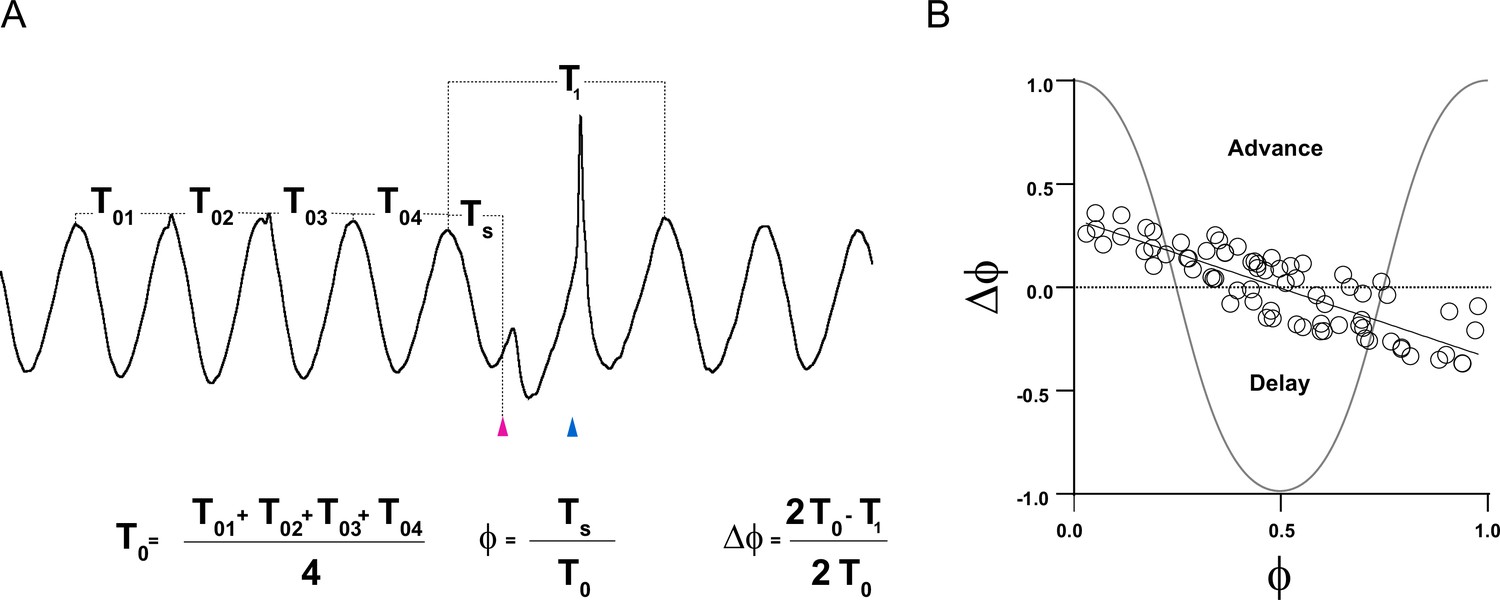
Phase response curve (PRC) calculation.
(A) Period previous to stimulation (T0) was calculated as the average of four periods preceding the stimuli. Period containing the synaptic responses caused by either single or dual stimuli (T1) was calculated as the period from the peak cycle before stimulation to the peak cycle following the rebound peak caused by either single or dual stimulus. Time at which stimulation hit the subthreshold oscillation (STO) (Ts) was calculated as the period from the peak cycle before stimulation to the onset of the first stimulus. (B) PRC in which changes in the period containing the synaptic responses with respect to the period previous to stimulation (ΔФ) is plotted as function of the phase at which stimulus hit the STO (Ф). Based in our convention shown in the formulas of panel A, positive ΔФ values indicate a phase advance (period containing the synaptic response is shorter than previous ones), whereas negative ΔФ values indicate a phase delay (period containing the synaptic response is longer than previous ones).
Figure 6
Impact of cerebellar nuclei (CN), mesodiencephalic junction (MDJ), and combined CN-MDJ stimulation on suprathreshold responses of inferior olive (IO) oscillating neurons.
(A) Suprathreshold responses in IO neurons evoked by CN stimulation. In the left panel CN stimulus onset is indicated by a pink arrow-head, while action potentials are clipped in order to visualize the induced phase resetting. Bottom part of left panel indicates rising (orange) and decaying (purple) phase of subthreshold oscillations (STOs) to visualize the consistency across trials. Phase response curves (PRCs) of supratheshold responses of individual IO cells (open circles) to CN stimulation are shown in the second column on the left. Histogram in the middle panel shows the distribution of phase lags of the STOs after the spikes calculated across trials for three cycles before (pre-stimulus) and after (post-stimulus) CN stimulation. Fourth panel shows the changes in STO amplitude following CN stimulation (for each cycle the average of the pre-stimulus cycles was subtracted). Shaded area represents SD. Fifth panel, that is, panel on the right, shows the probability that an olivary spike occurs in the first cycle directly after a preceding spike. (B) As in A, but now for suprathreshold responses in IO neurons evoked by MDJ stimulation. MDJ stimulus onset in the left panel is indicated by a blue arrow-head. (C) As in A and B, but now for suprathreshold responses in IO neurons evoked by sequential CN-MDJ stimulation with a 150 ms interval. CN and MDJ stimulus onsets in the left panel are indicated by pink and blue arrow-heads, respectively. Note that the change in the amplitude of the STO as well as the spike probability is higher following this 150 ms interval than when the CN and MDJ stimulation is given in isolation.
Figure 7
Modeling indicates that resetting of subthreshold activity and spike generation are more effective at the preferred interval.
A single model example cell (with a Ca v.3.1 conductance of 1.1 mS/cm2) is stimulated at different phases of the oscillation. Stimulations were delivered at 16 different moments within one cycle. (A) The cell is stimulated in different sub-intervals of a single oscillation. Responses are given with respect to subthreshold inhibition (A), excitation (B), or combined stimuli (t(exc)-t(inh)=100 ms) (C). Traces are aligned by stimulus (and last stimulus in the case of combined stimulation). Top panel indicates membrane potential traces for all stimulation intervals; middle panel indicates membrane potential heatmap and individual traces of membrane potential sorted by increasing phase; and the bottom panel indicates the phase averages (thick line) and confidence interval (gray). The phase reset is most effective when inhibition (GABA receptor activation) and excitation (AMPA receptor activation) happen at the preferred interval of about one cycle. GABA or AMPA activation alone show a weaker resetting and produce a larger spread of phases than combined inhibition and excitation. Note that at the parameter settings used for this graph, the preferred interval between cerebellar nuclei (CN) and mesodiencephalic junction (MDJ) stimulation tends to evoke sodium spikes and rebounds (indicated by dots) for many phase values of the subthreshold oscillation (STO), whereas isolated stimulation of CN or MDJ does not.
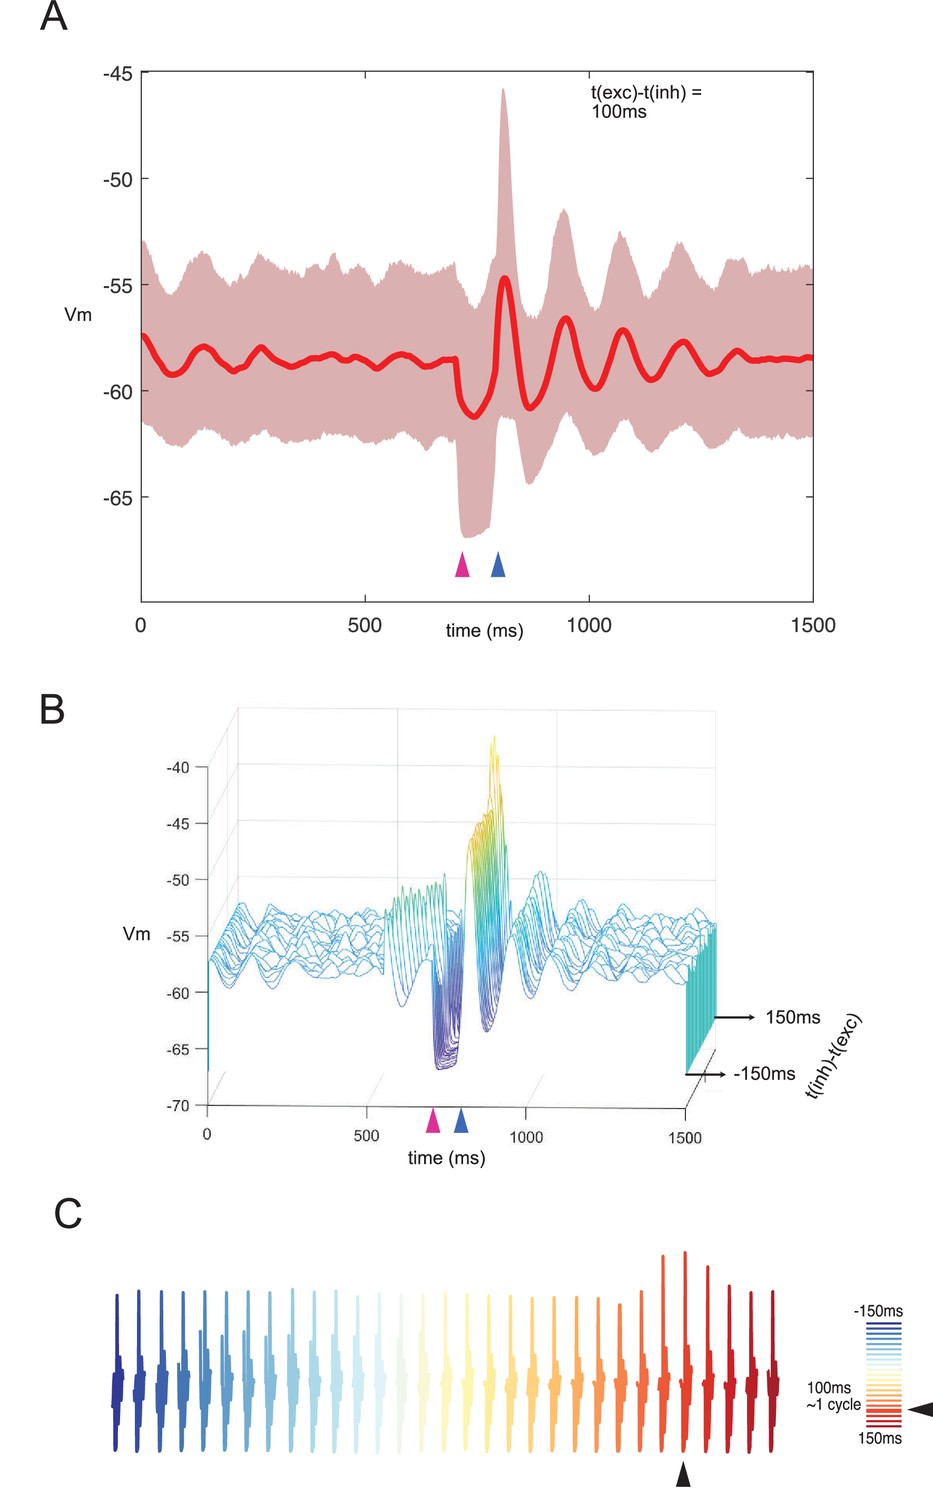
Figure 8 with 6 supplements
Network model of inferior olive can recapitulate timing-sensitive interaction between inhibitory and excitatory inputs.
Combined stimulation at a preferred interval of about one cycle leads to highest rebound and maintenance of network synchronization. (A) Data from model of the olivary neuropil based on a reconstruction of the mouse’s medial accessory olive (MAO). The model comprises 1105 inferior olivary model cells (gray and colored circles), located according to annotated cell positions of MAO cells from confocal slice data. Pink colored cells indicate the cells (~80) that are solely inhibited by the cerebellar nuclei (CN) during the period of focal stimulation of the afferents; blue colored cells indicate the cells that are only activated by a similar focal excitatory input from the mesodiencephalic junction (MDJ) during the same period; and the red colored cells indicate cells that are activated by both the inhibitory input from the CN and excitatory input from the MDJ in this period. (B) Snapshots of network activity. The colors of the cells highlight the membrane potentials of the cells and they correspond to the color coding presented in panel C. The network activity starts in a stage of synchrony, and this synchrony is retained upon combined stimulation in the preferred interval (see also Figure 8—video 1). CN and MDJ stimulations are focal. (C) Membrane potential for all cells in the network over time. Depolarized (yellow) or hyperpolarized (blue) membrane potentials of clustered olivary cells responding to sequential CN and MDJ stimulation (pink and blue arrow-heads, respectively). Cells receiving combined stimulation are shown at the bottom (red dashes). (D) Average of membrane potentials of the stimulated group and the network. (E) Note high amplitude of rebound in D and maintenance of network synchrony in E. (F) Phase of stimulated group and network. For the preferred interval phase is maintained, though the stimulation leads to an increase of amplitude in the network response. (G) Phase distributions of stimulated cells (red) and rest of the network (gray). Individual cell phases are displayed as small circles. Averages are displayed as vectors from the center. The phase values of the individual cells are displayed as vectors linked to the cells with corresponding colors. For phase distributions over time, see Figure 8—video 2.
Figure 8—figure supplement 1

Cell conductances parameter spaces for coupled and uncoupled networks show effect of gap junction coupling in murine scale model network.
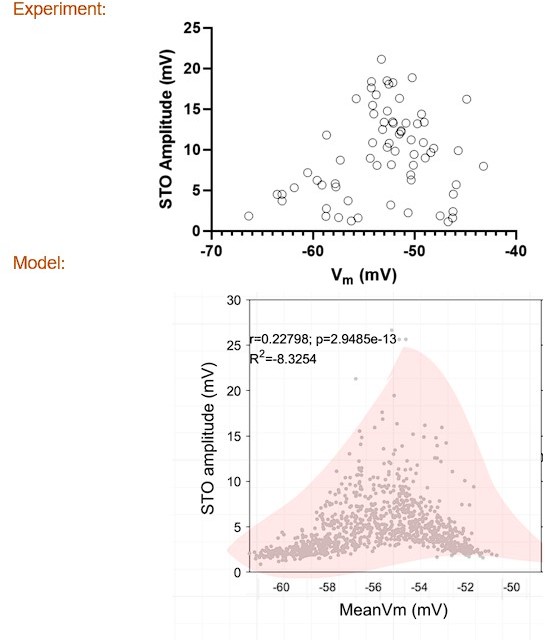
Networks generated for this project have high levels of randomization to capture expected experimental variability. All 1105 cells in the model receive randomized conductance parameters. Displayed are distributions and correlations between conductance parameters and cell properties. In the main diagonal are the histograms for each metric. Colored dots indicate Calcium low-threshold type expression for each of the modeled cells. (A) Uncoupled network (gap conductance = 0). In g_CaL x amplitude of oscillation note the bifurcation of oscillatory behavior as g_CaL is increased (notice orange outline). Cells with similar values of Calcium L conductance do not always oscillate due to a function of other randomized conductances. This effect is only visible in a decoupled network and vanishes when cells are connected with gap junctions as in (B). (B) Network connected via gap junctions indicates that previously non-oscillating cells are engaged in oscillation in a continuous oscillatory gradient. Furthermore, relationship between mean membrane potential and subthreshold oscillation (STO) amplitude accurately captures the distributions we observed in the experiments. This indicates that cells with low oscillatory amplitudes tend to be non-intrinsic oscillators, and act as slaves of the higher amplitude oscillators.
Figure 8—figure supplement 2

Stimulation at non-preferred intervals leads to enduring phase differences.
(A) Example phase average of stimulated group and non-stimulated network. The mesodiencephalic junction (MDJ) signal causes momentary desynchronization of the stimulated group. After the cerebellar nuclei (CN) signal, the group acquires a consistent phase delay with respect to the network across many cycles. (B) Distributions of oscillator phases for stimulations for five stimulation intervals, where phases are sampled before (pre), shortly after (early), or late (late) after the stimulus. Stimulations close to the preferred stimulation interval (100 ms) retain group synchrony, whereas other intervals induce phase differences that can subsist for intervals longer than 500 ms after stimulation.
Figure 8—figure supplement 3
Responses of network to combined stimulation under noise.
Due to its incoming connections form a wide array of excitatory sources, the inferior olive is subjected to highly variable inputs (Negrello et al., 2019). When olivary neurons are given noisy inputs of small amplitudes (Ornstein-Uhlenbeck process with 0 mean, 0.2 pA/cm2, and theta = 50 ms), synchronization decays over time and requires stimuli to realign. When we apply a combination of excitatory and inhibitory inputs with the preferred one cycle difference (approximately 100 ms in this case), the network amplitude increases accordingly. However, network synchronization only lasts a few cycles and is washed away by uncorrelated inputs. This is in contrast with the network that receives no other inputs, where synchronization can last for much longer intervals. (A) Average membrane potential of the entire network and standard deviation of network response for a stimulation interval of 100 ms. (B) Waterfall plot collecting average network responses for stimulus intervals between –150 ms and 150 ms with 10 ms intervals. (C) Response amplitude is higher in the preferred interval irrespectively of levels of uncorrelated noise.
Figure 8—video 1
Combined stimulation can lead to standing wave propagations.
Displayed is phase of the oscillation for all cells in network (blue is 0 pi and red is 2 pi). The combined impact of inhibition and excitation and the ongoing subthreshold oscillations creates phase differences that can lead to directionality in phase propagation in the inferior olive network model. Here, we see the result when stimulation is given at t_inh = 500 ms and t_exc = 610 ms. This phenomenon can only be observed in the absence of uncorrelated noisy input. This is in line with the results by Latorre et al., 2013, who used a significantly simplified set of conductances, connectivity, and network structure.
Figure 8—video 2
Different stimulation intervals lead to systematic phase differences.
Top row: phase distributions displaying whole network (in gray) and stimulated population (violet). Bottom row, phase distributions over time for stimulated group (top) and rest of the network (bottom). For different intervals of stimulation, long-lasting systematic phase differences can be evoked.
Figure 8—video 3
Oscillator phase in the reconstructed olive during the presence of Ornstein-Ulhenbeck noise.
Even though conjoined stimulation (AMPA input follows GABA input after 110 ms) drives phase reset, this effect washes off in about two cycles. Noise parameters: theta = 1/50 ms, mean = 0 pA/cm2, std = 0.1 pA/cm2.
Figure 9 with 1 supplement
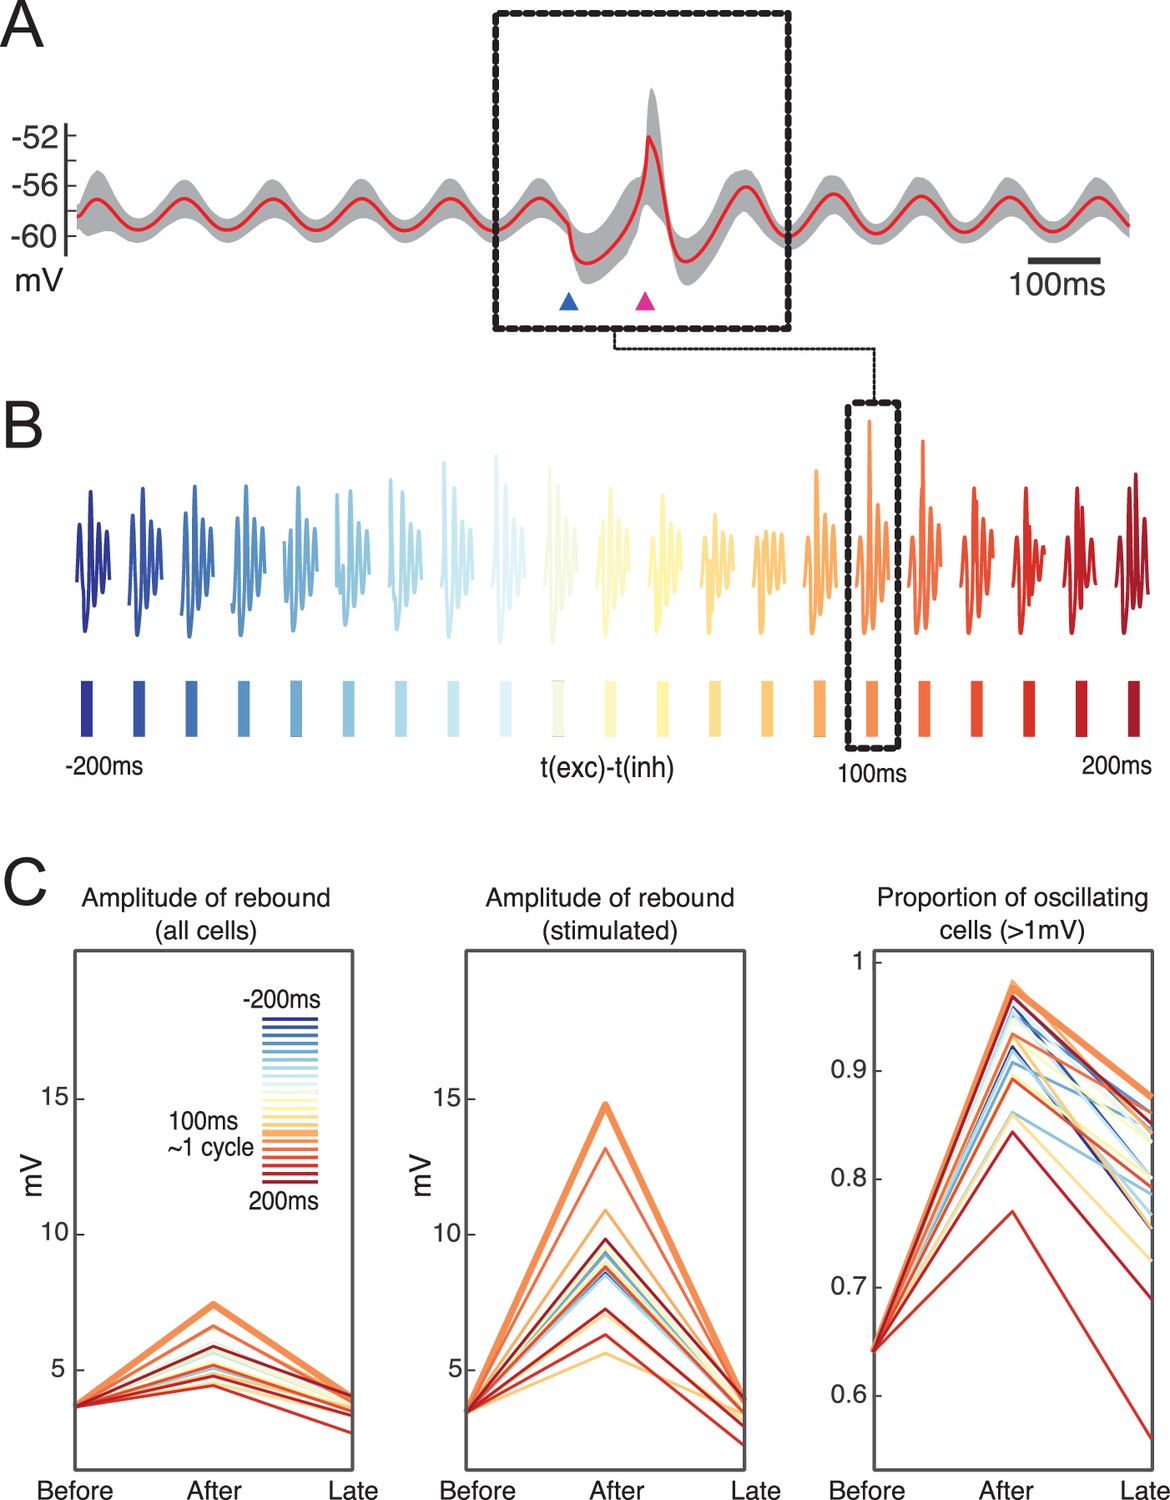
Network responses to combined stimulation for different intervals show an increase in rebound amplitude as well as an increase in the proportion of oscillating cells following stimulation in the preferred interval.
(A) Average of membrane potential for entire network for the preferred network stimulus (100 ms). (B) Collected response snippets for a variety of stimulation intervals. Dashed inset indicates the interval with the largest amplitude of oscillatory response. (C) Comparison across network amplitude responses and proportion of oscillating cells following stimulations at different intervals (t-200 and t-100 vs. t and t+100 as well as t+400, t+500). Preferred interval is marked by thicker orange line, same as in the dashed box.
Figure 9—figure supplement 1
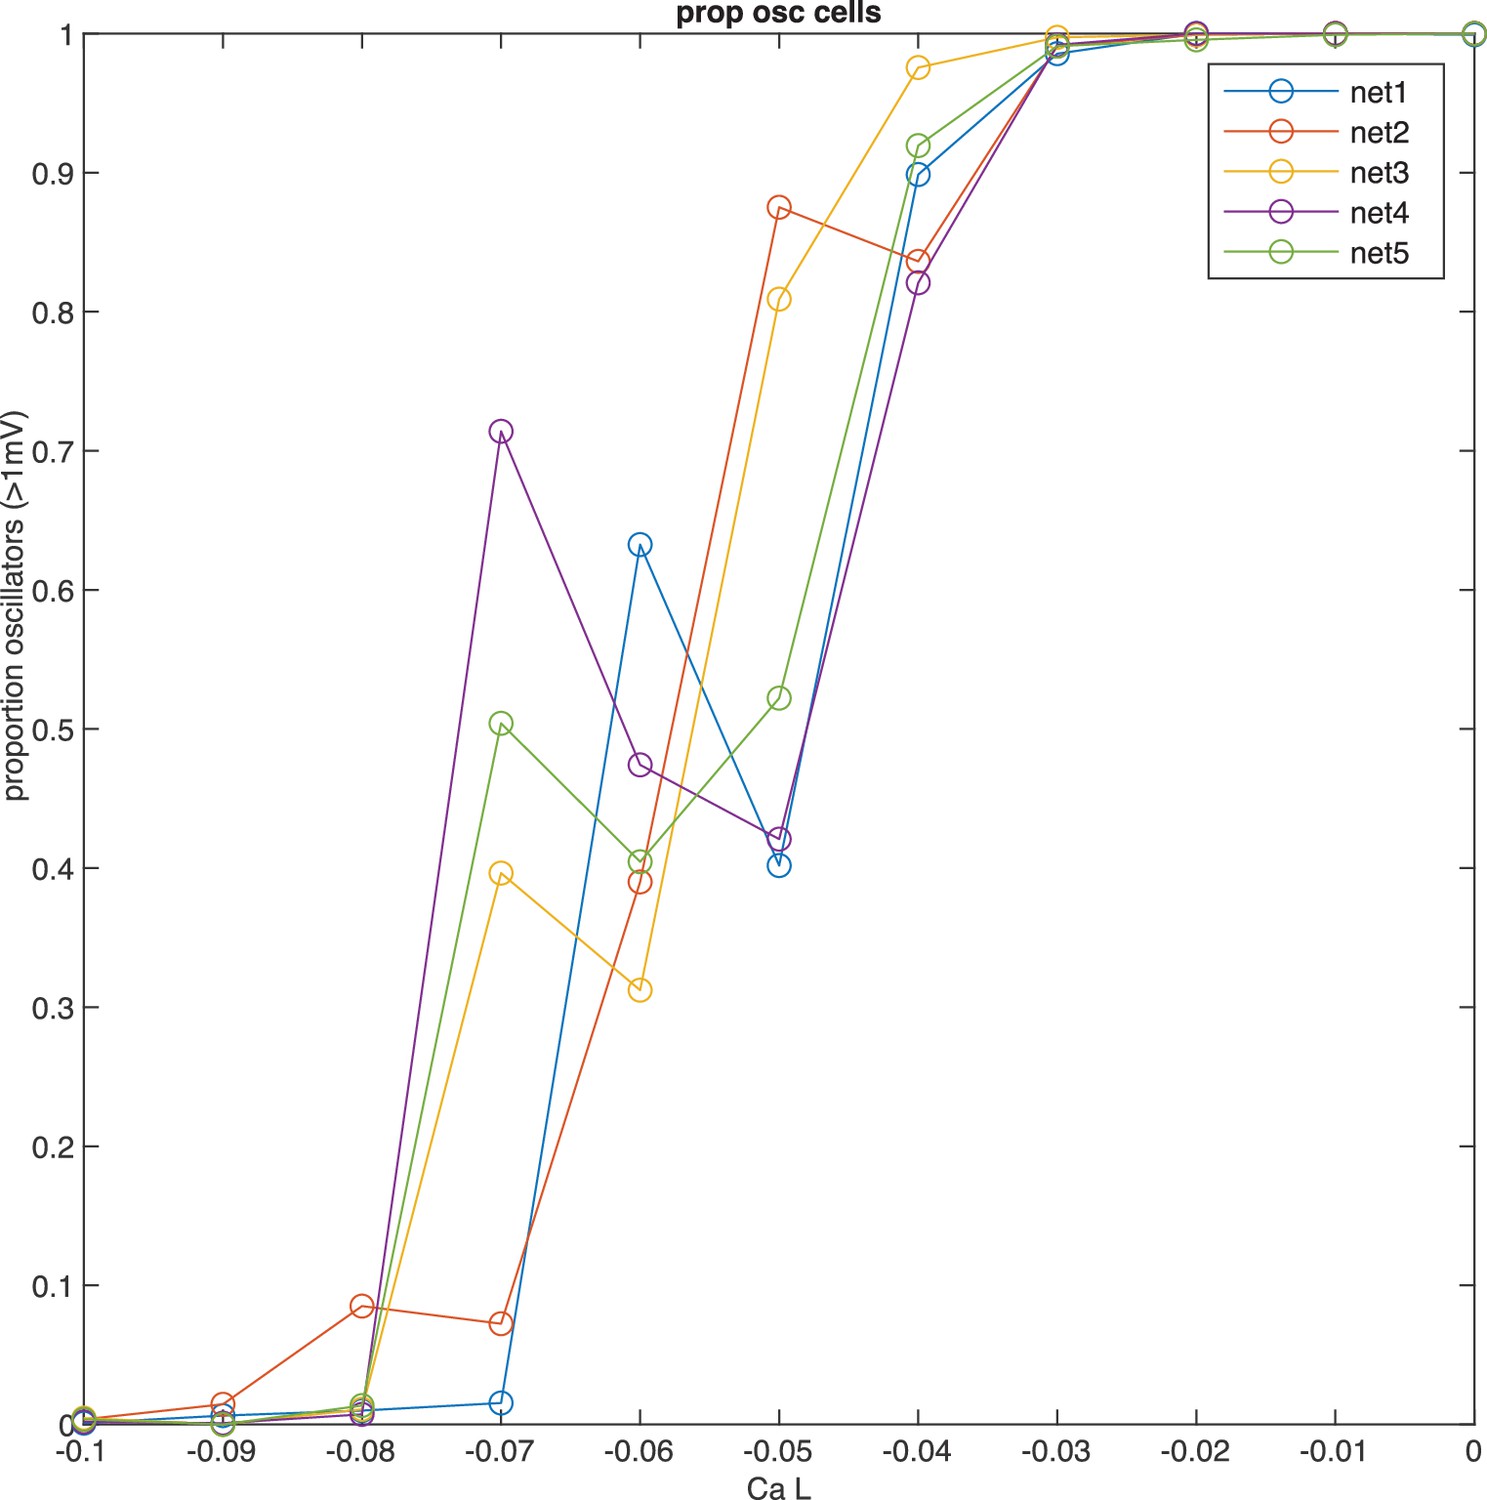
Network tuning for calcium conductance to capture proportion of oscillating cells.
The main determinant of oscillation amplitude is calcium low-threshold type (v 3.1). To obtain a network with the correct proportion of oscillating cells, we have produced five networks with randomized conductance parameters and connectivity, while maintaining statistical properties. We systematically varied calcium low-threshold conductance, and recorded the proportion of oscillating cells (>1 mV). The proportion of oscillatory cells grows as calcium low-threshold conductance is increased, while other conductances are kept constant. Note how the proportion of oscillatory cells is jagged in individual networks, indicating critical dependence on particular initializations. This variability at small conductance values may explain why the estimates of oscillating cells in experimental preparations can range substantially.
Author response image 1
Author response image 2
Tables
Key resources table
| Reagent type (species) or resource | Designation | Source or reference | Identifiers | Additional information |
|---|---|---|---|---|
| Strain, strain background (Mus musculus) | C57BL/6J mice | Charles Rivers | IMSR_JAX:000664 | |
| Strain, strain background (Mus musculus) | Gad2-IRES-Cre × Ai32 RCL-ChR2(H134R)/EYFP | https://doi.org/10.1073/pnas.1017210108; https://doi.org/10.1038/nature13276 | ||
| Transfected construct (AAV1-Synapsin-Chronos-GFP) | Chronos | https://doi.org/10.1038/nmeth.2836 | ||
| Transfected construct (AAV1-Synapsin-ChrimsonR-tdTomato) | Chrimson | https://doi.org/10.1038/nmeth.2836 | ||
| Chemical compound, drug | Alexa Fluor 594- Conjugated Streptavidin | Life Technologies | Stock concentration 2 mg/ml (1:200 dilution) | |
| Chemical compound, drug | Alexa Fluor 633- Conjugated Streptavidin | Life Technologies | Stock concentration 2 mg/ml (1:200 dilution) | |
| Chemical compound, drug | APV | Hello Bio | #HB0225-50mM | A final concentration of 50 µM was used |
| Chemical compound, drug | CNQX | Hello Bio | #HB0205-50mg | A final concentration of 20 µM was used |
| Chemical compound, drug | Picrotoxin (PTX) | Sigma-Aldrich | #P1675-5G | A final concentration of 100 µM was used |
| Chemical compound, drug | Biocytin | Sigma-Aldrich | #B4261-50MG | A final concentration of 0.5% (wt/vol) was used |
| Software, algorithm | Clampfit 11.0.3 | Molecular Devices | ||
| Software, algorithm | Prism 9 | GraphPad | ||
| Software, algorithm | MATLAB | MathWorks |
Additional files
-
Supplementary file 1
Reponse properties of neurons in the inferrior olive.
(A) Kinetic properties of cerebellar nuclei (CN) and mesodiencephalic junction (MDJ) synaptic responses using different stimulation approaches. Latency and half-width of hyperpolarization (Vhyp) and rebound (Vreb) synaptic components of CN synaptic responses evoked in mice transduced with ChrimsonR-tdTomato in the CN and GAD2Cre/Chr2-H134R-EYFP transgenic mice line, and latency and half-width of depolarization (Vdep), hyperpolarization (Vhyp), and rebound (Vreb) synaptic components of MDJ synaptic response evoked in mice transduced with Chronos in the MDJ and electrical stimulation. (B) Phase response curve (PRC) parameters of different stimulation paradigms. Slope, Y-intercept, and R2 of PRCs generated by dual (CN and MDJ afferents stimulation) stimulation at different time intervals (all of them evoking subthreshold synaptic responses except for ‘+150 ms spike’ which evokes suprathreshold synaptic responses), CN afferent stimulation evoking subthreshold and suprathreshold synaptic responses (‘IPSP’ and ‘CN spike’, respectively), and MDJ afferent stimulation evoking suprathreshold synaptic responses (‘MDJ spike’). (C) Statistics of PRC slopes of different stimulation paradigms. Comparison of PRC slopes between +150 ms and the other time intervals (all of them evoking subthreshold synaptic responses except for ‘+150 ms spike’ which evokes suprathreshold synaptic responses), CN afferent stimulation evoking subthreshold and suprathreshold synaptic responses (‘IPSP’ and ‘CN spike’, respectively) and MDJ afferent stimulation evoking suprathreshold synaptic responses (‘MDJ spike’), using one-way ANOVA test followed by post hoc uncorrected Fisher’s LSD multiple comparison test. (D) Statistics of PRC Y-intercept. Comparison of PRC Y-intercepts between +150 ms and the other time intervals (all of them evoking subthreshold synaptic responses except for ‘+150 ms spike’ which evokes suprathreshold synaptic responses), CN afferent stimulation evoking subthreshold and suprathreshold synaptic responses (‘IPSP’ and ‘CN spike’, respectively) and MDJ afferent stimulation evoking suprathreshold synaptic responses (‘MDJ spike’) using one-way ANOVA test followed by post hoc uncorrected Fisher’s LSD multiple comparison test. (E) Intertrial phase jitter at different stimulation paradigms. Intertrial phase jitter pre- and post-stimulus (standard deviation of phase lags pre- and post-stimulus, respectively) and intertrial phase jitter change (standard deviation of phase lags post stimulus – standard deviation of phase lags pre-stimulus) at different time intervals of stimulation (all of them evoking subthreshold synaptic responses except for ‘+150 ms spike’ which evokes suprathreshold synaptic responses), CN afferent stimulation evoking subthreshold and suprathreshold synaptic responses (‘IPSP’ and ‘CN spike’, respectively) and MDJ afferent stimulation evoking subthreshold and suprathreshold synaptic responses (‘EPSP’ and ‘MDJ spike’, respectively). (F). Statistics of amplitude of first cycle following stimulation at different time intervals. Comparison between subthreshold oscillation (STO) amplitude change of the first cycle (rebound component) following stimulation at different time intervals (all of them evoking subthreshold synaptic responses) and STO amplitude previous to stimulation using Friedman test followed by post hoc uncorrected Dunn’s multiple comparison test. (G) STO amplitude change of first cycle following stimulation at different stimulation paradigms. STO amplitude change of the first cycle (rebound component) following dual stimulation at different time intervals (all of them evoking subthreshold synaptic responses except for ‘+150 ms spike’ which evokes suprathreshold synaptic responses), CN afferent stimulation evoking subthreshold and suprathreshold synaptic responses (‘IPSP’ and ‘CN spike’, respectively), and MDJ afferent stimulation evoking subthreshold and suprathreshold synaptic responses (‘EPSP’ and ‘MDJ spike’, respectively). (H) Statistics of the comparison between first cycle post-stimulus change evoked by +150 ms and other stimulation paradigms. Comparison of first cycle post-stimulus change between the time interval of +150 ms and the other time intervals (all of them evoking subthreshold synaptic responses except for ‘+150 ms spike’ which evokes suprathreshold synaptic responses), CN afferent stimulation evoking subthreshold and suprathreshold synaptic responses (‘IPSP’ and ‘CN spike’, respectively), and MDJ afferent stimulation evoking subthreshold and suprathreshold synaptic responses (‘EPSP’ and ‘MDJ spike’, respectively), using Kruskal-Wallis test followed by post hoc uncorrected Dunn’s multiple comparison test. (I) Spike probability at different stimulation paradigms. Spike probability (Pspike) following dual stimulation at different time intervals and isolated CN and MDJ afferents stimulation (‘IPSP’ and ‘MDJ’, respectively).
- https://cdn.elifesciences.org/articles/83239/elife-83239-supp1-v1.docx
-
MDAR checklist
- https://cdn.elifesciences.org/articles/83239/elife-83239-mdarchecklist1-v1.pdf
Download links
A two-part list of links to download the article, or parts of the article, in various formats.
Downloads (link to download the article as PDF)
Open citations (links to open the citations from this article in various online reference manager services)
Cite this article (links to download the citations from this article in formats compatible with various reference manager tools)
How inhibitory and excitatory inputs gate output of the inferior olive
eLife 12:e83239.
https://doi.org/10.7554/eLife.83239


