Synchronous multi-segmental activity between metachronal waves controls locomotion speed in Drosophila larvae
- Department of Physics, Graduate School of Science, The University of Tokyo, Japan
- Department of Complexity Science and Engineering, Graduate School of Frontier Science, The University of Tokyo, Japan
- School of Psychology and Neuroscience, Centre of Biophotonics, University of St Andrews, United Kingdom
- Graduate School of Informatics and Engineering, The University of Electro-Communications, Japan
Figures
Figure 1 with 3 supplements
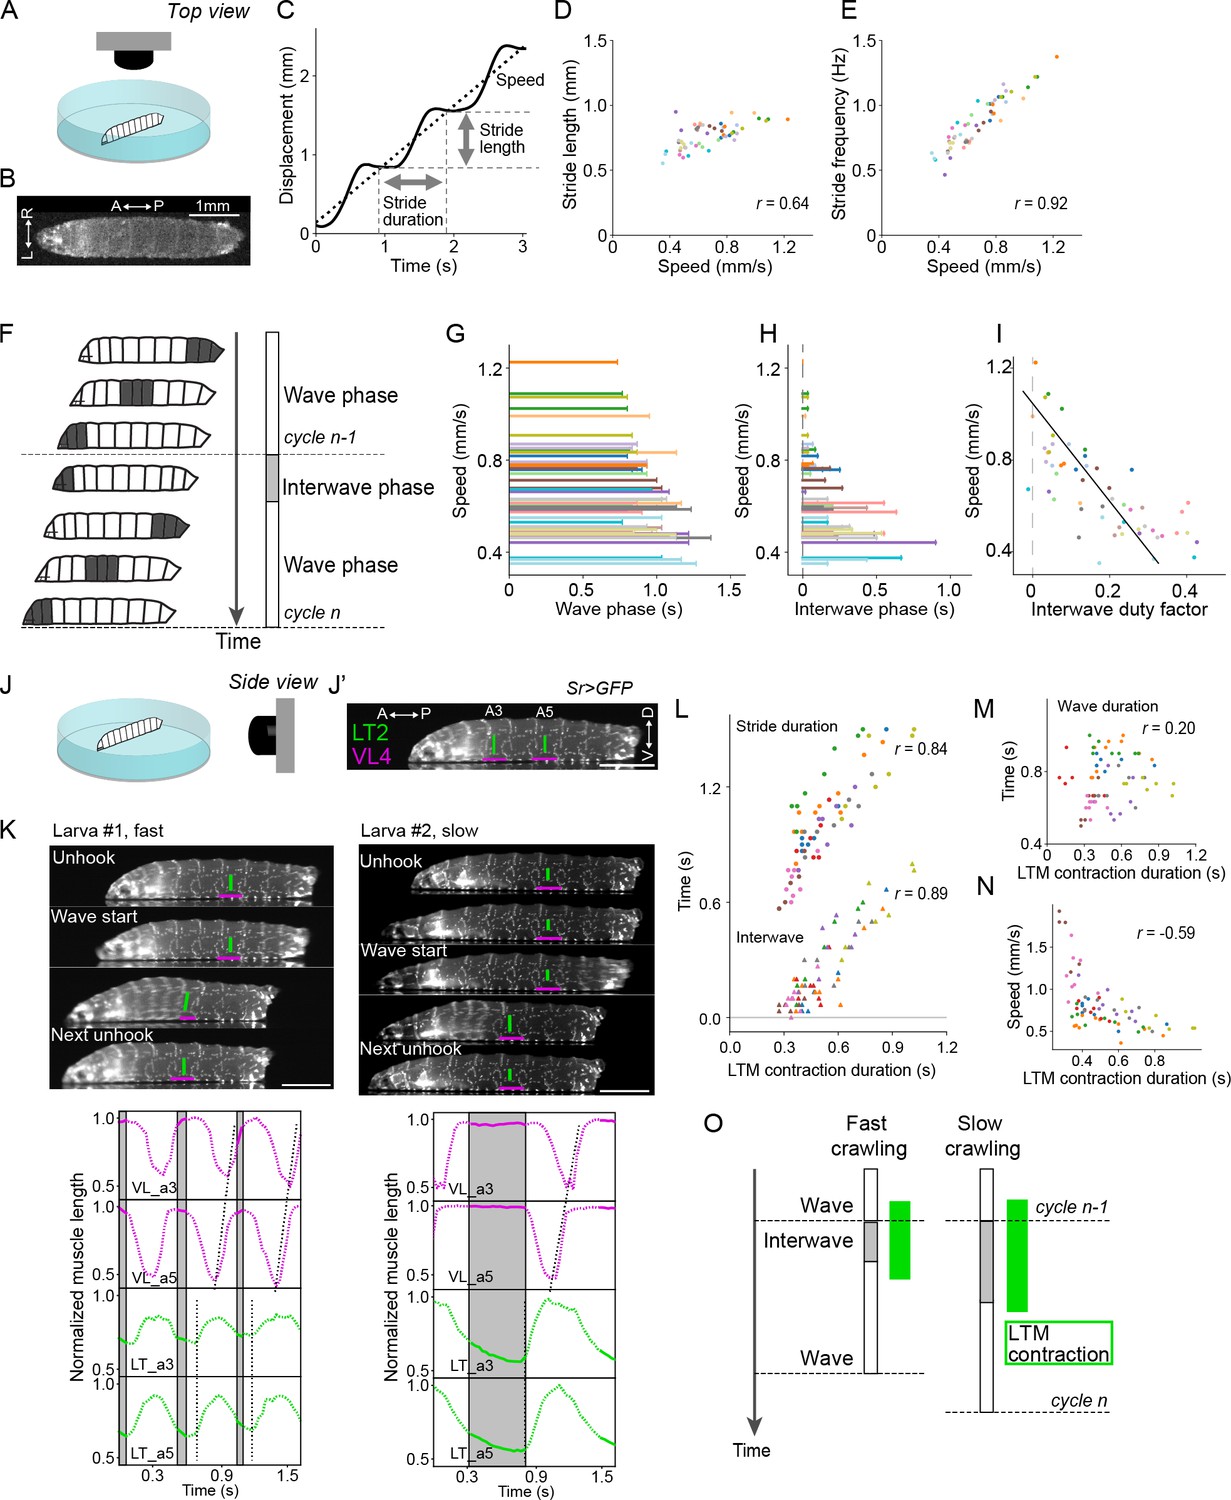
Crawling speed depends on the duration of interwave phase, during which the lateral transverse (LT) muscles are contracted.
(A–I) Recording of locomotion parameters from top view (n = 268 strides, 54 episodes, 18 larvae). (A) Schematic drawing of the crawling assay from top view. (B) An example frame of top-view recording. (C) Measurement of the stride duration, stride length, and speed. (D) Relationship between speed and mean stride length. Each dot shows a single episode. r represents Pearson correlation coefficient. (E) Relationship between speed and mean stride frequency. Each dot shows a single episode. (F) Schematic representation of the two phases of a locomotor cycle. (G) Relationship between the duration of wave phase and speed. (H) Relationship between the duration of interwave phase and speed. (I) Interwave duty factor, the proportion of interwave phase in the stride duration, decreases with speeds. Linear regression coefficient is –0.47. (J–O) Recording of locomotion parameters and muscular kinematics from side view (n = 9 larvae, 18 episodes, 67 strides). Scale bars: 1 mm. (J) Schematic drawing of the crawling assay from side view. (J’) An example frame of side-view recording. LT2: lateral transverse muscle 2; VL4: ventral longitudinal muscle 4. (K) Representative tracking of the muscle movement during forward crawling. Top-left panel shows the muscle movement with a fast speed. Top-right panel shows the muscle movement with a slow speed. Bottom panels demonstrate the dynamics of muscle lengths in the data shown in the top panels. (L) Relationship between the contraction duration of LT2 muscle and two temporal parameters (circles indicate stride duration, and triangles indicate interwave duration) (Pearson correlation coefficients; stride duration: 0.84 and interwave duration: 0.89). (M) Relationship between the contraction duration of LT2 muscle and wave duration (Pearson correlation coefficient: 0.20). (N) Relationship between the mean duration of LT2 muscle contraction and speed. (O) Schematic of the relationship between LT muscle (LTM) contraction and crawling speed. The duration of the two phases and the contraction of LT muscles are correlated with crawling speed. In (D, E, G, H, I, L, M, N), different colors indicate different animals.
Figure 1—figure supplement 1
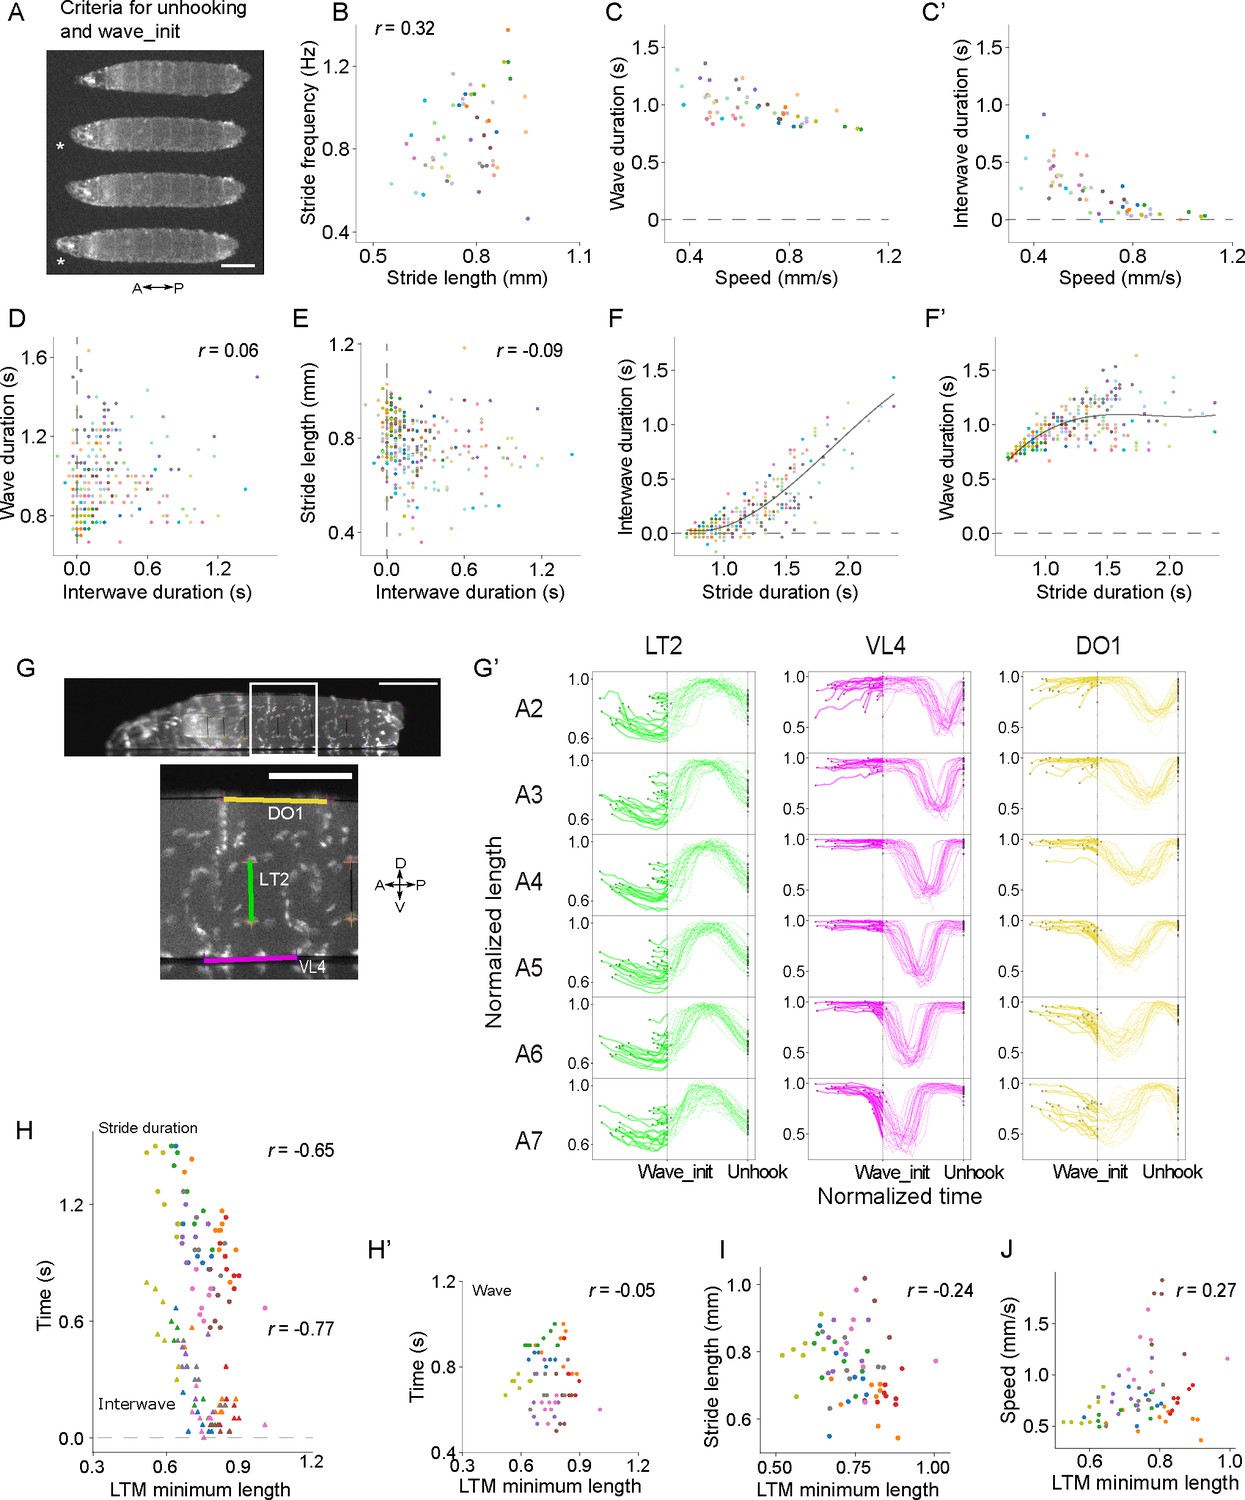
Kinematics of larval crawling and muscle length.
(A–F) Supplement to top-view crawling assay. Scale bars: 1mm. (A) Criteria to determine the unhooking moment and the wave initiation moment (see ‘Materials and methods’ for details). Asterisks indicate the key frames (upper asterisk: unhooking moment; lower asterisk: wave initiation moment). Scale bar: 1 mm. (B) Relationship between stride frequency and stride length. (C–C’) Relationship between speed and the two component phases (Pearson correlation coefficient: –0.74 for interwave phase and –0.62 for the wave duration; p-value=0.127). (D) Relationship between the duration of wave phase and interwave phase. (E) Relationship between stride length and the duration of interwave phase. (F) Relationship between stride duration and the duration of component phases. Lines: cubic regression (regression coefficients: interwave, [0.78,–2.1, 1.7, 0.3]; wave, [0.78, 3.1,–1.7, –0.3]; see ‘Materials and methods’ for details). (G–J) Supplement to side-view crawling assay. (G) An example frame of side-view recording. Lower panel is an enlarged image of the region indicated by the white rectangular in the top panel. The range of muscles (DO1, LT2, and VL4) is labeled. Scale bar: 1 mm. (G’) Dynamics of muscle length during forward crawling measured from the side-view assay (n = 8 larvae, 10 episodes, 28 strides). Muscle length is normalized to 0–1 by 0 and the maximum length of the muscle. Time is aligned by the wave_init moment and the unhooking moment (see ‘Materials and methods’ for details). Each trace initiates and ends at the beginning and end of a locomotor cycle. Scale bar: 0.5 mm. (H–J) Relationship between the minimum length of LT2 muscles and the crawling kinematics (see ‘Materials and methods’ for details). (H) Relationship with the stride duration (upper) and the duration of interwave phase (lower). (H’) Relationship with the duration of wave phase. (I) Relationship with the duration of wave phase. (J) Relationship between the mean of minimum length of LT2 muscles and the speed. In (B, C, C’, D, E, F, F’, H, H’, I, J), different colors indicated different animals.
Figure 1—video 1
Side-view imaging video of a larva showing fast crawling.
Figure 1—video 2
Side-view imaging video of a larva showing slow crawling.
Figure 2 with 1 supplement
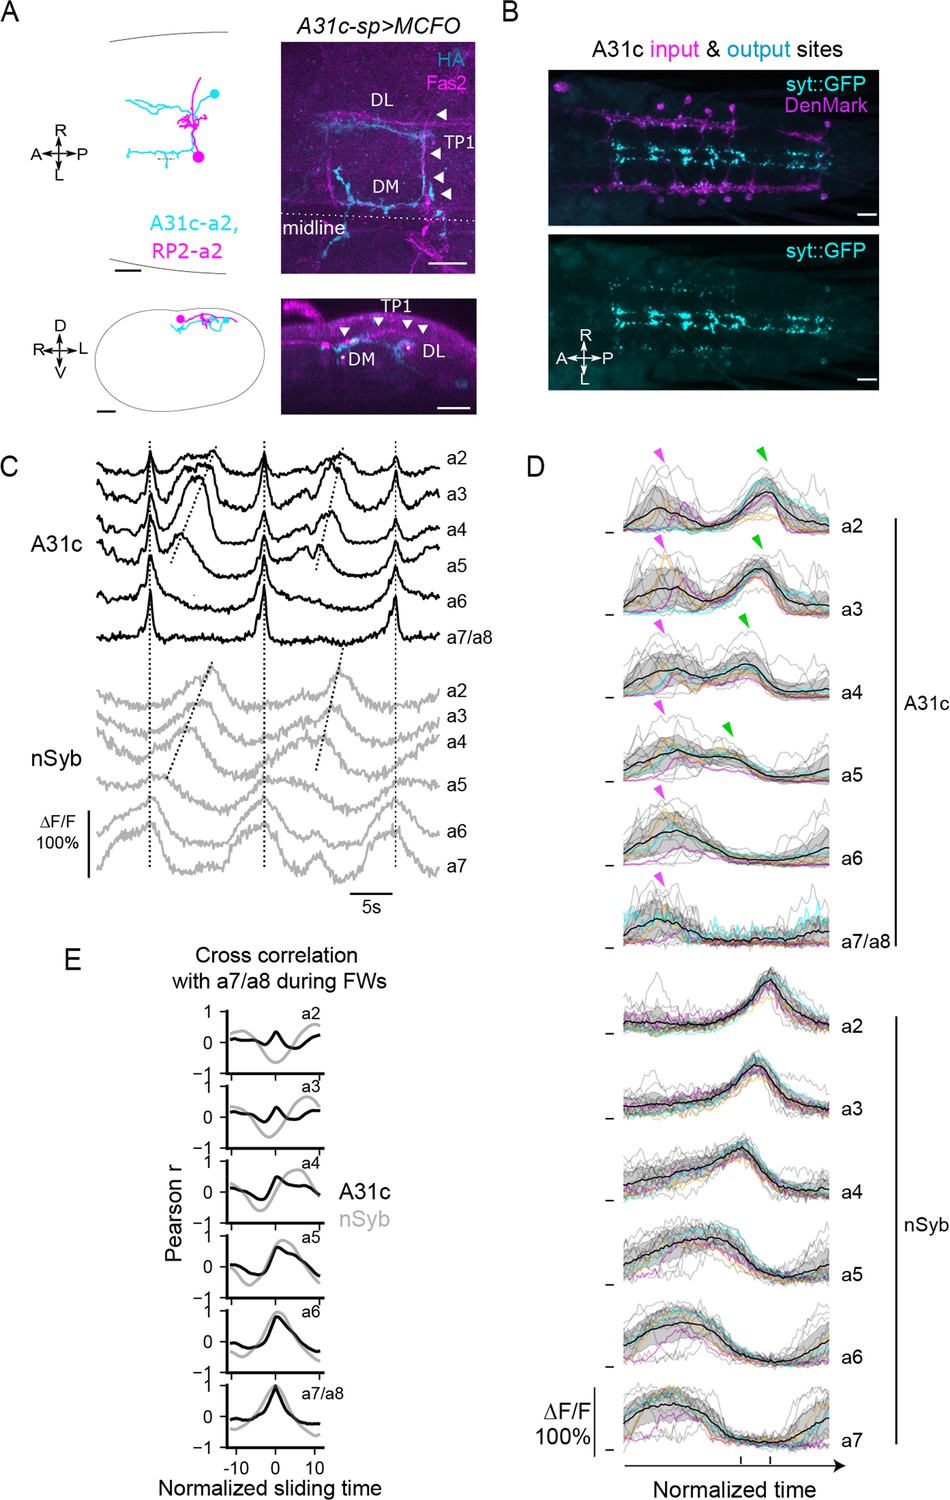
A31c neurons show synchronous activity preceding the forward wave.
(A) A31c single-neuron morphology shown by EM reconstruction and genetically mosaic analysis. TP1: transverse projection 1; DM: dorsomedial fascicle; DL: dorsolateral fascicle (Landgraf et al., 2003). Arrowheads indicate the tract of TP1. Scale bars: 20 μm. (B) Pre- and postsynapse markers label the input and output sites of A31c neurons (A31c-sp>UAS-syt::GFP, UAS-DenMark). Scale bars: 20 μm. (C–E) Recording of calcium activity of A31c neurons (A31c-sp>UAS-CD4::GCaMP6f) and group activity of nSyb neurons (nSyb-LexA>LexAop-RGECO1) which reports the pan-neuronal activity in fictive locomotion (n = 5 larvae, 15 traces). (C) Example recordings of A31c neurons and nSyb neurons in fictive forward locomotion. The vertical dashed lines indicate synchronous activity. The inclined dashed lines indicate neural activity that corresponds to fictive forward crawling. (D) Group data of calcium imaging of A31c neurons and nSyb neurons. Each trace is aligned by activity peak of nSyb_a4 and nSyb_a2 and normalized to 0–1 by the activity maximum and minimum of the whole recording. Magenta arrows indicate the co-activation of A31c neurons. Green arrows indicate the wave-like activity of A31c neurons. Black lines represent the average calcium activity. Shading represents the standard error. Colored lines represent the three example traces. Gray lines represent all other traces. Ticks along the horizontal axis indicate the activity peaks of nSyb_a4 and nSyb_a2. Ticks along the vertical axis indicate the 0. (E) Cross-correlation of neuronal activity between the neuron in each segment (from A2 to A7/A8) and the one in A7/A8 (black: A31c neurons; gray: nSyb neurons). See ‘Materials and methods’ for details.
Figure 2—figure supplement 1
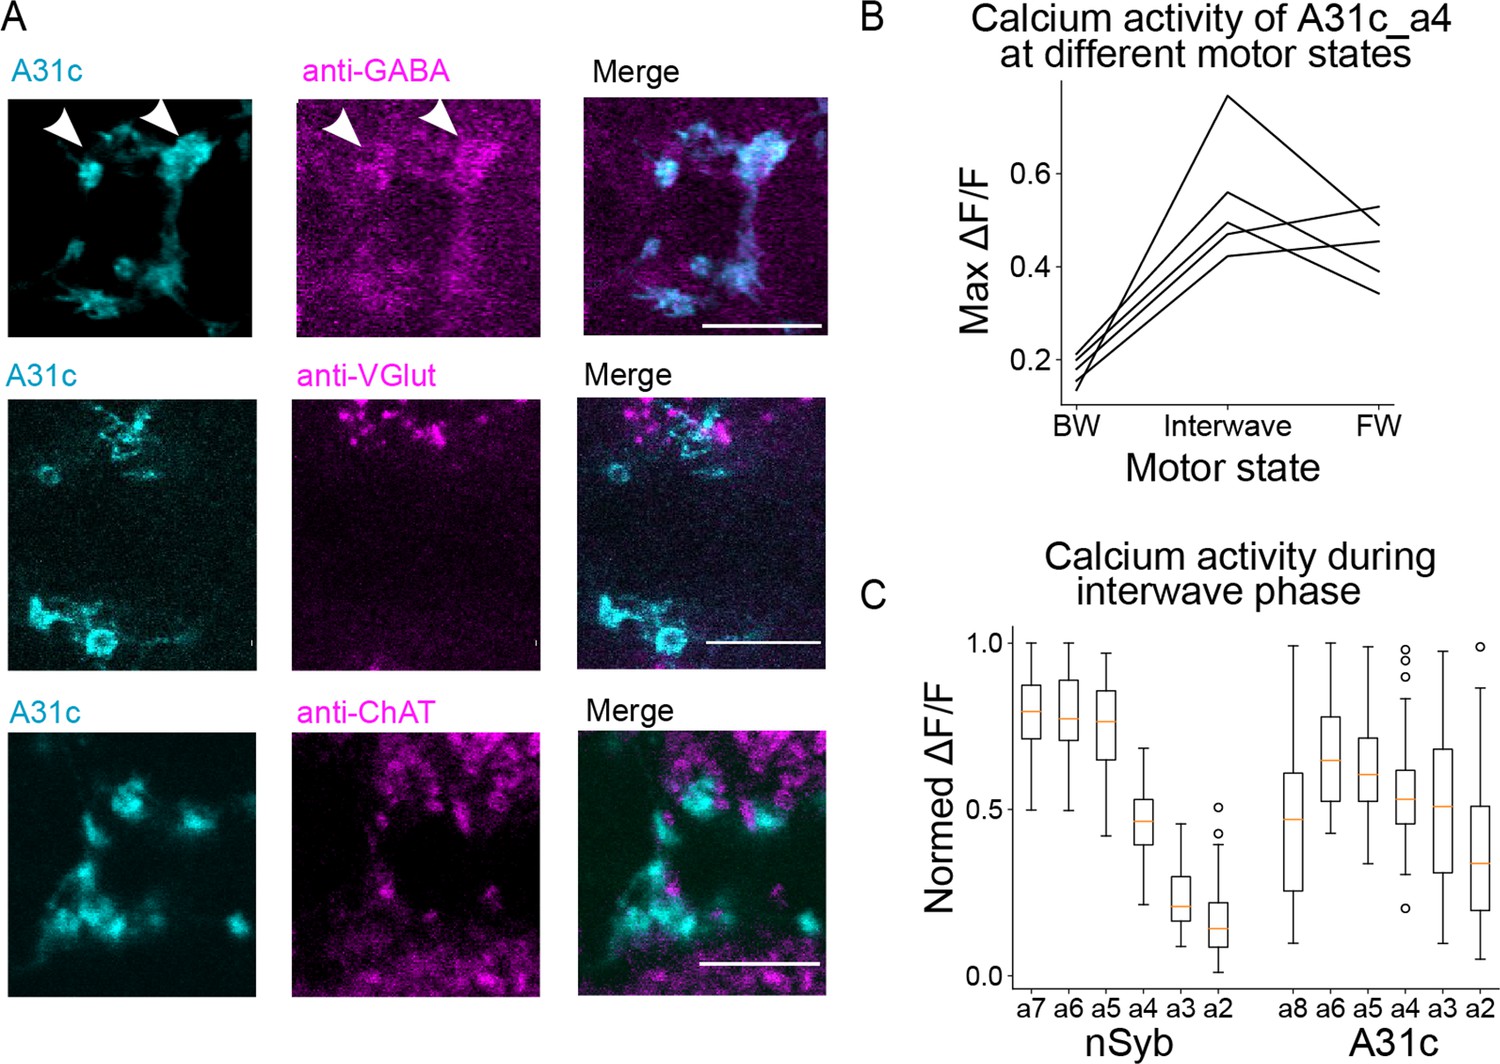
The neurotransmitter identity and calcium activity of A31c neurons.
(A) Immunostaining reveals that A31c neuron is GABAergic. Scale bars: 10 μm. (B) Comparison of the amplitude of the peak calcium signals of the A31c_a4 neuron in different motor states (BW: backward wave; PSync: posterior synchronous burst; FW: forward wave) (n = 5 larvae). (C) Comparison of the amplitude of the peak calcium signals of nSyb neurons and A31c neurons when nSyb-a7 reaches the peak (n = 5 larvae, see magenta arrowheads in Figure 2E).
Figure 3 with 1 supplement
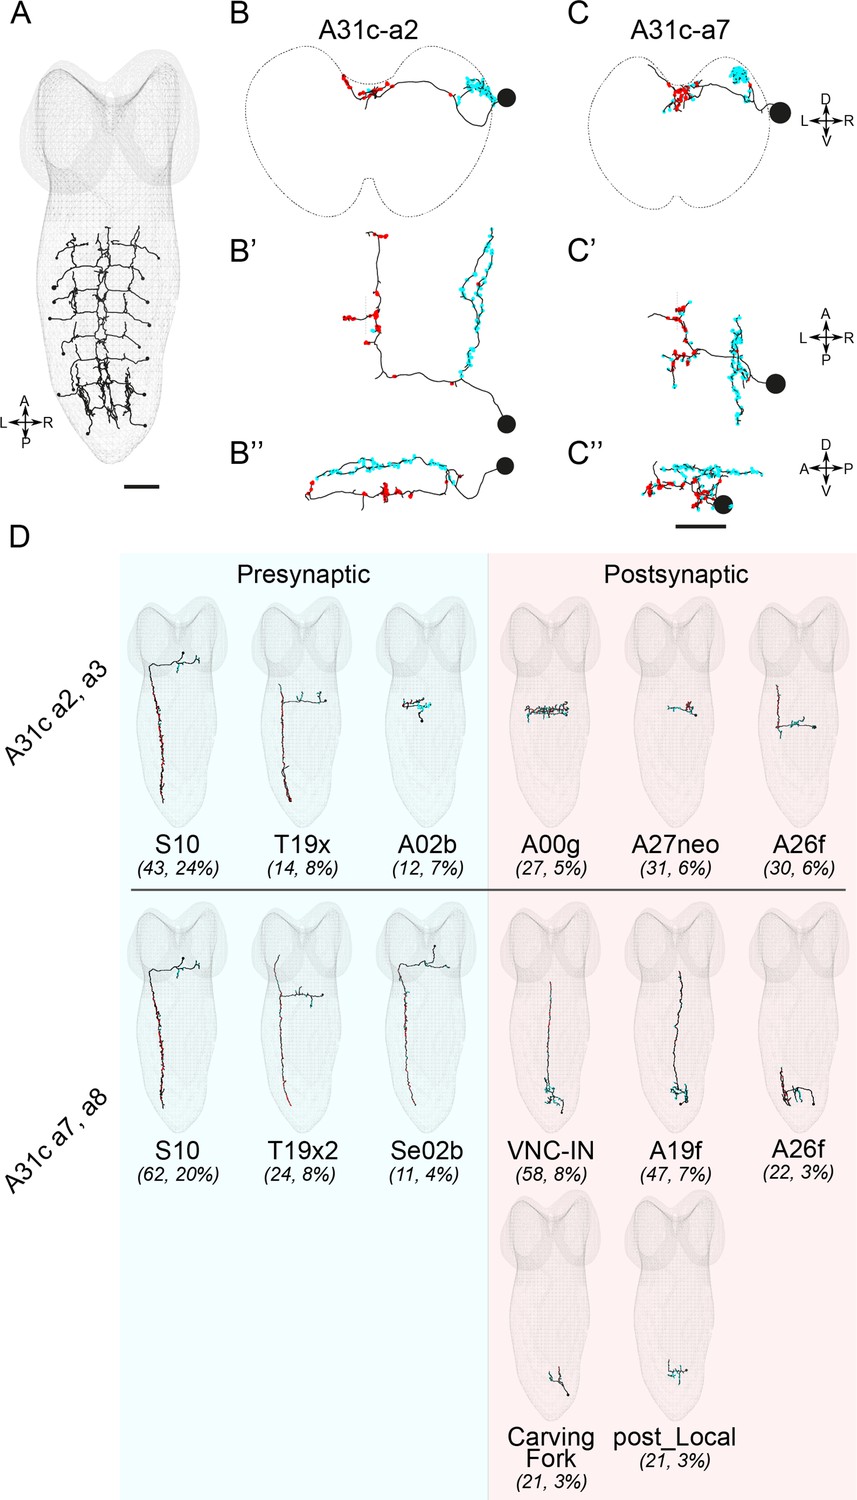
EM reconstruction reveals the connectivity of A31c neurons.
(A) Identification of all A31c neurons in the EM database. Scale bar: 20 μm. (B–B’’ and C–C’’) Morphology of an anterior (B–B’’) and a posterior (C–C’’) A31c neuron. (B, C) Frontal view, (B’, C’) dorsal view, and (B’’, C’’) lateral view. Red circles indicate the output sites. Cyan circles indicate the input sites. Scale bar: 10 μm. (D) Top pre- and postsynaptic partners of anterior and posterior A31c neurons.
Figure 3—figure supplement 1
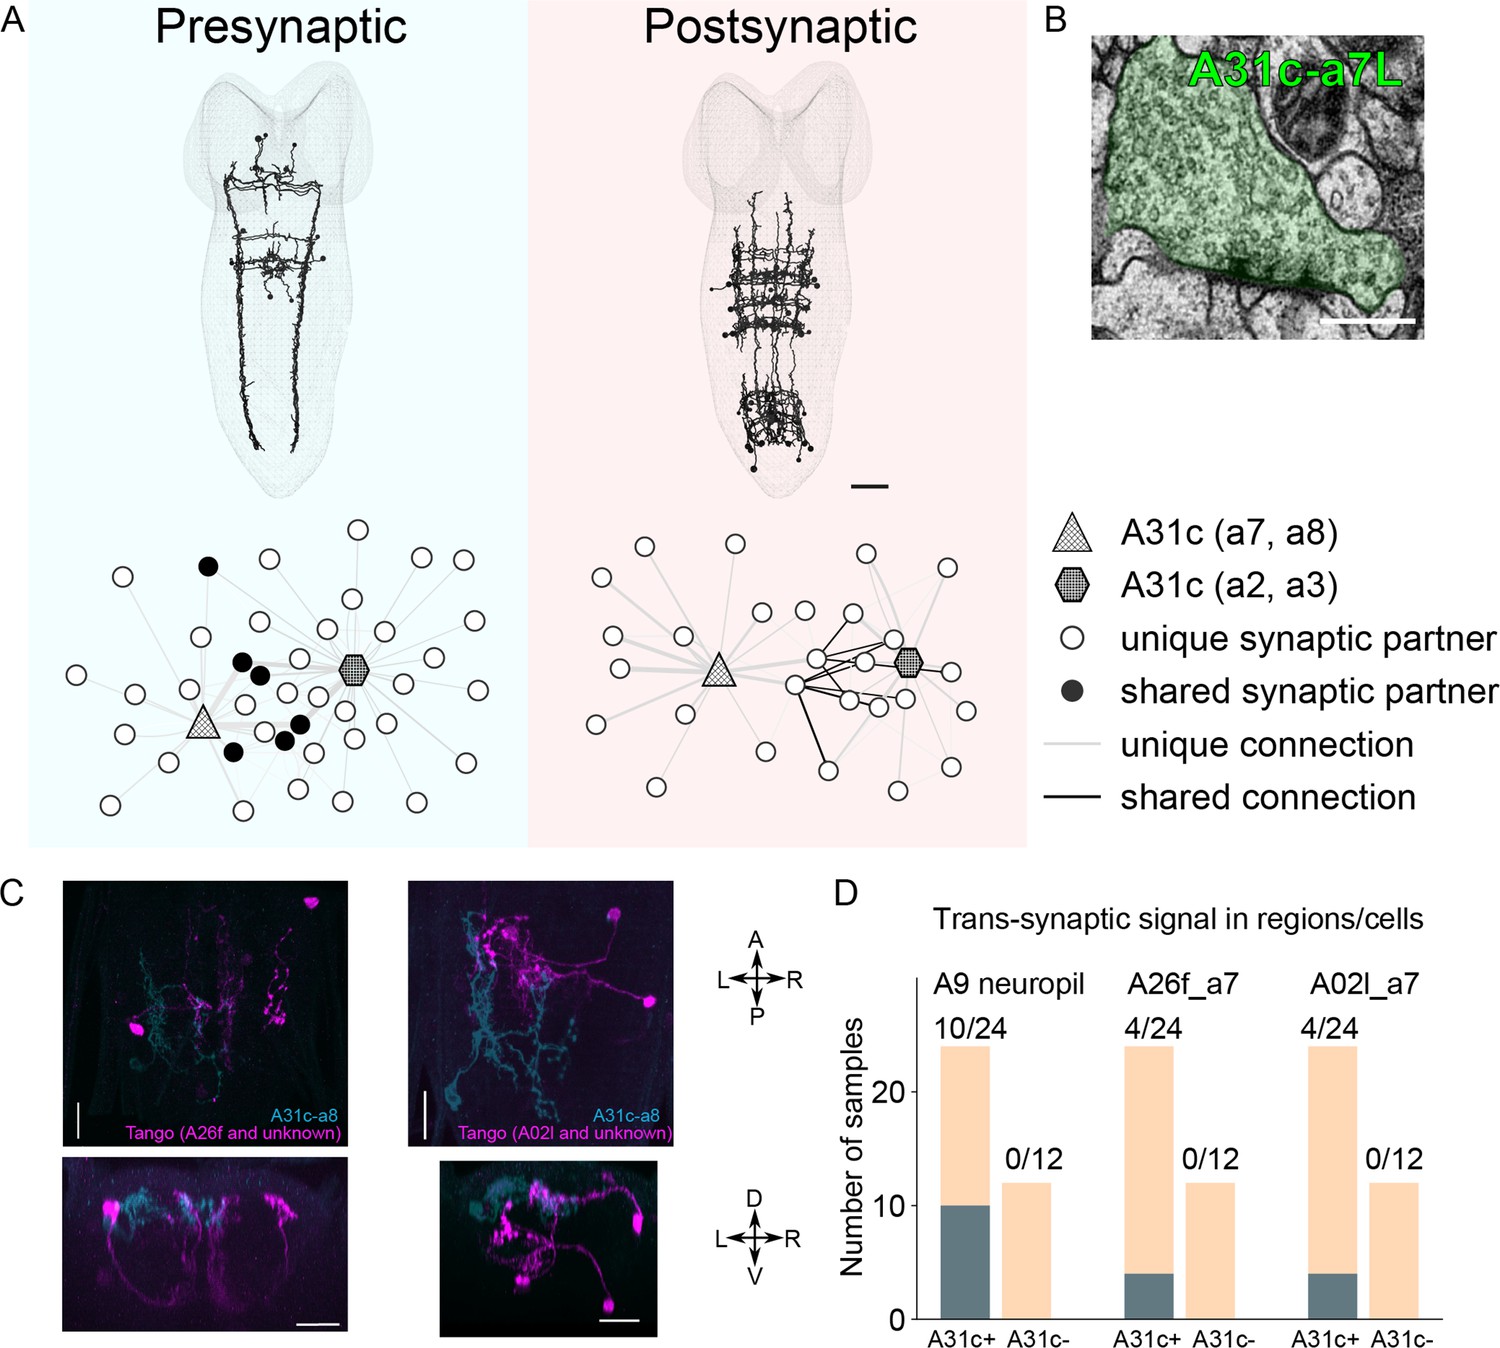
Connectivity of A31c neurons revealed by EM reconstruction and trans-synaptic labeling.
(A) Reconstructed main synaptic partners of A31c neurons. Scale bar: 20 μm. (B) A sample EM image shows the A31c presynaptic site. Scale bar: 0.5 μm. (C) trans-Tango reveals the postsynaptic partners (magenta) of A31c neurons (cyan) (A31c-a8-sp>trans-Tango). Scale bars: 20 μm. (D) Quantification of the number of samples that shows expression in regions or neurons repeatedly targeted by trans-Tango.
Figure 4 with 1 supplement
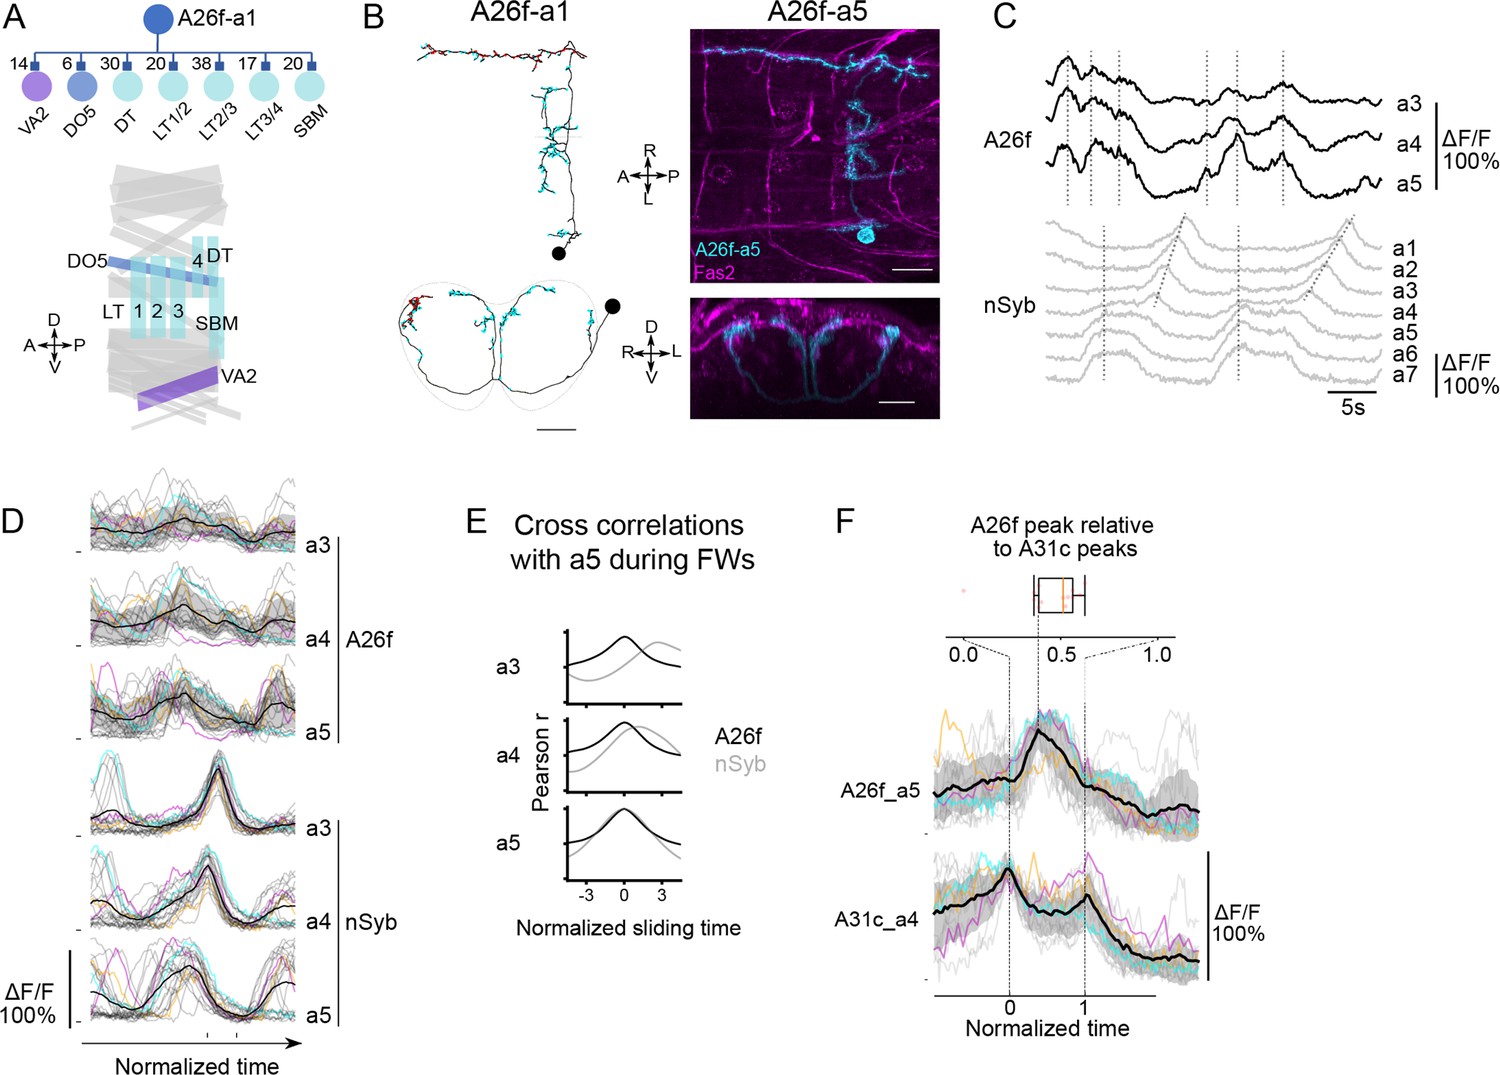
A26f neurons inhibit motor neurons and exhibit synchronous activity at the initiation of forward locomotion.
(A) A26f neurons innervate motor neurons. Top: postsynaptic neurons of A26f neurons revealed by connectomics analysis in A1 neuromere (Zarin et al., 2019). Bottom: layout of body wall muscles in a hemi-segment. Purple, blue, and sky-blue muscles are innervated by motor neurons in the same color in the top panel. (B) Morphology of A26f neurons shown by the EM reconstruction and confocal images. Scale bars: 10 μm. (C–E) Recording of calcium activity of A26f neurons (A26f-sp>UAS-CD4::GCaMP6f) and group activity of nSyb neurons (nSyb-LexA>LexAop-RGECO1) (n = 6 larvae, 18 traces). (C) Example recordings of A26f neurons and nSyb neurons in fictive forward locomotion. The vertical dashed lines in the A26f plot indicate synchronous activity. The vertical dashed lines in the nSyb traces indicate synchronous activity at the posterior-most segments during the interwave phase. The inclined dashed lines in the nSyb traces indicate neural activity that corresponds to fictive forward crawling. (D) Group data of calcium imaging of A26f neurons and nSyb neurons. Each trace is aligned to the activity peak of nSyb_a4 and nSyb_a2 and normalized to 0–1 by the activity maximum and minimum of the whole recording. Black lines represent the average calcium activity. Shading represents the standard error. Colored lines represent the three example traces. Gray lines represent all other traces. Ticks along the horizontal axis indicate the activity peaks of nSyb_a4 and nSyb_a2. Ticks along the vertical axis indicate the 0. (E) Cross-correlation of neuronal activity between the neuron in each segment (A3–A5) and the one in A5 (black: A26f neurons, gray: nSyb neurons). See ‘Materials and methods’ for details. (F) Simultaneous calcium imaging of A31c and A26f neurons. Bottom: recording of calcium activity of A26f-a5 neuron (A26f-sp>UAS-CD4::GCaMP6f) and A31c-a4 neuron (A31c-LexA>LexAop-jRCaMP1b) (n = 6 larvae, 13 traces). Colored lines indicate the example traces. Black lines indicate the average calcium activity. Gray lines indicate all other traces. The left vertical dashed line indicates the first synchronous activity of A31c (normalized time = 0), and the right vertical dashed line indicates the second synchronous activity of A31c (normalized time = 1). Top: peak time of A26f signals relative to the first peak time of A31c signals.
Figure 4—figure supplement 1
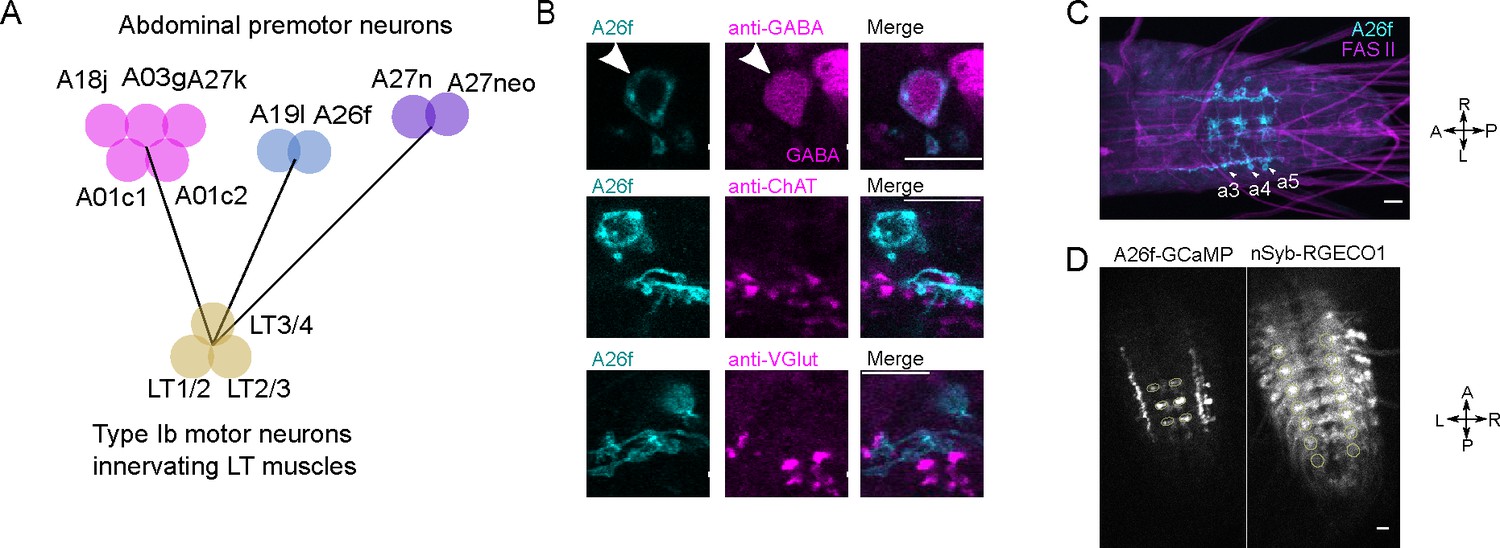
LT motor neuron connectivity and the neurotransmitter identity and calcium activity of A26f neurons.
(A) Premotor interneurons that target the motor neurons innervating LT1-4 muscles. (B) Immunostaining reveals that A26f neuron is GABAergic. (C) A26f-sp labels A26f neurons in A3 to A5 neuromeres. (D) Calcium signals of A26f neurons and nSyb neurons in fictive locomotor cycles. In all panels, scale bars indicate 10 μm.
Figure 5 with 1 supplement
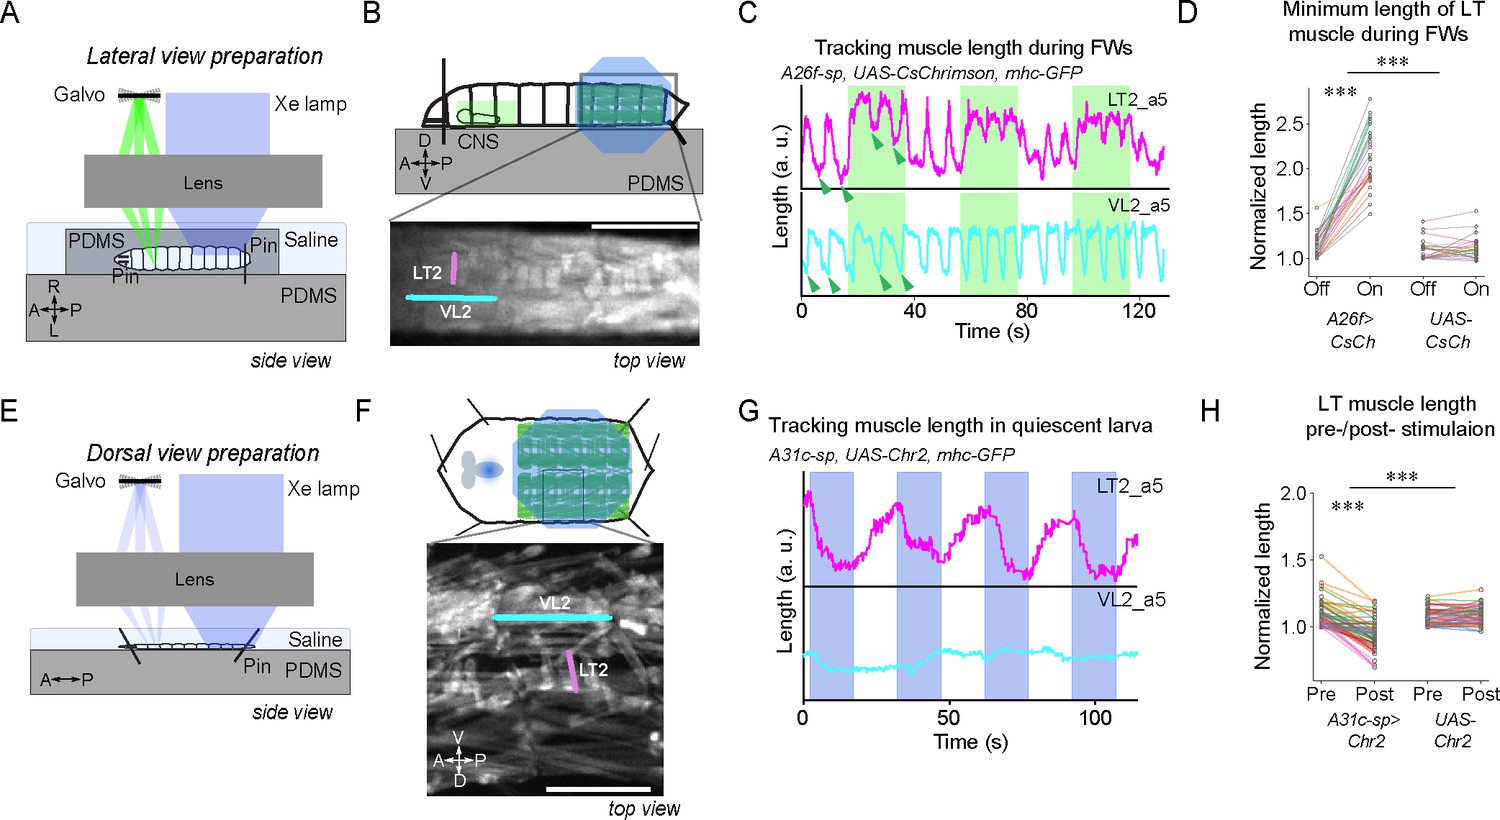
Optogenetic activation of A31c or A26f neurons affects the contraction of lateral transverse (LT) muscles.
(A–D) Optogenetic activation of A26f neurons reduces the contraction amplitude of the LT2 muscle during forward crawling in the sideways preparation. (E–H) Optogenetic activation of A31c neurons causes contraction of the LT muscle in the fillet preparation. (A, E) Experimental setups. See ‘Materials and methods’ for details. (B, F) Schematics of the imaging setup (top) and sample fluorescence images (bottom). Scale bars: 0.5 mm. (C, G) Traces of the length of the transverse muscle LT2 and the longitudinal muscle VL2 in the optogenetic experiments. Shaded regions show the timing when the light stimulus is applied. Arrowheads indicate where the measurement was made in Figure 5D. (D) The minimum length of the LT2 muscle was increased by the activation of A26f neurons (A26f group: n = 8 larvae, 28 trials; control group: n = 8 larvae, 28 trials). Muscle lengths are normalized to the minimum length during the light-off period. Different colors indicate different animals. The hierarchical bootstrap test is used (see ‘Materials and methods’ for details). (H) The length of the LT2 muscle in quiescent larvae was decreased by the activation of A31c neurons (A26f group: n = 8 larvae, 62 trials; control: n = 8 larvae, 56 trials). Muscle lengths are normalized to the minimum length during the light-off period. Different colors indicate different animals. The hierarchical bootstrap test is used (see ‘Materials and methods’ for details).
Figure 5—figure supplement 1
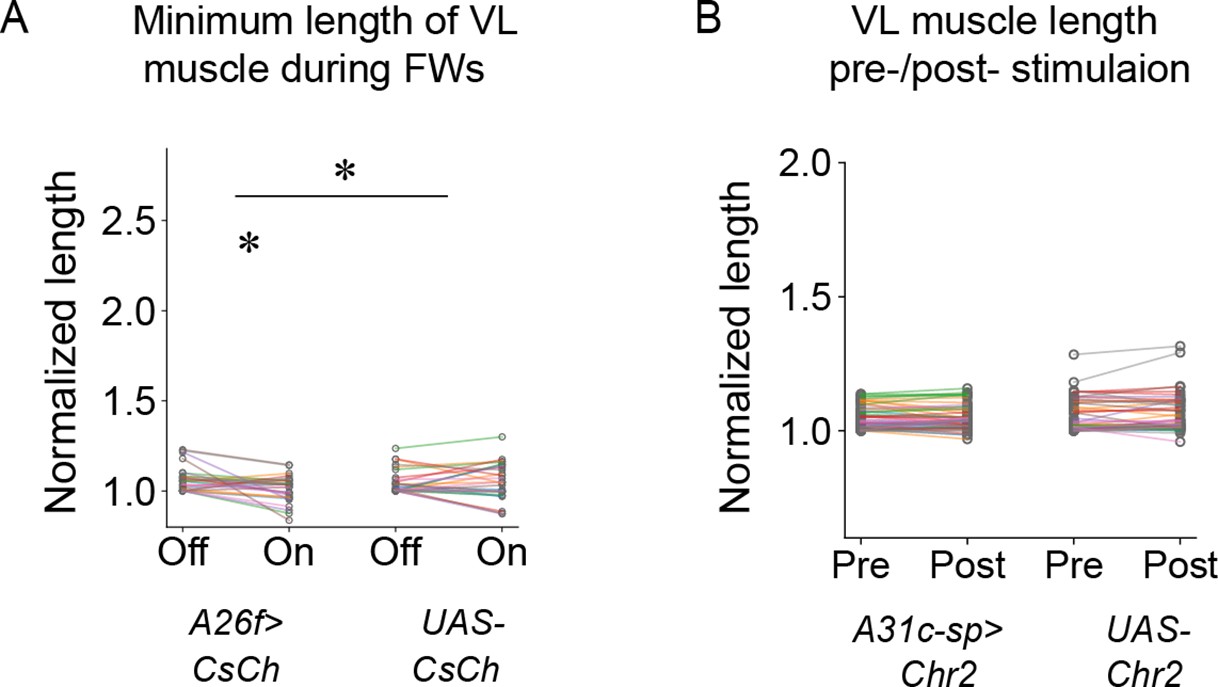
The length of longitudinal VL muscles upon optogenetic activation of A26f and A31c neurons.
(A) The minimum length of longitudinal VL muscles during forward waves in sideways preparation decreased during optogenetic activation of A26f neurons. Different colors indicate different animals. (B) The length of VL muscles in quiescent larvae was not affected by optogenetic activation of A31c neurons. Different colors indicate different animals.
Figure 6
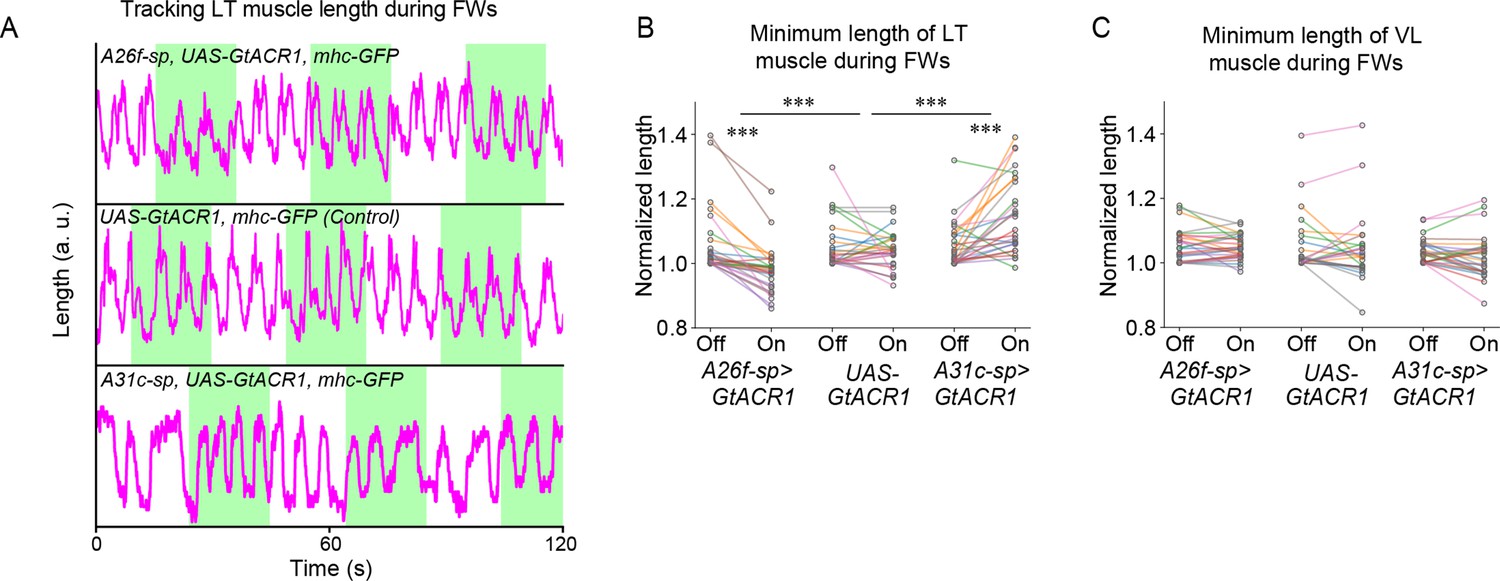
Optogenetic inhibition of A31c or A26f neurons affects the contraction of lateral transverse (LT) muscles.
(A) Traces of the length of transverse muscles (LT2) in the sideways preparation with optogenetic stimulation. (B, C) Quantification of the minimum length of LT muscles and VL muscles by the optogenetic inhibition of A26f or A31c neurons (A26f group: n = 8 larvae, 28 trials; control group: n = 8 larvae, 26 trials; A31c group: n = 8 larvae, 27 trials). Muscle lengths are normalized to the minimum length during the light-off period. Different colors indicate different animals. The hierarchical bootstrap test is used (see ‘Materials and methods’ for details). (B) The minimum length of LT muscles was affected by the optogenetic inhibition of A26f or A31c neurons. (C) VL muscles was not affected by the optogenetic inhibition of A26f or A31c neurons.
Figure 7 with 2 supplements
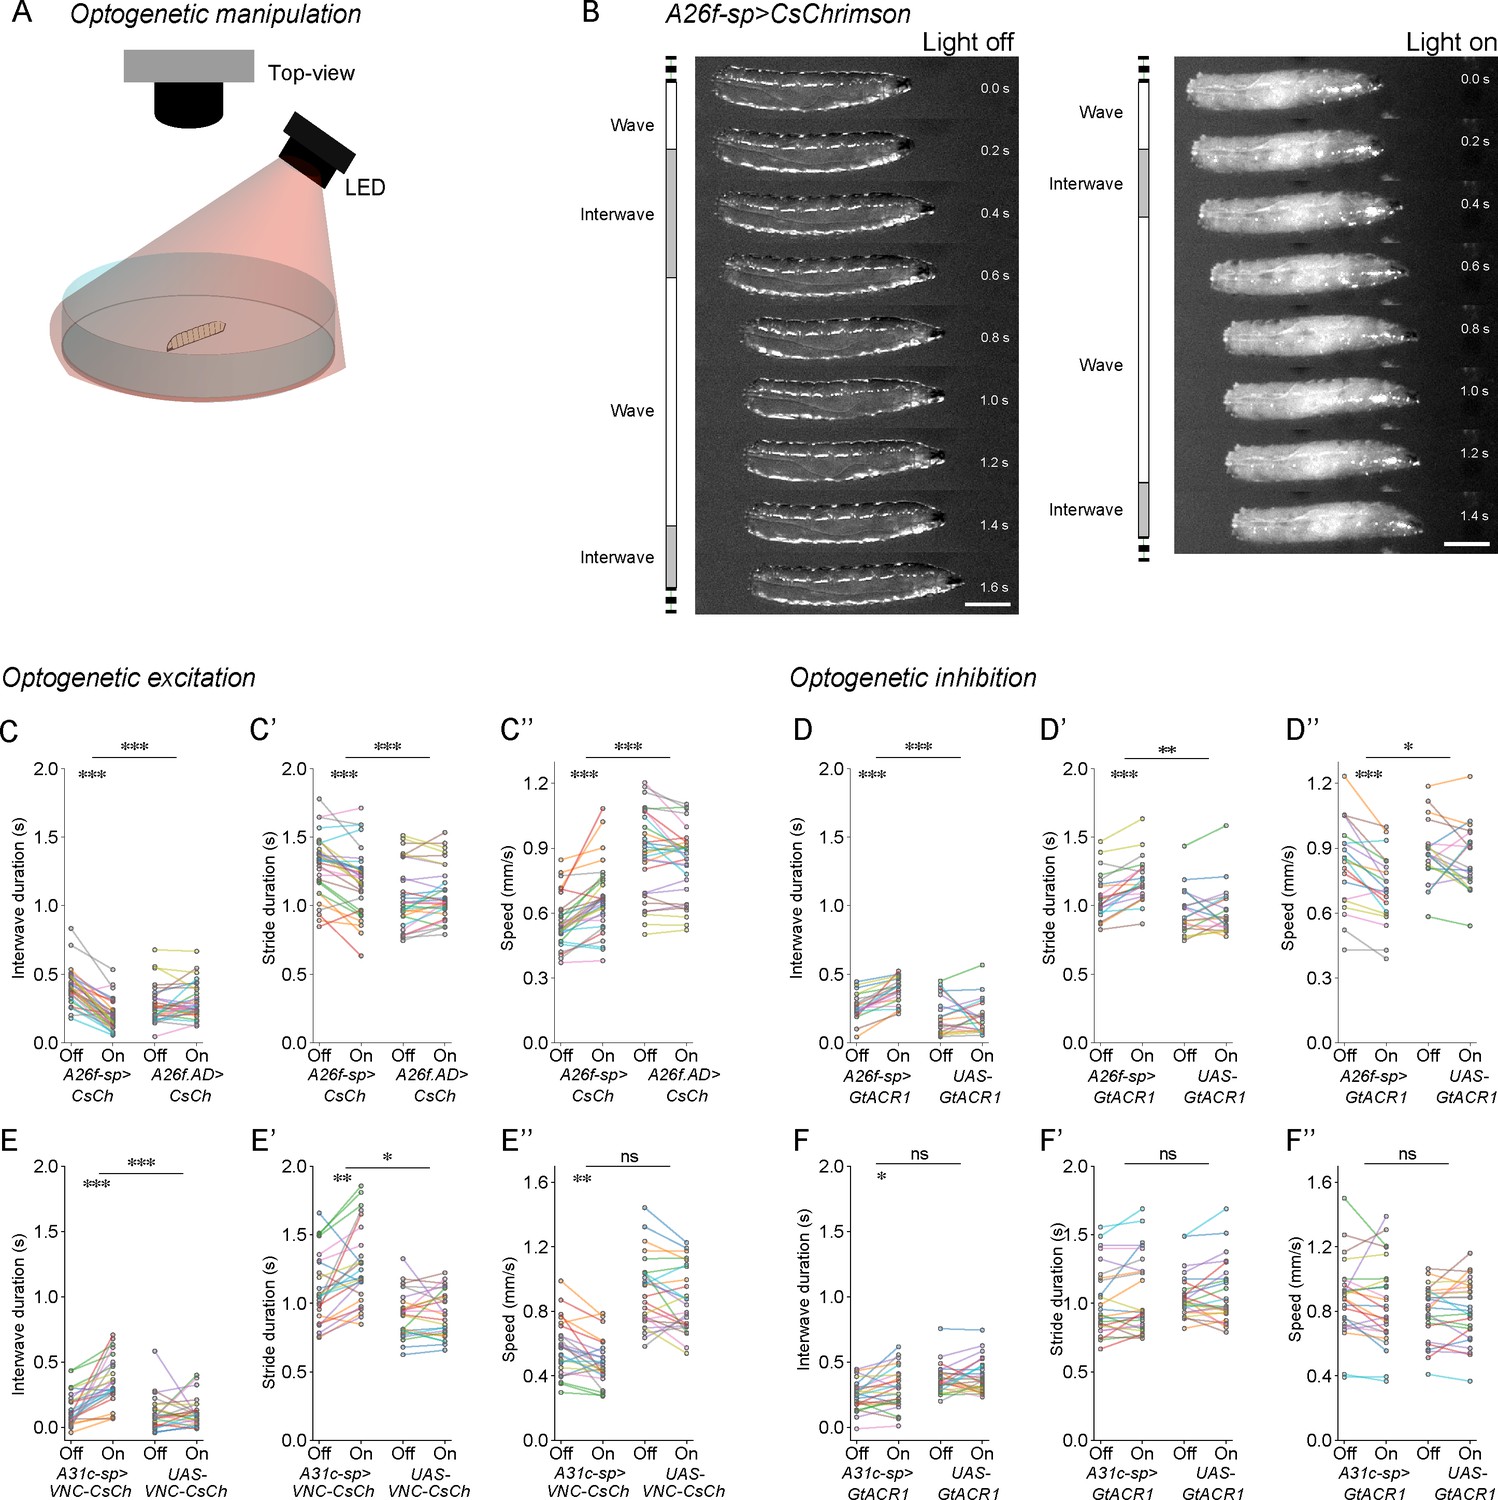
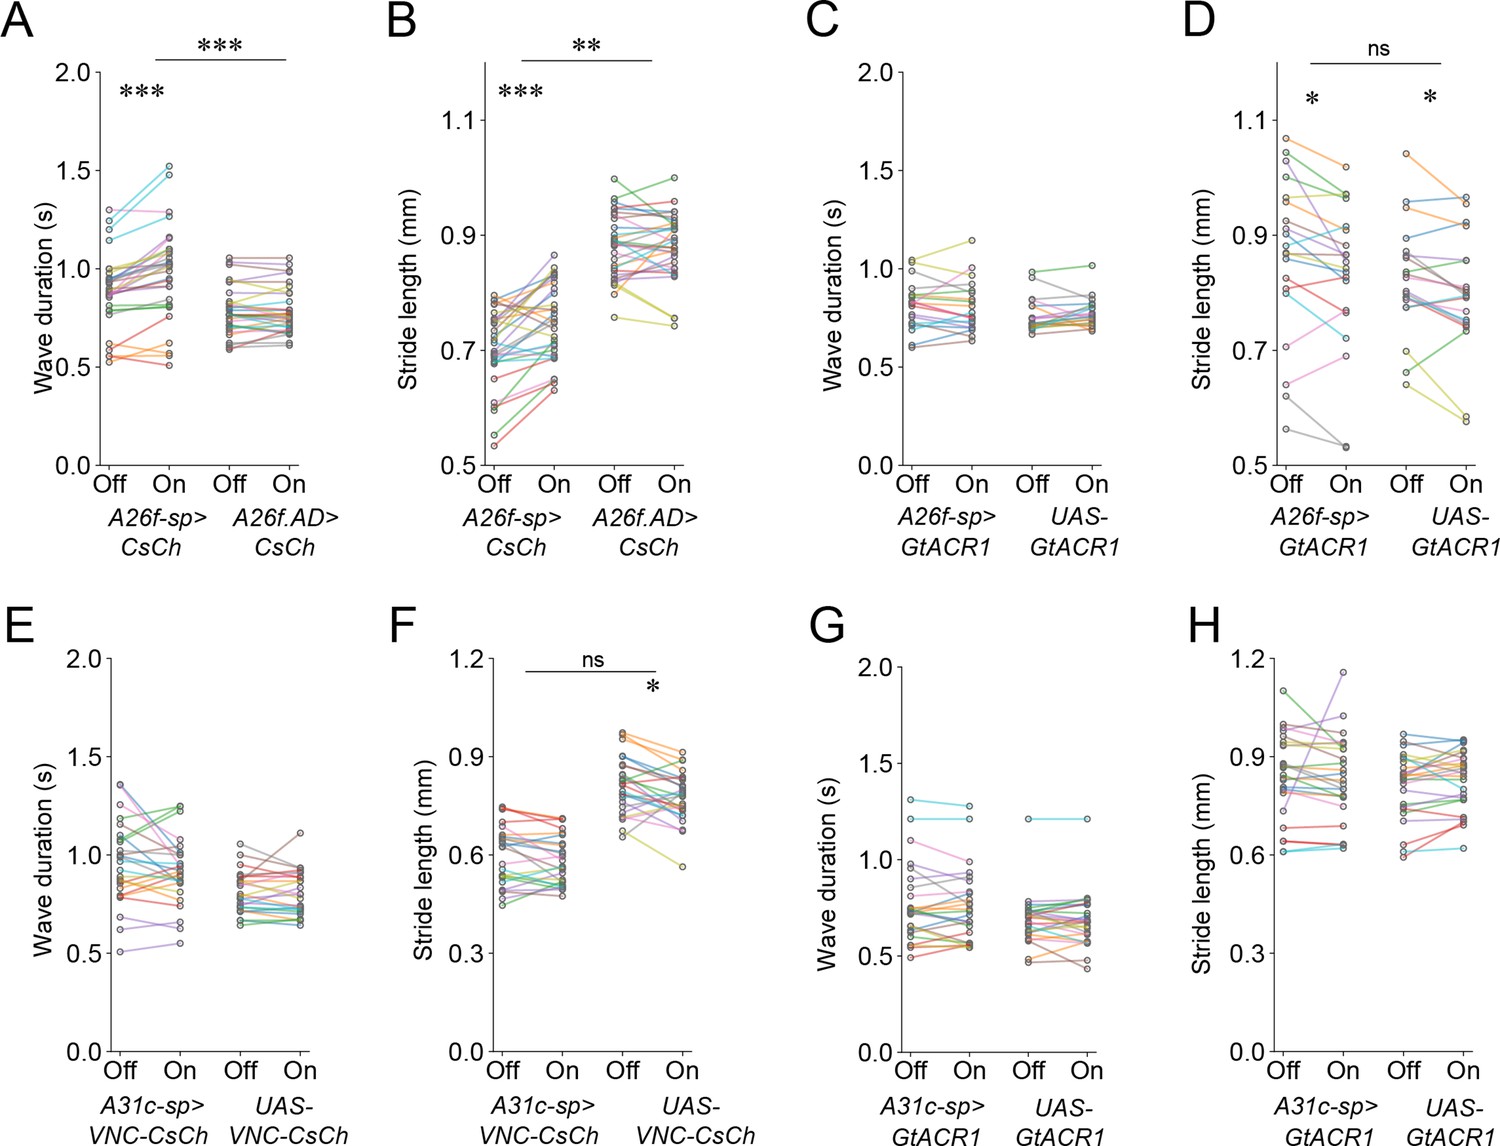
Optogenetic manipulation of A26f neurons affects the interwave duration.
(A) Experimental setup for optogenetics in free-crawling larvae. (B) Example frames show that the interwave phase is reduced during the activation of A26f neurons. Scale bars: 1 mm. (C–C’’) Crawling dynamics changed during the activation of A26f neurons (A26f group: n = 10 larvae, 30 trials; control group: n = 10 larvae, 30 trials). (D–D’’) Crawling dynamics changed during the inhibition of A26f neurons (A26f group: n = 10 larvae, 20 trials; control group: n = 10 larvae, 20 trials). (E–E’’) Crawling dynamics changed during the activation of A31c neurons (A31c group: n = 10 larvae, 25 trials; control group: n = 10 larvae, 25 trials). (F–F’’) Crawling dynamics changed during the inhibition of A31c neurons (A31c group: n = 10 larvae, 25 trials; control group: n = 10 larvae, 25 trials). In (C–F’’), different colors indicate different animals and the hierarchical bootstrap test is used (see ‘Materials and methods’ for details).
Figure 7—figure supplement 1
Analysis of crawling kinematics of larvae with optogenetic perturbation.
(A, B) Activation of A26f neurons. (C, D) Inhibition of A26f neurons. (E, F) Activation of A31c neurons. (G, H) Inhibition of A31c neurons. Statistical results are obtained by the hierarchical bootstrap test (see ‘Materials and methods’ for details). In all panels, different colors indicate different animals.
Figure 7—figure supplement 2

Confocal images showing the expression patterns of split GAL4 drivers in the central nervous system (CNS).
(A) The expression pattern of A26f-sp>UAS-CsChrimson. Cyan indicates the split-GAL4-driven expression. Magenta indicates the Fasciclin2 (Fas2)-positive tracts. (B) The expression pattern of A31c-sp>UAS-VNC-CsChrimson. (C) The expression pattern of A31c-sp>UAS-GtACR1. (D) The expression pattern of A31c-sp>UAS-GtACR1 co-labeled with a neuroblast marker Deadpan (Dpn). Cyan indicates the split-Gal4 driver expression. Magenta indicates anti-Dpn immunostaining. (Di) A stacked confocal image in the brain. (Dii–Div) Enlarged z planes of the boxes in (i). In all panels, scale bars indicate 20 μm.
Figure 8
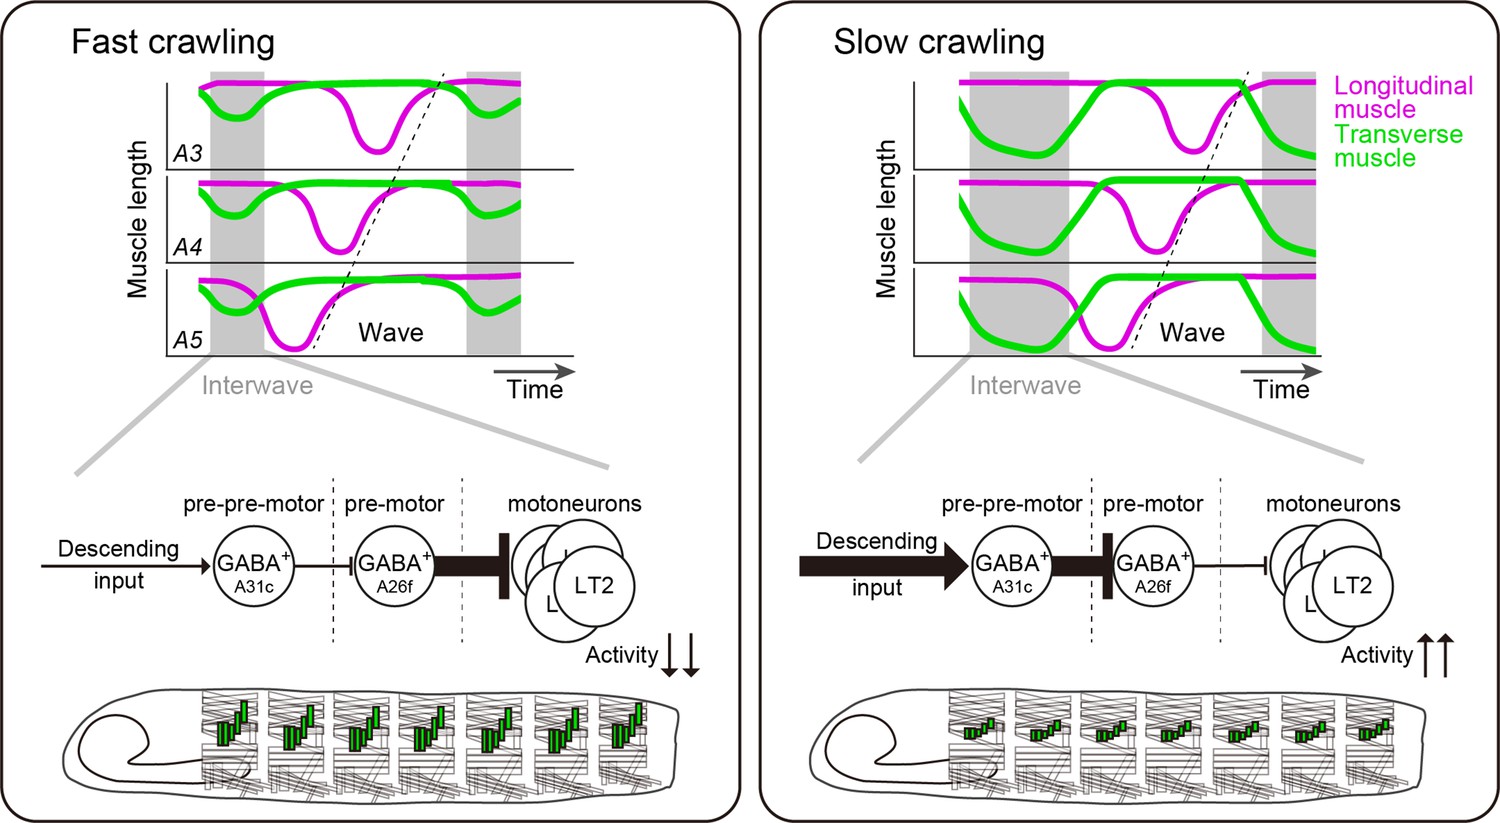
Schematics of larval speed control by A26f and A31c.
Contraction of transverse muscles is suppressed by A26f neurons to make the interwave phase short and crawl fast (left panel). Multi-segmental synchronous activity of A31c and A26f neurons elongates the interwave phase duration to decrease crawling speed (right panel).
Tables
Key resources table
| Reagent type (species) or resource | Designation | Source or reference | Identifiers | Additional information |
|---|---|---|---|---|
| Genetic reagent (Drosophila melanogaster) | yw | Bloomington Drosophila Stock Center | BDSC #6598 | |
| Genetic reagent (D. melanogaster) | GMR24H08-GAL4.AD | Bloomington Drosophila Stock Center | BDSC #68300 | A31c-a8-sp.AD |
| Genetic reagent (D. melanogaster) | GMR45F08-GAL4.DBD | Bloomington Drosophila Stock Center | BDSC #70239 | A31c-a8-sp.DBD |
| Genetic reagent (D. melanogaster) | GMR44F09-GAL4.DBD | Bloomington Drosophila Stock Center | BDSC #71061 | A31c-sp.DBD |
| Genetic reagent (D. melanogaster) | GMR41F02-GAL4.AD | Bloomington Drosophila Stock Center | BDSC #75660 | A31c-sp.AD |
| Genetic reagent (D. melanogaster) | R76E09-LexA | Bloomington Drosophila Stock Center | BDSC #54951 | A26f-LexA |
| Genetic reagent (D. melanogaster) | VT050223-GAL4.AD | Bloomington Drosophila Stock Center | BDSC #72931 | A26f-sp.AD |
| Genetic reagent (D. melanogaster) | R15E05-GAL4.DBD | Bloomington Drosophila Stock Center | BDSC #68731 | A26f-sp.DBD |
| Genetic reagent (D. melanogaster) | GMR45F08-GAL4 | Bloomington Drosophila Stock Center | BDSC #49565 | A31c-a8-Gal4 |
| Genetic reagent (D. melanogaster) | GMR76E09-GAL4 | Bloomington Drosophila Stock Center | BDSC #39931 | A26f-GAL4 |
| Genetic reagent (D. melanogaster) | GMR41F02-LexA | Bloomington Drosophila Stock Center | BDSC #54794 | A31c-LexA |
| Genetic reagent (D. melanogaster) | nSyb-LexA_VK00027 | This study | nSyb-LexA_VK27 | |
| Genetic reagent (D. melanogaster) | eve[RRa-F]-GAL4 | Gift from Dr. Miki Fujioka | ||
| Genetic reagent (D. melanogaster) | sr-GAL4 | Bloomington Drosophila Stock Center | BDSC #26663 | |
| Genetic reagent (D. melanogaster) | UAS-CD4::GCaMP6f_attp40 | Kohsaka et al., 2014 | ||
| Genetic reagent (D. melanogaster) | LexAop2-RGECO1_VK00005 | Kohsaka et al., 2014 | ||
| Genetic reagent (D. melanogaster) | LexAop-jRCaMP1b | Bloomington Drosophila Stock Center | BDSC #64428 | |
| Genetic reagent (D. melanogaster) | 20XUAS-6XGFP | Bloomington Drosophila Stock Center | BDSC #52262 | |
| Genetic reagent (D. melanogaster) | trans-Tango | Bloomington Drosophila Stock Center | BDSC #77124 | |
| Genetic reagent (D. melanogaster) | MCFO-4 | Bloomington Drosophila Stock Center | BDSC #64088 | |
| Genetic reagent (D. melanogaster) | mhc-GFP | Gift from Dr. Cynthia L. Hughes | ||
| Genetic reagent (D. melanogaster) | UAS-CsChrimson::mVenus | Bloomington Drosophila Stock Center | BDSC #55136 | |
| Genetic reagent (D. melanogaster) | UAS-GtACR1_attp2 | Gift from Dr. Chris Doe | ||
| Genetic reagent (D. melanogaster) | UAS-VNC-CsChrimson | Gift from Dr. Karen Hibbard (Hiramoto et al., 2021) | ||
| Antibody | Anti-GFP (rabbit, polyclonal) | Frontier Institute | Af2020 | 1:1000 |
| Antibody | Anti-Fas2 (mouse, monoclonal) | Developmental Studies Hybridoma Bank | 1D4 | 1:10 |
| Antibody | Anti-GFP (guinea pig, polyclonal) | Frontier Institute | Af1180 | 1:1000 |
| Antibody | Anti-HA (rabbit, monoclonal) | Cell Signaling Technology | C29F4 | 1:1000 |
| Antibody | Anti-ChAT (mouse, monoclonal) | Developmental Studies Hybridoma Bank | 4B1 | 1:50 |
| Antibody | Anti-GABA (rabbit, polyclonal) | Sigma | A2052 | 1:100 |
| Antibody | Anti-VGluT (mouse, polyclonal) | Gift from Dr. Hermann Aberle | 1:1000 | |
| Antibody | Anti-DsRed (rabbit, polyclonal) | Clontech | #632496 | 1:500 |
| Antibody | Alexa Fluor 488-conjugated anti-rabbit IgG (goat, polyclonal) | Invitrogen Molecular Probes | A-11034 | 1:300 |
| Antibody | Alexa Fluor 555-conjugated anti-mouse IgG (goat, polyclonal) | Invitrogen Molecular Probes | A-21424 | 1:300 |
| Antibody | Alexa Fluor 488-conjugated anti-guinea pig IgG (goat, polyclonal) | Invitrogen Molecular Probes | A-11073 | 1:300 |
| Software, algorithm | FIJI | Abràmoff et al., 2004 | RRID:SCR_002285 | |
| Software, algorithm | DeepLabCut | Mathis et al., 2018 | https://github.com/DeepLabCut/DeepLabCut; (RRID:SCR_021391, version 2.1); Mathis et al., 2023 |
Additional files
Download links
A two-part list of links to download the article, or parts of the article, in various formats.
Downloads (link to download the article as PDF)
Open citations (links to open the citations from this article in various online reference manager services)
Cite this article (links to download the citations from this article in formats compatible with various reference manager tools)
Synchronous multi-segmental activity between metachronal waves controls locomotion speed in Drosophila larvae
eLife 12:e83328.
https://doi.org/10.7554/eLife.83328


