Empagliflozin reduces podocyte lipotoxicity in experimental Alport syndrome
- Katz Family Division of Nephrology and Hypertension, Department of Medicine, University of Miami Miller School of Medicine, United States
- Peggy and Harold Katz Family Drug Discovery Center, University of Miami Miller School of Medicine, United States
- Department of Radiation Oncology, University of Miami Miller School of Medicine, United States
- Center for Precision Medicine, School of Medicine, University of Texas Health San Antonio, United States
- Department of Biochemistry and Molecular Biology, University of Miami, United States
Figures
Figure 1 with 2 supplements
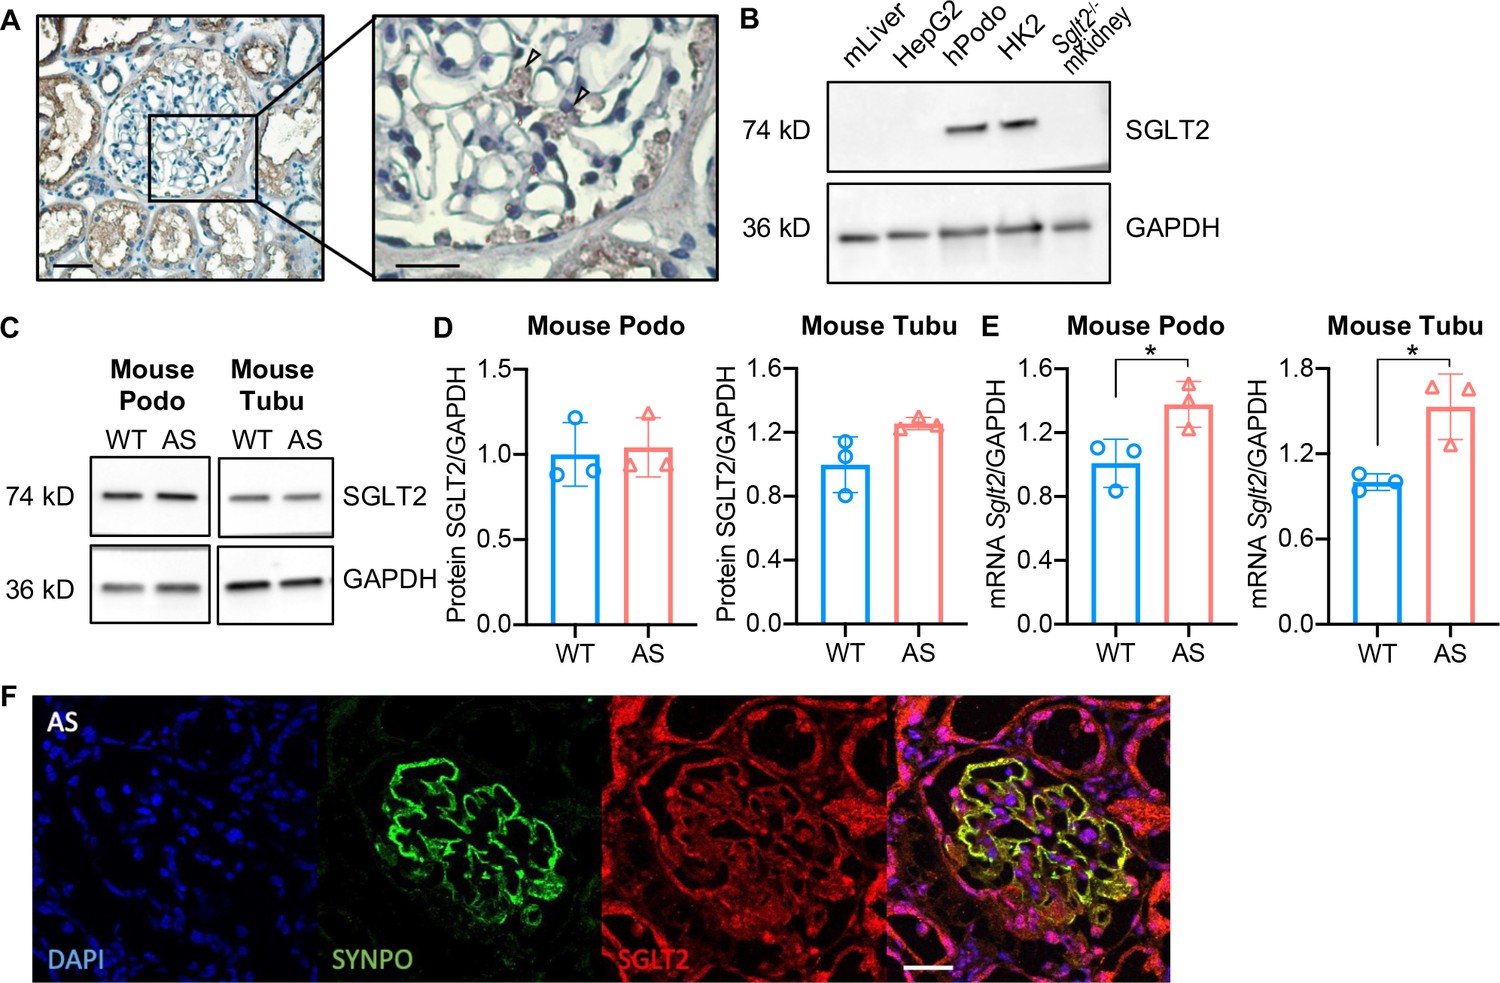
Sodium-glucose cotransporter-2 (SGLT2) protein is expressed in the human kidney cortex and in cultured human and mouse podocytes.
(A) Immunohistochemistry staining of human kidney cortex for SGLT2 (left panel, scale bar: 50 μm; right panel, scale bar: 25 μm). (B) Western blot images demonstrating SGLT2 expression in cultured human podocytes (hPodo). Mouse liver lysate (mLiver), HepG2 liver cancer cells, and kidney lysate from Sglt2-/- mouse (Sglt2-/- mKidney) were used as the negative controls. HK2 proximal tubular cells were used as the positive control. (C,D) Western blot images (C) and quantification (D) demonstrating SGLT2 expression in mouse proximal tubular cells (Tubu) and podocytes (Podo) established from wild-type (WT) and Alport (AS) mice (n=3). (E) Sglt2 mRNA expression in WT and AS podocytes and tubular cells (n=3). (F) Representative confocal images of kidney cortices of AS mice (scale bars: 25 μm) stained with DAPI (blue), Synaptopodin (SYNPO, green) and SGLT2 (red). Yellow represents the co-localization of SYNPO and SGLT2. (D), (E), Two-tailed Student’s t-test. *p<0.5.
-
Figure 1—source data 1
Uncropped western blot images of Figure 1.
- https://cdn.elifesciences.org/articles/83353/elife-83353-fig1-data1-v2.zip
Figure 1—figure supplement 1
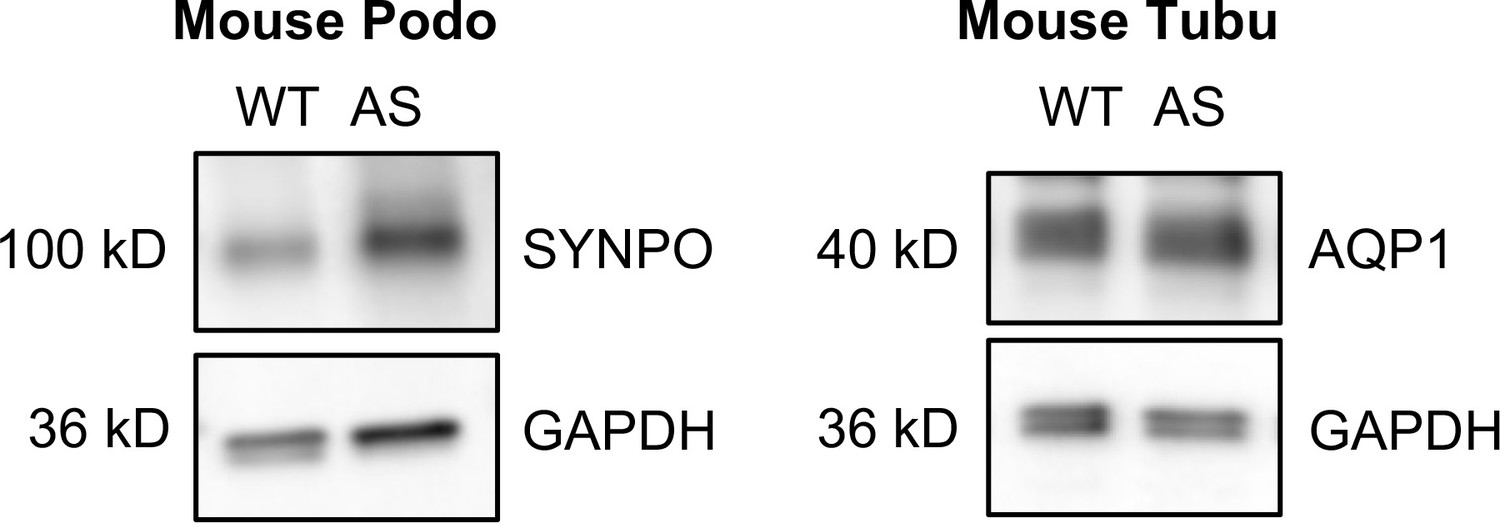
Podocyte-specific marker Synaptopodin (SYNPO) and tubule-specific marker Aquaporin 1 (AQP1) were confirmed in podocyte and tubular cell lines, respectively.
-
Figure 1—figure supplement 1—source data 1
Uncropped western blot images of Figure 1—figure supplement 1.
- https://cdn.elifesciences.org/articles/83353/elife-83353-fig1-figsupp1-data1-v2.zip
Figure 1—figure supplement 2
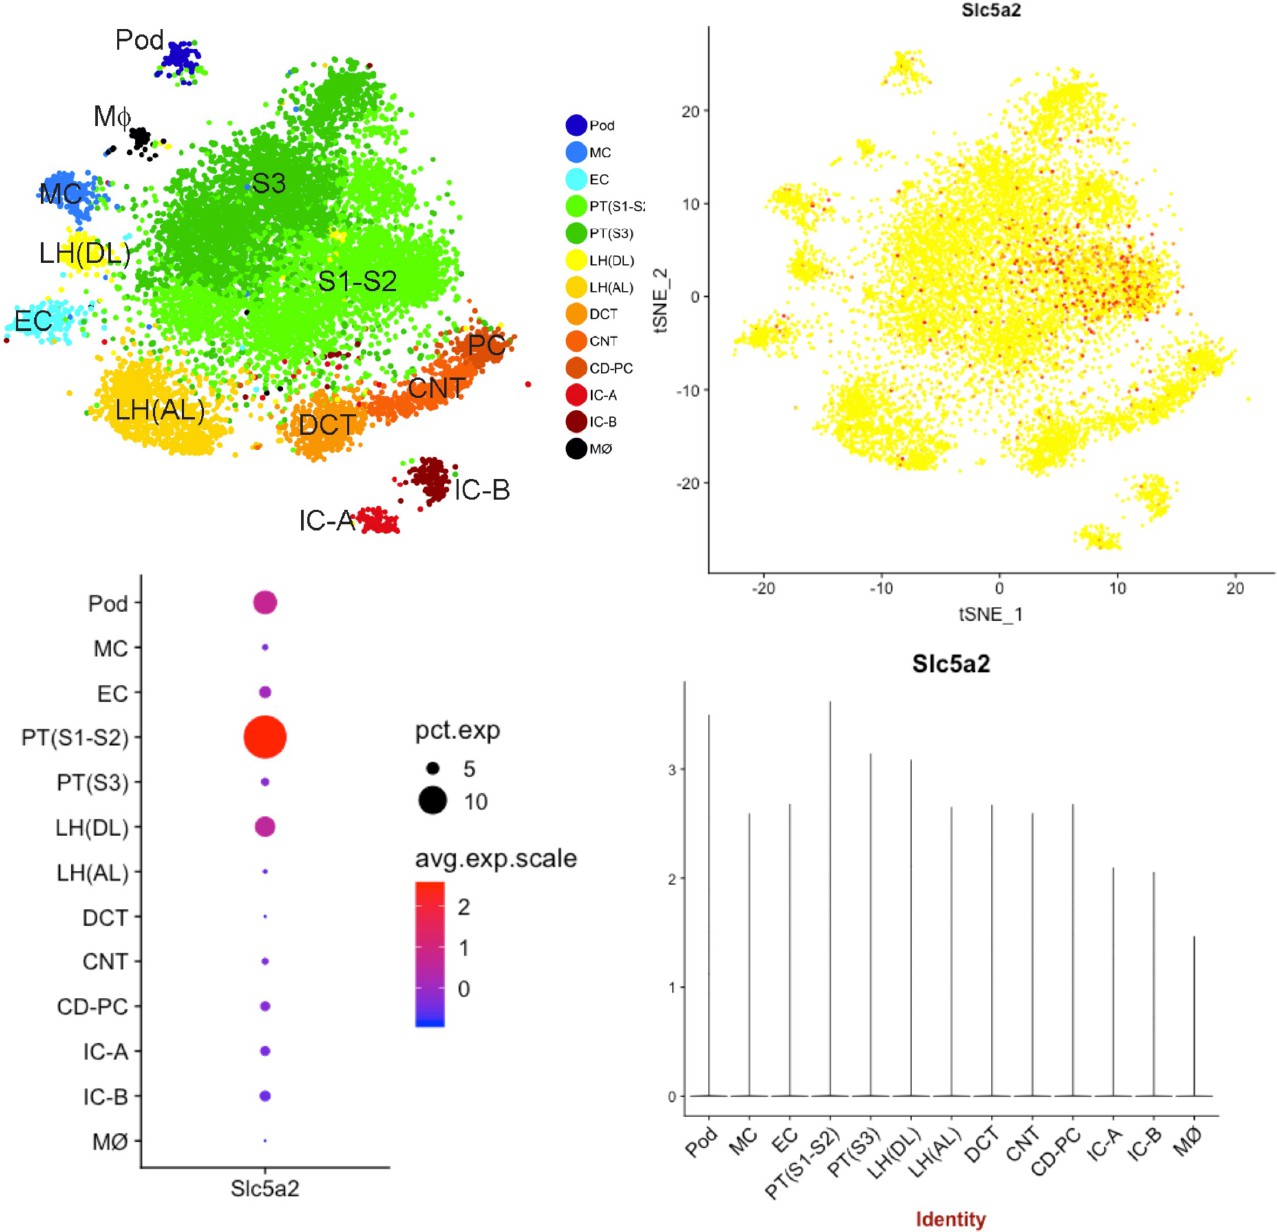
Single-cell transcriptomics indicates the expression of Sglt2 in podocyte.
Pod: podocyte; MC: mesangial cell; EC: endothelial cell; PT: proximal tubule; LH(AL/DL): loop of Henle ascending loop/descending loop; DCT: distal convoluted tubule; CNT: connecting tubule; CD-PC: collecting duct-principal cell; IC-A/B: intercalated cell type A/B; MΦ: macrophage.
Figure 2 with 1 supplement

Treatment of Alport syndrome (AS) podocytes with empagliflozin reduces lipid droplet (LD) accumulation and apoptosis.
(A–D) Immortalized podocytes and tubular cells of wild-type (WT) and AS mice treated with empagliflozin (Empa) or vehicle for 48 hr. (A,C) Bar graph analysis showing cytotoxicity normalized to viability, then compared to WT (n=3). (B,D) Bar graph analysis showing apoptosis normalized to viability, then compared to WT (n=3). (E,F) LD accumulation in tubular cells (E) and podocytes (F) was measured by Nile red staining. Bar graph analysis showing the quantification of the number of LDs per cell (n=3). (G) Correlation analyses between the LD accumulation and apoptosis in podocytes (n=12). (H) Representative images of Nile red staining demonstrate increased LD numbers (Nile red: green) in AS podocytes (Cell mask blue: blue; DAPI: red) compared to WT podocytes, which is reduced by Empa treatment. (A–F), Two-tailed Student’s t-test. (G), Pearson’s correlation coefficient. *p<0.5, **p<0.01.
Figure 2—figure supplement 1
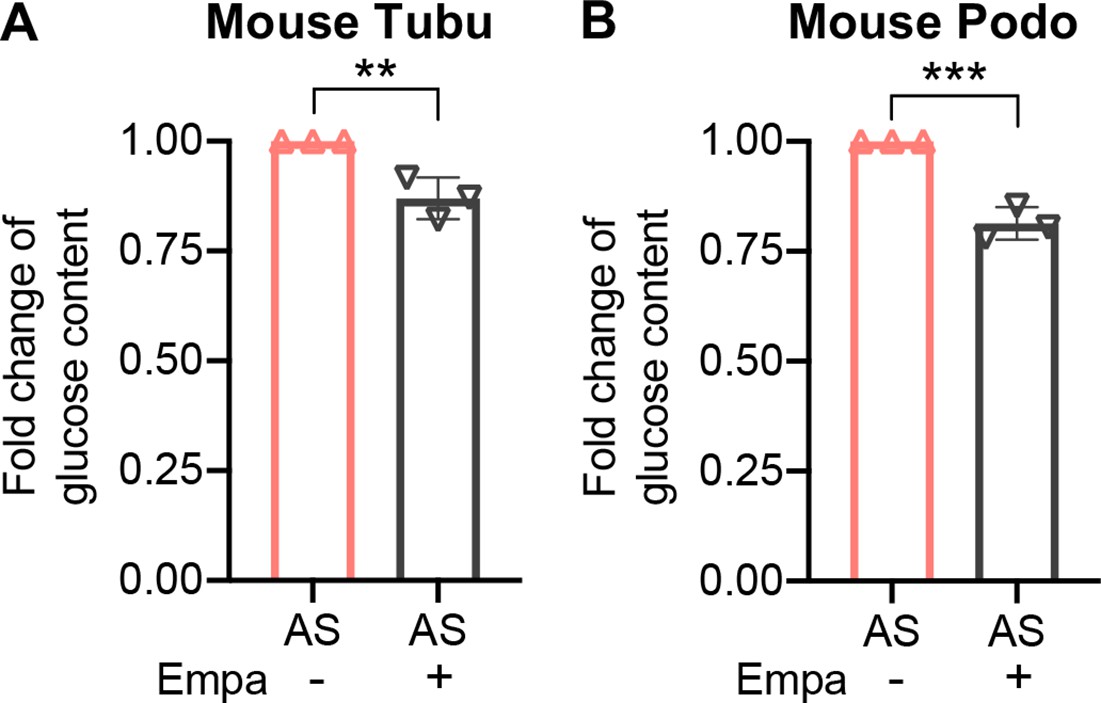
Bar graph analysis of glucose content in Alport syndrome (AS) podocyte with or without empagliflozin (empa) treatment (n=3).
Figure 3 with 1 supplement
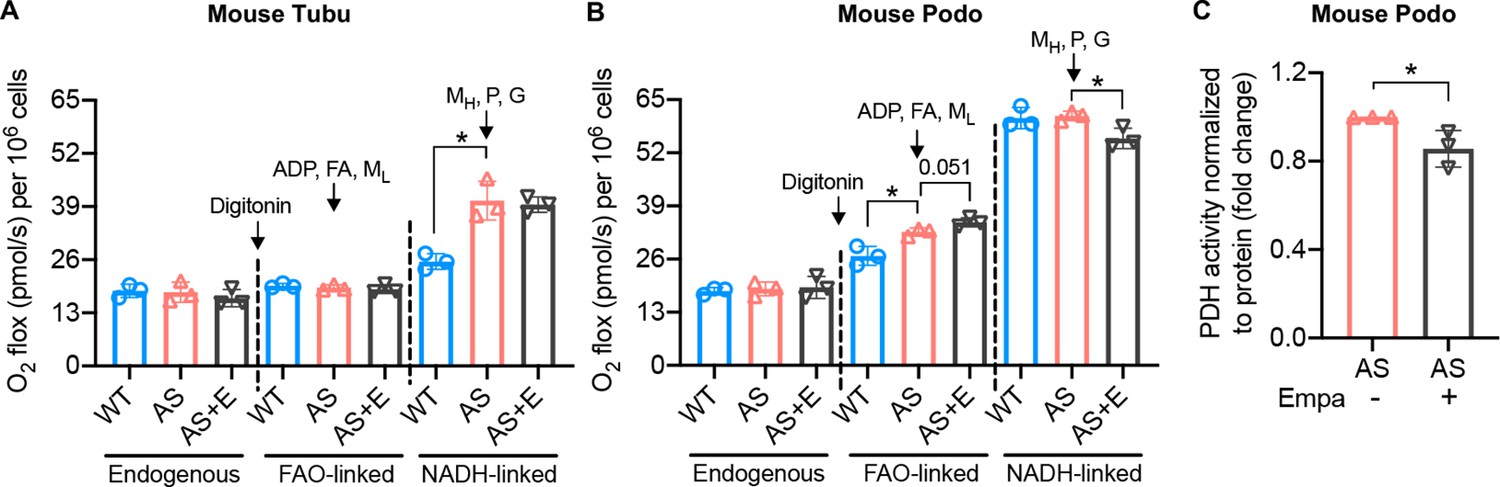
Empagliflozin inhibits the utilization of pyruvate as a metabolic substrate in Alport syndrome (AS) podocytes.
(A, B) Bar graph analysis of endogenous and substrate-driven oxygen consumption rates in wild-type (WT) and Alport (AS) tubular cells (A) and podocytes (B) treated with or without empagliflozin (E) (n=3). The sequential addition of permeabilizing agent and substrates was labeled in the figure. (C) Pyruvate dehydrogenase (PDH) activity was measured by a colorimetric assay in protein extracts from AS podocytes, normalized to protein concentration (n=3). Two-tailed Student’s t-test, *p<0.5. FA: octanoylcarnitine; ML: malate-low concentration; MH: malate-high concentration; P: pyruvate; G: glutamate.
Figure 3—figure supplement 1
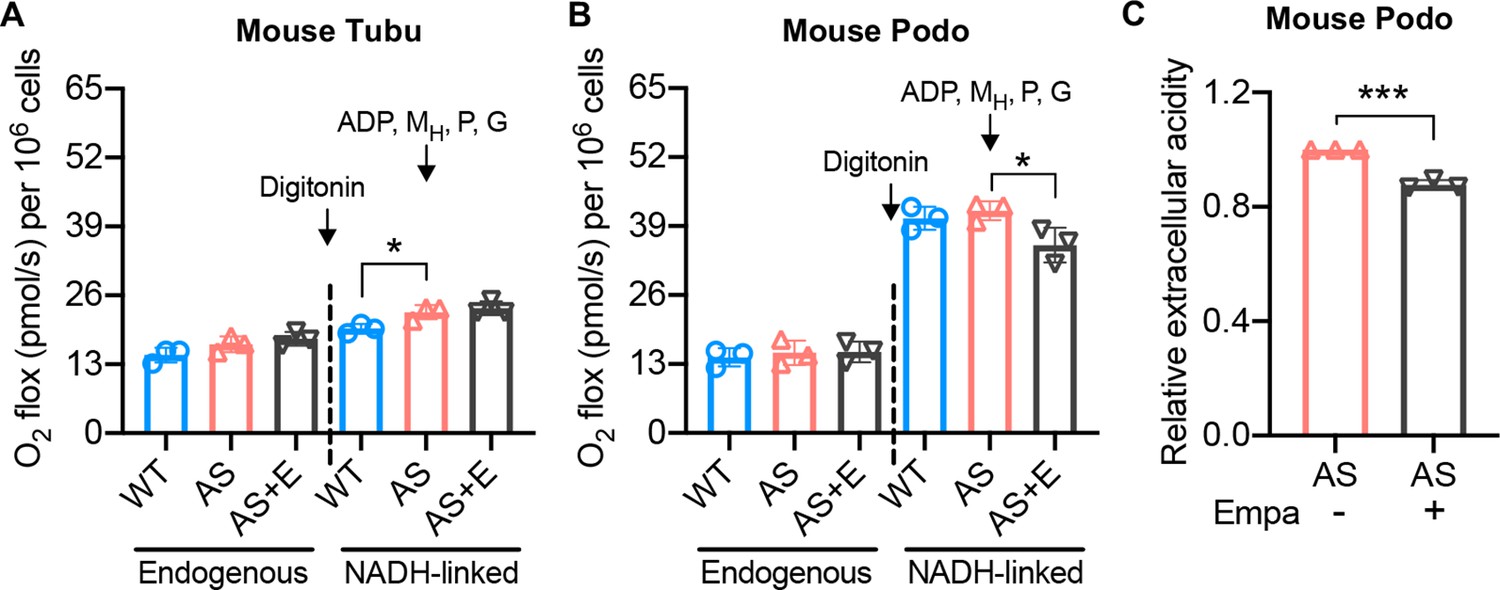
Empagliflozin inhibits NADH-linked oxygen consumption rate in Alport syndrome (AS) podocytes.
(A, B) Bar graph analysis of endogenous and substrate-driven oxygen consumption rates in wild-type (WT) and Alport (AS) tubular cells (A) and podocytes (B) treated with or without empagliflozin (E) (n=3). The sequential addition of permeabilizing agent and substrates was labeled in the figure. (C) Bar graph analysis of the relative rate of extracellular acidification in AS podocyte after empagliflozin treatment (n=3). Two-tailed Student’s t-test, *p<0.5, ***p< 0.001. MH: malate-high concentration; P: pyruvate; G: glutamate.
Figure 4
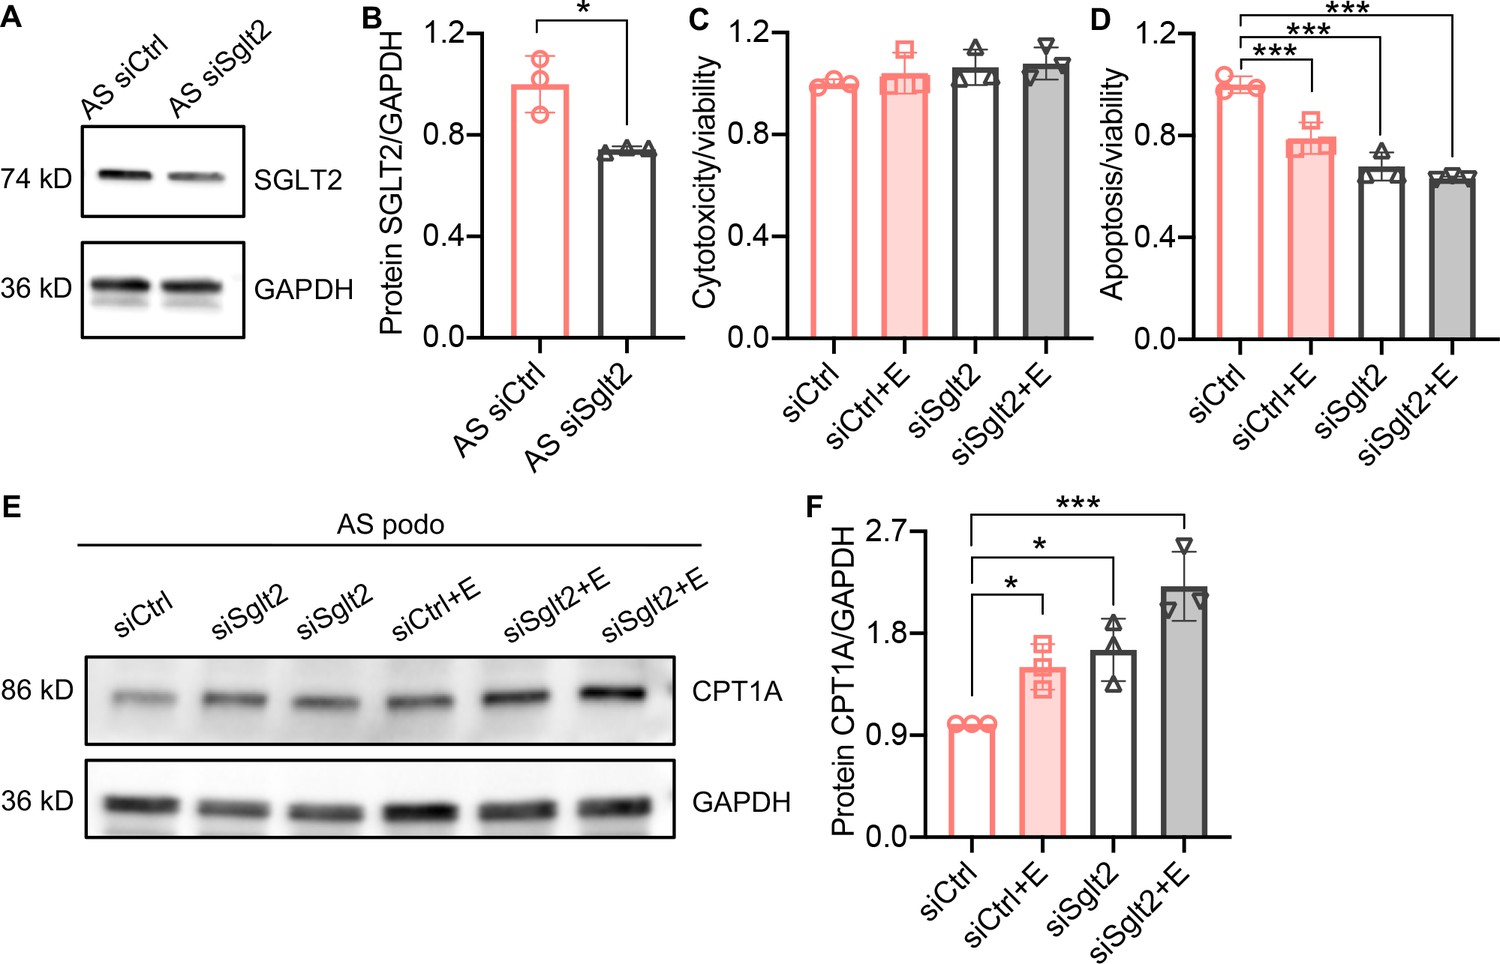
Sglt2 knockdown reduces lipotoxicity in Alport syndrome (AS) podocytes.
(A, B) Western blot images (A) and quantification (B) of Sodium-glucose cotransporter-2 (SGLT2) protein in AS podocytes transfected with Sglt2 siRNA (siSglt2) or nontargeting siRNA (siCtrl) for 72 hr. GAPDH was used as a sample loading control (n=3). (C,D) Bar graph analysis showing cytotoxicity (C) and apoptosis (D) normalized to viability (n=3) in siCtrl and siSGLT2 AS podocytes, with or without the treatment of empagliflozin (E), then compared with siCtrl. (E,F) Western blot images (E) and quantification (F) of CPT1A protein in siCtrl and siSglt2 AS podocytes, with or without the treatment of empagliflozin (n=3). (B), Two-tailed Student’s t-test, (C), (D), (F), One-Way ANOVA followed by Holm-Sidak’s multiple comparisons. *p < 0.05, ***p< 0.001.
-
Figure 4—source data 1
Uncropped western blot images of Figure 4.
- https://cdn.elifesciences.org/articles/83353/elife-83353-fig4-data1-v2.zip
Figure 5
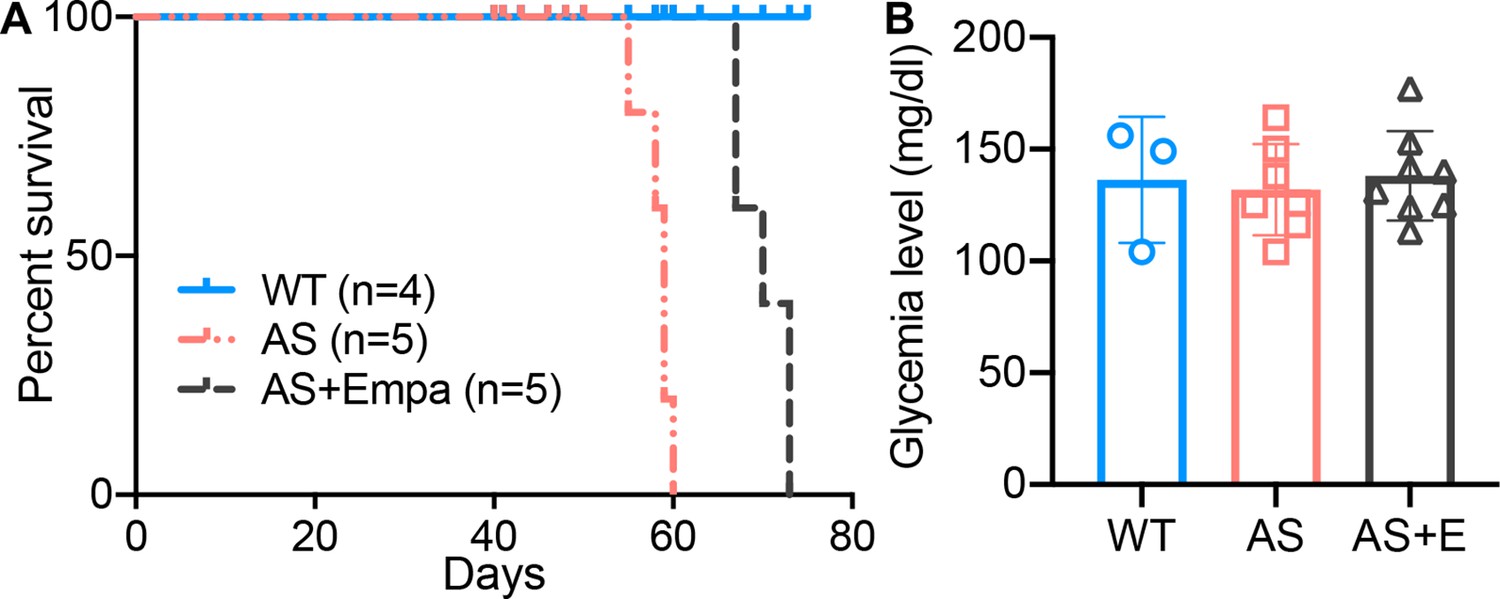
Empa improves the survival of Alport syndrome (AS) mice.
(A) Survival curve (n=4–5) of AS mice fed empagliflozin-supplemented (E) chow versus placebo diet starting at 4 weeks of age, compared to age-matched wild-type (WT) control mice. (B) Glycemia levels of WT and AS mice fed placebo diet and AS mice fed empagliflozin chow (n=3–8). (B), AS vs AS +E: Two-tailed Student’s t-test.
Figure 6
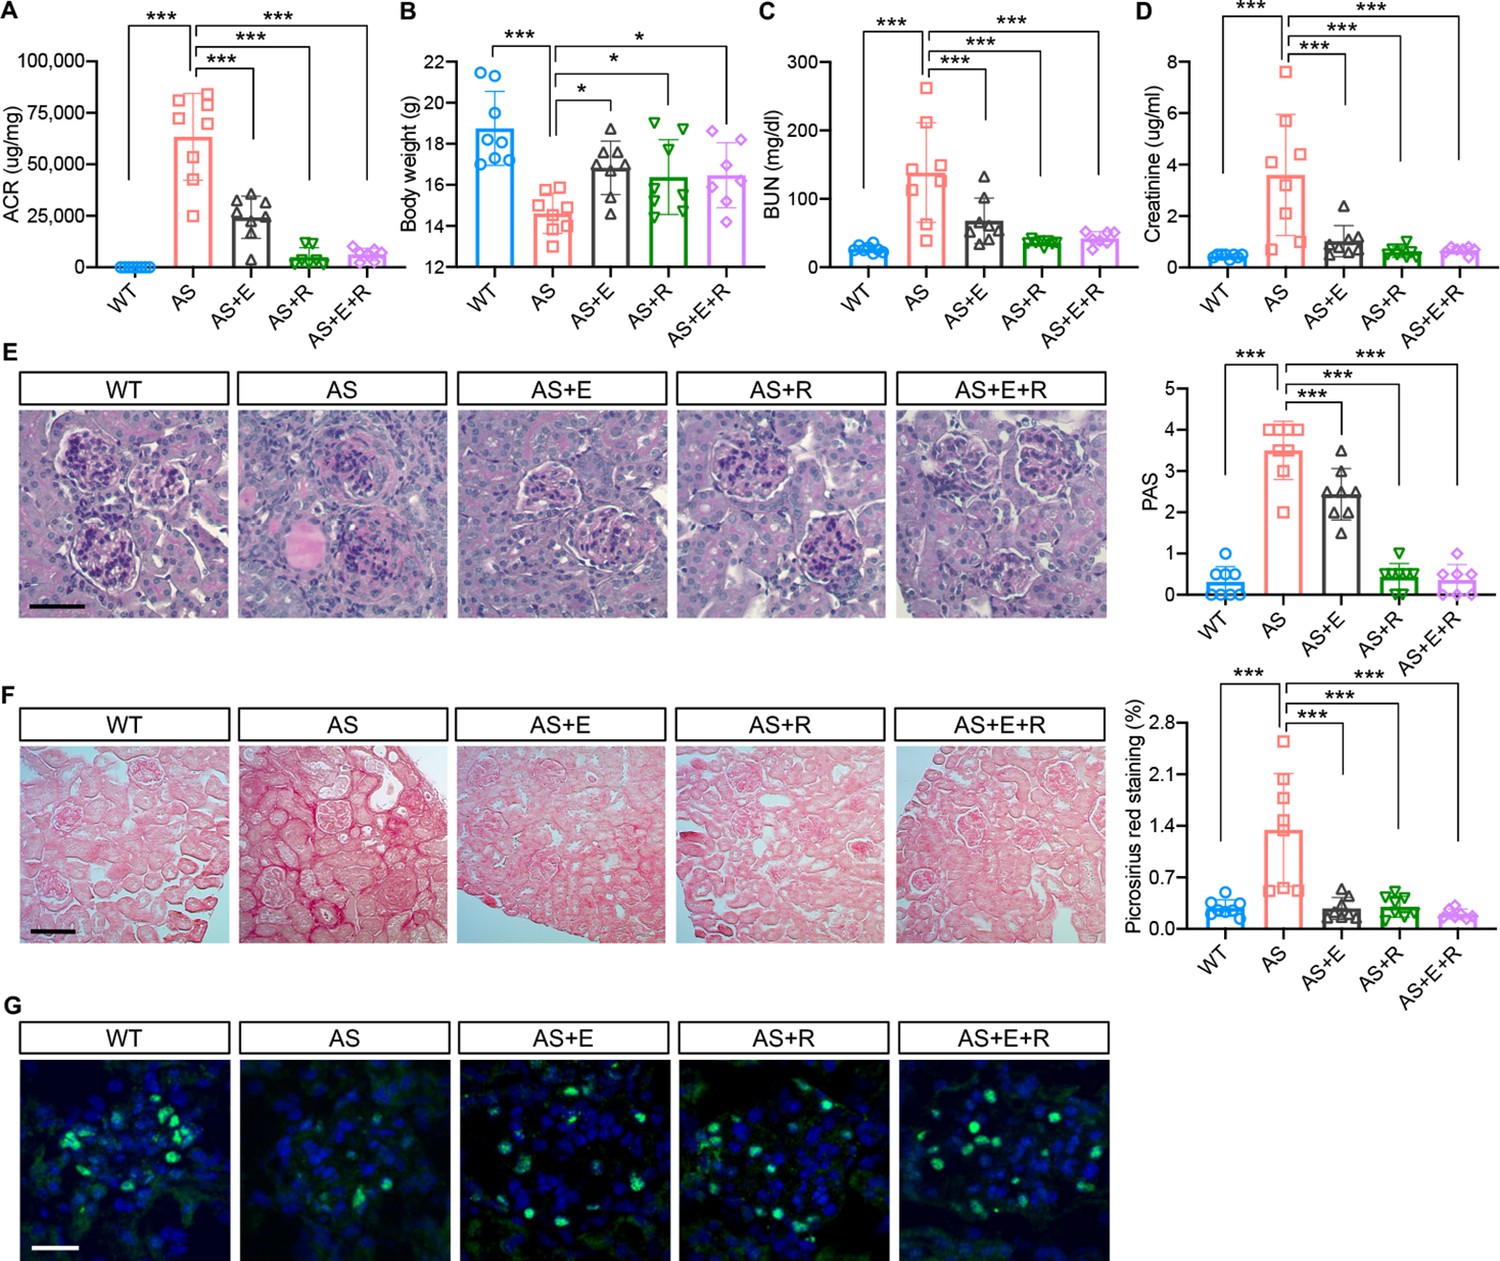
Empagliflozin improves renal function in a mouse model of Alport syndrome.
(A) Urinary albumin-to-creatinine ratio (ACR) in WT and Alport syndrome (AS) mice fed with placebo, empagliflozin (E), ramipril (R), or the combination of empagliflozin and ramipril (E+R). Urines were collected at the time of sacrifice (n = 7–8). (B) Bar graph analysis of body weights of mice from all experimental groups. (C,D) Bar graph analysis of blood urea nitrogen (BUN) (C) and creatinine (D) levels of mice from all experimental groups (n = 7–8). (E) Representative images of Periodic acid-Schiff (PAS) staining and bar graph analysis showing the mesangial expansion score of kidney cortices sections (scale bar: 50 μm; n = 7–8). (F) Representative Picrosirius red staining and bar graph analysis showing the quantification of fibrosis in kidney cortices sections (scale bar: 100 μm; n=7–8). (G) Representative images of kidney cortices stained with WT1 (green) to detect podocytes and DAPI (blue) to reveal nuclei and bar graph quantification of the average number of WT1-positive podocytes per glomerulus (scale bar: 25 μm, n = 7–8). One-Way ANOVA followed by Holm-Sidak’s multiple comparisons. *p < 0.05, **Pp< 0.01, ***p< 0.001.
Figure 7
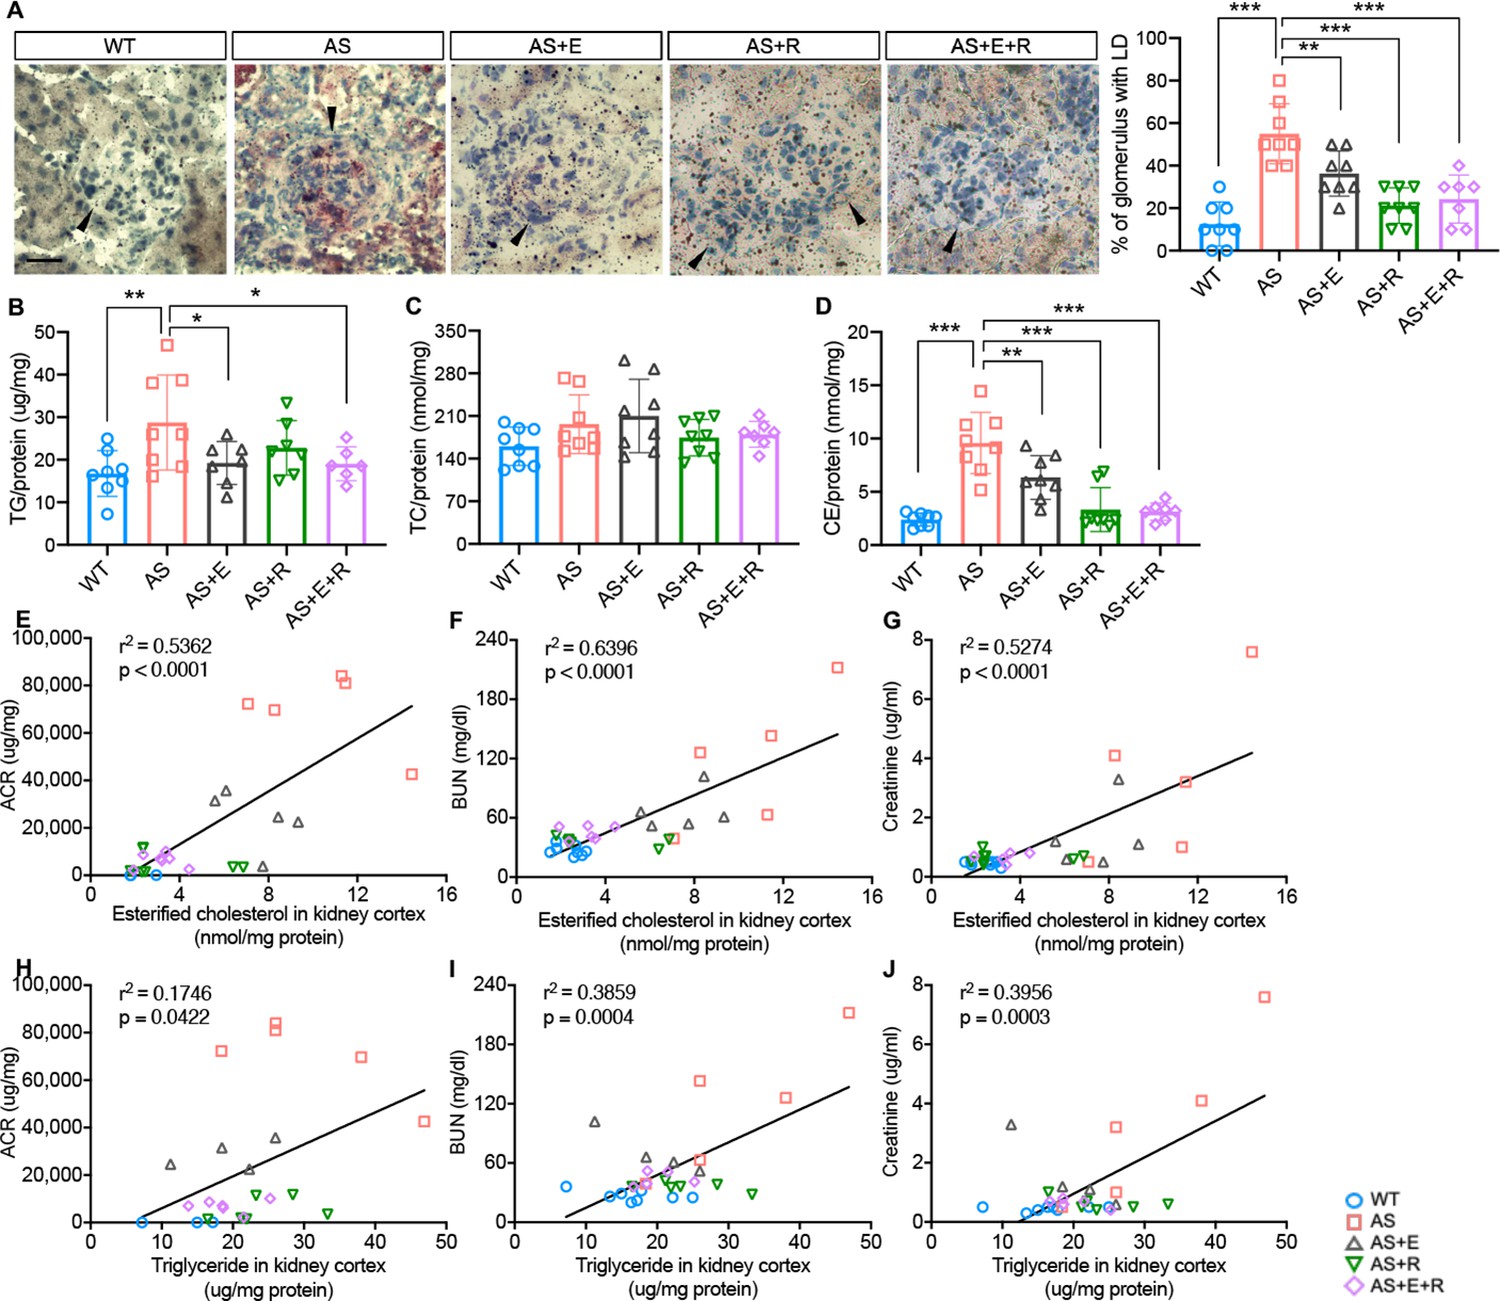
Empagliflozin prevents renal lipid accumulation in experimental Alport syndrome.
(A) Representative Oil Red-O (ORO) images of stained kidney cortices sections (scale bar: 20 μm) and bar graph quantification of the number of glomeruli with lipid droplets (LD) in ORO-stained slides (n = 7–8). (B–D) Bar graph analysis of triglyceride TG, (B), total cholesterol TC, (C), and cholesterol ester CE, (D) contents in kidney cortices. Values are normalized to protein concentrations (n = 6–8). (E–G) Correlation analyses between the CE content of kidney cortices and albumin-to-creatinine ratio (ACR), blood urea nitrogen (BUN), or creatinine (n = 27, 31, 31). (H–J) Correlation analyses between the TG content of kidney cortices and ACR, BUN, or creatinine (n = 29, 29, 29). (A–D), One-Way ANOVA followed by Holm-Sidak’s multiple comparisons. (E–J), Pearson’s correlation coefficient. *p< 0.05, **p< 0.01, ***p< 0.001.
Tables
Key resources table
| Reagent type (species) or resource | Designation | Source or reference | Identifiers | Additional information |
|---|---|---|---|---|
| Cell line (M. musculus) | immortalized podocytes | This paper; PMID:33340991 | Cell line established and maintained in Fornoni lab | |
| Cell line (M. musculus) | immortalized tubular cells | This paper | Cell line established and maintained in Fornoni lab | |
| Genetic reagent (M. musculus) | CBA/CaxC57BL/10-H-2Kb-tsA58 | Charles River; (PMID:1711218) | ||
| Genetic reagent (M. musculus) | 129-Col4a3tm1Dec/J | Jackson Laboratory | Strain# 002908 RRID:IMSR_JAX:002908 | |
| Antibody | anti-WT1 (rabbit polyclonal) | Santa Cruz Biotechnology | Cat# sc-192 RRID:AB_632611 | 1:300 (IF) |
| Antibody | anti-SGLT2 (mouse monoclonal) | Santa Cruz Biotechnology | Cat# sc-21537 RRID:AB_2814658 | 1:100 (IHC) 1:500 (WB) |
| Antibody | anti-SGLT2 (rabbit polyclonal) | BiCell scientific | Cat# 20802 RRID:AB_2935905 | 1:100 (IF) |
| Antibody | anti-SYNAPTOPODIN (goat polyclonal) | Santa Cruz Biotechnology | Cat# sc-21537 RRID:AB_2201166 | 1:300 (IF) 1:1,000 (WB) |
| Antibody | anti-AQP1 (rabbit polyclonal) | Proteintech | Cat# 20333–1-AP RRID:AB_10666159 | 1:2,000 (WB) |
| Antibody | anti-CPT1A (mouse monoclonal) | Abcam | Cat# ab128568 RRID:AB_11141632 | 1:1,000 (WB) |
| Antibody | anti-GAPDH (mouse monoclonal) | Sigma-Aldrich | Cat# CB1001 RRID:AB_2107426 | 1:10,000 (WB) |
| Sequence-based reagent | Sglt2_F | This paper | PCR primers | ATGGAGCAACACGTAGAGGC |
| Sequence-based reagent | Sglt2_R | This paper | PCR primers | ATGACCAGCAGGAAATAGGCA |
| Sequence-based reagent | Gapdh_F | This paper | PCR primers | CCTGGAGAAACCTGCCAAGTATG |
| Sequence-based reagent | Gapdh_R | This paper | PCR primers | GGTCCTCAGTGTAGCCCAAGATG |
| Sequence-based reagent | siRNA: Sglt2 | Santa Cruz Biotechnology | Cat# sc-61540 | 20 nM |
| Sequence-based reagent | siRNA: nontargetin control | Thermo Scientific | Cat# 4390843 | 20 nM |
| Commercial kit | ApoTox-Glo Triplex assay | Promega | Cat# G6320 | |
| Commercial kit | Amplex Red Cholesterol Assay | Thermo Scientific | Cat# A12216 | |
| Commercial kit | Triglyceride Colorimetric Assay | Cayman | Cat# 10010303 | |
| Chemical compound, drug | Empagliflozin (BI 10773) | Selleckchem | Cat# S8022 | 500 nM |
| Software, algorithm | Graphpad Prism | Graphpad software | SCR_002798 |
Additional files
-
MDAR checklist
- https://cdn.elifesciences.org/articles/83353/elife-83353-mdarchecklist1-v2.pdf
-
Source data 1
Full blot images of all western blots.
- https://cdn.elifesciences.org/articles/83353/elife-83353-data1-v2.pdf
Download links
A two-part list of links to download the article, or parts of the article, in various formats.
Downloads (link to download the article as PDF)
Open citations (links to open the citations from this article in various online reference manager services)
Cite this article (links to download the citations from this article in formats compatible with various reference manager tools)
Empagliflozin reduces podocyte lipotoxicity in experimental Alport syndrome
eLife 12:e83353.
https://doi.org/10.7554/eLife.83353


