Reassessment of weak parent-of-origin expression bias shows it rarely exists outside of known imprinted regions
- Department of Genetics, University of Cambridge, United Kingdom
Figures
Figure 1

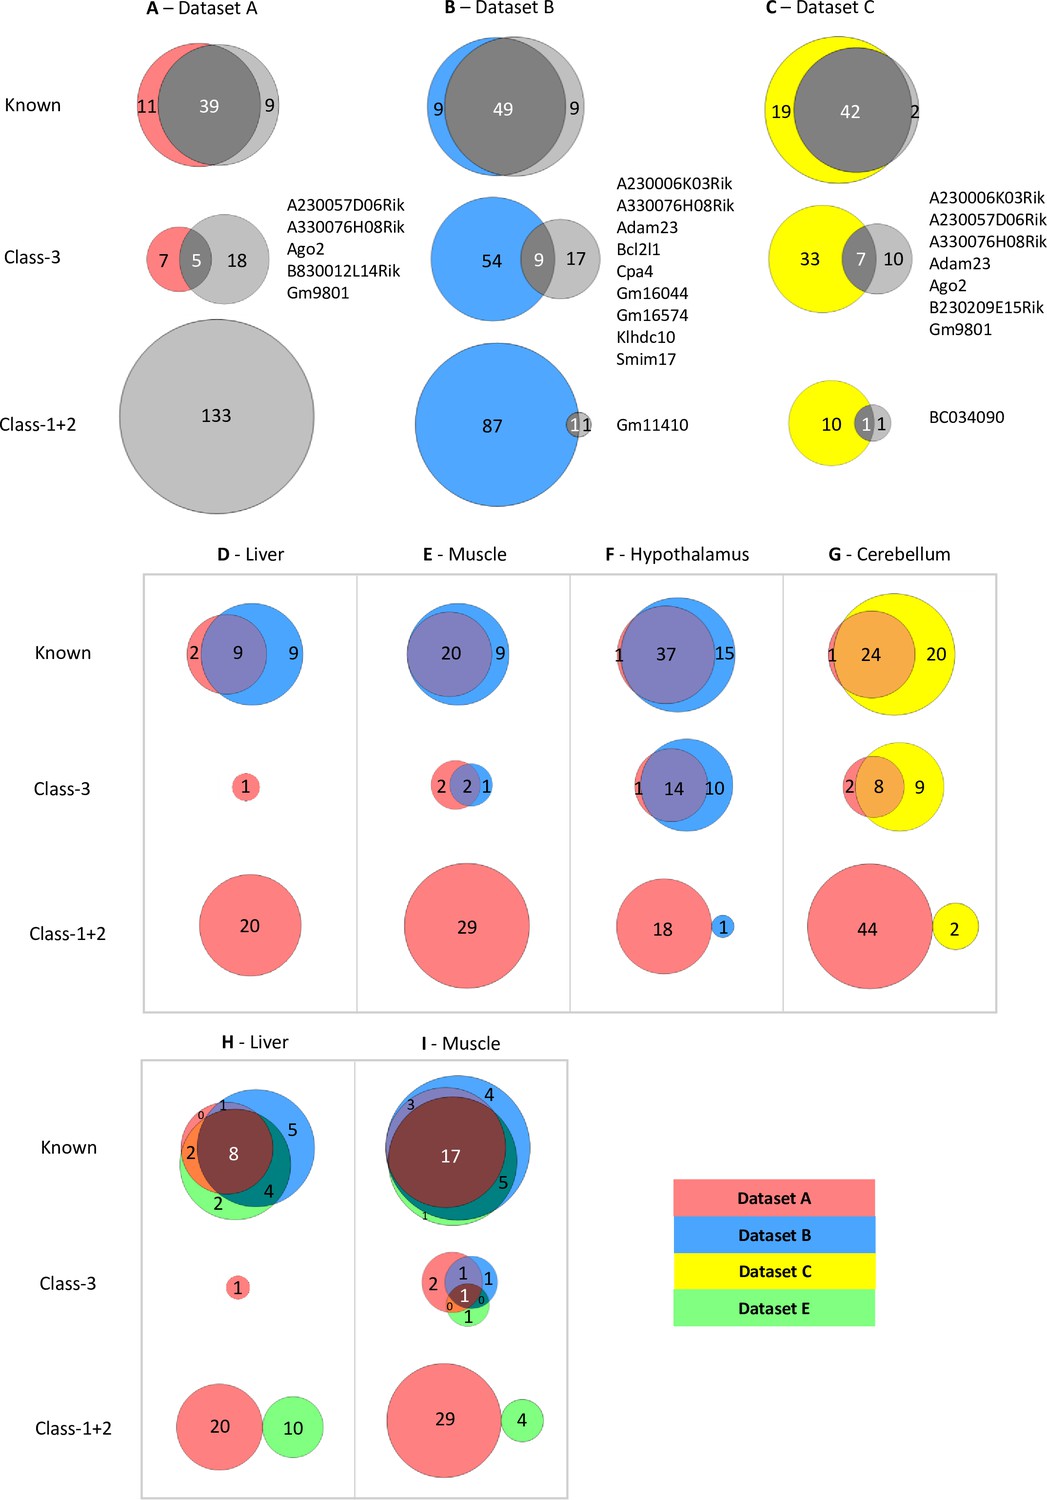
limited overlap between novel genes identified in the four studies.
(A–B) Euler diagrams showing the overlap of (A) - known imprinted genes and (B) – novel biased genes between the four studies. (C) – overlaps between different classes of novel genes. Class-1 = novel singletons >1 Mb from another gene identified in any of the studies. Class-2 = novel clusters where two or more novel genes are within 1 Mb of each other but over 1 Mb from a known imprinted gene. Class-3=novel genes are within 1 Mb of a known imprinted gene. (D) - proportion of known and novel genes by number of studies they were identified in. (E–F) Venn diagrams showing tissue-specific overlaps in E - known imprinted genes and F – novel biased genes.
Figure 2 with 2 supplements
Limited overlap between novel genes called by different analysis pipelines.
(A–C) Venn diagrams showing the overlap between allelic biased genes called by our pipeline with the ISoLDE package (gray circles) versus the original studies. A – Dataset A, B - Dataset B, C - Dataset C. Overlapping novel genes are listed to the right. Dataset A only genes called in the hypothalamus, cerebellum, liver, muscle, and whole adult brain were analyzed. (D–G) Venn diagrams showing the overlap between allelic biased genes called by our pipeline from sequence data generated from the same tissue by different studies: liver (D), muscle (E), hypothalamus (F) from Dataset A and Dataset B and cerebellum (G) from Dataset A and Dataset C. (H–I) Venn diagrams of three-way overlap between allelic biased genes called by our pipeline from sequence data from the liver (H) and muscle (I) generated by Dataset A, Dataset B, and Dataset E.
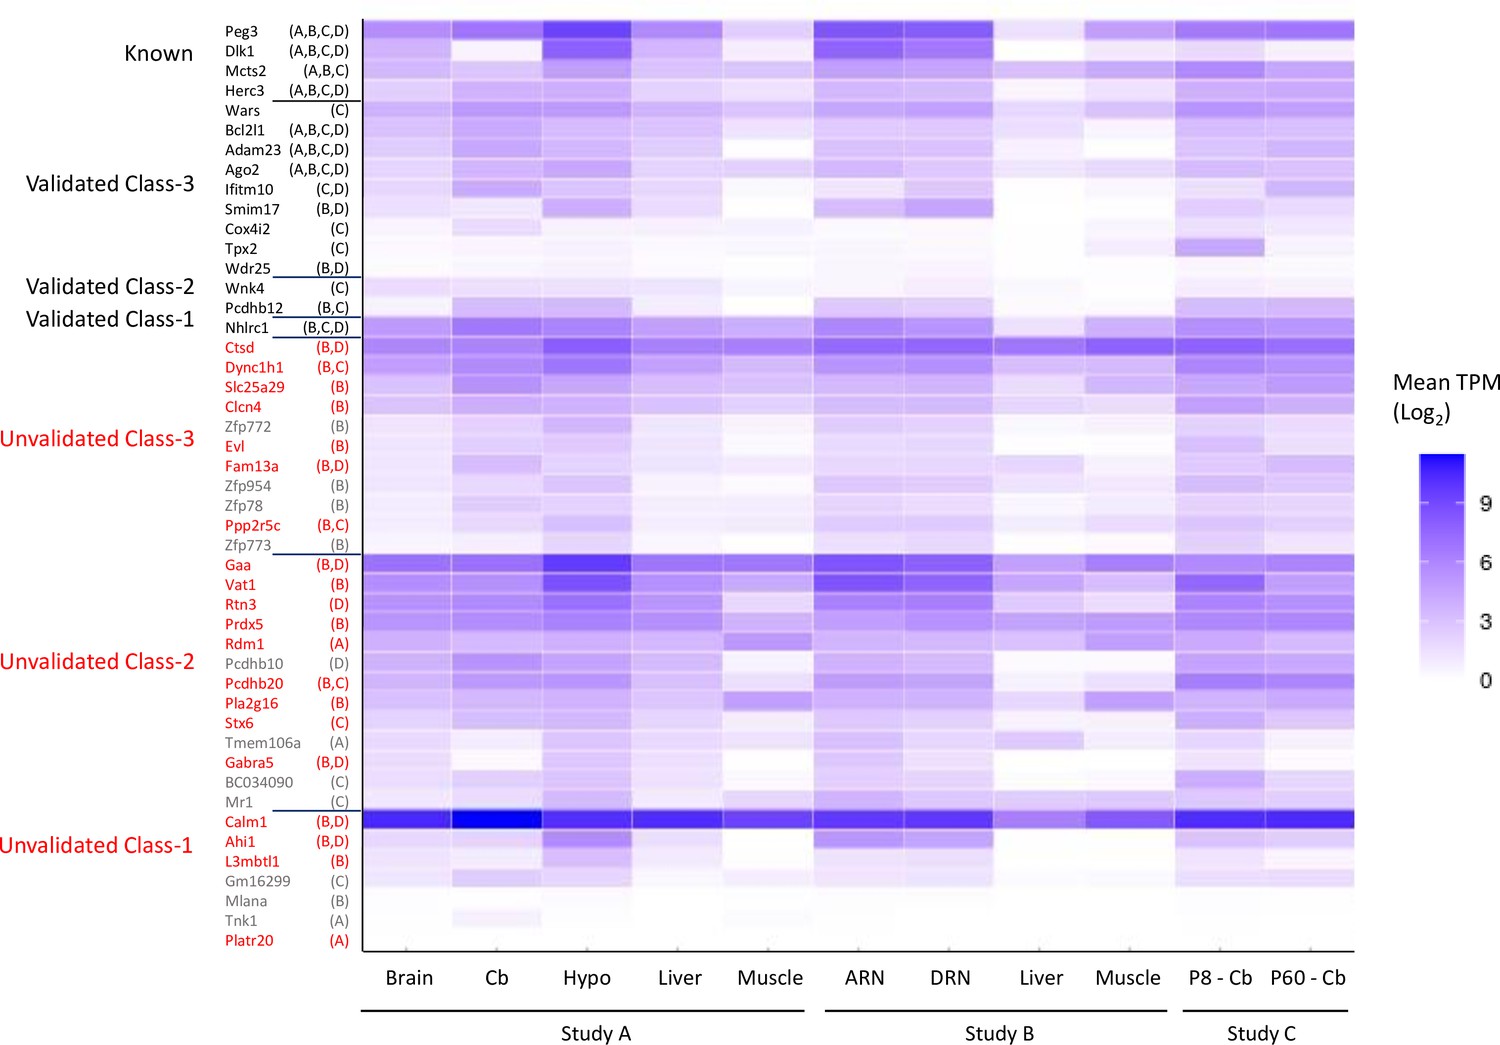
Figure 2—figure supplement 1
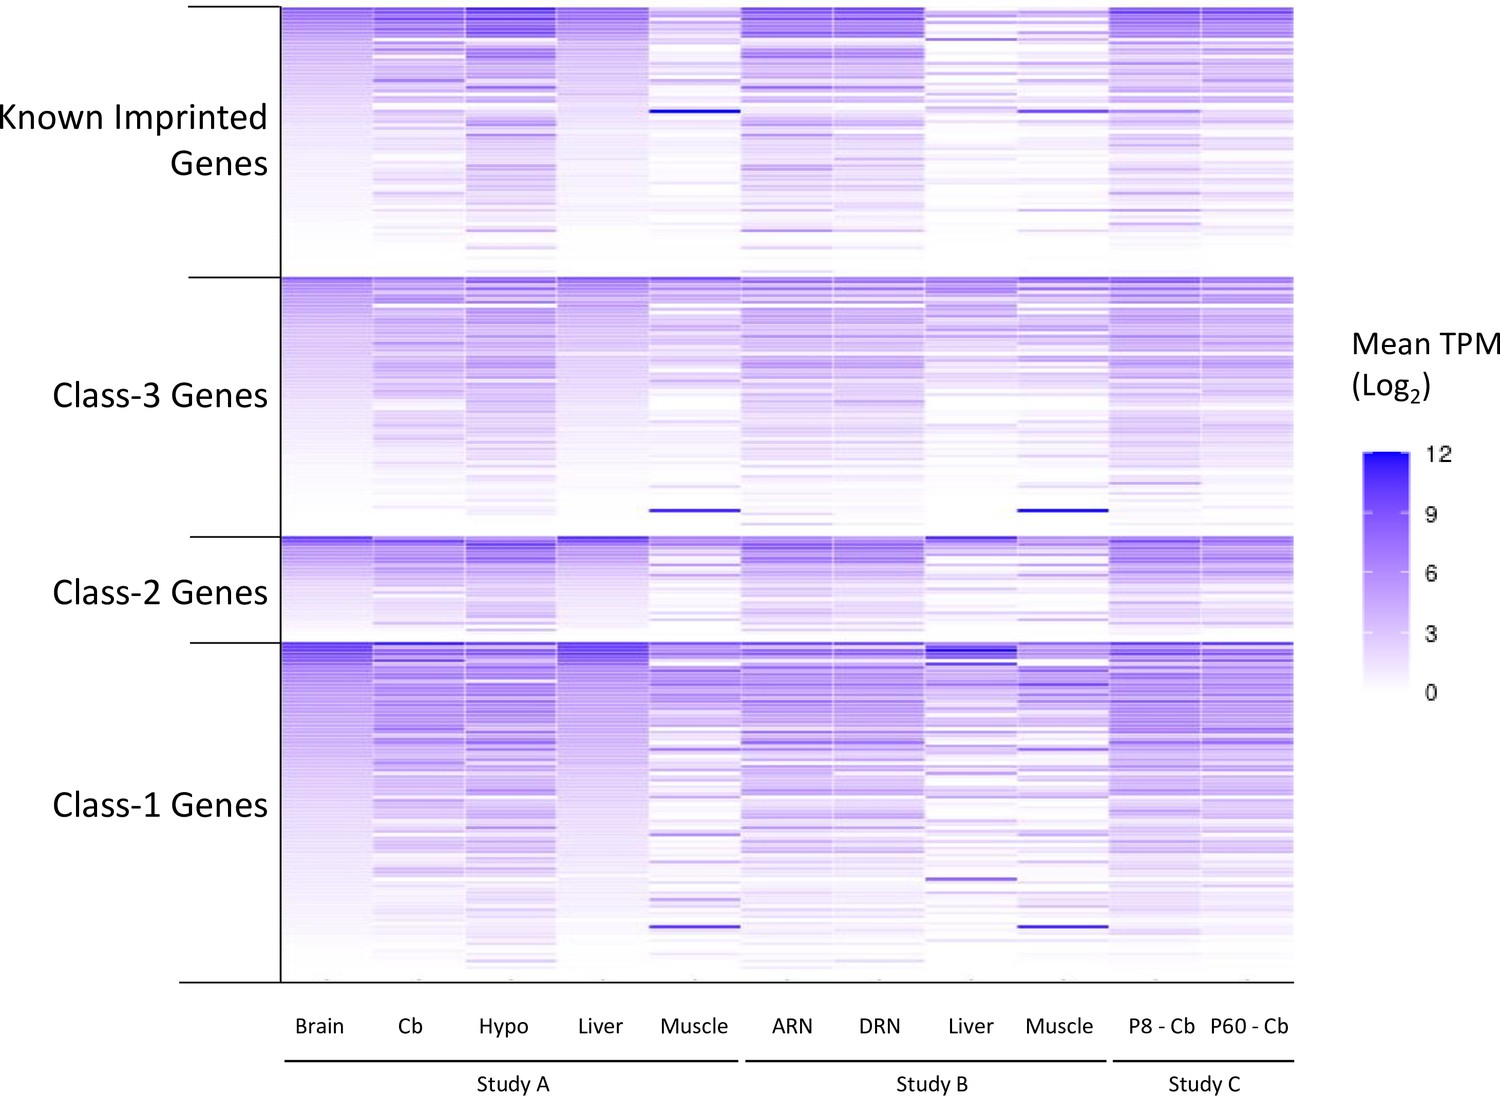
Expression levels of genes called as biased in at least one of the original studies.
Data generated from re-analysis of original RNA-seq datasets. To allow for comparison across the different datasets, expression levels are reported as mean TPM (transcripts per million) from all biological replicates. Source data is in Supplementary file 1f. Samples: Dataset A - whole adult brain, cerebellum (cb) hypothalamus (hypo) liver, muscle. Dataset B - arcuate nucleus (ARN), dorsal raphe nucleus (DRN), liver, and muscle. Dataset C - P8 and P60 cerebellum.
Figure 2—figure supplement 2
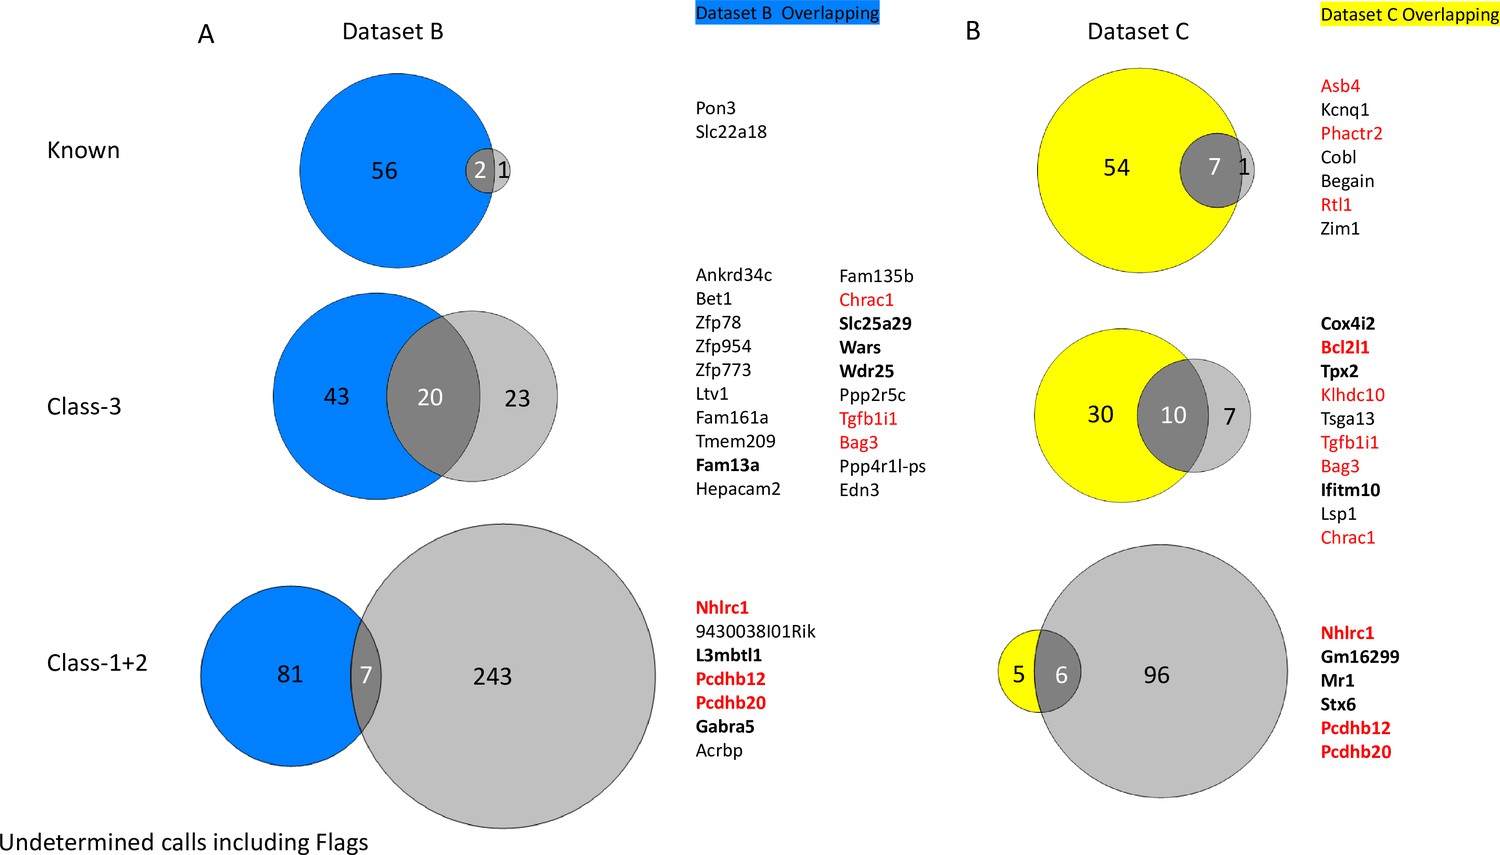
Overlapping underdetermined genes called between Dataset B (A) and Dataset C (B) and ISoLDE pipeline.
Number of ISoLDE called genes are in pale gray, and overlaps with original study are in dark gray. Overlapping genes are listed to the right. Genes in red were flagged by ISoLDE and genes in bold were validated by pyrosequencing.
Figure 3
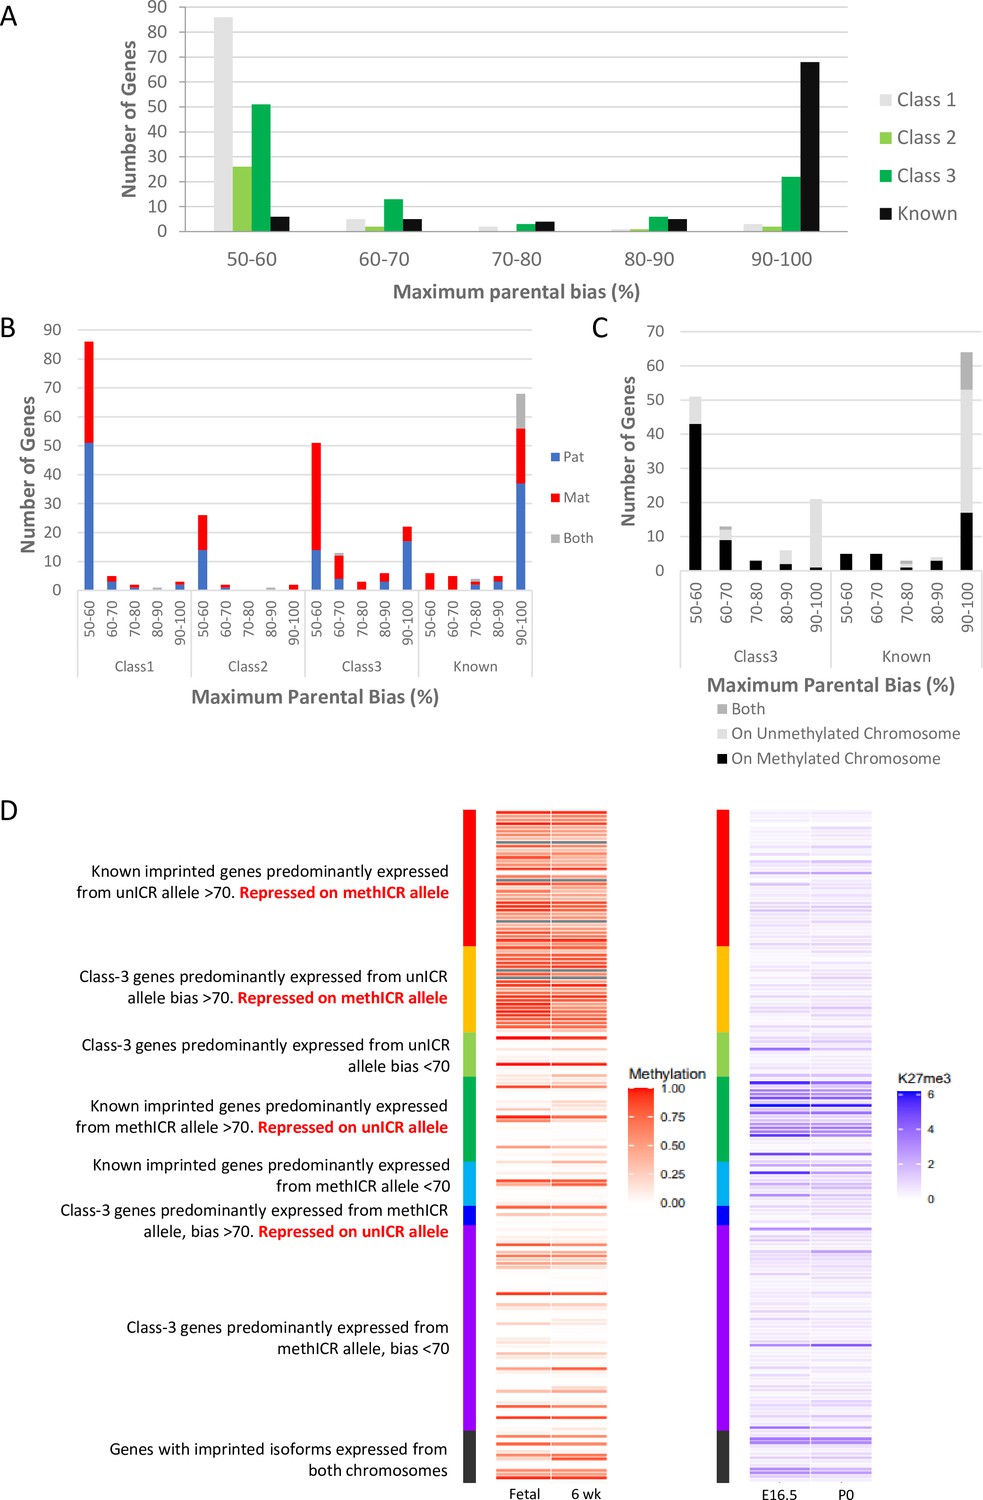
Weakly biased Class-3 genes are preferentially expressed from the chromosome carrying the germline methylation mark.
(A) Distribution of biased genes by maximum reported bias. Class-1 = novel singletons >1 Mb from another gene identified in any of the studies. Class-2 = novel clusters where two or more novel genes within 1 Mb of each other but over 1 Mb from a known imprinted gene. Class-3 = novel genes are within 1 Mb of a known imprinted gene. (B) – Distribution of biased genes by preferential parental chromosome and maximum reported bias. Genes preferentially expressed from the maternal chromosome are shown in red, paternal chromosome in blue, and preferentially expressed from both chromosomes in a tissue-specific manner in gray. (C) - Distribution of known and Class-3 genes by the methylation status of the imprinting control region (ICR) on the preferentially expressed allele. Genes preferentially expressed from the Meth-ICR chromosome are shown in black, Un-ICR chromosome in pale-gray, and preferentially expressed from both chromosomes in a tissue-specific manner in dark-gray. (D) – Heap maps of DNA methylation (fetal and six week male frontal cortex Shen et al., 2012; Sloan et al., 2016) and Histone H3 lysine 27 trimethylation (E16 and P0 forebrain Gorkin et al., 2017; Shen et al., 2012) over the promoters of known and Class-3 novel genes. Promoters are defined as 500 bp upstream of the transcription factor binding site. Genes are sorted by maximum reported bias and methylation status of the ICR on the preferentially expressed allele. Source data for the figure can be found in Supplementary file 1h.
Figure 4
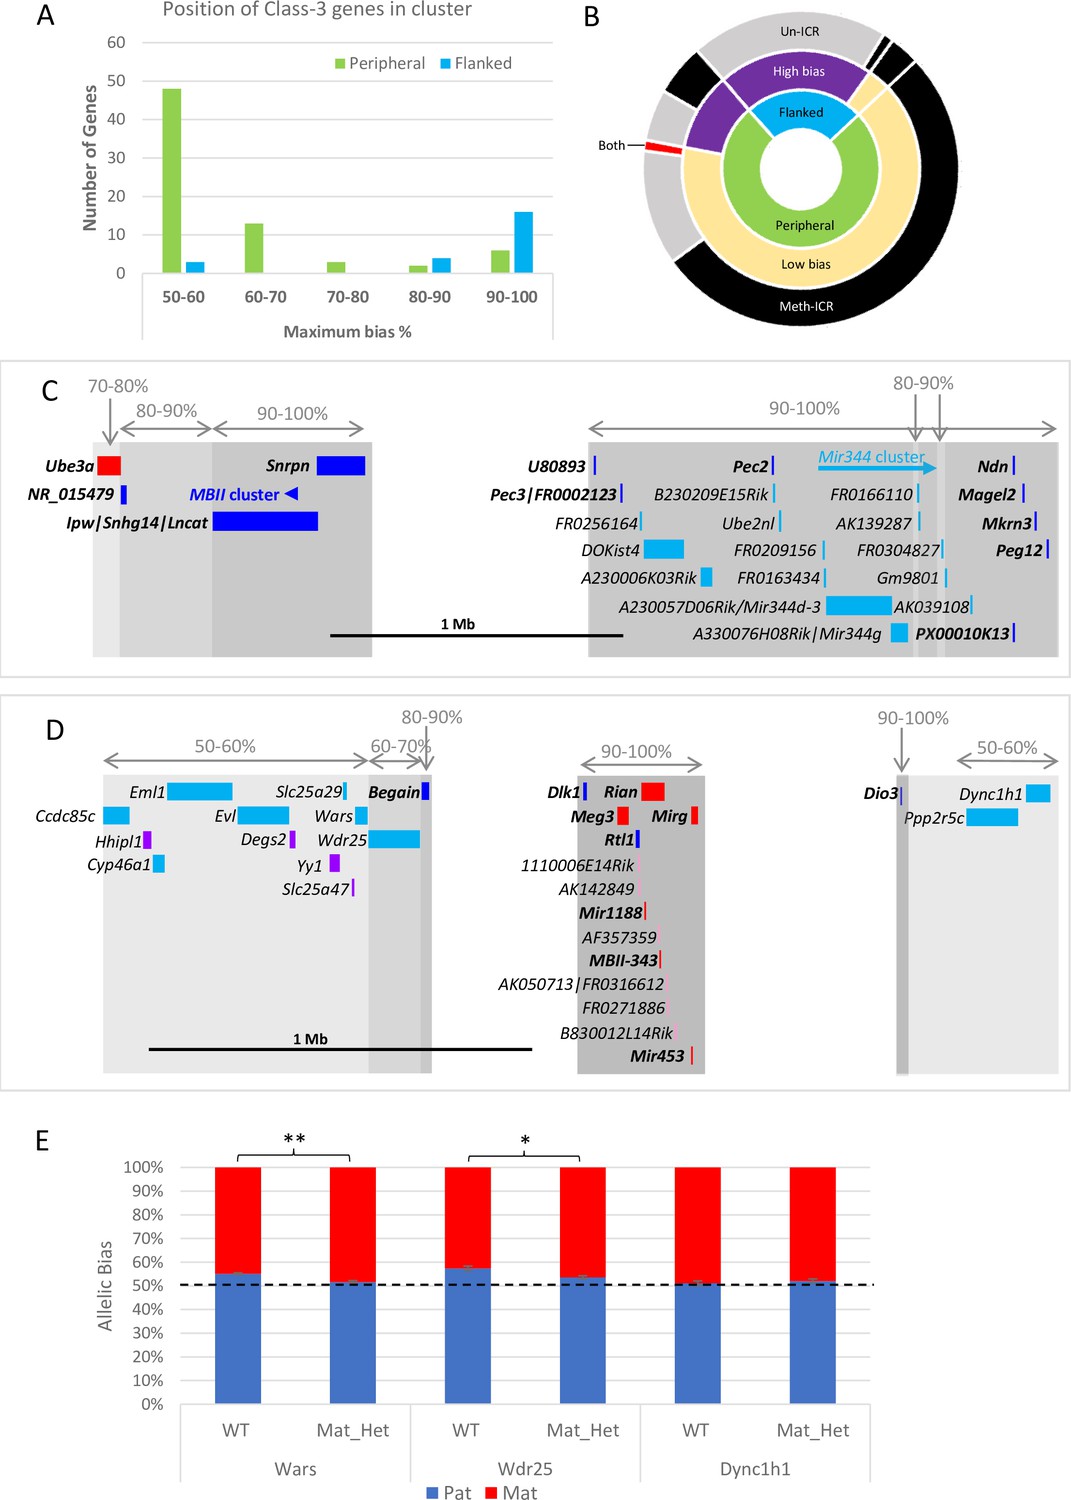
Weakly biased Class-3 genes are located at the periphery of known imprinted domains.
(A) – Distribution of Class-3 biased genes in relation to known imprinted genes. Genes flanked by known imprinted genes are shown in turquoise and those peripheral to known imprinted genes are shown in green.(B) – Sunburst graph of a relationship between position in cluster, the extent of bias, and ICR methylation in Class-3 genes. Low bias = <70% expression from preferential chromosome, high bias = >70% expression from the preferential chromosome. Preferential expression from the methylated imprinting control region (ICR) chromosome is shown in black, preferential expression from the unmethylated ICR chromosome is shown in gray, and genes reported as being biased on both chromosomes depending on tissue or study are shown in red. (C and D) – Schematics of the Snrpn (C) and Dlk1 (D) regions. Highly biased novel genes (80–100%) are located between known imprinted transcripts whereas low-biased genes (50–70%) are located at the periphery. Red boxes = known maternally expressed genes. Blue boxes = known paternally expressed genes. Pink boxes = novel maternally biased genes called by original studies. Turquoise boxes = novel paternally biased genes called by original studies. Blue arrow = cluster of imprinted MBII snoRNAs. Turquoise arrow Mir344 cluster. (E) – Allele-specific expression analysis in peripheral genes in the Dlk1 region in IG-DMR knockout mice. Female mice, heterozygous for IG-DMR knockout were crossed with male CastEiJ mice, and expression was assessed by pyrosequencing. Wildtype (n=5) and maternal heterozygote (n=6) expression biases were compared using an unpaired t-test ** p <0.01 * p < 0.5.
Figure 5 with 3 supplements
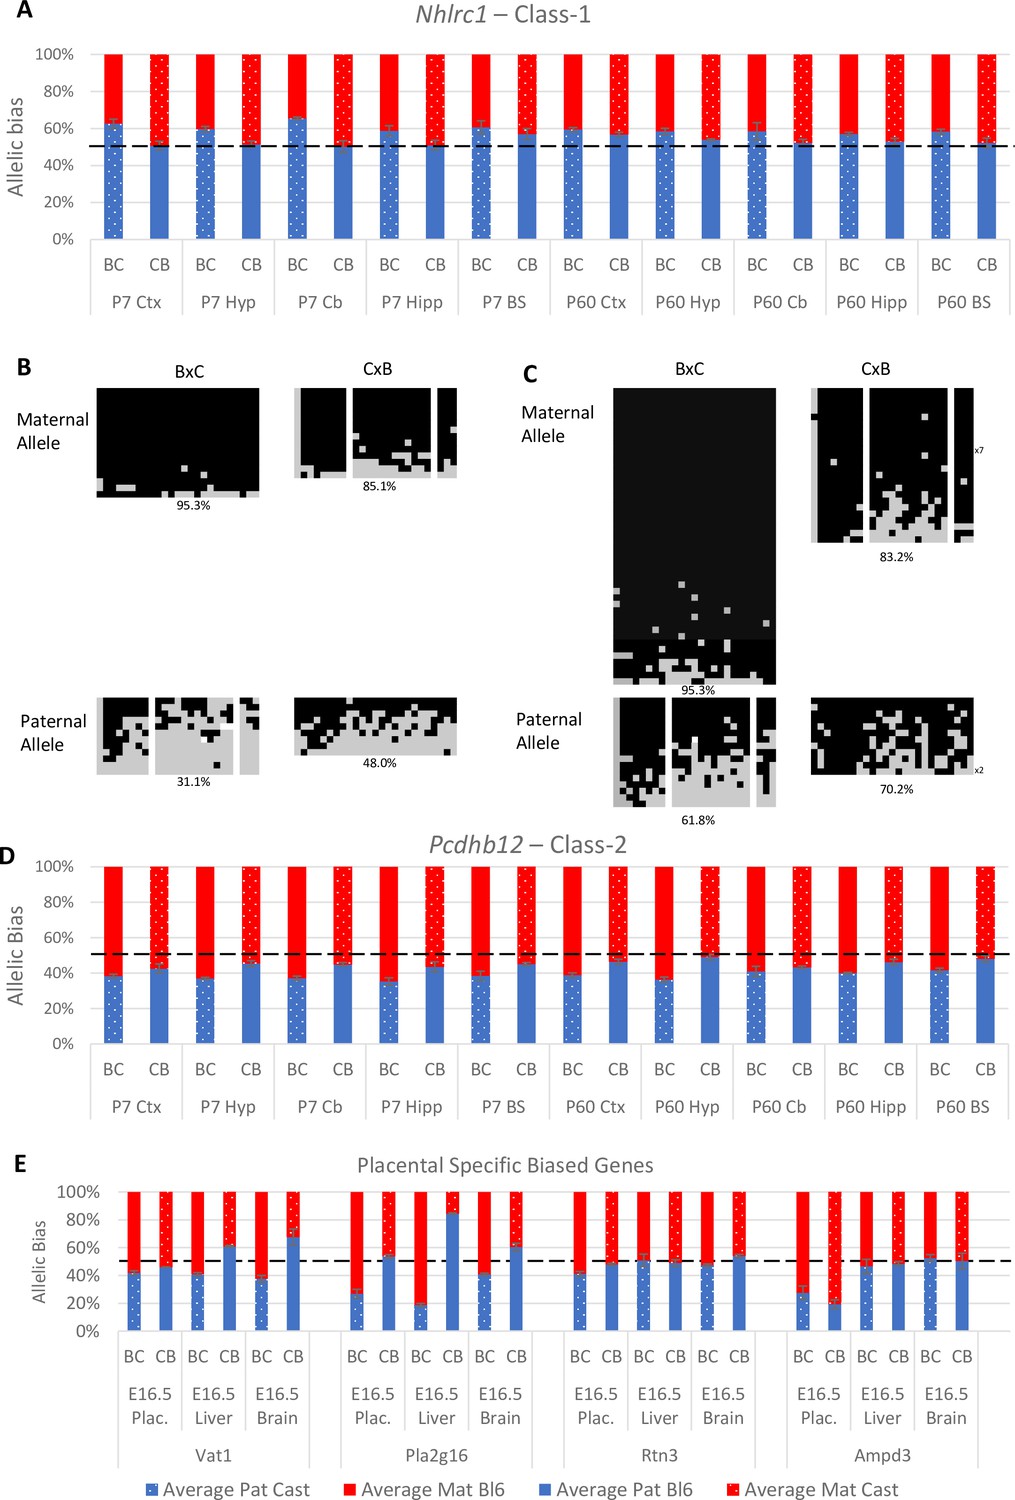
Experimentally validated Class-1 and Class-2 genes.
(A) – Nhlrc1 (Class-1) is paternally biased in all postnatal neuronal tissues tested. (B-C) Bisulfite sequencing analysis in P7 tissues.(B) – Cerebellum, (C)- Liver. Each line represents a different clone of bisulfite sequencing derived from two BxC animals and two CxB animals. Numbers of identical clones sequenced are indicated to the right. Black = methylated CpG and Gray = unmethylated CpG, white = CpG absent from clone. Percentage of methylated CpGs from all clones is indicated underneath.(D) – Pcdhb12 (Class-2) is maternally biased in all postnatal tissues tested. (E) – Three Class-2 genes show a maternal bias in e16.5 placenta: Vat1, Pla2g16, and Rtn3. These biases are weaker than seen in Ampd3 which is imprinted in the placenta (Schulz et al., 2006). Allele-specific expression graphs (A, D and E) show mean expression (%) from the paternal allele (deep blue) and maternal allele (red) in C57BL/6 × CastEiJ (BC) and four CastEiJ × C57BL/6 (CB) crosses. Castaneus allele is denoted by a spotted pattern. Standard error of the mean is shown n=3 or 4. Data are normalized to gDNA.
Figure 5—figure supplement 1

Coro1c pseudogene is almost exclusively expressed from the castaneus allele.
(A) Nhlrc1 expression bias in P6 cerebellum and liver which were also used for bisulfite sequencing analysis. (B) Allelic balance of expression of Coro1c pseudogene that overlaps the Nhlrc1 DMR. Graph shows mean expression (%) from the paternal allele (blue) and maternal allele (red). C57BL/6 × CastEiJ (BC) and CastEiJ × C57BL/6 (CB) crosses. Castaneus allele is denoted by a spotted pattern. Standard error of the mean is shown, n=2 for Nhlrc1 and 3 for Coro1c pseudogene.
Figure 5—figure supplement 2
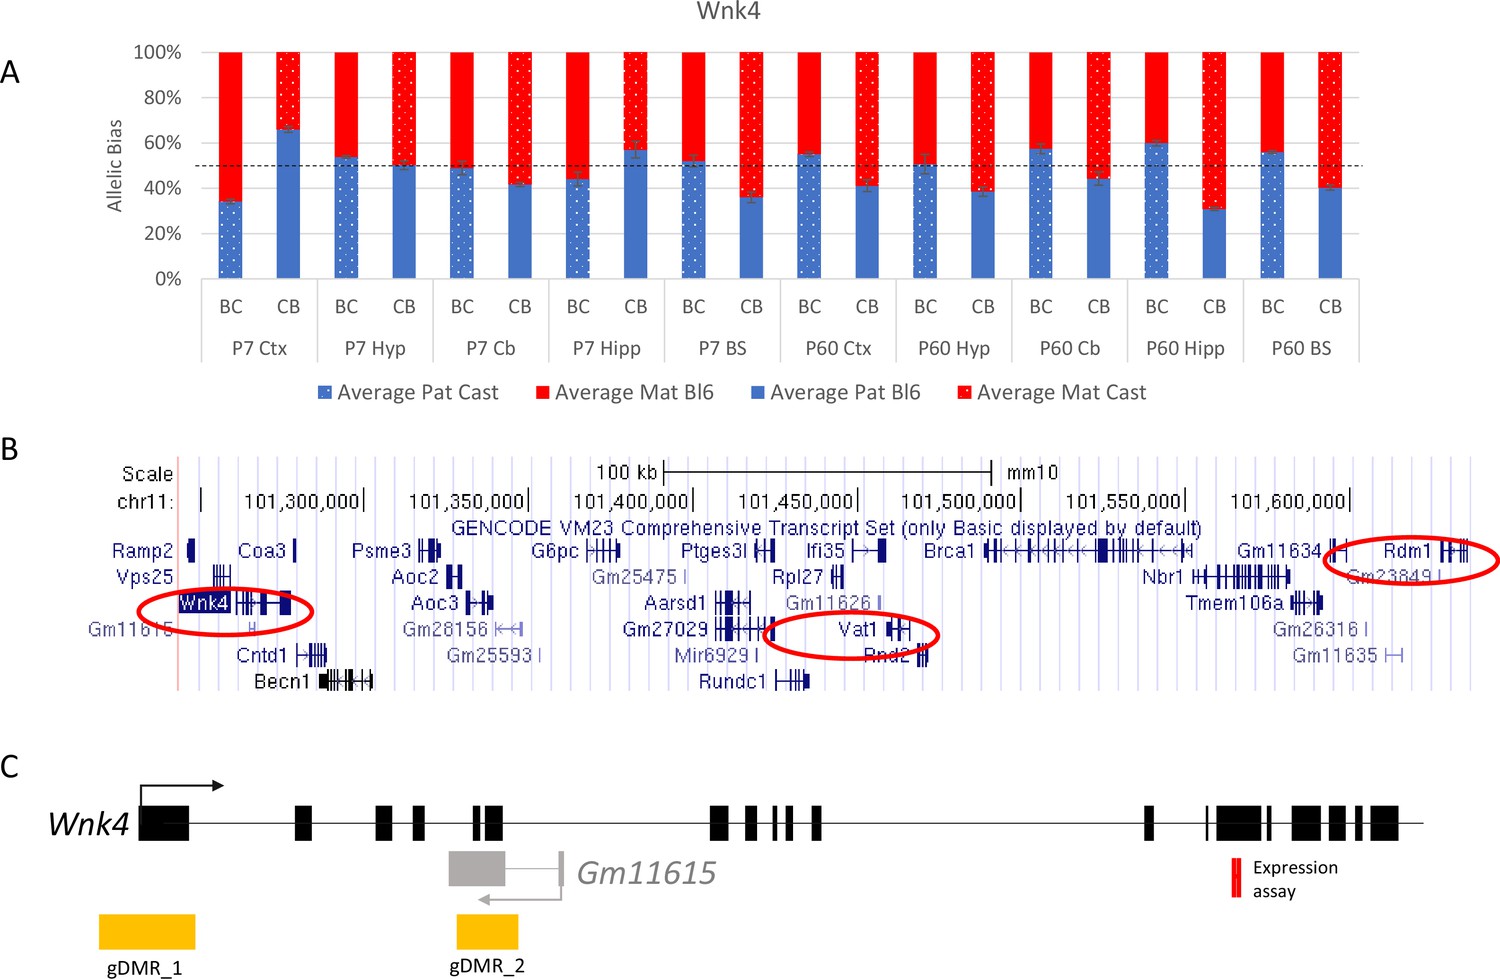
Allelic bias in Wnk4 novel cluster.
(A) Weak bias in Wnk4 gene. (B) location of genes in the novel cluster, (C) location of gDMRs, and antisense transcript. Graph shows mean expression (%) from the paternal allele (blue) and maternal allele (red) C57BL/6 × CastEiJ (BC) and four CastEiJ × C57BL/6 (CB) crosses. Castaneus allele is denoted by a spotted pattern. Standard error of the mean is shown, n=3 or 4. Data are normalized to gDNA.
Figure 5—figure supplement 3
Expression levels of genes tested by allele-specific pyrosequencing.
Data are extracted from Supplementary file 1f. Genes that were only validated in the placenta were counted as unvalidated and the two known placental-specific imprinted genes are not included in the figure. Expression levels were reported as the mean transcripts per million (TPM) across all biological replicates. Samples: Dataset A - whole adult brain, cerebellum (cb) hypothalamus (hypo) liver, muscle. Dataset B - arcuate nucleus (ARN), dorsal raphe nucleus (DRN), liver, and muscle. Dataset C - P8 and P60 cerebellum. The original study the genes were reported as biased is noted on the y-axis – A=Dataset A, B=Dataset B, C=Dataset C, and D=Dataset D.
Figure 6 with 3 supplements
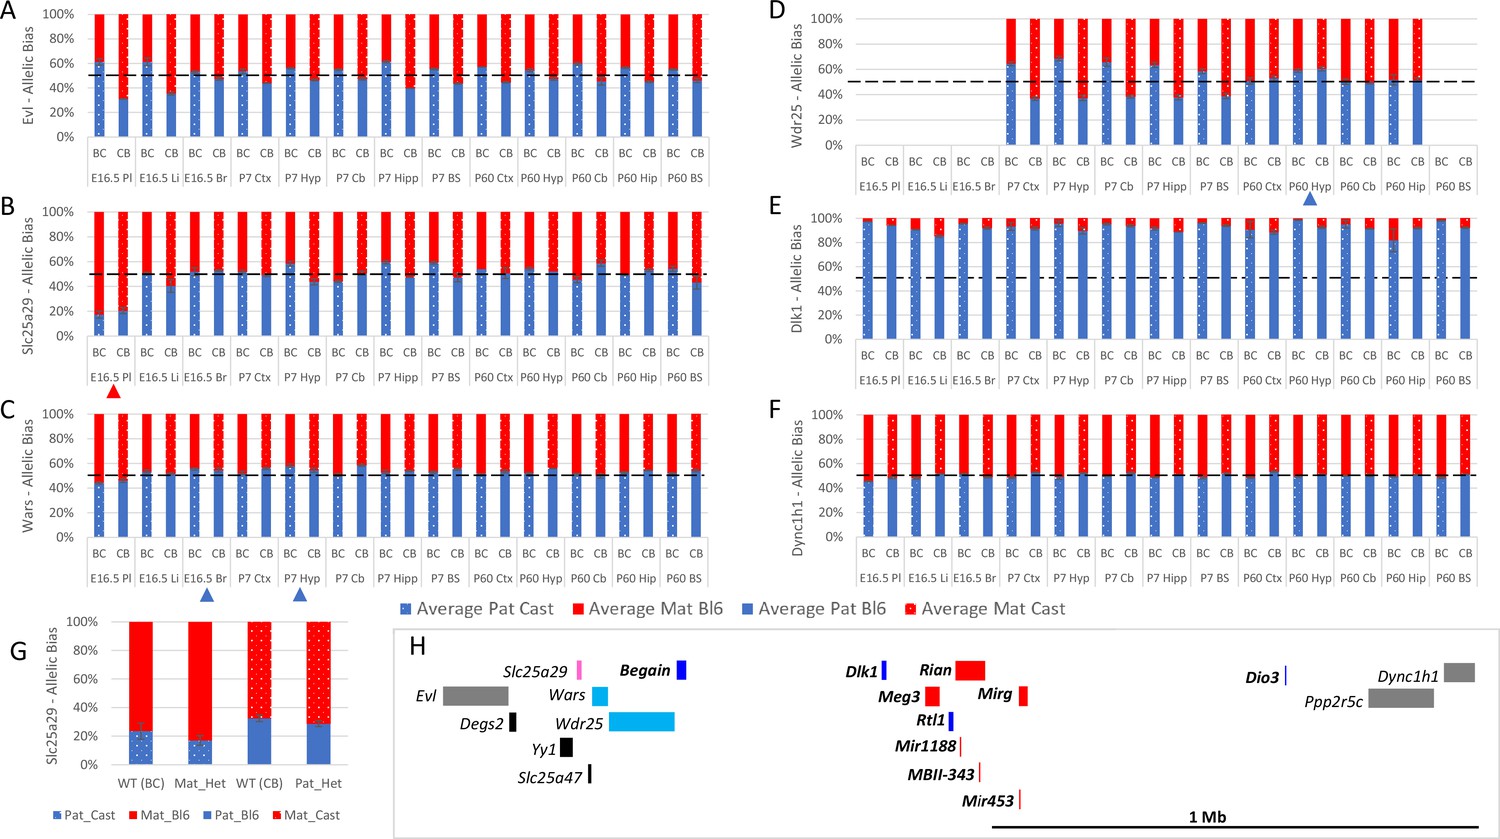
Allele-specific expression analysis of the Dlk1 domain.
(A–F) Allelic bias in Evl (A), Slc25a29 (B), Wars (C) Wdr24 (D) Dlk1 (E), and Dync1h1 (F) Graphs show mean expression (%) from the paternal allele (blue) and maternal allele (red) C57BL/6 × CastEiJ (BC) and four CastEiJ × C57BL/6 (CB) crosses. Castaneus allele is denoted by a spotted pattern. Standard error of the mean is shown, n=3 or 4. Tissues with a mean bias greater than 45:55 are indicated by arrow heads. Amplification bias was assessed in genomic DNA and the data are corrected. (G) – Imprinting of Slc25a29 in e15.5 placenta is not under the control of the IG-DMR. WT (BC) = maternal allele is wildtype for the IG-DMR paternal allele is CastEiJ (n=5). Mat_Het = maternal allele has IG-DMR deletion and the paternal allele is CastEiJ (n=6). WT (CB)=paternal allele is wildtype for the IG-DMR maternal allele is CastEiJ (n=5). Pat_Het = Paternal allele has IG-DMR deletion and the maternal allele is CastEiJ (n=7). (H) Schematic of the validated expression data in the Dlk1 region. Red boxes = known maternally expressed genes. Blue boxes = known paternally expressed genes. Pink boxes = novel validated maternally biased genes. Turquoise boxes = novel validated paternally biased genes. Gray boxes = biallelically expressed genes.
Figure 6—figure supplement 1
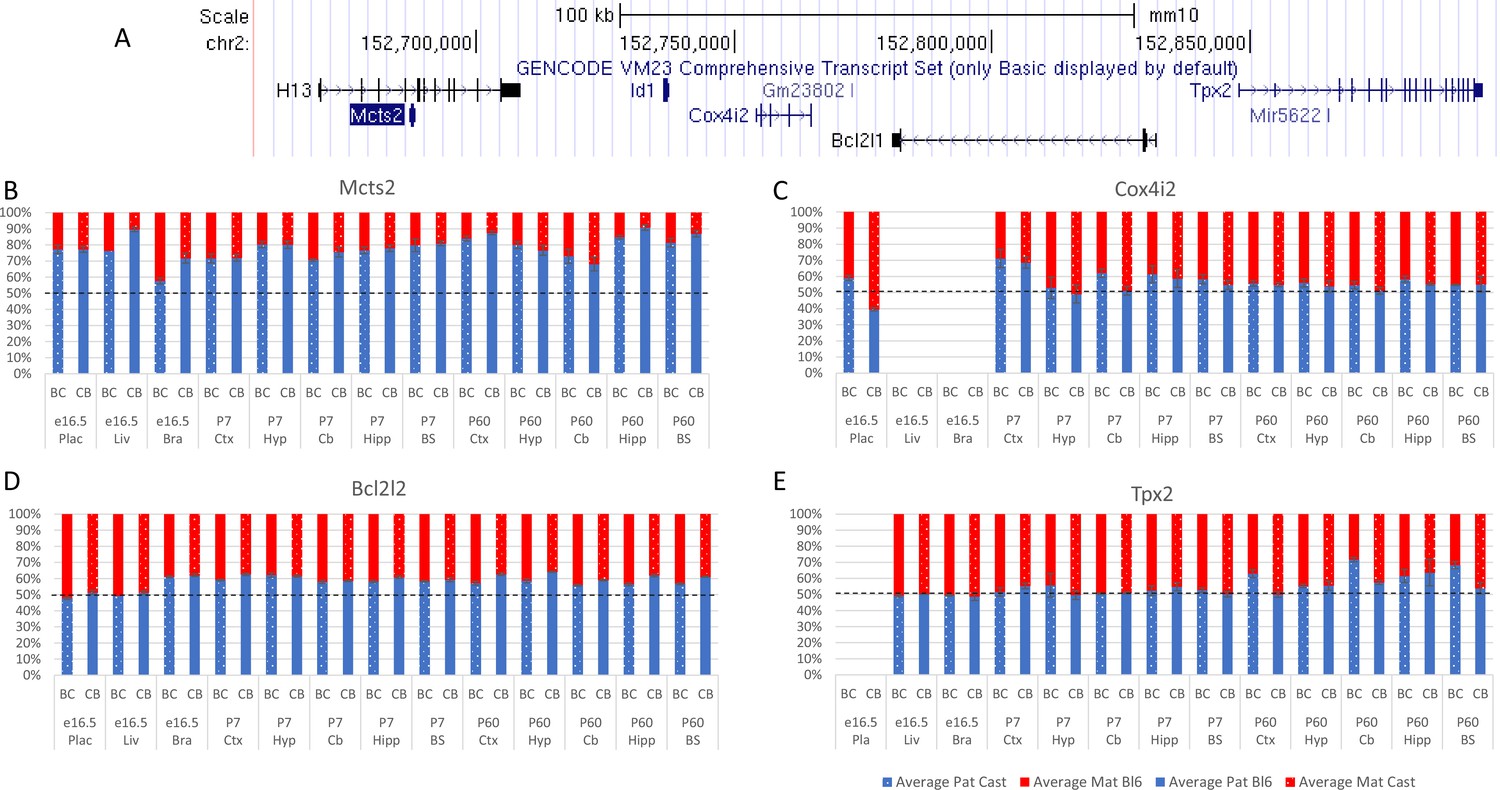
Allelic bias in the Mcts2 region.
(A) Mcts2 imprinted region. (B–E) Allelic bias (%) in Mcts2 (A), Cox4i2 (B), Bcl2l1 (C) , and Tpx2 (D). Graphs show mean expression (%) from the paternal allele (blue) and maternal allele (red) C57BL/6 × CastEiJ (BC) and four CastEiJ × C57BL/6 (CB) crosses. Castaneus allele is denoted by a spotted pattern. Standard error of the mean is shown, n=3 or 4. Data are normalized to gDNA.
Figure 6—figure supplement 2
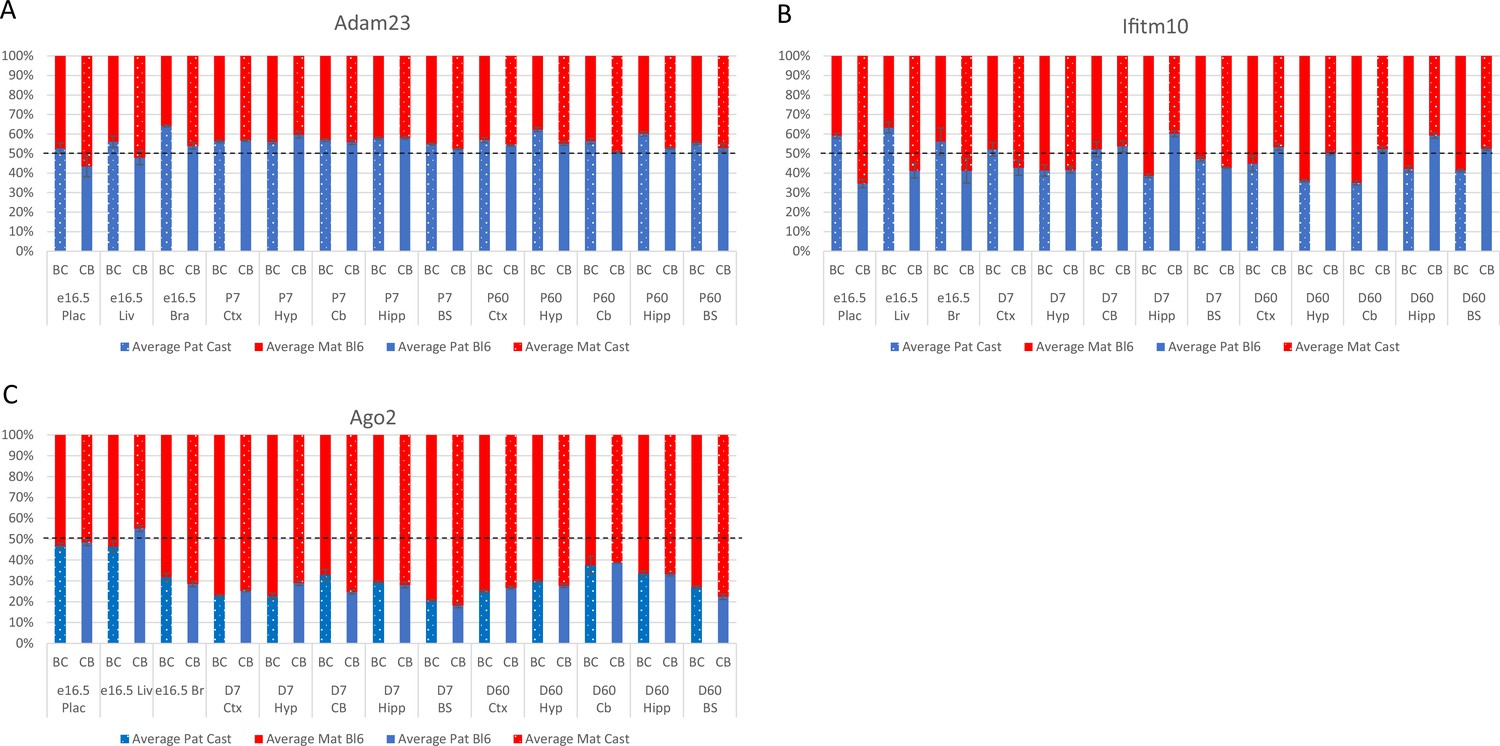
Allelic bias (%) in Adam23 (A), Ifitm10 (B), and Ago2 (C).
Graphs show mean expression (%) from the paternal allele (blue) and maternal allele (red) C57BL/6 × CastEiJ (BC) and four CastEiJ × C57BL/6 (CB) crosses. Castaneus allele is denoted by a spotted pattern. Standard error of the mean is shown, n=3 or 4. Adam23 and Iftim10 data are normalized for an amplification bias in gDNA. Data are normalized to gDNA.
Figure 6—figure supplement 3
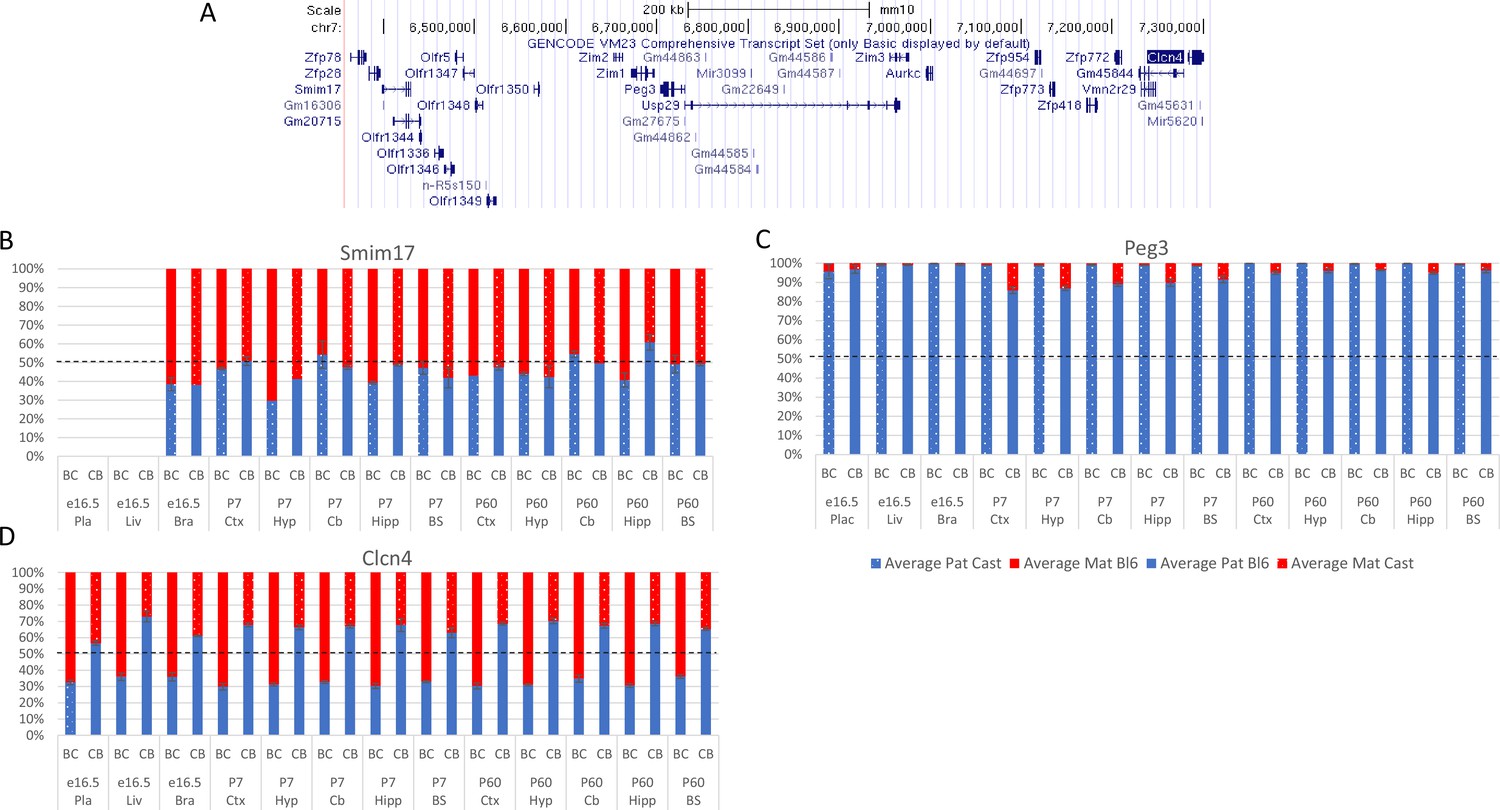
Allelic bias in Peg3 region.
(A) Peg3 imprinted region. (B–D) Allelic bias (%) in Smim17 (A), Peg3 (B), and Clcn4 (C). Graphs show mean expression (%) from the paternal allele (blue) and maternal allele (red) C57BL/6 x CastEiJ (BC) and four CastEiJ × C57BL/6 (CB) crosses. Castaneus allele is denoted by a spotted pattern. Standard error of the mean is shown, n=3 or 4. Clcn4 data are normalized for an amplification bias in gDNA. Data are normalized to gDNA.
Figure 7
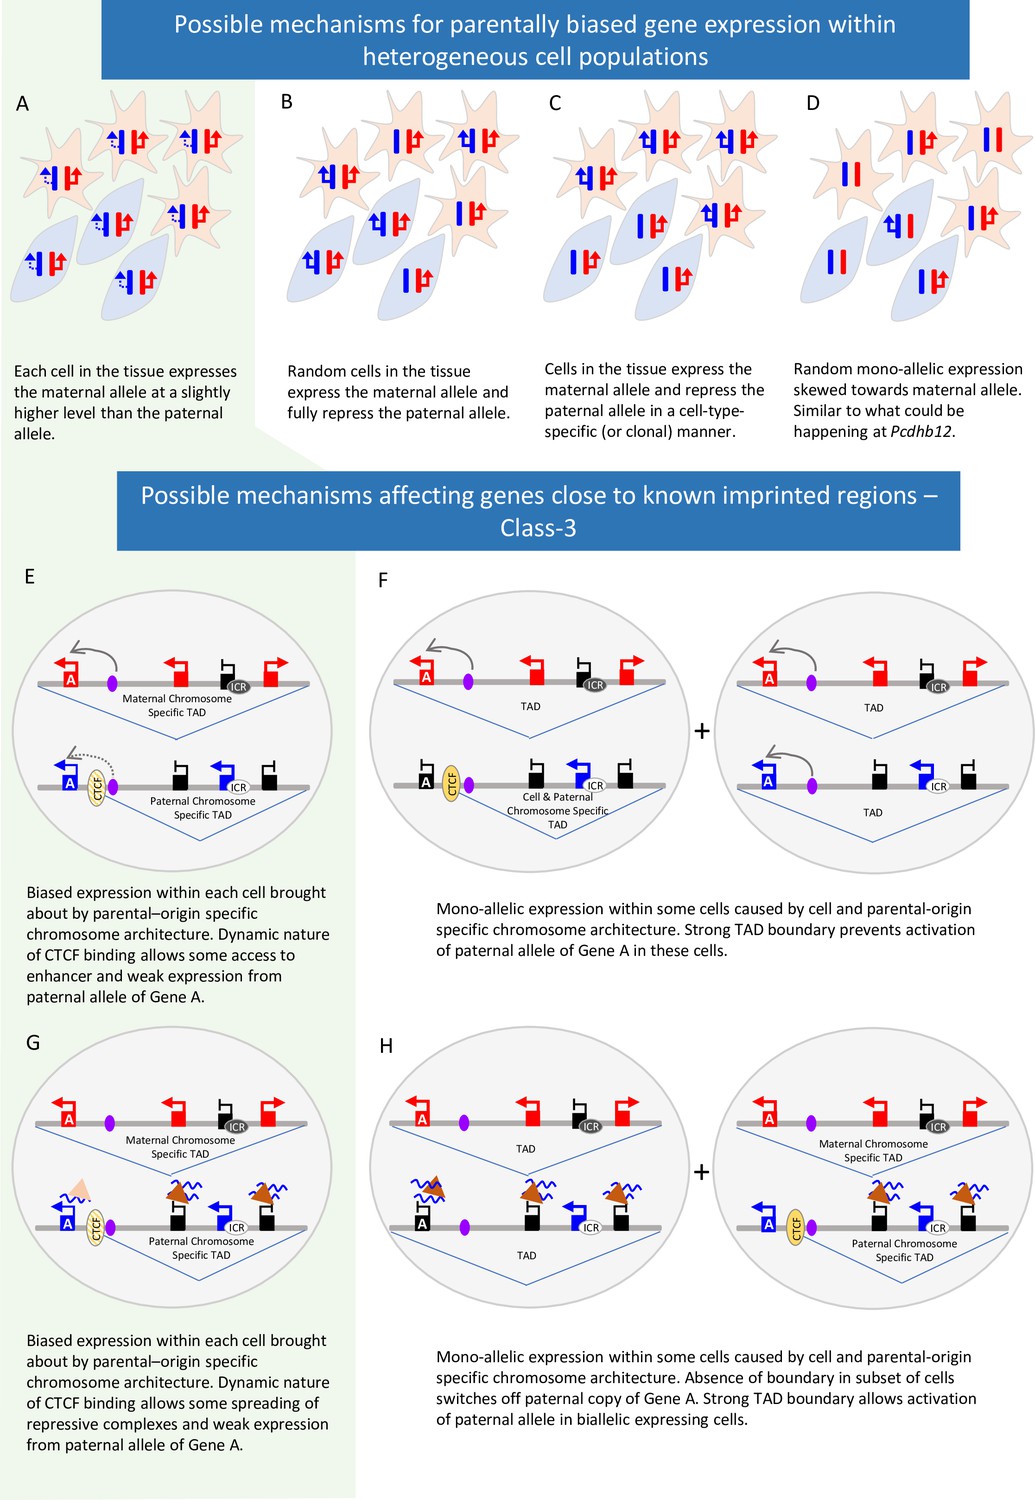
Possible mechanisms behind parent-of-origin expression biases in tissues.
(A-D) Scenarios causing biased expression in heterogenous cell populations: bias occurs in every cell in the tissue (A), random imprinting in the subset of cells (B), cell-type specific imprinting (C) or random monoallelic expression that is skewed towards one allele (D). (E-H) Possible Mechanisms behind parent-of-origin biases at the periphery of imprinted domains.
Tables
Table 1
Table showing the summary of all the allele-specific pyrosequencing performed to validate putative-biased genes.
Values show the mean expression (%) from the paternal allele of both reciprocal crosses to eliminate strain bias. Values above 55% are called as paternally biased (blue) and values below 45% are called as maternally biased (red). Assays with a strain bias of greater than 45:55 in more than one tissue are indicated in the 19th column. Genes that only validate in the placenta are called as Placental in the 20th column (Red = Maternal, Blue = Paternal).
| Genes | Chr. | Dataset | Direction previously reported | Class | e16.5 | e16.5 | e16.5 | P7 | P7 | P7 | P7 | P7 | P60 | P60 | P60 | P60 | P60 | Strain Bias | Validation status |
|---|---|---|---|---|---|---|---|---|---|---|---|---|---|---|---|---|---|---|---|
| Plac. | Liver | Brain | Cortex | Hyp. | Cb. | Hipp. | B.S | Cortex | Hyp. | Cb. | Hipp. | B.S | |||||||
| Class-1 (Novel Singletons) | |||||||||||||||||||
| L3mbtl1 | 2 | B | pat | 1 | - | - | - | 48.1 | 53.4 | 53.4 | 46.4 | 50.1 | 49.4 | 49.7 | 46.7 | 51.0 | 49.2 | ✓ | Biallelic |
| Ahi1 | 10 | B,D | pat | 1 | 52.8 | 46.5 | n/a | 47.0 | 51.6 | 50.9 | 52.8 | 46.9 | 48.6 | 49.4 | 50.0 | 52.4 | 51.3 | ✓ | Biallelic |
| Platr20 | 11 | A | pat | 1 | 51.7 | 49.9 | 50.0 | 49.9 | 50.4 | 50.1 | 50.4 | 50.2 | 49.8 | 49.8 | 50.1 | 50.2 | 49.7 | Biallelic | |
| Calm1 | 12 | B,D | pat | 1 | - | - | - | 54.7 | 49.5 | 51.4 | 45.9 | 43.4 | n/a | n/a | n/a | n/a | n/a | ✓ | Biallelic |
| Nhlrc1 | 13 | B, C, D | pat | 1 | - | - | - | 54.8 | ✓ | ||||||||||
| Tnk1 | 11 | A | mat | 1 | - | - | - | - | - | - | - | - | - | - | - | - | - | Low expression | |
| Mlana | 18 | B | mat | 1 | - | - | - | - | - | - | - | - | - | - | - | - | - | Low expression | |
| Gm16299 | 19 | C | pat | 1 | - | - | - | - | - | - | - | - | - | - | - | - | - | Low expression | |
| Class-2 (Novel Clusters) | |||||||||||||||||||
| Stx6 | 1 | C | mat | 2 | - | - | - | 50.7 | 49.2 | 50.3 | 49.8 | 50.1 | n/a | n/a | n/a | n/a | n/a | Biallelic | |
| Gabra5 | 7 | B,D | pat | 2 | - | - | - | 51.5 | 53.2 | 52.5 | 54.8 | 52.6 | 52.3 | 50.7 | 48.6 | 51.5 | 51.5 | Biallelic | |
| Wnk4 | 11 | C | mat | 2 | - | - | - | 50.1 | 52.0 | 45.3 | 50.6 | 48.1 | 50.9 | 45.4 | 48.1 | ✓ | |||
| Vat1 | 11 | B | mat | 2 | 50.9 | 52.6 | 49.6 | 48.8 | 50.4 | 51.0 | 49.9 | 46.4 | 51.3 | 50.8 | 49.8 | 50.4 | ✓ | ||
| Rdm1 | 11 | A | mat | 2 | 49.4 | - | - | 48.8 | 48.8 | 50.1 | 50.2 | 50.7 | 46.9 | 49.5 | 50.5 | 50.1 | 48.7 | ✓ | Biallelic |
| Gaa | 11 | B,D | pat | 2 | 48.9 | 52.3 | 53.6 | 51.3 | 47.1 | 51.7 | 53.1 | 51.8 | 51.8 | 51.6 | 47.9 | 51.9 | 50.8 | ✓ | Biallelic |
| Pcdhb10 | 18 | D | mat | 2 | - | - | - | - | - | - | - | - | - | - | - | - | - | Low expression | |
| Pcdhb12 | 18 | B,C | mat | 2 | - | - | - | ||||||||||||
| Pcdhb20 | 18 | B,C | pat | 2 | - | - | 52.7 | 51.5 | 51.6 | 52.0 | 52.6 | 53.1 | 51.5 | 52.3 | 51.6 | 51.6 | 50.1 | ✓ | Biallelic |
| Prdx5 | 19 | B | pat | 2 | 46.9 | 51.1 | 49.4 | 49.0 | 50.4 | 48.8 | 49.4 | 49.9 | 49.2 | 50.2 | 50.0 | 48.3 | 49.2 | ✓ | Biallelic |
| Rtn3 | 19 | D | pat | 2 | 49.9 | 50.7 | 49.4 | 47.3 | 49.5 | 49.5 | 49.2 | 49.1 | 50.9 | 49.7 | 50.4 | 50.4 | |||
| Pla2g16 | 19 | B | mat | 2 | 51.6 | 50.6 | 51.7 | 49.7 | 48.9 | 48.5 | 50.7 | 51.5 | 51.2 | 49.2 | 46.8 | 48.3 | ✓ | ||
| Mr1 | 1 | C | mat | 2 | - | - | - | - | - | - | - | - | - | - | - | - | - | Low expression | |
| BC034090 | 1 | C | mat | 2 | - | - | - | - | - | - | - | - | - | - | - | - | - | Low expression | |
| Tmem106a | 11 | A | mat | 2 | - | - | - | - | - | - | - | - | - | - | - | - | - | Low expression | |
| Class-3 (Close to known imprinted genes) | |||||||||||||||||||
| Adam23 | 1 | A,B,C,D | pat | 3 | 48.0 | 52.0 | 53.7 | 53.5 | 54.1 | ||||||||||
| Mcts2 | 2 | A,B,C | pat | K | |||||||||||||||
| Cox4i2 | 2 | C | pat | 3 | 49.3 | - | - | 51.0 | 52.8 | 54.9 | |||||||||
| Bcl2l1 | 2 | A,B,C,D | pat | 3 | 49.5 | 50.2 | |||||||||||||
| Tpx2 | 2 | C | pat | 3 | - | 49.7 | 49.1 | 53.4 | 52.6 | 50.7 | 53.6 | 51.4 | ✓ | ||||||
| Herc3 | 6 | A,B,C,D | mat | K | 47.0 | 45.8 | 45.7 | 49.9 | ✓ | ||||||||||
| Fam13a | 6 | B,D | mat | 3 | - | 46.1 | 53.2 | 47.9 | 47.1 | 51.3 | 49.4 | 48.4 | n/a | n/a | n/a | n/a | n/a | ✓ | Biallelic |
| Zfp78 | 7 | B | both | 3 | - | - | - | - | - | - | - | - | - | - | - | - | - | Low expression | |
| Smim17 | 7 | B,D | mat | 3 | - | - | 48.8 | 50.9 | 45.2 | 52.1 | 50.8 | 49.3 | |||||||
| Peg3 | 7 | A,B,C,D | pat | K | ✓ | ||||||||||||||
| Zfp954 | 7 | B | mat | 3 | - | - | - | - | - | - | - | - | - | - | - | - | - | Low expression | |
| Zfp773 | 7 | B | mat | 3 | - | - | - | - | - | - | - | - | - | - | - | - | - | Low expression | |
| Zfp772 | 7 | B | mat | 3 | - | - | - | - | - | - | - | - | - | - | - | - | - | Low expression | |
| Clcn4-2 | 7 | B | mat | 3 | 54.5 | 48.5 | 48.9 | 48.8 | 49.9 | 49.1 | 48.0 | 49.5 | 50.7 | 51.0 | 49.6 | 50.7 | ✓ | ||
| Ifitm10 | 7 | C,D | mat | 3 | 46.9 | 52.3 | 48.7 | 47.5 | 53.0 | 49.4 | 49.0 | 50.7 | 47.0 | ✓ | |||||
| Ctsd | 7 | B,D | mat | 3 | 46.8 | 47.8 | 50.1 | 50.0 | 49.0 | 48.4 | 48.9 | 49.8 | 49.3 | 50.2 | 49.0 | 50.5 | 49.5 | Biallelic | |
| Evl | 12 | B | pat | 3 | 46.2 | 48.3 | 50.2 | 48.7 | 51.3 | 51.1 | 50.2 | 49.5 | 50.9 | 50.9 | 52.6 | 50.8 | 50.6 | ✓ | Biallelic |
| Slc25a29 | 12 | B | pat | 3 | 45.5 | 52.3 | 53.9 | 56.2 | 54.5 | 53.3 | 54.2 | 52.8 | 53.8 | 50.6 | 53.6 | 53.2 | ✓ | ||
| Wars | 12 | C | pat | 3 | 45.2 | 52.5 | 53.9 | 54.5 | 53.3 | 54.2 | 52.8 | 53.9 | 50.6 | 53.6 | 53.2 | ||||
| Wdr25 | 12 | B,D | pat | 3 | - | - | - | 50.7 | 52.9 | 52.0 | 50.6 | 48.7 | 51.8 | 49.9 | 51.7 | - | ✓ | ||
| Dlk1 | 12 | A,B,C,D | pat | K | |||||||||||||||
| Ppp2r5c | 12 | B,C | pat | 3 | 52.4 | 51.3 | 48.5 | 48.6 | 49.3 | 54.0 | 50.6 | 48.2 | 50.6 | 48.7 | 45.2 | 51.0 | 49.3 | ✓ | Biallelic |
| Dync1h1 | 12 | B,C | pat | 3 | 46.9 | 49.8 | 50.4 | 50.7 | 50.7 | 51.1 | 49.9 | 50.4 | 51.0 | 50.4 | 50.1 | 50.1 | 49.8 | Biallelic | |
| Ago2 | 15 | A,B,C,D | mat | 3 | 47.7 | 50.7 | |||||||||||||
| Ampd3 | 7 | B | mat | K | 47.5 | 51.4 | 48.6 | 48.5 | 48.3 | 51.8 | 50.9 | 50.1 | 46.7 | 50.9 | 49.4 | 51.5 | ✓ | ||
| Gab1 | 8 | A | pat | K | 50.4 | 49.8 | 52.7 | 49.6 | 48.6 | 49.4 | 51.0 | 47.1 | 49.6 | 48.8 | 50.1 | 50.2 | |||
Additional files
-
Supplementary file 1
Data generated in this study.
(a) Study information for Dataset A (Babak et al., 2008), Dataset B (Bonthuis et al., 2015), Dataset C (Perez et al., 2015), Dataset D (Crowley et al., 2015) and Dataset E (Andergassen et al., 2017). (b) All genes called in original studies. (c) Overlapping Novel genes called in original studies. (d) All genes called in this study using ISoLDE. (e) Number of genes called in individual tissues in the original study and this study. (f) Expression levels of genes in RNA-seq data used for ISoLDE and called as biased in original study - Figure 2—figure supplement 1. (g) Strain biased genes called in Dataset B and Dataset C in this study. (h) CpG Methylation and H3K27me3 over promoter regions of imprinted and Class-3 genes - Figure 3D. (i) Overlapping genes called in this study and the original one. This list includes genes generated in the undetermined list by the ISoLDE pipeline. (j) List of primers used in the study.
- https://cdn.elifesciences.org/articles/83364/elife-83364-supp1-v2.xlsx
-
MDAR checklist
- https://cdn.elifesciences.org/articles/83364/elife-83364-mdarchecklist1-v2.docx
Download links
A two-part list of links to download the article, or parts of the article, in various formats.
Downloads (link to download the article as PDF)
Open citations (links to open the citations from this article in various online reference manager services)
Cite this article (links to download the citations from this article in formats compatible with various reference manager tools)
Reassessment of weak parent-of-origin expression bias shows it rarely exists outside of known imprinted regions
eLife 12:e83364.
https://doi.org/10.7554/eLife.83364


