Femora from an exceptionally large population of coeval ornithomimosaurs yield evidence of sexual dimorphism in extinct theropod dinosaurs
- UMR 7179, Mécanismes Adaptatifs et Évolution (MECADEV), Muséum National d’Histoire Naturelle, CNRS, France
- Structure and Motion Laboratory, Department of Comparative Biomedical Sciences, Royal Veterinary College, United Kingdom
- UMR 7205, Institut de Systématique, Évolution, Biodiversité (ISYEB), Muséum National d’Histoire Naturelle, CNRS, Sorbonne Université, EPHE, UA, Paris, France, France
- UMR 7207, Centre de Recherche en Paléontologie - Paris (CR2P), Muséum National d’Histoire Naturelle, CNRS, Sorbonne Université, France
Figures
Figure 1 with 7 supplements
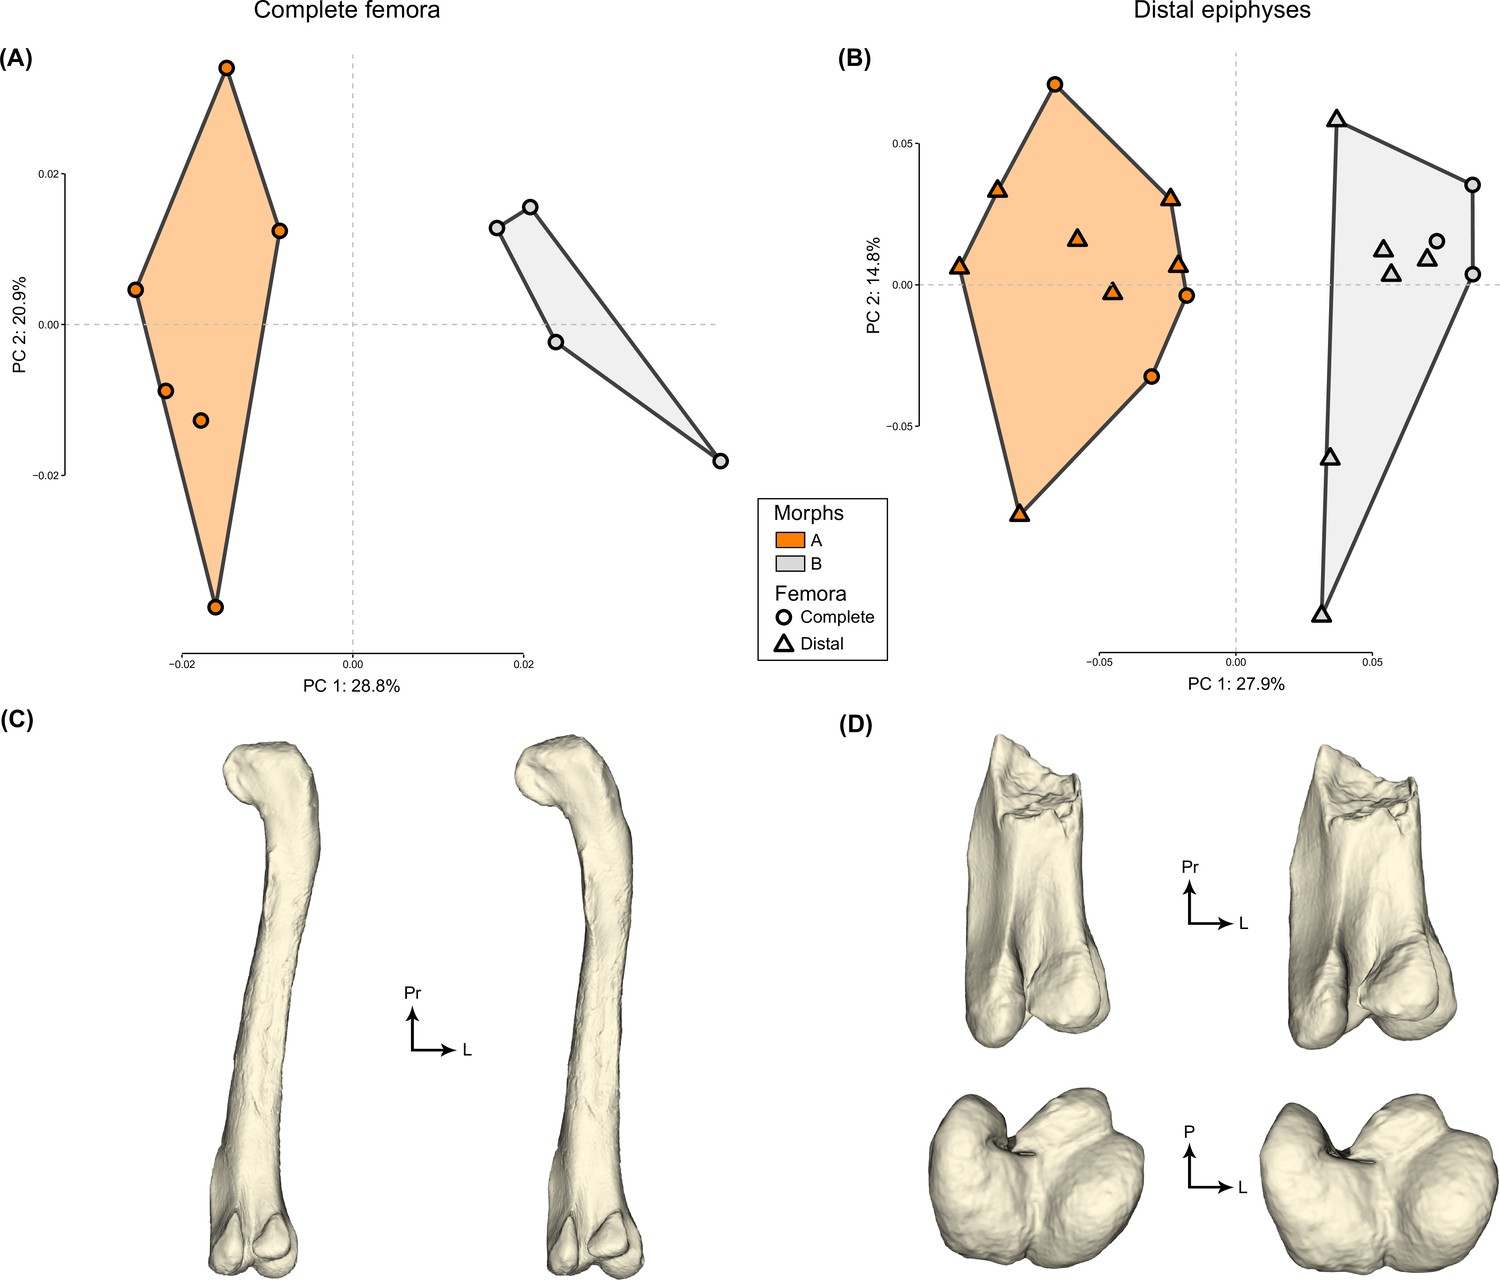
The two first axes of the principal component analysis (PCA) for (A) complete femora and (B) distal epiphyses.
Minimal (left) and maximal (right) mean shapes per group for (C) complete femora in posterior view and (D) distal epiphyses in posterior (top) and distal (bottom) views. Abbreviations: L, lateral; P, posterior; Pr, proximal.
Figure 1—figure supplement 1
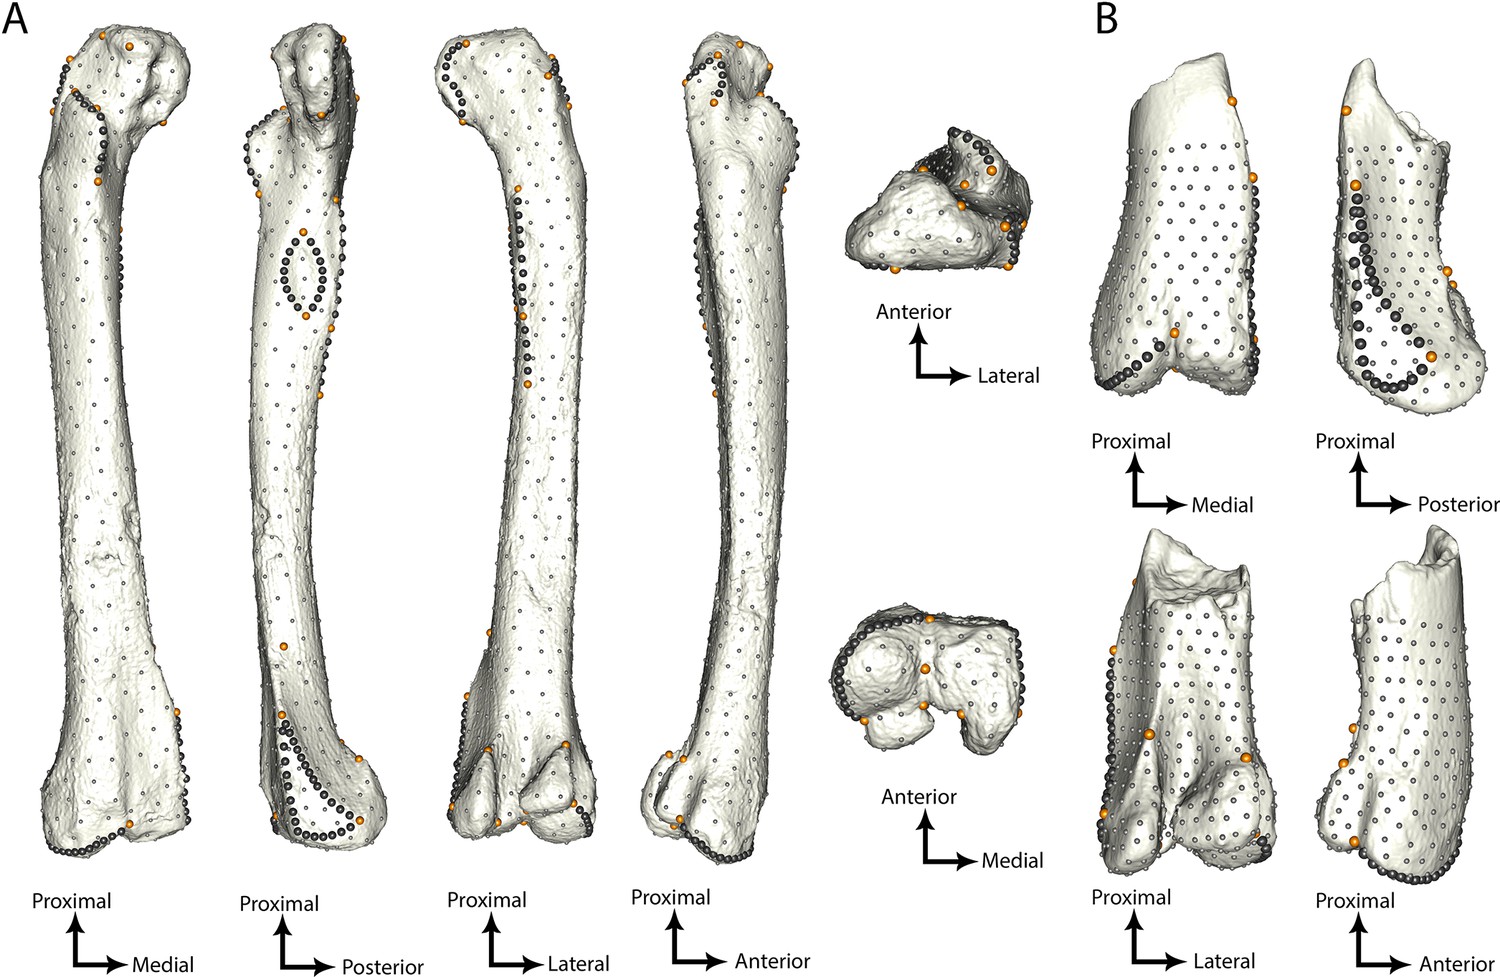
Template of (A) right complete femur of ANG10 90 and (B) mirrored left distal epiphysis of ANG14 3188 with anatomical landmarks (orange), sliding semilandmarks along curves (dark gray) and surfaces (light gray).
Figure 1—figure supplement 2
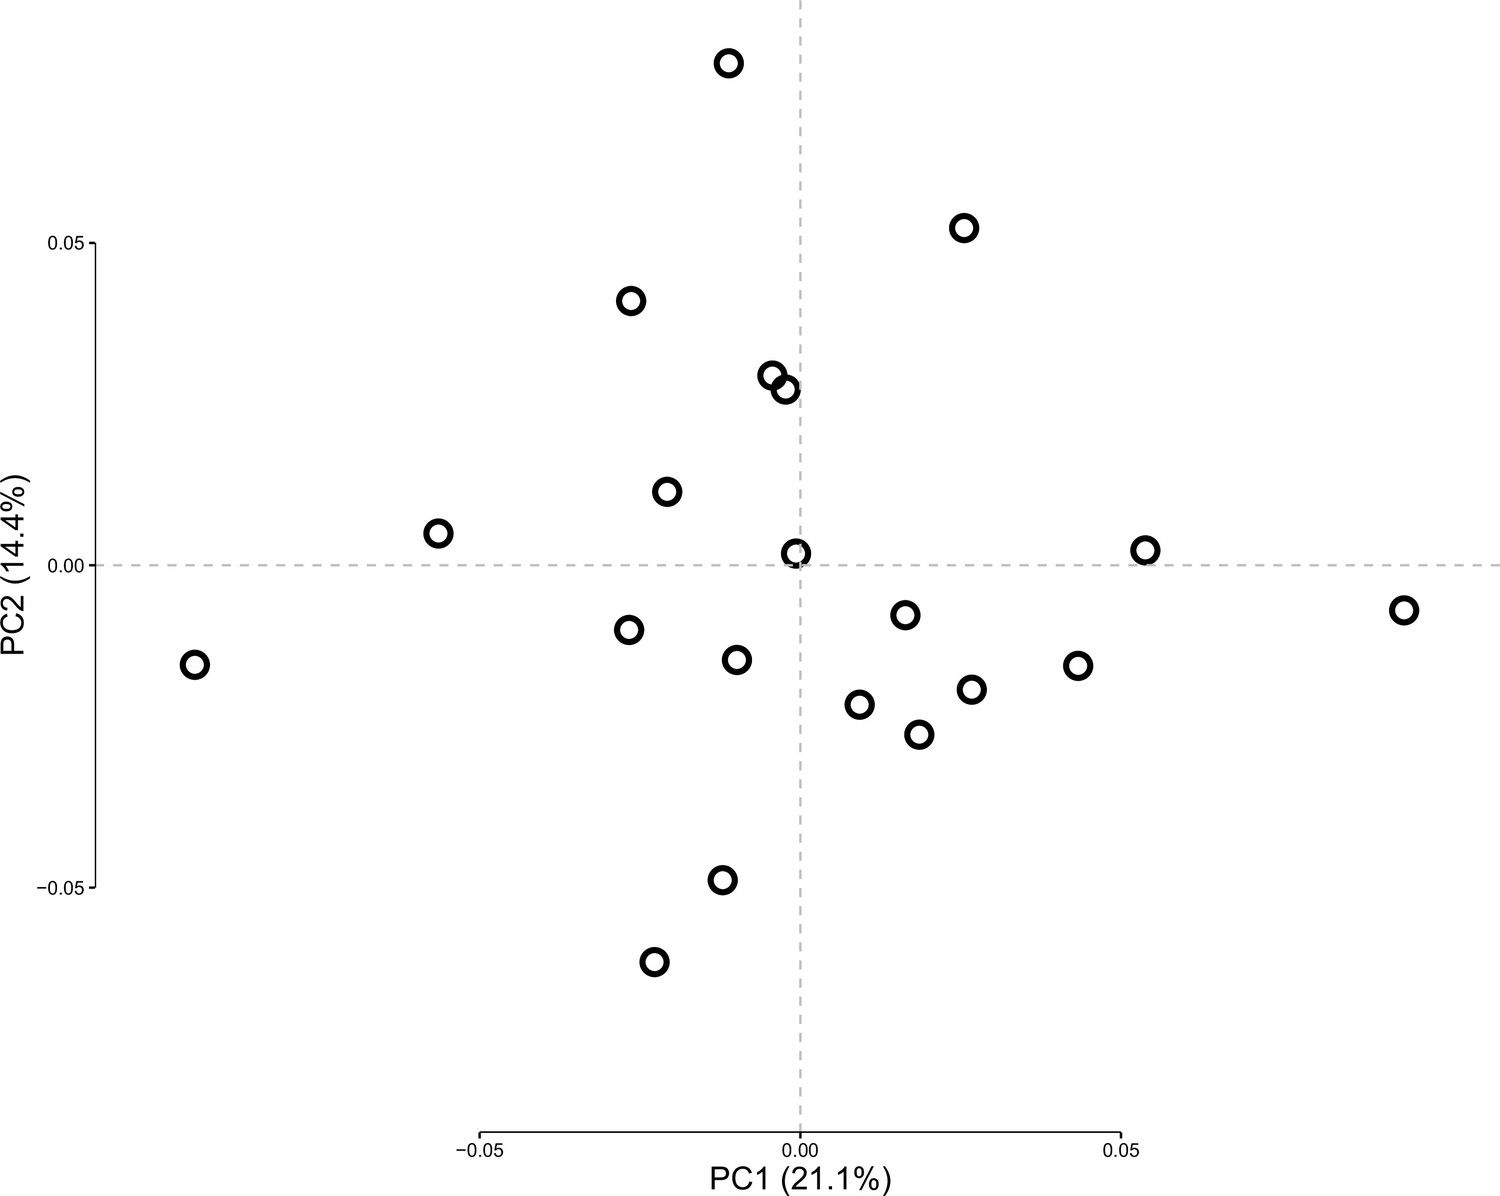
The two first axes of the principal component analysis (PCA) for proximal epiphyses of femora.
Figure 1—figure supplement 3
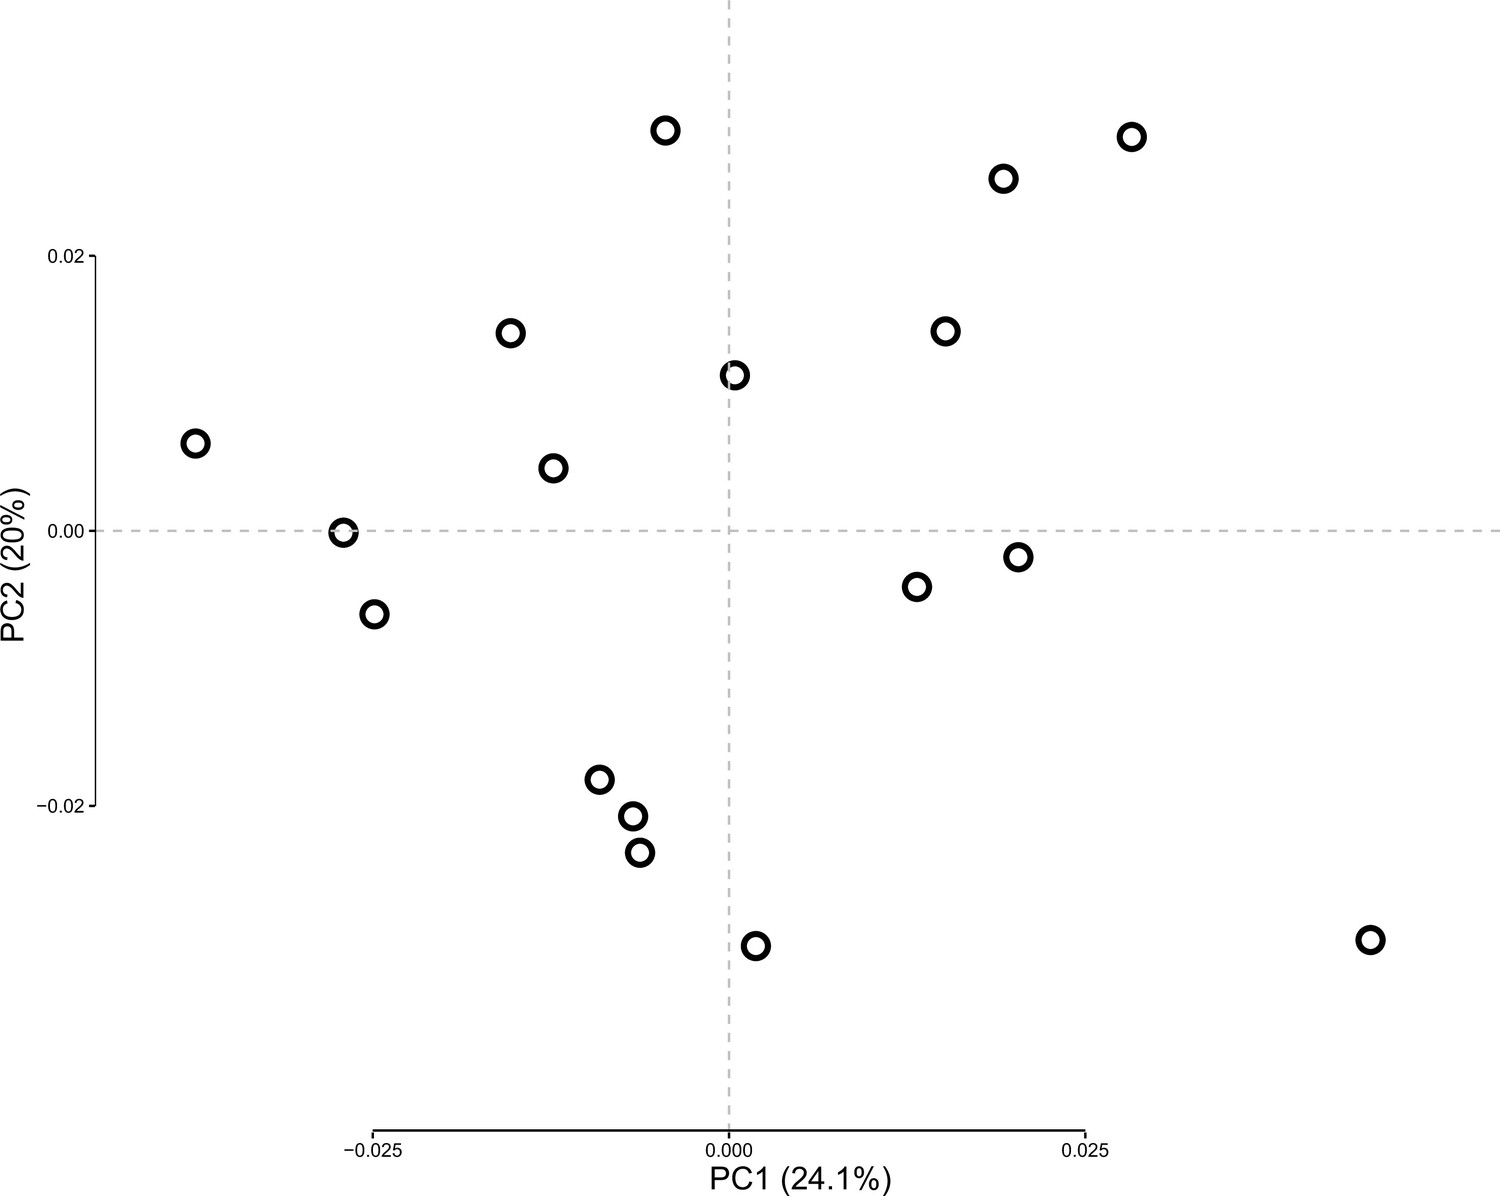
The two first axes of the principal component analysis (PCA) for complete tibiae.
Figure 1—figure supplement 4
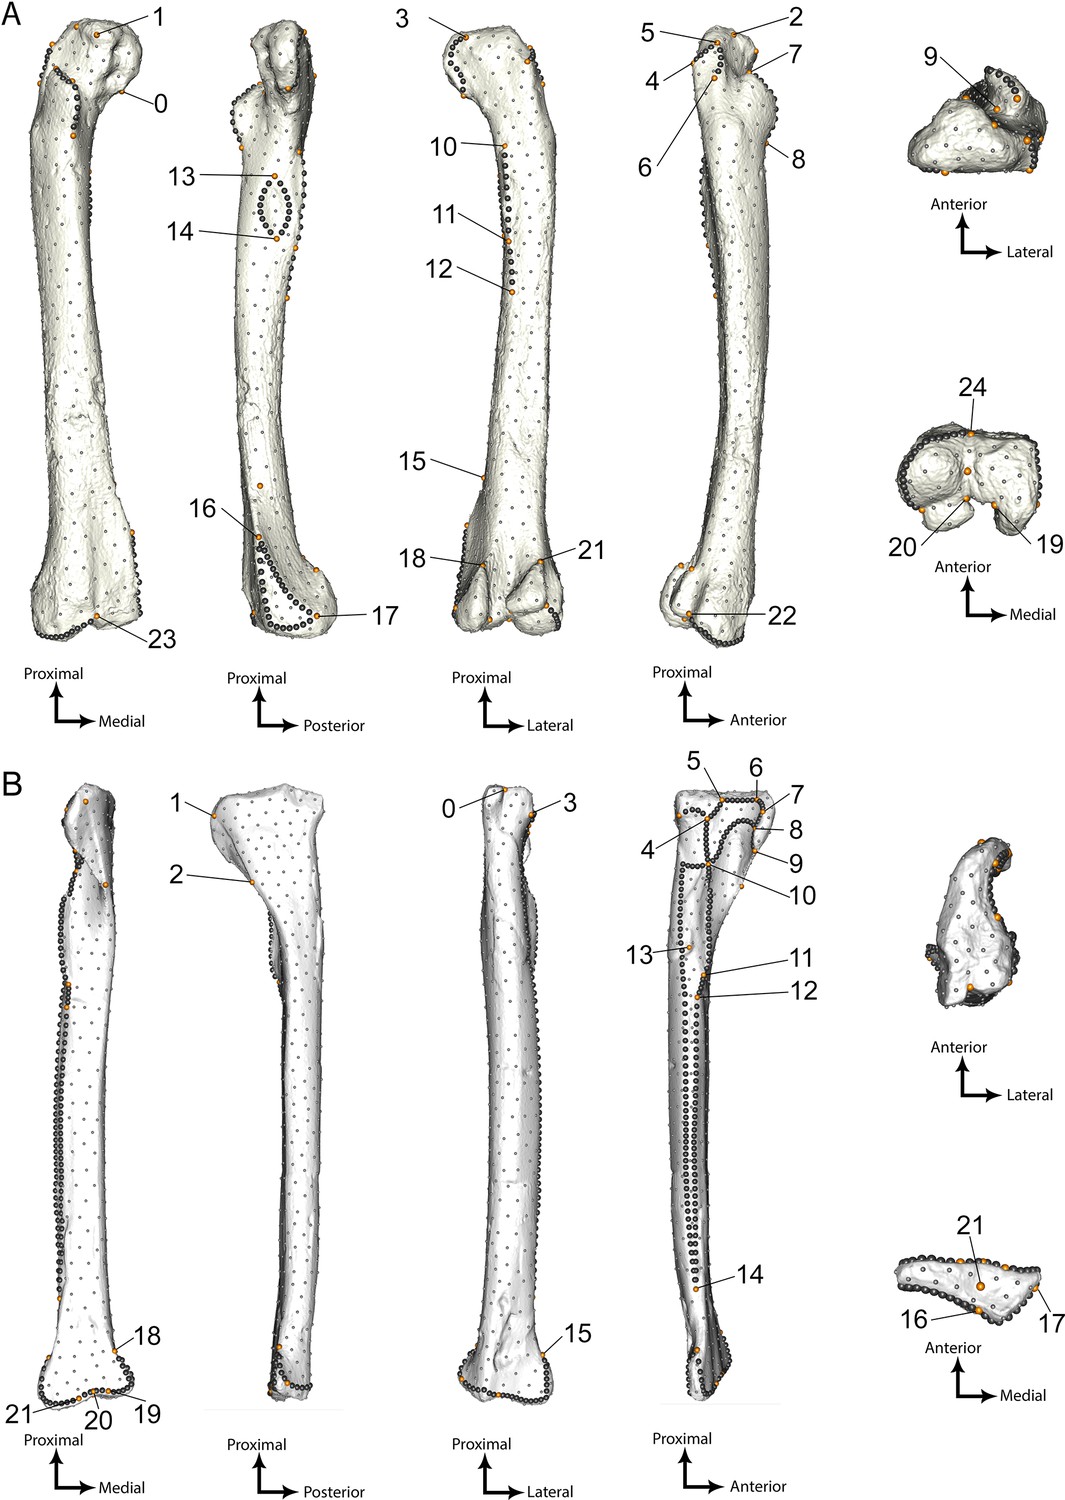
Landmark configuration on the templates (A) femur; (B) tibia, with numerotation following the scheme shown in Supplementary files 4 and 5.
Figure 1—figure supplement 5
The two first axes of the principal component analysis (PCA) showing the quantification of the repeatability for the landmark configuration on femora.
Figure 1—figure supplement 6
The two first axes of the principal component analysis (PCA) showing the quantification of the repeatability for the landmark configuration on tibiae.
Figure 1—figure supplement 7
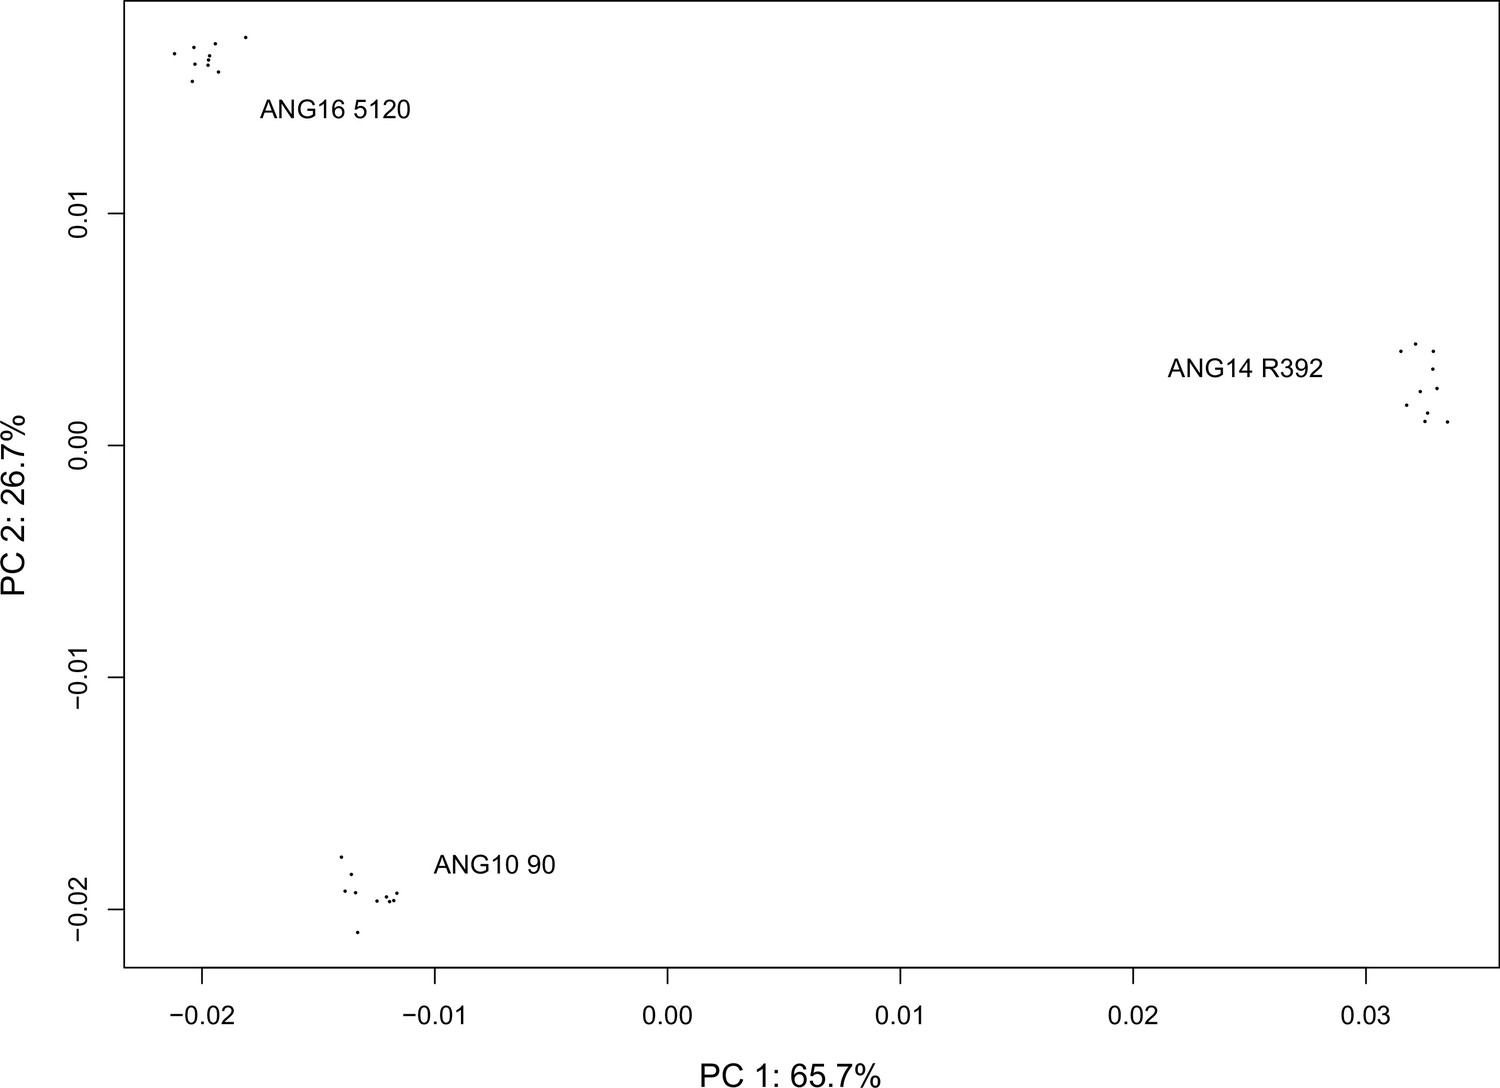
The two first axes of the principal component analysis (PCA) for the original dataset including taphonomically distorted complete femora ANG10 171 (left femur on the plot) and ANG13 2953 (right femur on the plot).
This figure highlights that the same dimorphism observed in this study is represented along PC2 when taphonomically distorted specimens are included. The taphonomically distorted specimens are located in the most negative area of the PC1 and are spread along the PC2; hence most likely interfering with the biological intraspecific variation.
Tables
Table 1
Number of femora and tibiae from the Angeac-Charente ornithomimosaur discovered between 2010 and 2020.
Minimum Number of Elements (MNEs) and Minimum Number of Individuals (MNIs) are given for each fragmented and complete femora.
| Femora | Tibiae | |
|---|---|---|
| Left proximal (MNE) | 31 | 31 |
| Right proximal (MNE) | 35 | 35 |
| Left distal (MNE) | 18 | 48 |
| Right distal (MNE) | 22 | 46 |
| Left complete (MNE) | 8 | 13 |
| Right complete (MNE) | 11 | 12 |
| MNI | 46 | 61 |
Additional files
-
Supplementary file 1
Statistical parameters used in this study for size-effect and cluster attribution.
- https://cdn.elifesciences.org/articles/83413/elife-83413-supp1-v1.docx
-
Supplementary file 2
Cluster attribution for complete femora studied in analyses for both complete femora and distal epiphyses.
- https://cdn.elifesciences.org/articles/83413/elife-83413-supp2-v1.docx
-
Supplementary file 3
Specimens used in this study.
* refers to specimens digitized with the NextEngine, other specimens were digitized using the Artec EVA. Abbreviations: Col. Nb., collection number; F.L., femoral length (maximal distance between proximal and distal epiphyses); L, left; P.W., proximal width; R, right. Specimens are available online on MorphoSource at https://www.morphosource.org/projects/000519447?locale=en.
- https://cdn.elifesciences.org/articles/83413/elife-83413-supp3-v1.docx
-
Supplementary file 4
Landmark scheme of the femur according to the numerotation shown in Figure S4.
Abbreviations: s, anatomical landmarks; c, sliding semilandmarks on curves.
- https://cdn.elifesciences.org/articles/83413/elife-83413-supp4-v1.docx
-
Supplementary file 5
Landmark scheme of the tibia according to the numerotation shown in Figure S5.
Abbreviations: s, anatomical landmarks; c, sliding semilandmarks on curves.
- https://cdn.elifesciences.org/articles/83413/elife-83413-supp5-v1.docx
-
MDAR checklist
- https://cdn.elifesciences.org/articles/83413/elife-83413-mdarchecklist1-v1.docx
-
Source code 1
R script for the various analyses used in this study.
- https://cdn.elifesciences.org/articles/83413/elife-83413-code1-v1.zip
-
Source code 2
R script for the different sliding steps used in this study to homogenize the 3D coordinates of semilandmarks along curves and surfaces.
- https://cdn.elifesciences.org/articles/83413/elife-83413-code2-v1.zip
Download links
A two-part list of links to download the article, or parts of the article, in various formats.
Downloads (link to download the article as PDF)
Open citations (links to open the citations from this article in various online reference manager services)
Cite this article (links to download the citations from this article in formats compatible with various reference manager tools)
Femora from an exceptionally large population of coeval ornithomimosaurs yield evidence of sexual dimorphism in extinct theropod dinosaurs
eLife 12:e83413.
https://doi.org/10.7554/eLife.83413


