Complex plumages spur rapid color diversification in kingfishers (Aves: Alcedinidae)
- Grainger Bioinformatics Center, Field Museum of Natural History, United States
- Negaunee Integrative Research Center, Field Museum of Natural History, United States
- Department of Biology and Museum of Southwestern Biology, University of New Mexico, United States
Figures
Figure 1 with 2 supplements

Illustrative guide to methods used to study kingfisher plumage coloration.
(A) Flow chart depicting our process: (1) spectrophotometry of 22 plumage patches on closed-wing museum specimens, (2) conversion of data to tetrahedral colorspace coordinates, and (3) different ways we analyzed these data across the kingfisher phylogeny. We analyzed how individual patch colors evolved using multivariate comparative methods (3a). To estimate complexity at the intraspecific level (3b), we calculated three different metrics for each tip in the phylogeny: average pairwise distance among color patches (metric c1); the color volume (i.e., range) of all plumage patches in colorspace (metric c2); and the number of contiguous color patches that would be perceived as the same color by a bird (metric c3). We calculated interspecific rates of overall plumage color evolution using multivariate rate tests (3c). (B) We predicted faster rates of color evolution on islands (blue line) and in species with more complex plumages. Yet, there are examples of cases in which this relationship may be reversed (e.g., see insets showing species pairs with simple plumages and diverse colors, left, as well as complex plumages and similar colors, right). Illustrations created by Jenna McCullough.
Figure 1—figure supplement 1
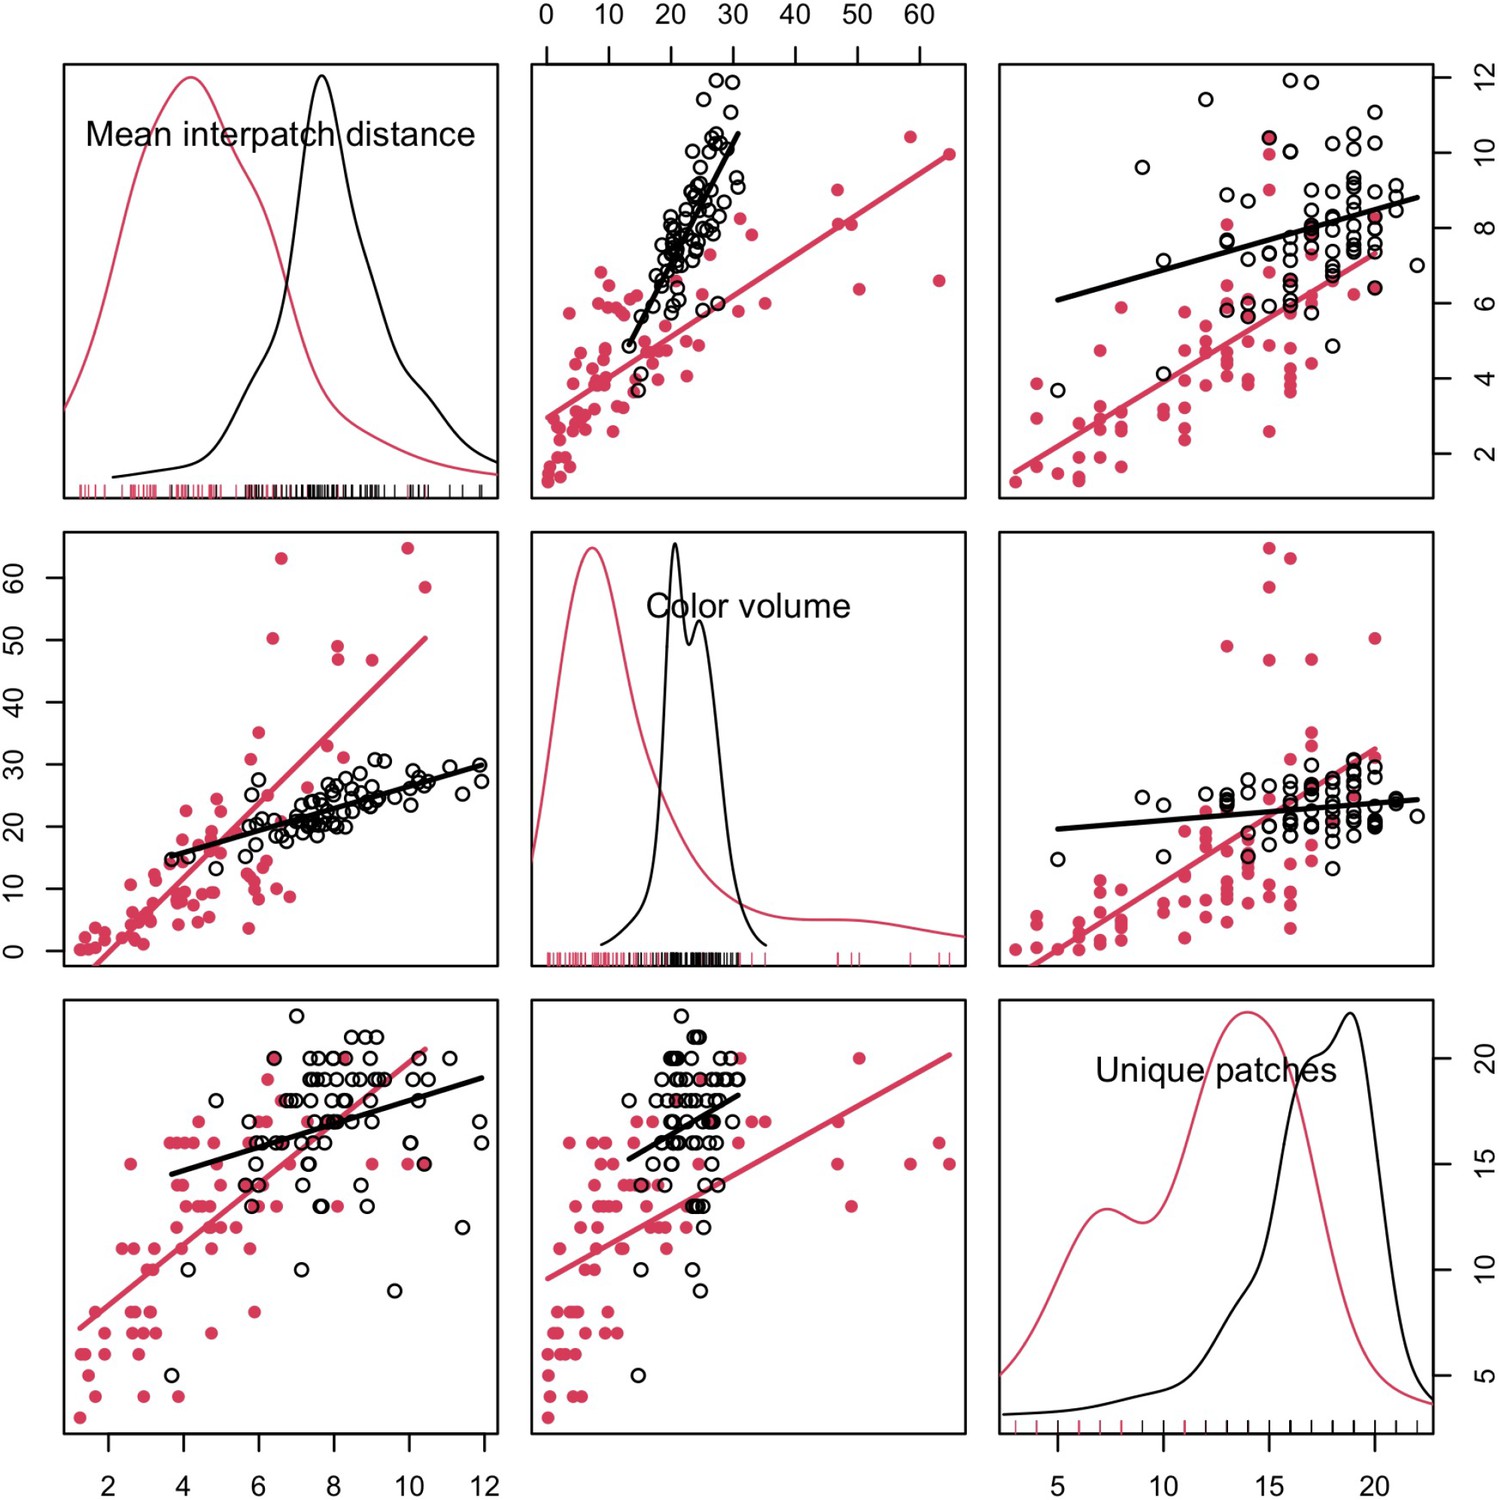
Complexity metrics are correlated.
Data shown for both chromatic (XYZ coordinates in tetrahedral colorspace; red, filled circles) and achromatic components of plumage signals (luminance values; black, open circles). Points are species averages for the combined data set (i.e., both males and females).
Figure 1—figure supplement 2
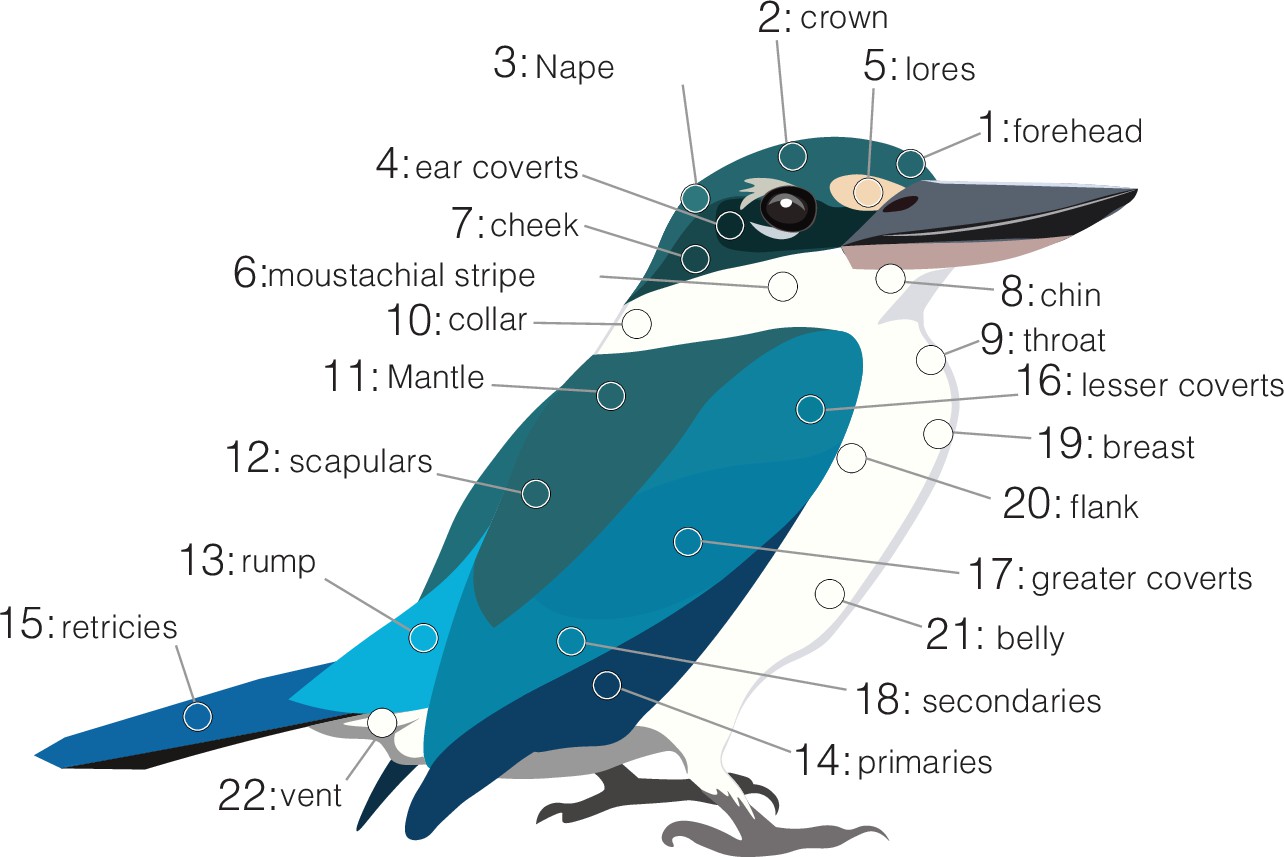
Plumage patches measured in kingfishers.
Patch numbers correspond to those in Figure 1A.
Figure 2
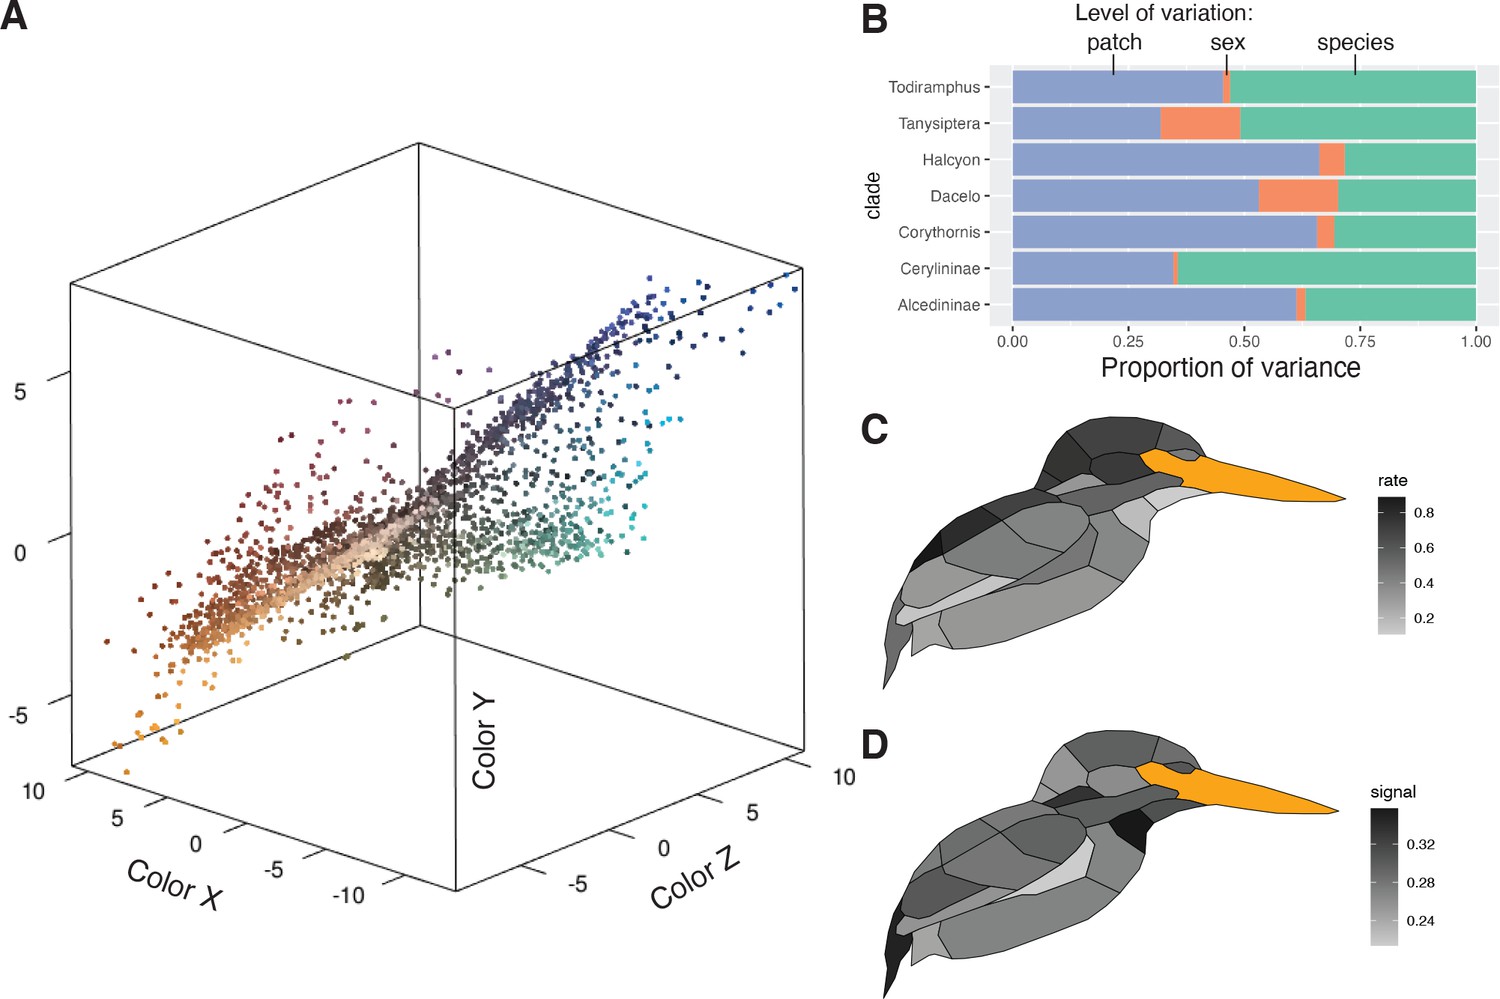
Perceptually uniform colorspace and color variation in kingfishers.
(A) Color data, with points being the average of three plumage patch measurements for each individual (N = 3101). Colors are estimated from a human visual system using spec2rgb in pavo (Maia et al., 2013a). Distance between patches is proportional to the just noticeable differences (JNDs), assuming a UV-sensitive visual system (Parrish et al., 1984). (B) Proportional color variance among patches in an individual (violet), between sexes in a species (orange), and among species in a clade (green). Low variation between sexes was further confirmed with a multivariate phylogenetic integration test (r-PLS = 0.88, p < 0.01). Clades with more complex plumages (e.g., Alcedininae) tend to have a higher proportion of among-patch variation. (C) Distribution of multivariate evolutionary rates and (D) phylogenetic signal of color evolution across the body (darker colors indicate higher values).
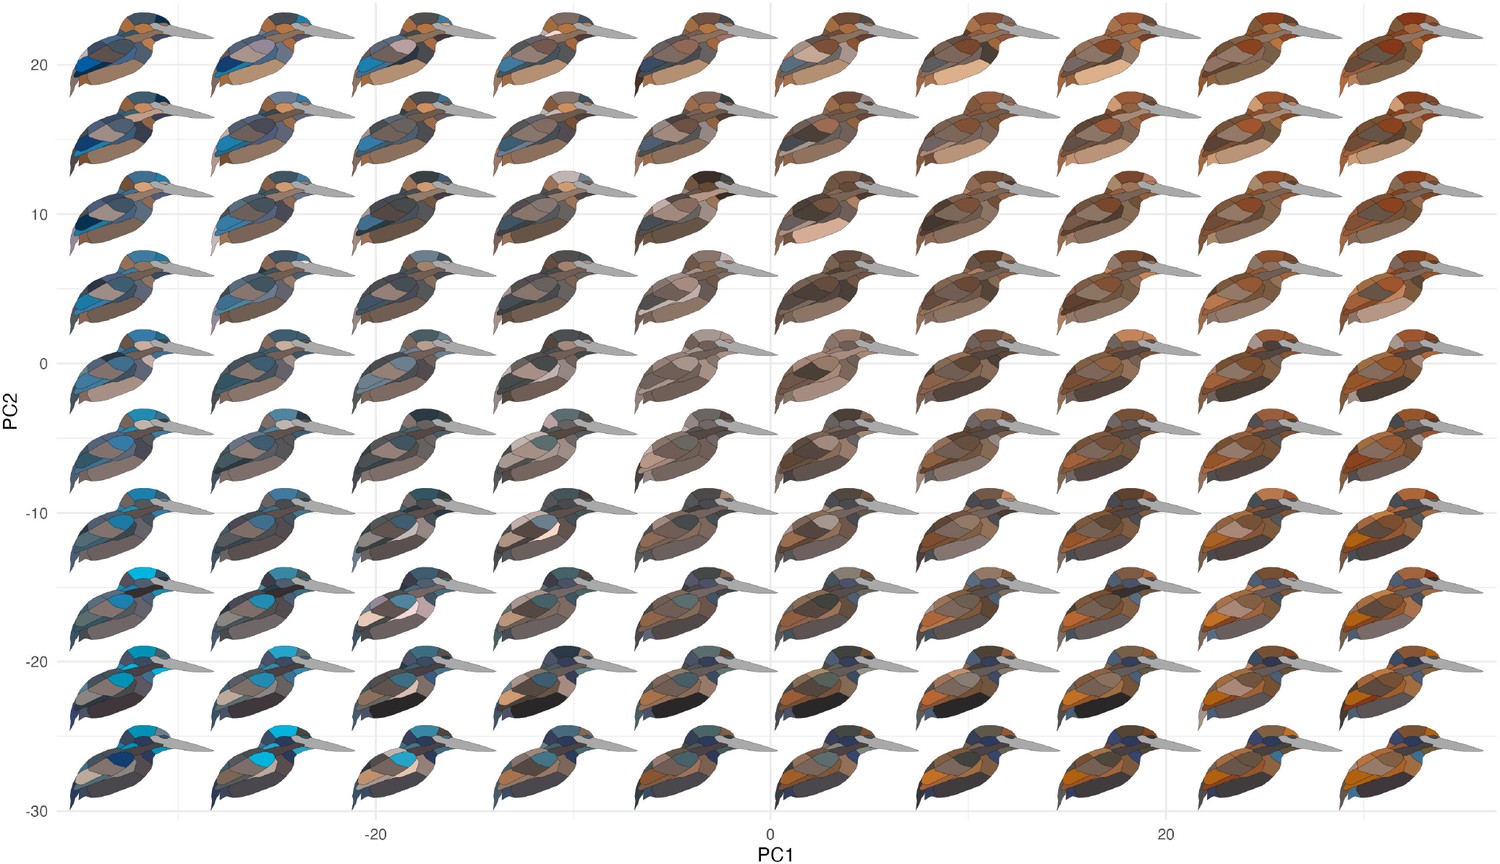
Figure 3 with 1 supplement
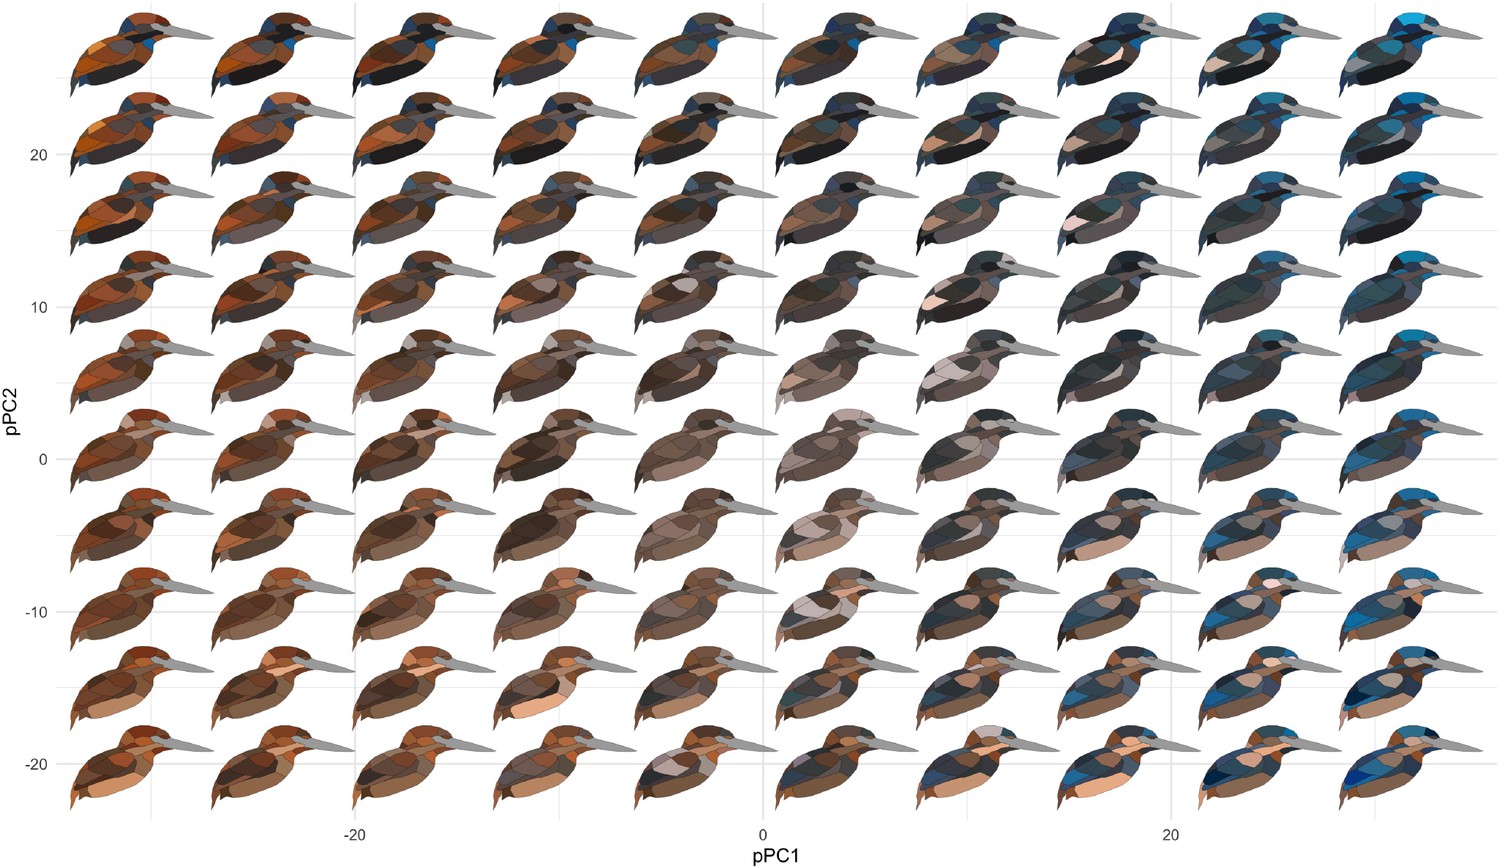
Color pattern morphospace of kingfishers.
Bird images show depictions of color in a human visual system based on spectral measurements over a grid of phylogenetic principal components analysis (pPCA) coordinates. Axes shown are pPC axes 1 and 2, together accounting for >50% of plumage color variation in the clade.
Figure 3—figure supplement 1
Color pattern morphospace of kingfishers.
Bird images show depictions of color in a human visual system based on spectral measurements over a grid of ordinary principal components analysis (PCA) coordinates. PCA axes PC1 and PC2 are shown, together accounting for >50% of plumage color variation in the clade.
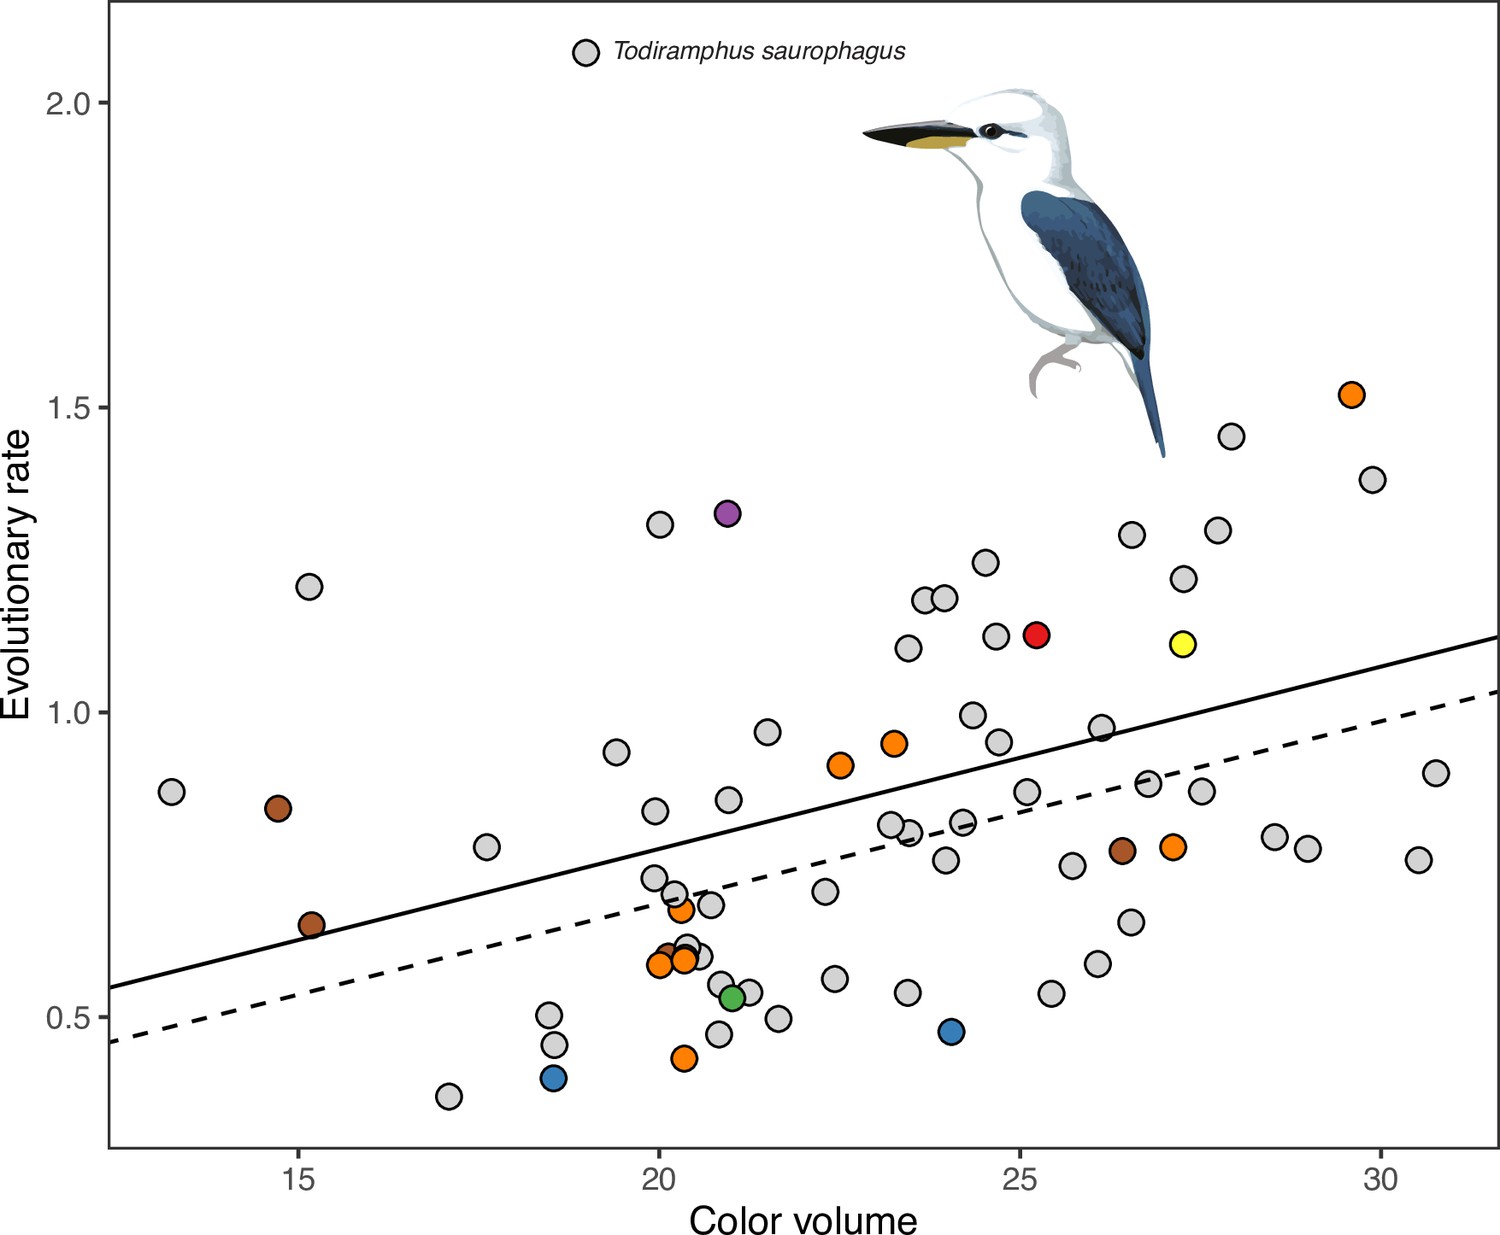
Figure 4 with 3 supplements
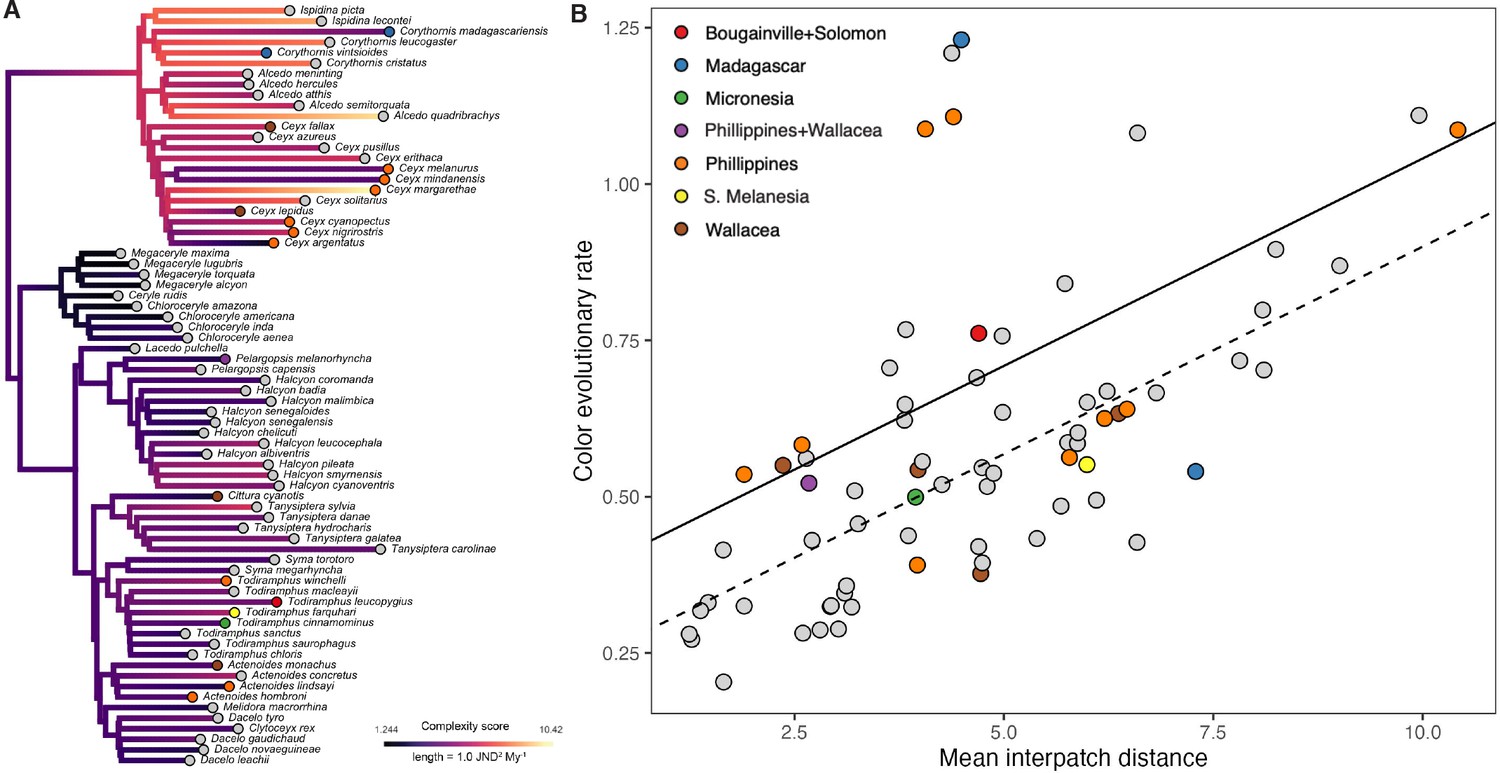
Species with complex plumages have faster rates of color evolution.
(A) Phylogeny showing evolution of plumage color complexity, with edge colors corresponding to ancestral states of plumage complexity (mean interpatch color distance within a species, corresponding to metric c1 in Figure 1) and edge lengths proportional to color evolutionary rates (see legend). Tip colors correspond to different island systems (see legend in B), with continental species in gray. (B) Significant relationship between color evolutionary rates and plumage complexity (p < 0.01). Effect of island-dwelling (p = 0.02) is indicated by line type (dashed: continental, solid: island species). See Table 1 for statistical results and Figure 4—figure supplement 3 for results with analyzing achromatic variation in plumage.
Figure 4—figure supplement 1
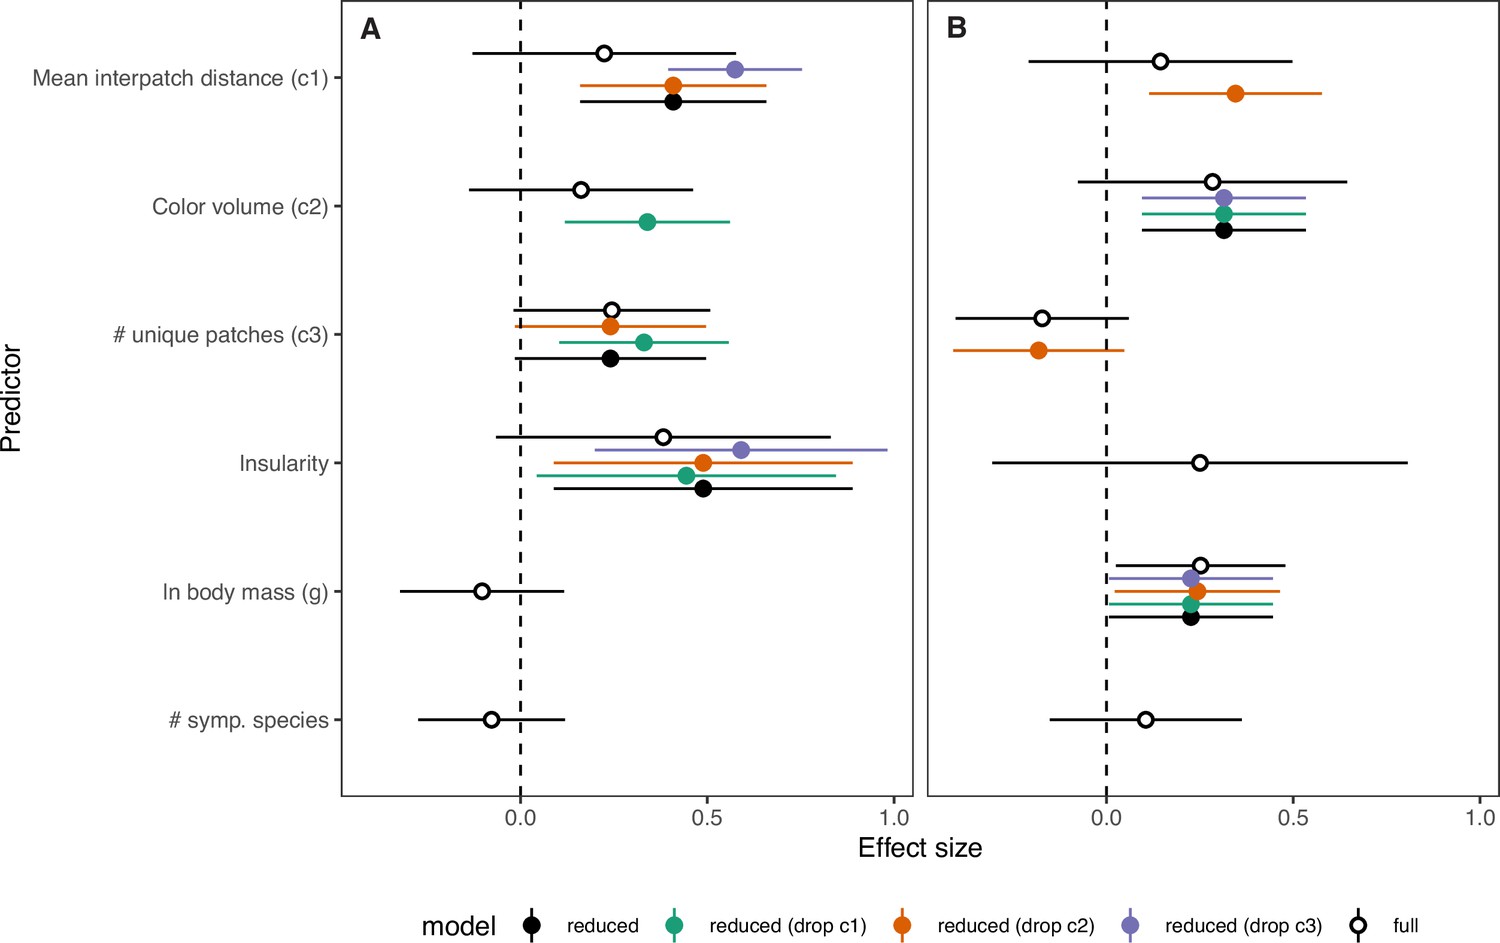
Full PGLS results compared to various submodels explaining chromatic and achromatic rate variation.
Panels show estimated slopes (points) and 95% confidence intervals (horizontal lines) for predictors of chromatic rate variation (A) and achromatic rate variation (B) in kingfishers (N = 72). Fill color corresponds to the full additive model with all variables included (white), the best-fitting reduced model (black), and alternate reduced models with dropping complexity metrics c1 (green), c2 (orange), and c3 (purple) to assess potential influence of multicollinearity. Note: (1) wider confidence intervals for the full additive model (expected with six variables in the model) and (2) similar effect sizes with alternative formulations for most predictors.
Figure 4—figure supplement 2
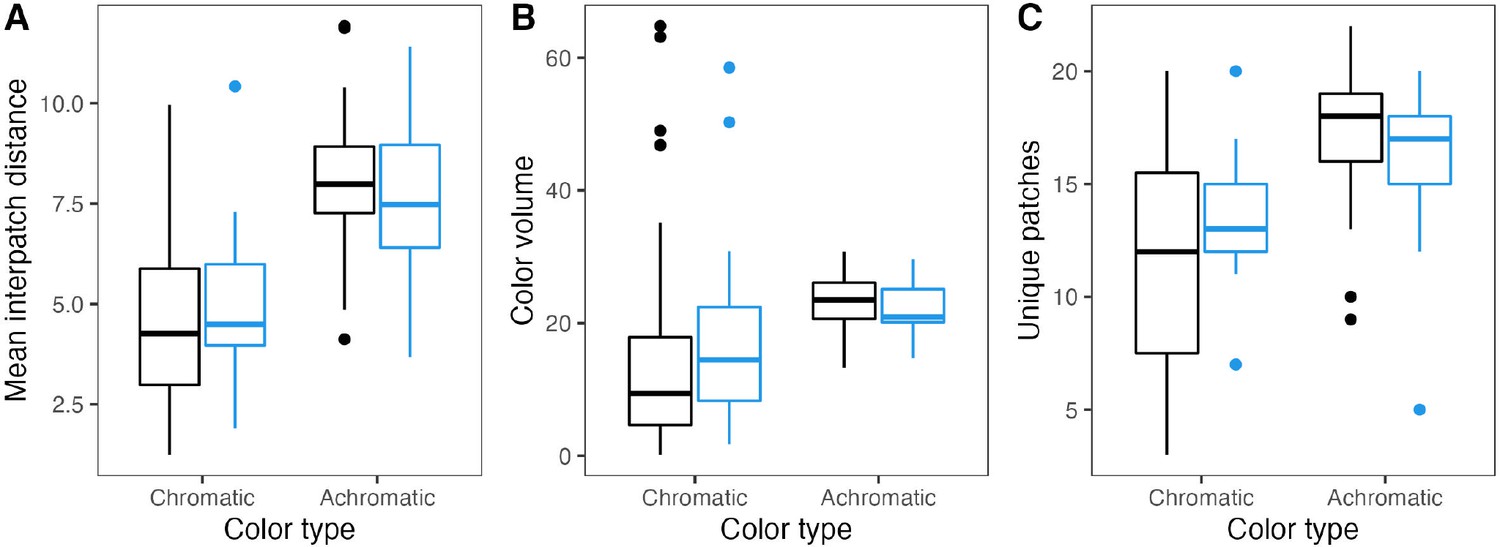
Islands and plumage complexity.
There are no significant differences in plumage complexity between mainland (black) and island species (blue). Panels show different chromatic and achromatic complexity metrics: mean interpatch color distance (A), plumage color volume (B), and number of unique color patches (C). See Supplementary file 1d for statistical results.
Figure 4—figure supplement 3
Achromatic rate variation is associated with lightness range (metric c2) but not insularity.
Plot shows relationship between achromatic evolutionary rates and achromatic plumage complexity (i.e., the range of luminance JND values). Lines indicate regression estimates for continental (dashed) and insular species (solid). See Table 1, Figure 4—figure supplement 1 for additional details.
Figure 5

No support for convergence of color patterns on islands.
Phylogenetic principal components analysis (pPCA) plot with points colored by continental (gray) and island species (see legend). Distance-based PGLS analyses suggest island and mainland species are not significantly different in plumage coloration (F = 1.84, p = 0.09). See inset for interpretation of pPC values and Table 3 for full statistical results.
Tables
Table 1
Plumage complexity predicts rates of color evolution among species.
Models were fit using PGLS in the phylolm R package, with species-specific evolutionary rates as the response variable and complexity metrics (c1, c2, and c3), island-dwelling, natural log body mass, and number of sympatric species as predictors. The best-fitting models were determined using a stepwise AIC-based procedure using the phylostep function in phylolm. Significant predictors in the most parsimonious models are indicated in bold. See Supplementary file 1b for sex-specific results and Figure 4—figure supplement 1 for results with the full model and alternate submodels.
| Response | Predictor | Effect | p | λ | R2 |
|---|---|---|---|---|---|
| Chromatic rate | Mean interpatch distance (c1) | 0.41 ± 0.13 | <0.01 | 0.00 | 0.45 |
| # unique patches (c3) | 0.24 ± 0.13 | 0.07 | ... | ... | |
| Insularity | 0.49 ± 0.20 | 0.02 | ... | ... | |
| Achromatic rate | Lightness range (c2) | 0.31 ± 0.11 | <0.01 | 0.00 | 0.14 |
| ln body mass | 0.23 ± 0.11 | 0.05 | ... | ... |
Table 2
Predictors of plumage complexity.
Models were fit for both chromatic (i.e., hue and saturation) and achromatic variables (i.e., plumage lightness) using PGLS in the phylolm R package. Different complexity metrics (see Figure 1 for details) were set as the response variable, and island-dwelling, ln body mass, and number of sympatric species were used as predictors. The best-fitting models were determined using a stepwise AIC-based procedure (i.e., using the phylostep function). Significant predictors are indicated in bold. See Supplementary file 1d for sex-specific results.
| Data type | Response | Predictor | Effect | p | λ | R2 |
|---|---|---|---|---|---|---|
| Chromatic | Interpatch dist. (c1) | ln mass | −0.34 ± 0.14 | 0.02 | 0.41 | 0.08 |
| Color volume (c2) | ln mass | −0.33 ± 0.14 | 0.02 | 0.18 | 0.07 | |
| # unique patches (c3) | ln mass | −0.31 ± 0.15 | 0.05 | 0.51 | 0.05 | |
| Achromatic | Lightness range (c2) | Insularity | −0.60 ± 0.27 | 0.03 | 0.00 | 0.11 |
| Lightness range (c2) | # symp. species | −0.32 ± 0.12 | 0.01 | ... | ... | |
| # unique patches (c3) | Insularity | −0.41 ± 0.26 | 0.12 | 0.15 | 0.03 |
Table 3
Multivariate plumage color is not significantly different on islands.
Results of multivariate distance-based PGLS (d-PGLS) tests testing for convergence in overall plumage coloration on islands. Both chromatic (i.e., hue and saturation) and achromatic plumage variables (i.e., lightness) were considered. p values were calculated with a permutation approach using 999 iterations. See Figure 5 for details and Supplementary file 1e for sex-specific results.
| Response | Predictor | F | p | Ntraits | Nspecies |
|---|---|---|---|---|---|
| Multivariate color | Insularity | 1.84 | 0.09 | 66 | 72 |
| # sympatric species | 0.35 | 0.94 | ... | ... | |
| In body mass | 1.14 | 0.32 | ... | ... | |
| Multivariate lightness | Insularity | 0.83 | 0.59 | 22 | 72 |
| # sympatric species | 1.14 | 0.32 | ... | ... | |
| In body mass | 1.67 | 0.11 | ... | ... |
Additional files
-
Supplementary file 1
Supplementary tables.
(a) Evolutionary model fits using multivariate color data sets. (b) Predictors of rates of color evolution when analyzing males and females separately. (c) Evolutionary rates tests using discrete plumage complexity scores. (d) Predictors of plumage complexity for males and females analyzed separately. (e) Testing predictors of shifts in average plumage hue and brightness. (f) Full PGLS regression results for predictors of chromatic rate variation. (g) Full PGLS regression results for predictors of achromatic rate variation.
- https://cdn.elifesciences.org/articles/83426/elife-83426-supp1-v1.docx
-
MDAR checklist
- https://cdn.elifesciences.org/articles/83426/elife-83426-mdarchecklist1-v1.pdf
Download links
A two-part list of links to download the article, or parts of the article, in various formats.
Downloads (link to download the article as PDF)
Open citations (links to open the citations from this article in various online reference manager services)
Cite this article (links to download the citations from this article in formats compatible with various reference manager tools)
Complex plumages spur rapid color diversification in kingfishers (Aves: Alcedinidae)
eLife 12:e83426.
https://doi.org/10.7554/eLife.83426


