Protein feeding mediates sex pheromone biosynthesis in an insect
- Department of Entomology, South China Agricultural University, China
- Department of Entomology, Hebrew University of Jerusalem, Israel
- Department of Insect Symbiosis, Max Planck Institute for Chemical Ecology, Germany
Figures
Figure 1

Influence of post-teneral protein and sugar feeding on male flies.
(A) A schematic showing how the male flies were reared and the biological parameters compared. (B) Effect of post-teneral protein and sugar on survival (n=200 individuals, Kaplan‒Meier survival analysis was used, and NS: no significance). (C) Rectum size comparisons between yeast hydrolysate (YH)-deprived (YH−) and YH-fed (YH+) males (n=40 individuals, Student’s t test, and NS: no significance). (D) Gas chromatography‒mass spectrometry (GC‒MS) ion chromatograms of rectum extracts of males fed different types of food. Traces for the flies fed with YH expressing trimethylpyrazine (TMP; red arrow) and tetramethylpyrazine (TTMP; blue arrow) are shown. (E) and (F) GC‒MS mass spectra of TMP and TTMP. (G) Mating ability comparisons between YH− and YH+ males (n=5 replicates, Wilcoxon matched-pairs signed rank test, and *** p<0.001). In violin plots, where the violin encompass the first to the third quartiles, inside the violin the horizontal line shows the median.
-
Figure 1—source data 1
Raw data used for analysis in Figure 1A, B and F.
- https://cdn.elifesciences.org/articles/83469/elife-83469-fig1-data1-v2.xlsx
Figure 2 with 1 supplement
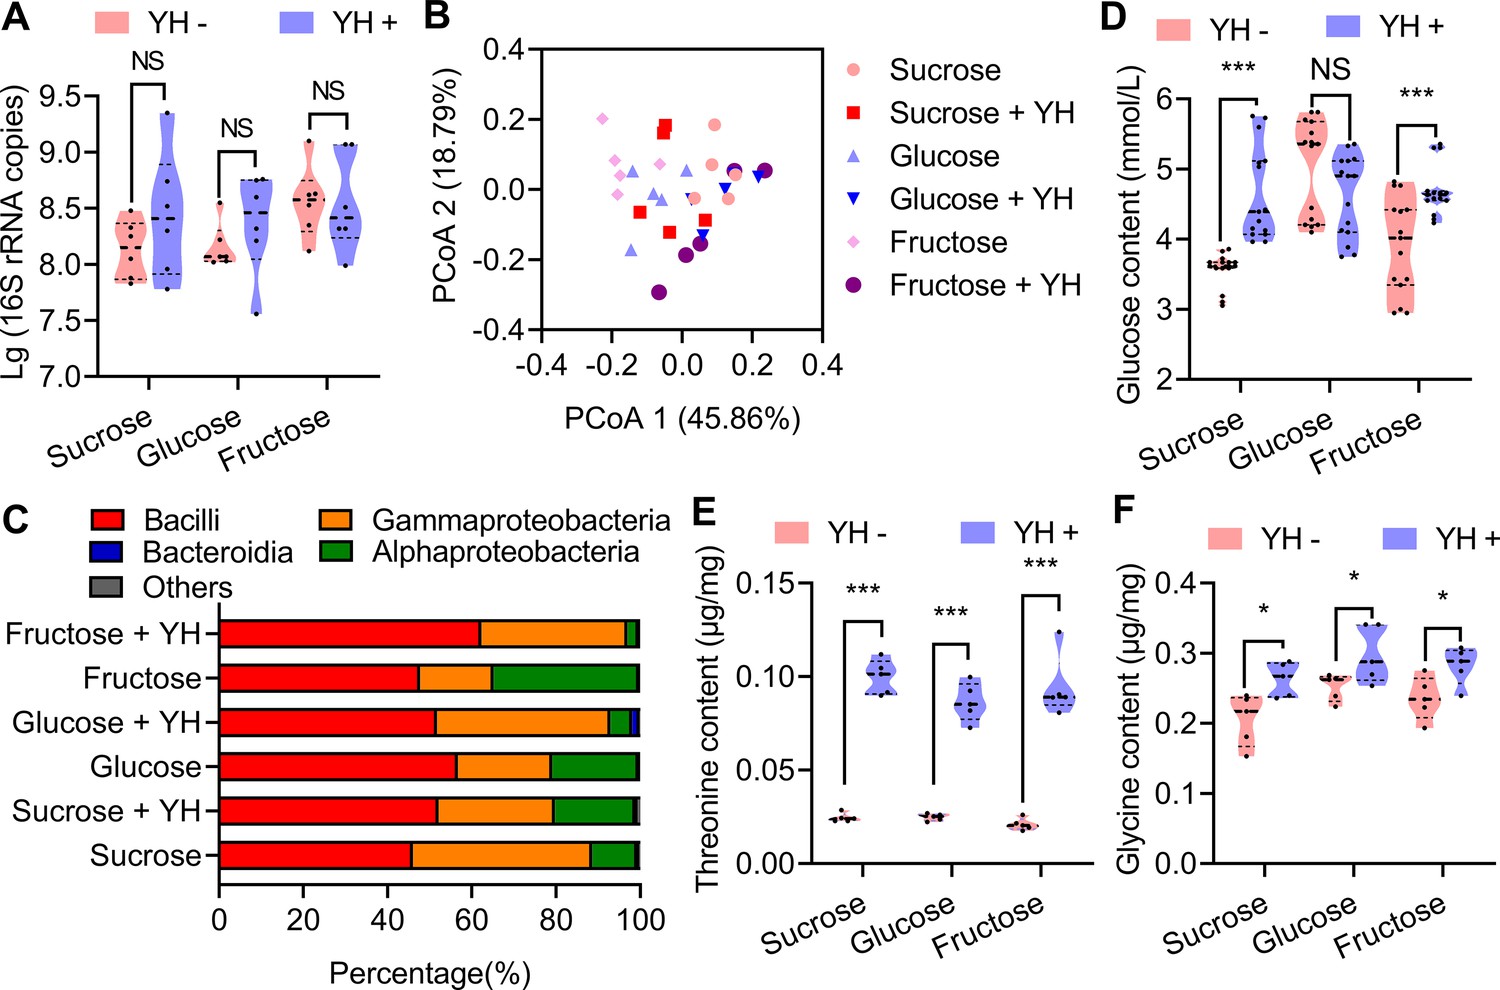
Influence of post-teneral protein on rectal bacteria and sex pheromone precursors.
(A) Boxplot showing total bacteria in the male rectum estimated from 16S rRNA gene quantitative PCR (qPCR; n=6 replicates, Student’s t test, and NS: no significance). (B) Principal coordinate analysis of the microbial community structure (beta diversity and class level) measured by the Bray‒Curtis distance matrix of 16S rRNA gene amplicon sequences. (C) Class-level relative abundance of 16S rRNA gene amplicon sequences. Values are averaged according to yeast hydrolysate (YH)-deprived and YH-supplied males. (D), (E), and (F) Influence of YH supply on rectum glucose (n=15 replicates), threonine (n=5 replicates), and glycine (n=5 replicates) contents (Student’s t test, NS: no significance, * p<0.05, and *** p<0.0001). In violin plots, where the violin encompass the first to the third quartiles, inside the violin the horizontal line shows the median.
-
Figure 2—source data 1
Raw data used for analysis in Figure 2A, D, E and F.
- https://cdn.elifesciences.org/articles/83469/elife-83469-fig2-data1-v2.xlsx
Figure 2—figure supplement 1
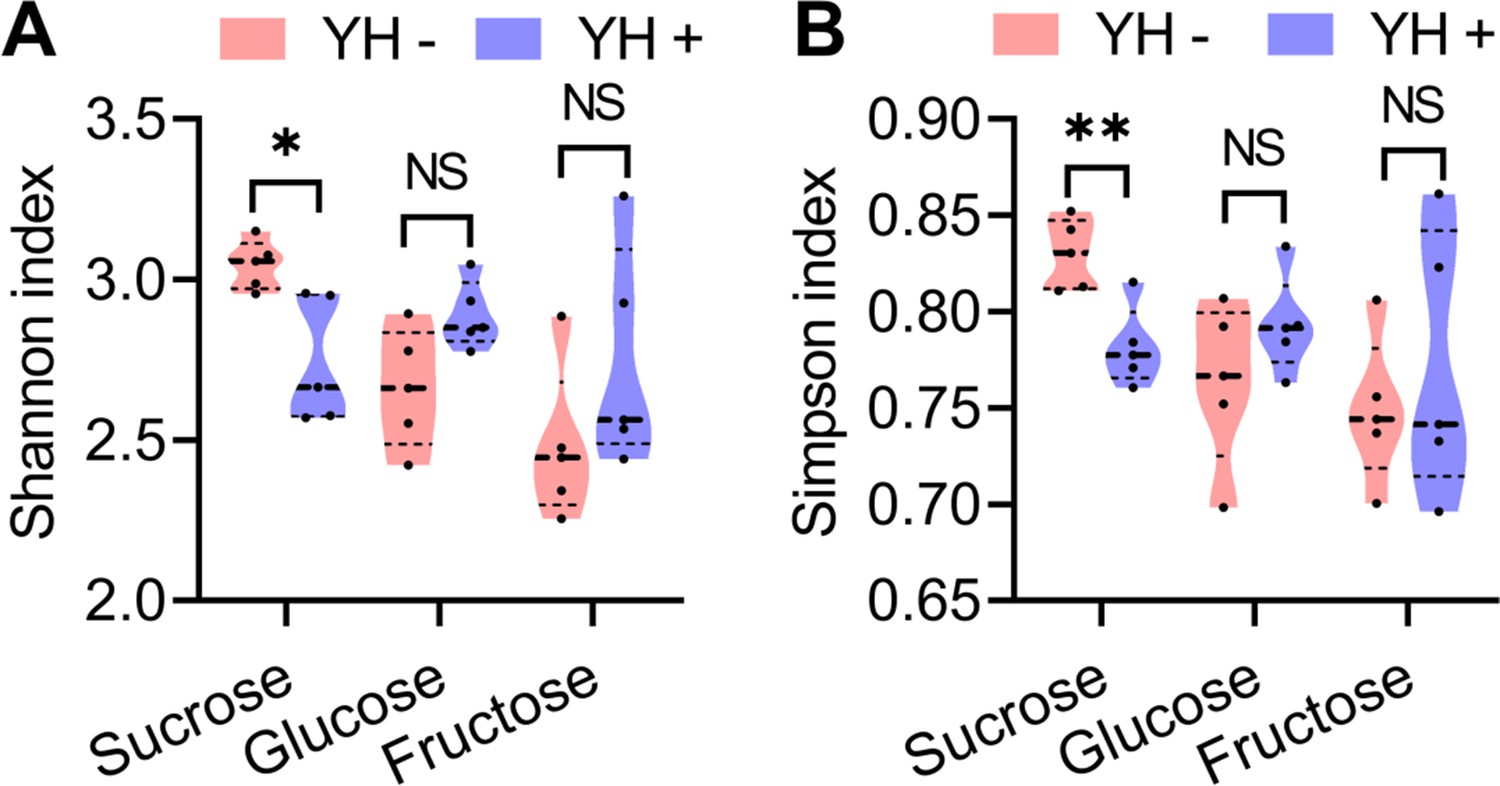
Boxplots showing the estimated diversity of the microbial community based on Shannon (A) and Inverse Simpson (B) indices of the 16S amplicon sequences (n=5 replicates, Student’s t test, NS: no significance, * p<0.05, and ** p<0.001).
In violin plots, where the violin encompass the first to the third quartiles, inside the violin the horizontal line shows the median.
Figure 3 with 2 supplements

Transcriptome comparisons between yeast hydrolysate (YH)-fed and YH-deprived males.
(A) Principal component analysis (PCA) obtained from gene expression profiles showing differences between YH-fed and YH-deprived males. Flies are clustered according to YH fed or not. (B) Pearson correlation coefficient showing the similarity between the samples. Higher similarity of the transcriptome is shown by a darker blue color (higher correlation coefficient). (C) Table showing the number of genes found in any given category and the genes involved in the threonine metabolism pathway between comparisons. (D) Quantitative PCR (qPCR) verifying the expression of Sardh in YH-fed and YH-deprived males (n=5 replicates, Student’s t test, and *** p<0.001). In violin plots, where the violin encompass the first to the third quartiles, inside the violin the horizontal line shows the median. (E) Proposed model of the threonine metabolism pathway in insects.
-
Figure 3—source data 1
Raw data used for analysis in Figure 3C.
- https://cdn.elifesciences.org/articles/83469/elife-83469-fig3-data1-v2.xlsx
-
Figure 3—source data 2
Raw data used for analysis in Figure 3A and D.
- https://cdn.elifesciences.org/articles/83469/elife-83469-fig3-data2-v2.xlsx
Figure 3—figure supplement 1
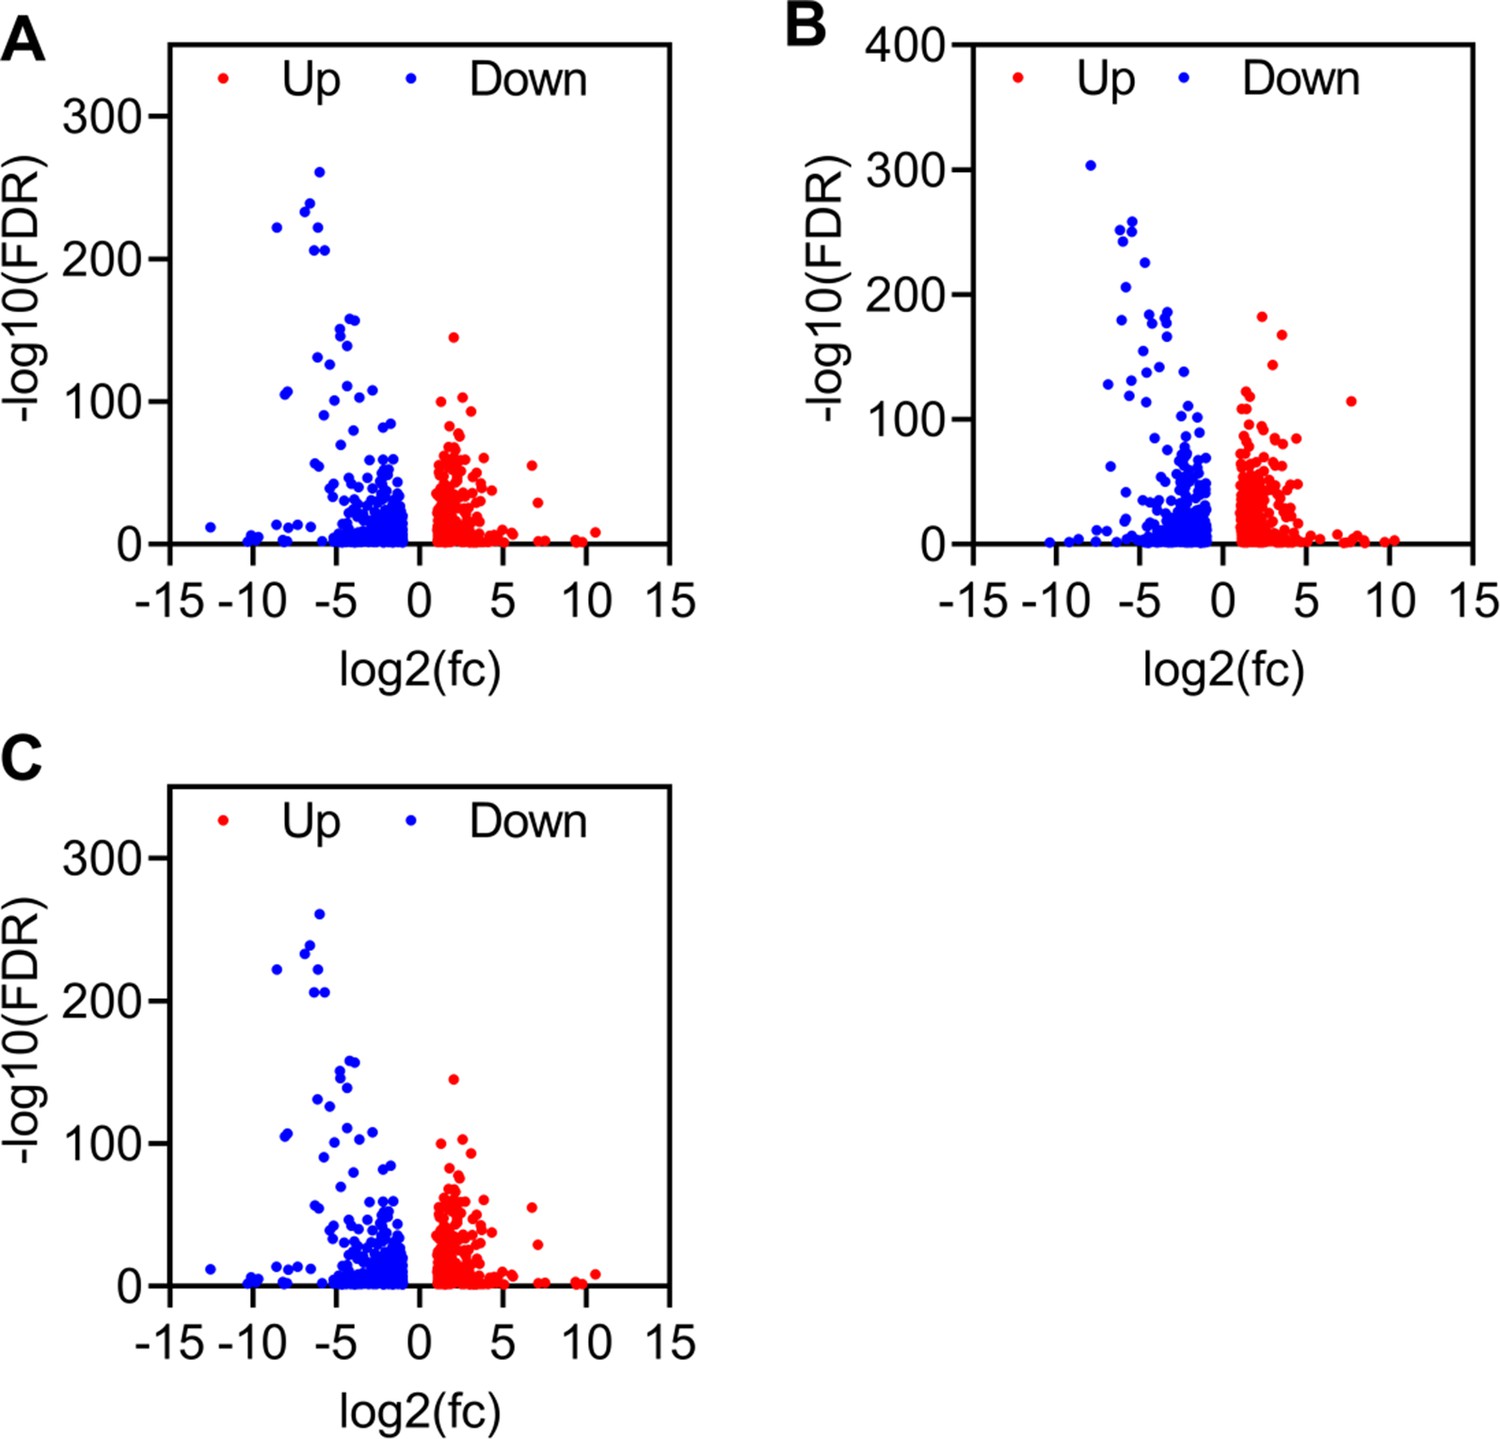
Differential expressed genes in sucrose (A), glucose (B), and fructose (C) groups.
Figure 3—figure supplement 2
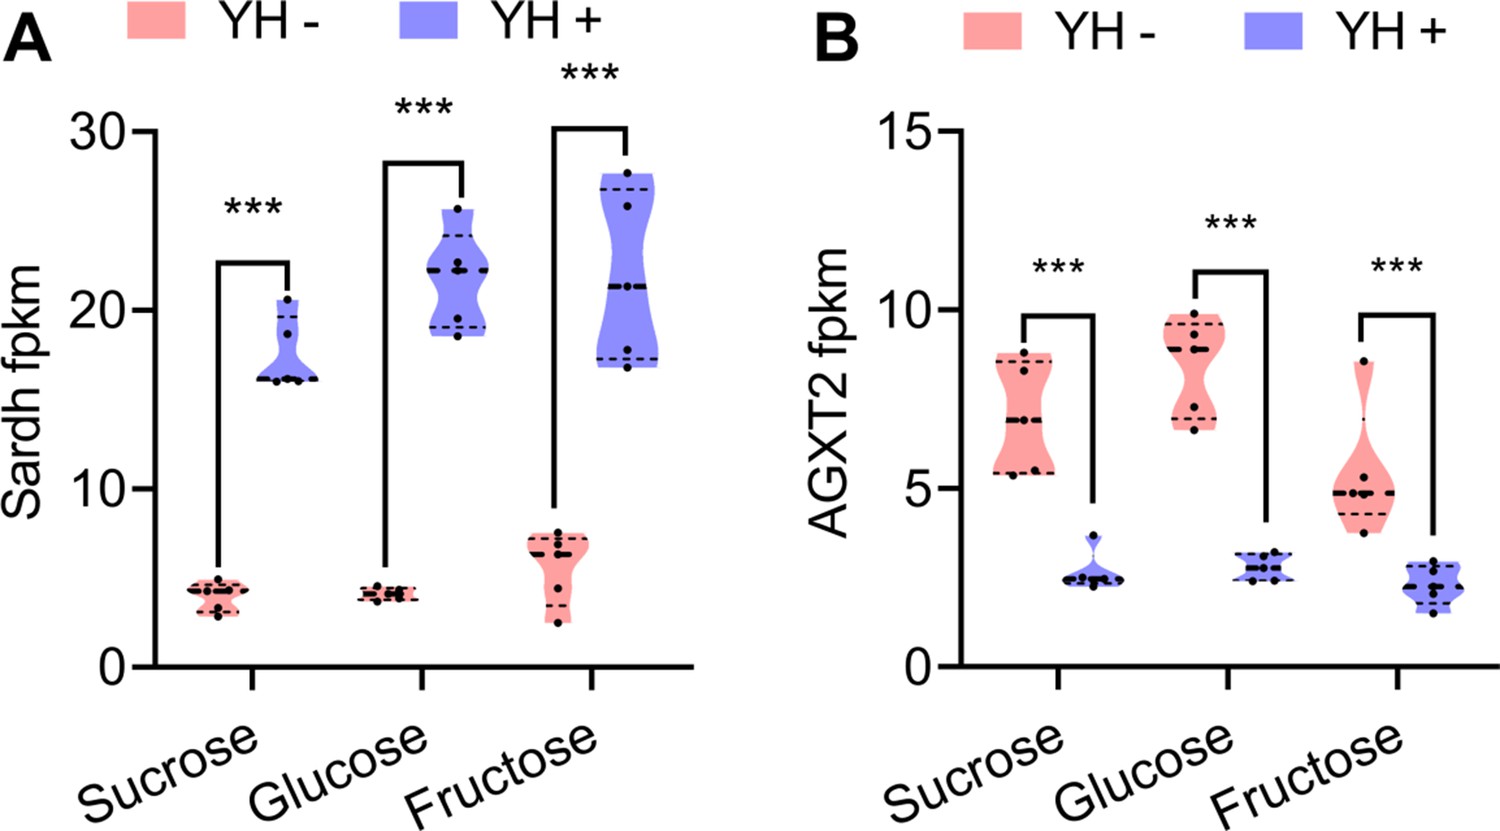
Fragments Kilobase of exon model per millon mapped reads(fpkm) values of the differentially expressed genes in glycine, serine, and threonine metabolism pathway (n=5 replicates, Student’s t test, and *** p<0.0001).
In violin plots, where the violin encompass the first to the third quartiles, inside the violin the horizontal line shows the median.
Figure 4 with 1 supplement

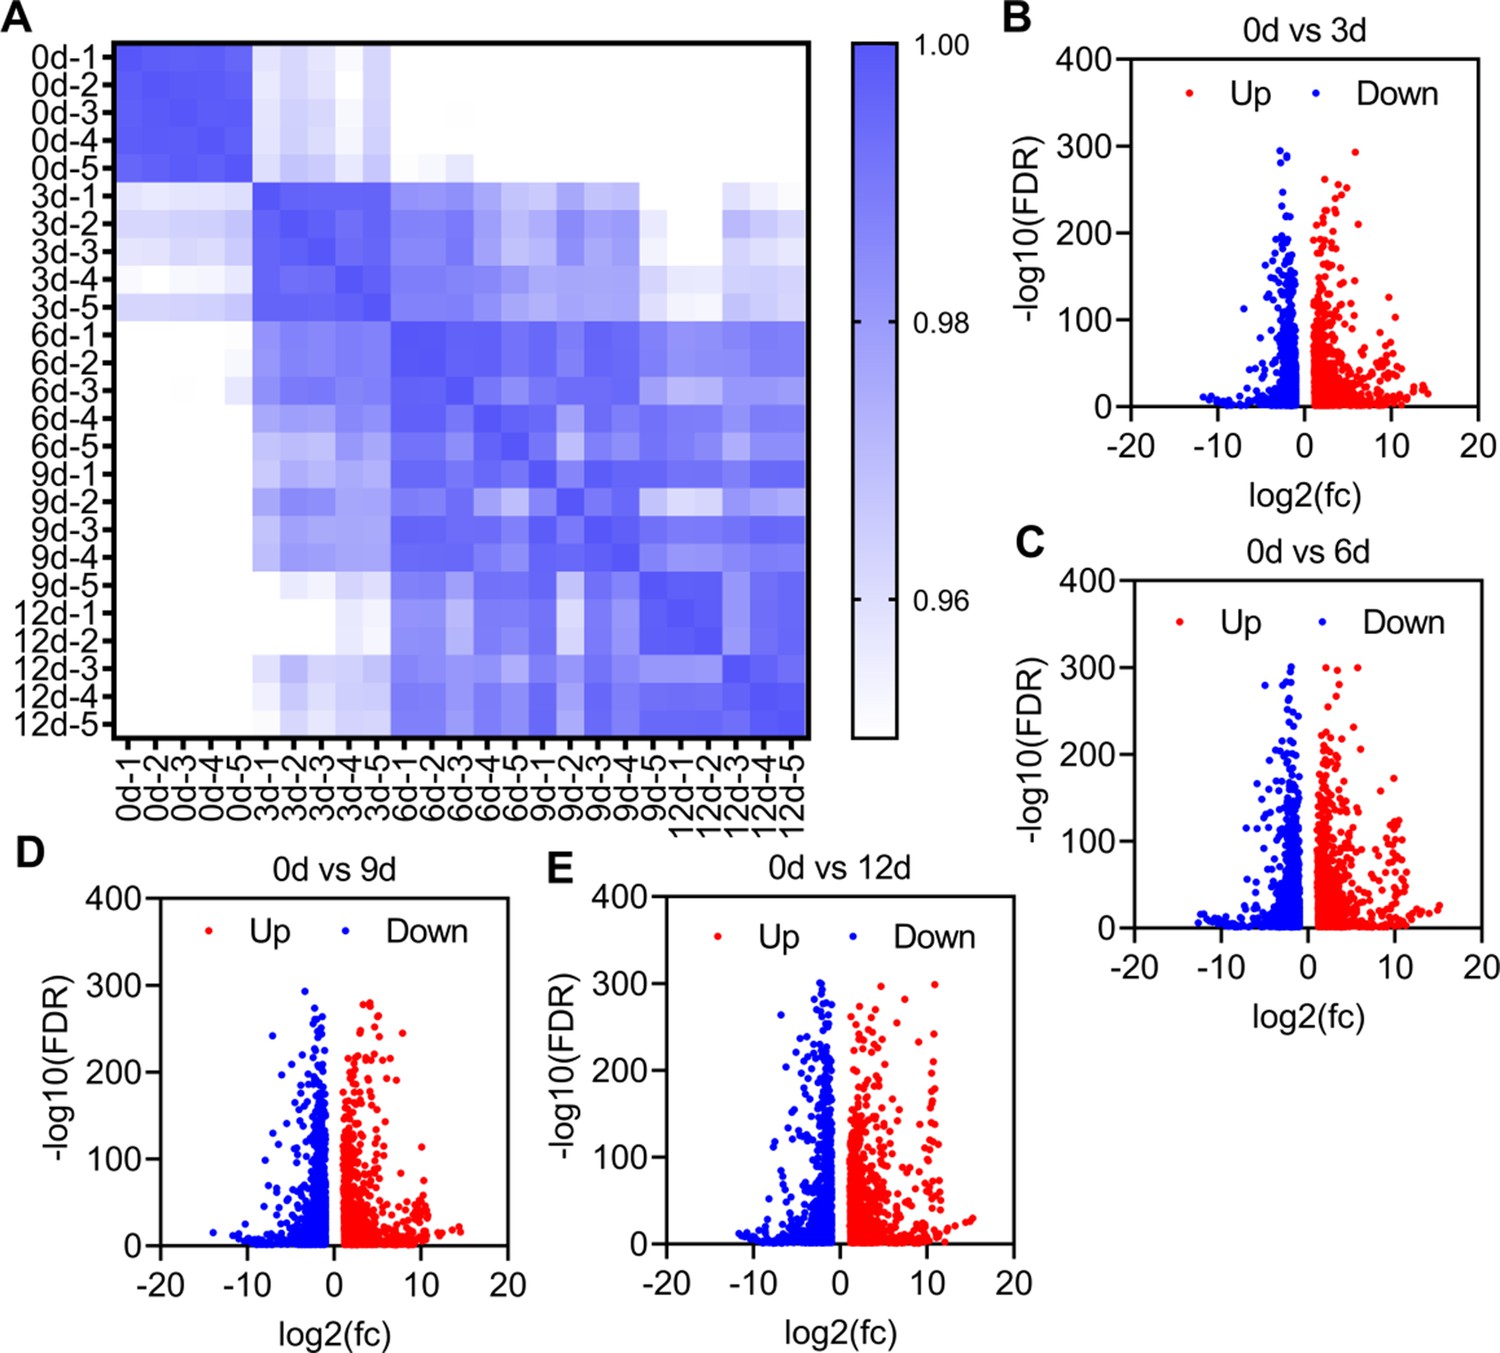
Amino acid contents and transcriptome investigation of male rectums at different developmental stages.
(A and B) Threonine (n=5 replicates) and glycine (n=5 replicates) contents in the rectum at different developmental stages (different letters above the error bars indicate significant differences at the 0.05 level analyzed by ANOVA followed by Tukey’s test). (C) Principal component analysis (PCA) using differential expression (DE) genes obtained from pairwise comparisons between different developmental stages. (D and E) Expression profiles of Sardh obtained by RNA-seq and quantitative PCR (qPCR; n=5 replicates, different letters above the error bars indicate significant differences at the 0.05 level analyzed by ANOVA followed by Tukey’s test). In violin plots, where the violin encompass the first to the third quartiles, inside the violin the horizontal line shows the median.
-
Figure 4—source data 1
Raw data used for analysis in Figure 4A, B, D and E.
- https://cdn.elifesciences.org/articles/83469/elife-83469-fig4-data1-v2.xlsx
Figure 4—figure supplement 1
Transcriptome comparisons between different development stages.
(A) Pearson correlation coefficient showing the similarity between the samples. Higher similarity of the transcriptome was shown by darker blue color (higher correlation coefficient). (B–E) Differential expressed genes between different development stages.
Figure 5 with 1 supplement
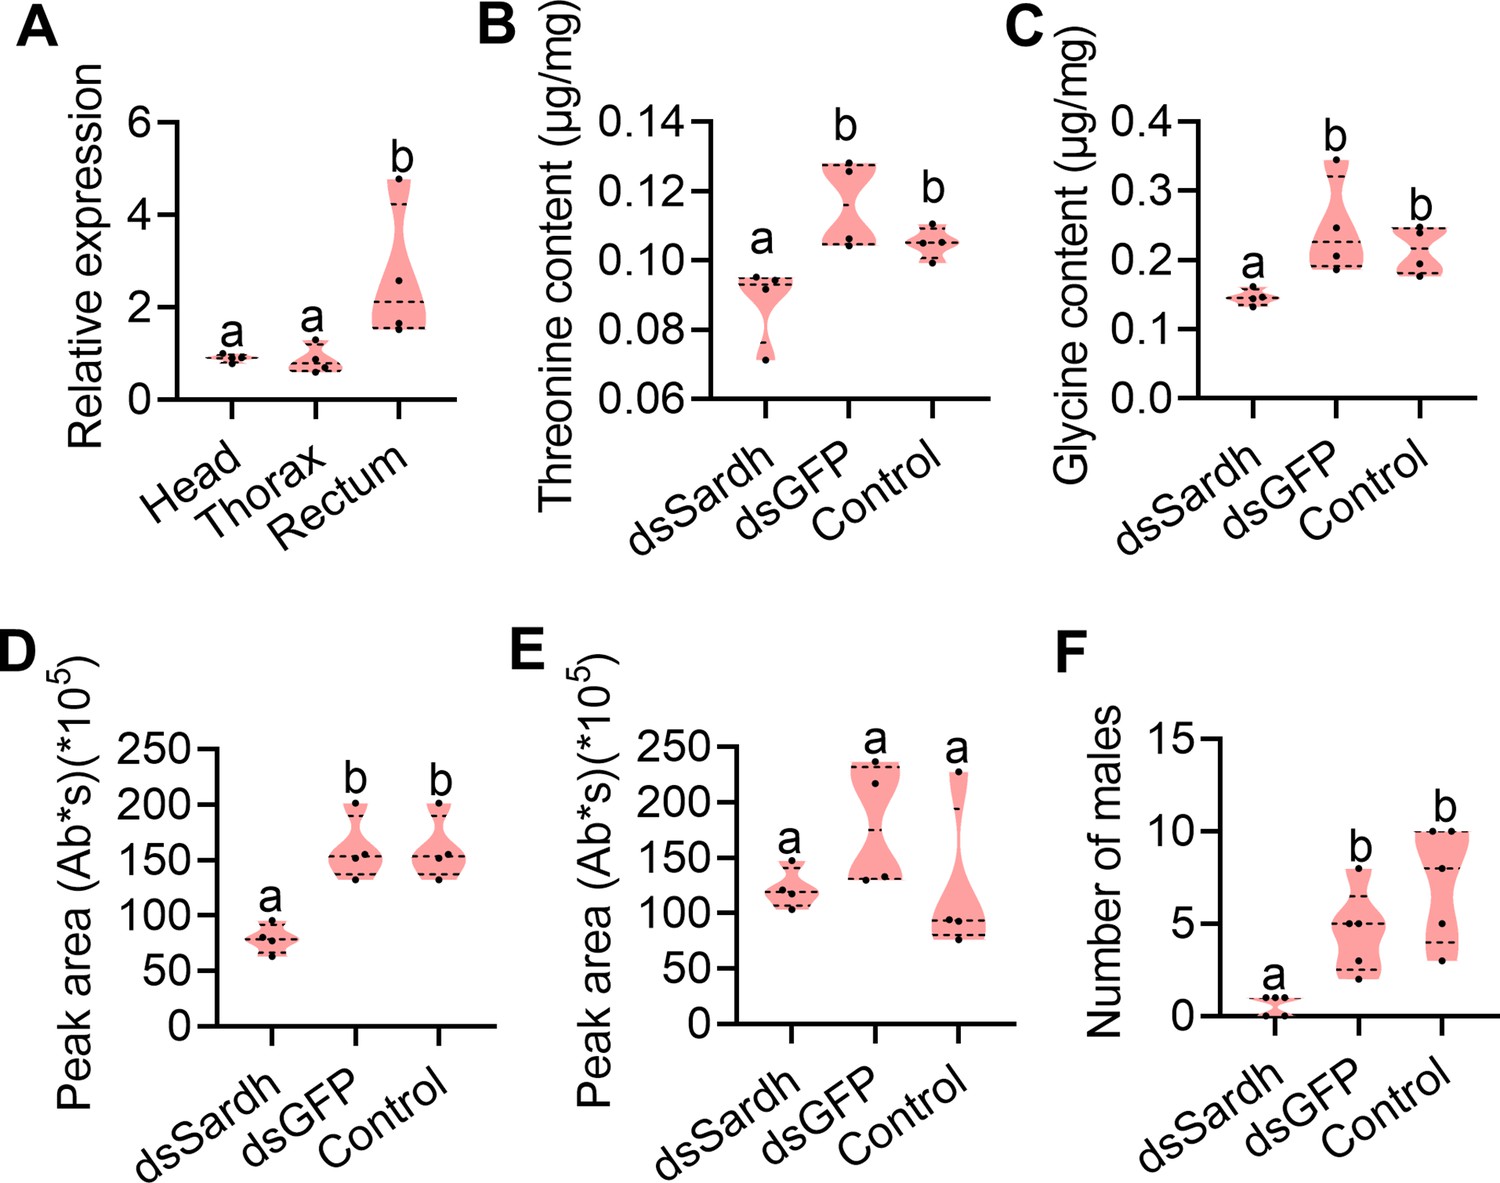
Functional verification of Sardh in sex pheromone biosynthesis.
(A) Expression of Sardh in different tissues with quantitative PCR (qPCR; n=5 replicates, different letters above the error bars indicate significant differences at the 0.05 level analyzed by ANOVA followed by Tukey’s test). (B and C) Threonine (n=5 replicates) and glycine (n=5 replicates) contents in the rectum with Sardh knockdown (different letters above the error bars indicate significant differences at the 0.05 level analyzed by ANOVA followed by Tukey’s test). (D and E) Sex pheromone (trimethylpyrazine [TMP] and tetramethylpyrazine [TTMP]) quantification in the rectum with Sardh knockdown (n=4 replicates, different letters above the error bars indicate significant differences at the 0.05 level analyzed by ANOVA followed by Tukey’s test). (F) Mating ability comparisons between males with Sardh knockdown and controls (n=5 replicates, different letters above the error bars indicate significant differences at the 0.05 level analyzed by Kruskal–Wallis test followed by Dunn’s multiple comparisons test). In violin plots, where the violin encompass the first to the third quartiles, inside the violin the horizontal line shows the median.
-
Figure 5—source data 1
Raw data used for analysis in Figure 5A–F.
- https://cdn.elifesciences.org/articles/83469/elife-83469-fig5-data1-v2.xlsx
Figure 5—figure supplement 1
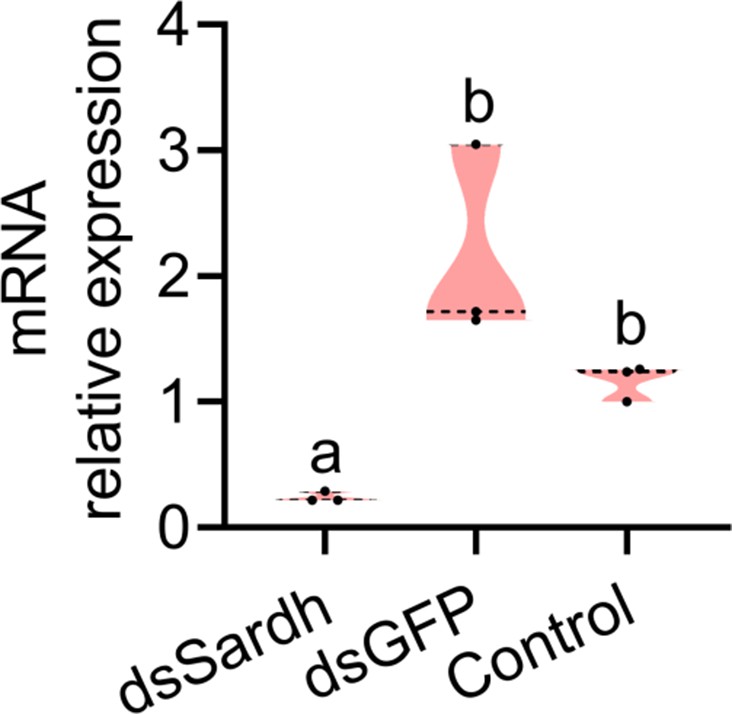
RNAi efficiency of Sardh after 48 hr (n=3 replicates, different letters above the error bars indicate significant differences at the 0.05 level analyzed by ANOVA followed by Tukey’s test).
In violin plots, where the violin encompass the first to the third quartiles, inside the violin the horizontal line shows the median.
Figure 6
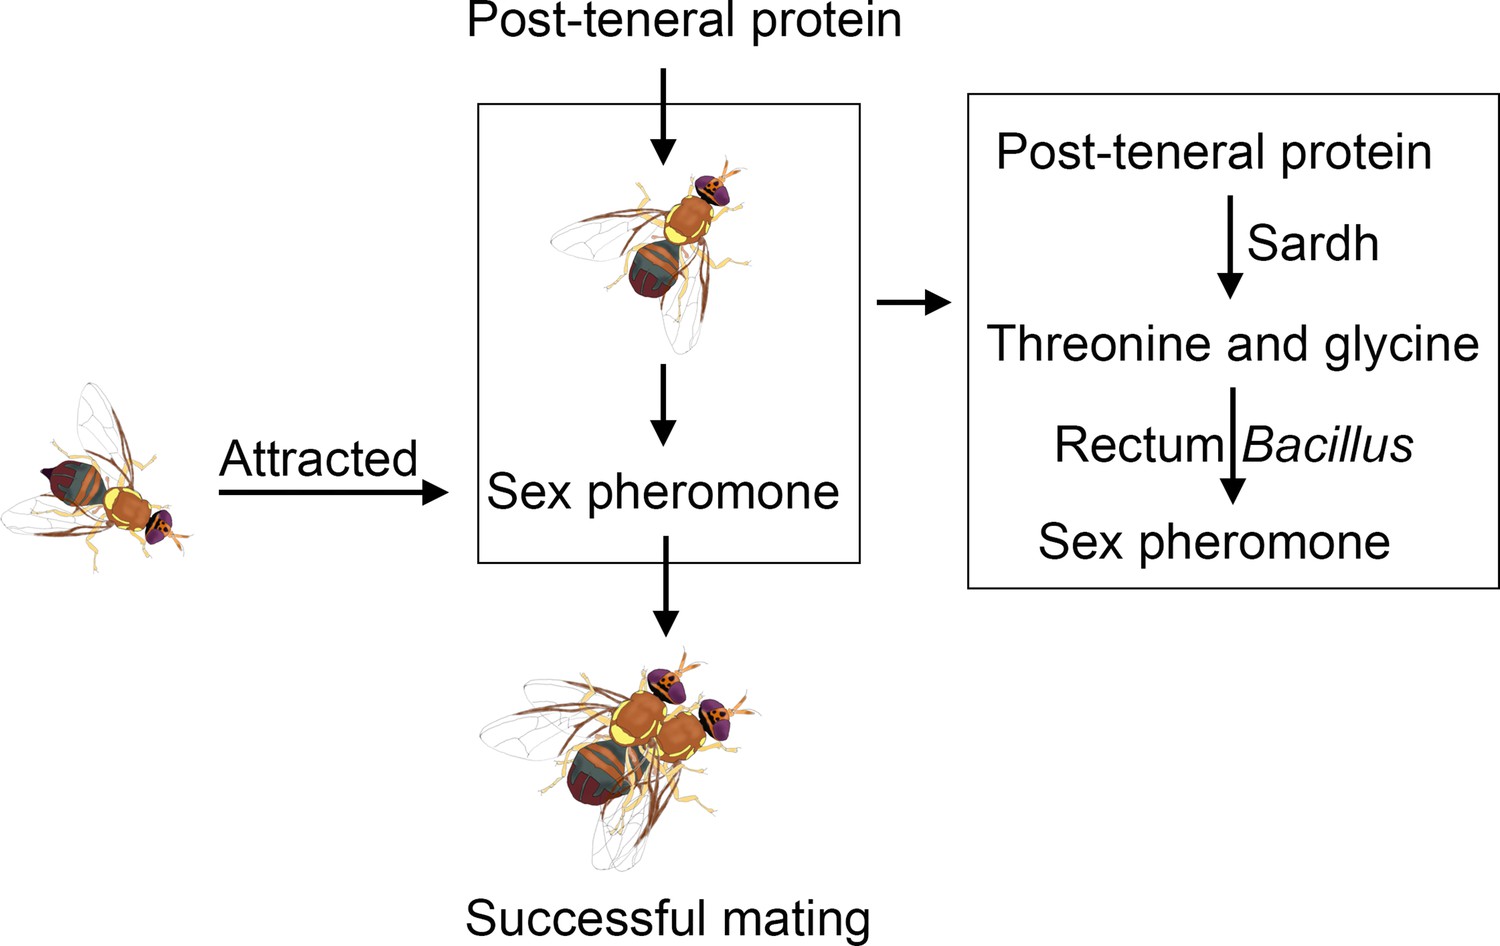
Schematic illustrating the sex pheromone biosynthesis hypothesis that B. dorsalis rectum.
Bacillus uses threonine and glycine, which are converted by Sardh with post-teneral protein feeding by B. dorsalis, as precursor substances to synthesize the sex pheromone.
Additional files
-
Supplementary file 1
OTU information of the 16S rRNA gene amplicons.
- https://cdn.elifesciences.org/articles/83469/elife-83469-supp1-v2.xlsx
-
Supplementary file 2
Alpha diversity analysis of the 16S rRNA gene amplicons.
- https://cdn.elifesciences.org/articles/83469/elife-83469-supp2-v2.xlsx
-
Supplementary file 3
Gene expression profiles in rectum of male fed with different type of food.
- https://cdn.elifesciences.org/articles/83469/elife-83469-supp3-v2.xlsx
-
Supplementary file 4
Expression profiles of the differential expression (DE) genes screened between yeast hydrolysate (YH)-fed and YH-deprived males.
- https://cdn.elifesciences.org/articles/83469/elife-83469-supp4-v2.xlsx
-
Supplementary file 5
Kyoto Encyclopedia of Genes and Genomes (KEGG) enrichment for the differential expression (DE) genes screened between yeast hydrolysate (YH)-fed and YH-deprived males.
- https://cdn.elifesciences.org/articles/83469/elife-83469-supp5-v2.xlsx
-
Supplementary file 6
Gene expression profiles in rectum of male at different development stages.
- https://cdn.elifesciences.org/articles/83469/elife-83469-supp6-v2.xlsx
-
Supplementary file 7
Expression profiles of the differential expression (DE) genes screened between different aged males.
- https://cdn.elifesciences.org/articles/83469/elife-83469-supp7-v2.xlsx
-
Supplementary file 8
Kyoto Encyclopedia of Genes and Genomes (KEGG) enrichment for the differential expression (DE) genes screened between different aged males.
- https://cdn.elifesciences.org/articles/83469/elife-83469-supp8-v2.xlsx
-
Supplementary file 9
Primers used in the study.
- https://cdn.elifesciences.org/articles/83469/elife-83469-supp9-v2.xlsx
-
MDAR checklist
- https://cdn.elifesciences.org/articles/83469/elife-83469-mdarchecklist1-v2.docx
Download links
A two-part list of links to download the article, or parts of the article, in various formats.
Downloads (link to download the article as PDF)
Open citations (links to open the citations from this article in various online reference manager services)
Cite this article (links to download the citations from this article in formats compatible with various reference manager tools)
Protein feeding mediates sex pheromone biosynthesis in an insect
eLife 12:e83469.
https://doi.org/10.7554/eLife.83469


