Ribozyme activity modulates the physical properties of RNA–peptide coacervates
- Department of Chemistry and Chemical Biology, TU Dortmund University, Germany
- Max-Planck Institute of Molecular Cell Biology and Genetics, Germany
Figures
Figure 1 with 5 supplements
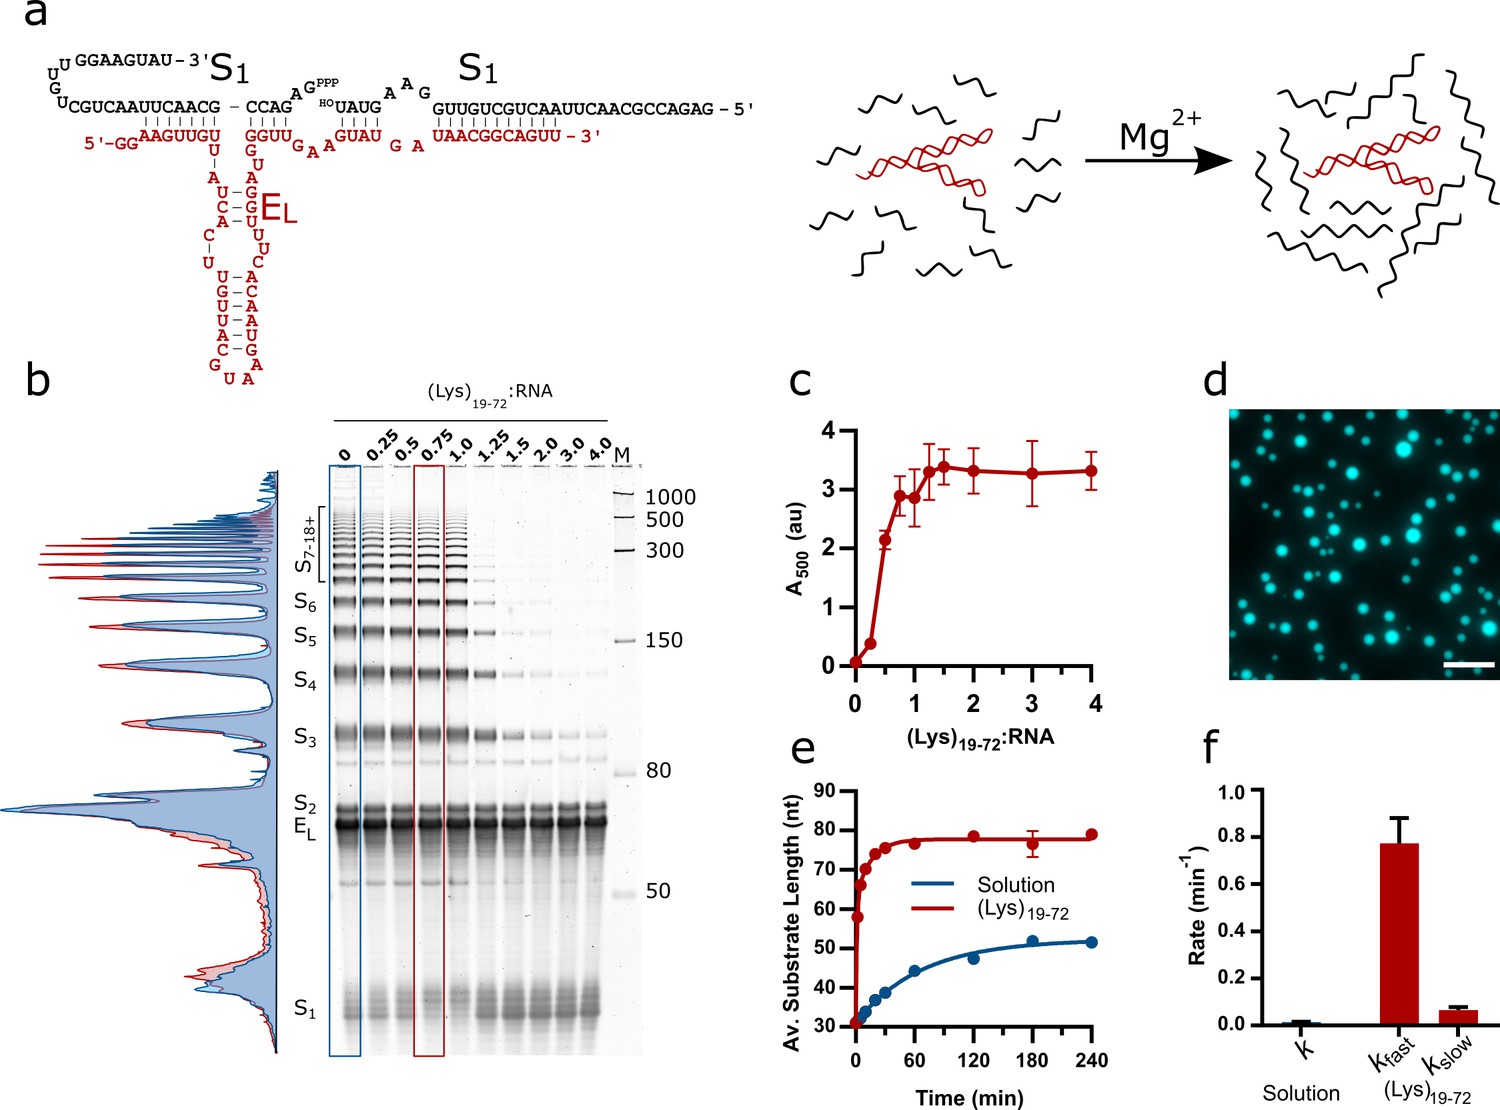
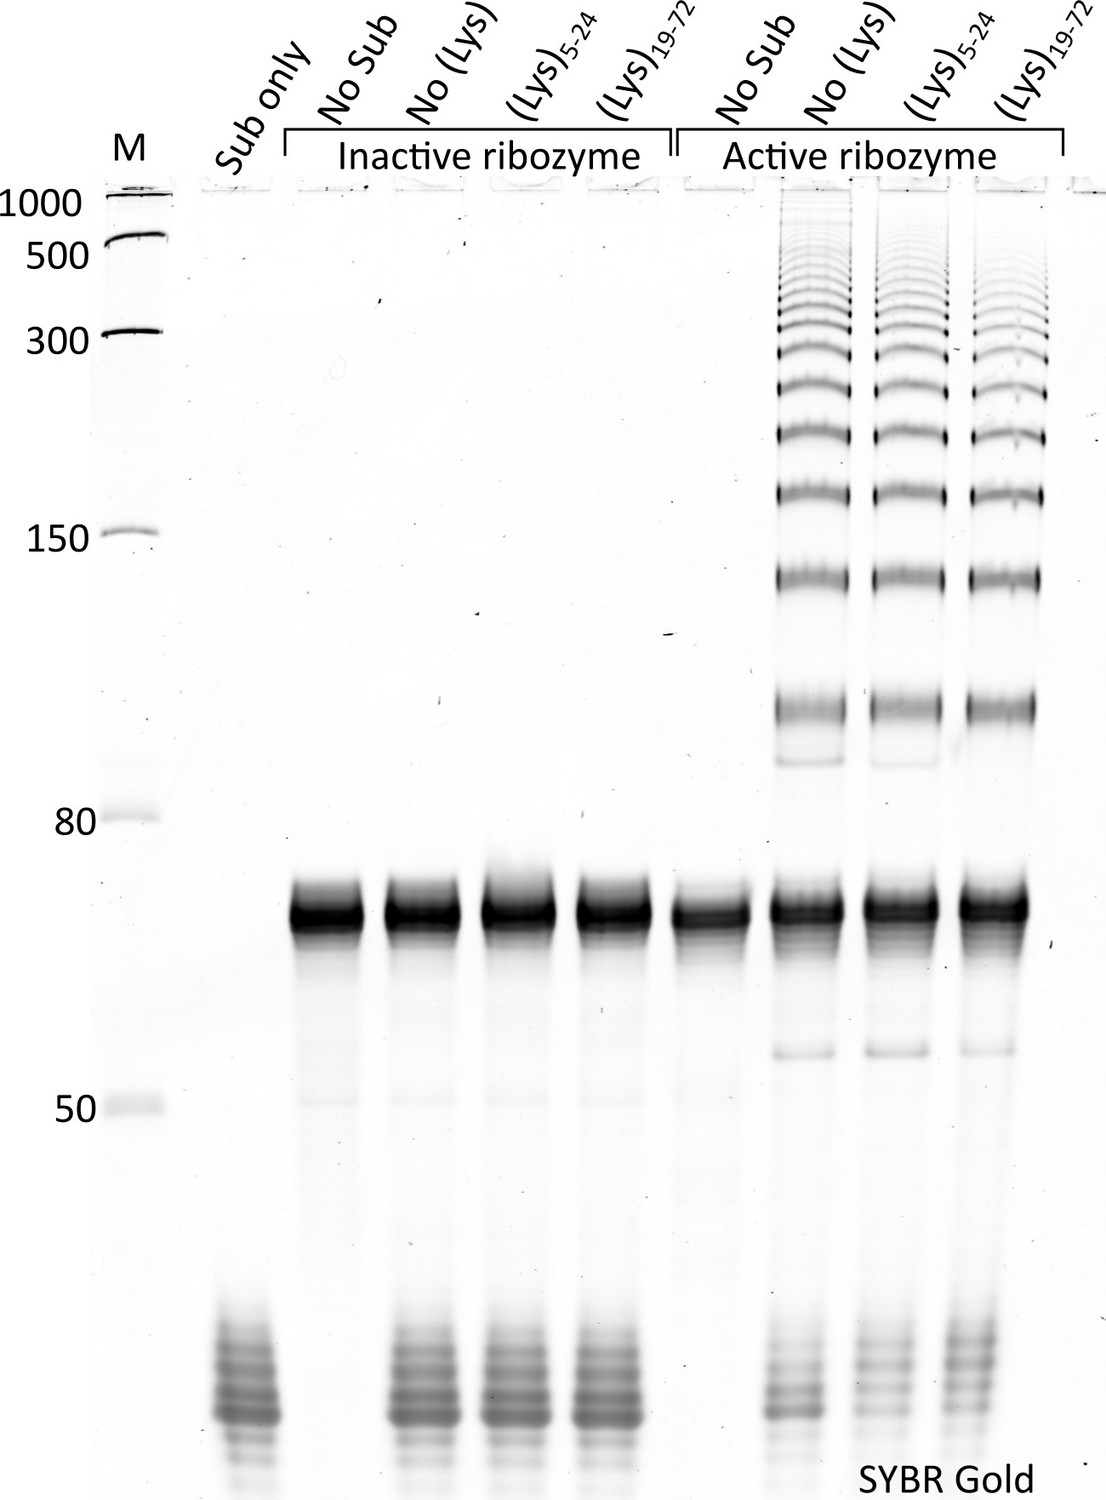
Design of the EL R3C ladder ribozyme system and activity in the presence of (Lys)19-72 peptides.
(a) The secondary structure of the ladder ribozyme and a schematic showing its function. The ribozyme is shown in red, whilst the substrate strands are shown in black. (b) A representative 8% urea PAGE stained with SYBR Gold showing the products of the R3C ladder system in solution and varying ratios of (Lys)19-72 to R3C RNA (total monomer concentration = 1 mM, 10.5 µM substrate, 10.5 µM ribozyme) after a 2 hr reaction at 30°C in 50 mM Tris-HCl pH 8.6 and 10 mM MgCl2. The integrated lane profiles of the solution and 0.75:1 (Lys)19-72:RNA conditions are shown in blue and red, respectively (c) Variation in absorbance at 500 nm as a measure of coacervate formation upon addition of varying ratios of (Lys)19-72 to the EL RNA after ligation for 3 hr at 30°C. Data points are an average of n = 3 independent replicates assembled from the same stock solutions. Error bars are standard deviations. (d) Example fluorescence microscopy image of (Lys)19-72:RNA condensates at a ratio of 0.75:1 (Lys)19-72:RNA, imaged using 10% Cy5-tagged substrate strand. Scale bar = 20 μm. (e) Kinetics of chain elongation in solution (blue, first-order model), and with 0.75:1 (Lys)19-72:RNA (red, second-order model) at 30°C, pH 8.6, and 10 mM MgCl2. A total RNA monomer concentration of 1 mM was achieved by combining 9.5 µM substrate, 1 µM Cy5-tagged substrate and 10.5 µM ribozyme. Data points are an average of n = 3 independent replicates assembled from the same stock solutions. Error bars are standard deviations. (f) Chain extension rate constants for the R3C ladder ribozyme in solution (blue, first-order model) and in the presence of 0.75:1 (Lys)19-72:RNA (red, second-order model). Error bars are the standard errors for each parameter computed during non-linear regression. Equivalent data for condensates formed from the shorter (Lys)5-24 peptide is shown in Figure 1—figure supplement 2.
-
Figure 1—source data 1
Unedited and uncropped gel image for Figure 1b, and labelled image showing key bands and conditions.
- https://cdn.elifesciences.org/articles/83543/elife-83543-fig1-data1-v2.zip
-
Figure 1—source data 2
Numerical turbidity data for Figure 1c.
- https://cdn.elifesciences.org/articles/83543/elife-83543-fig1-data2-v2.zip
-
Figure 1—source data 3
Unprocessed and uncropped fluorescence microscope image for 0.75:1 (Lys)19-72:RNA condensates (Figure 1d) imaged using 10% Cy5-tagged substrate strand.
- https://cdn.elifesciences.org/articles/83543/elife-83543-fig1-data3-v2.zip
-
Figure 1—source data 4
Unedited and uncropped gel images for ribozyme kinetics (Figure 1e).
Lane identities are listed in the accompanying spreadsheet.
- https://cdn.elifesciences.org/articles/83543/elife-83543-fig1-data4-v2.zip
Figure 1—figure supplement 1
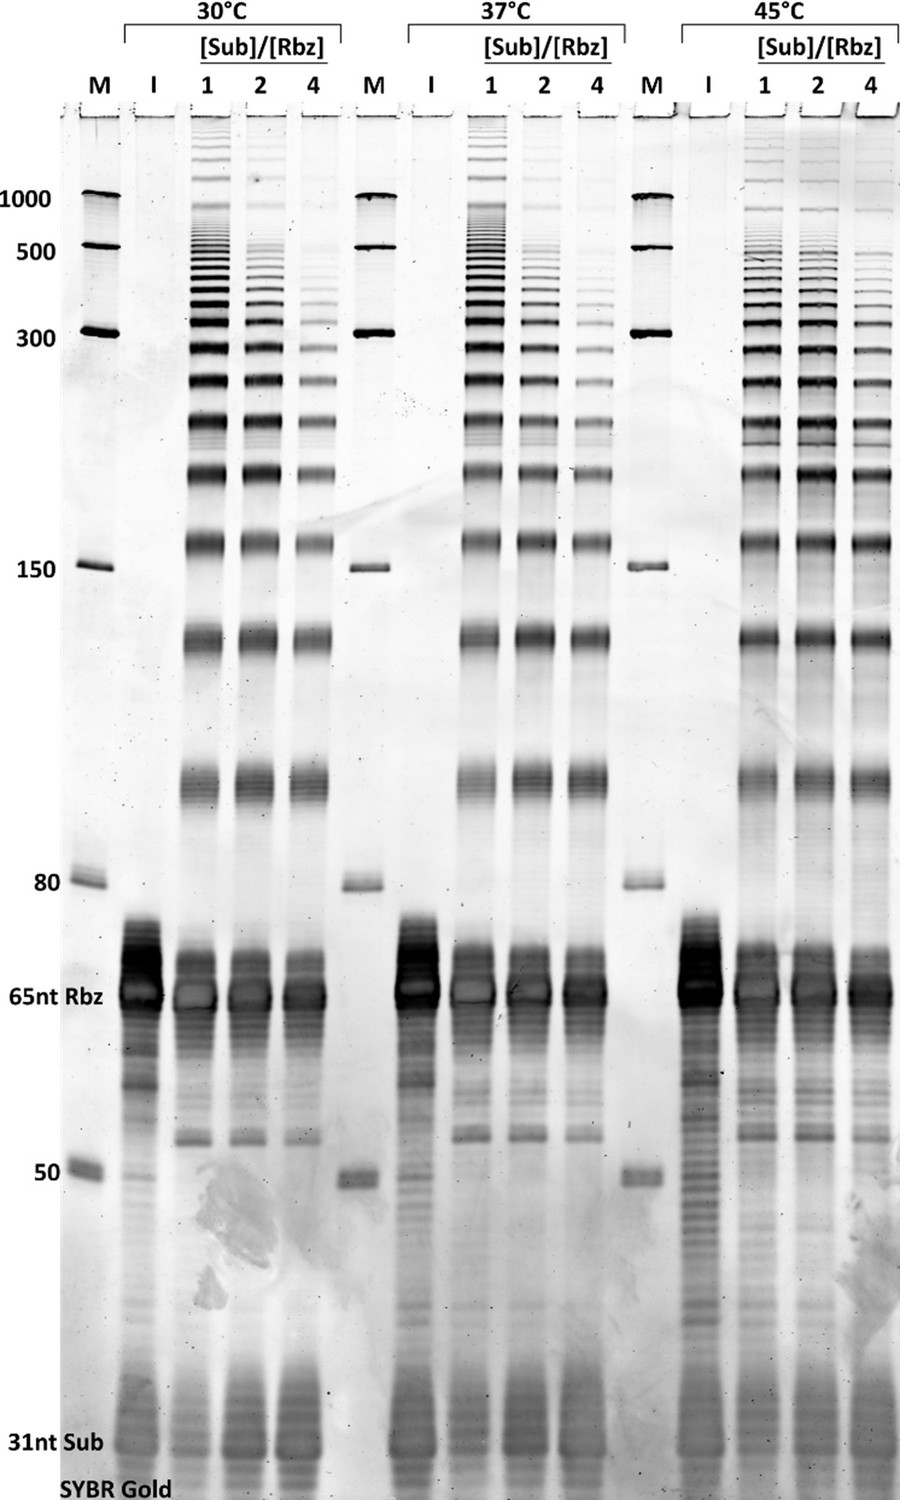
Characterisation of R3C ladder ribozyme activity at various temperatures and ribozyme:substrate ratios.
The concatenation activity of the ribozyme was determined by reaction at 30, 37, or 45°C and with either equimolar (10.5 µM), twofold (8 µM ribozyme and 16 µM substrate) or fourfold (5 µM ribozyme and 20 µM substrate) substrate concentration relative to the ribozyme. The reaction buffer contained 10 mM MgCl2 and 50 mM Tris-HCl pH 8.6, and the reaction was stopped after 2 hr. Excess substrate was found to inhibit the formation of long substrate concatenates at lower temperatures.
-
Figure 1—figure supplement 1—source data 1
Unedited and uncropped gel image for Figure 1—figure supplement 1, and labelled image showing key bands and conditions.
- https://cdn.elifesciences.org/articles/83543/elife-83543-fig1-figsupp1-data1-v2.zip
Figure 1—figure supplement 2
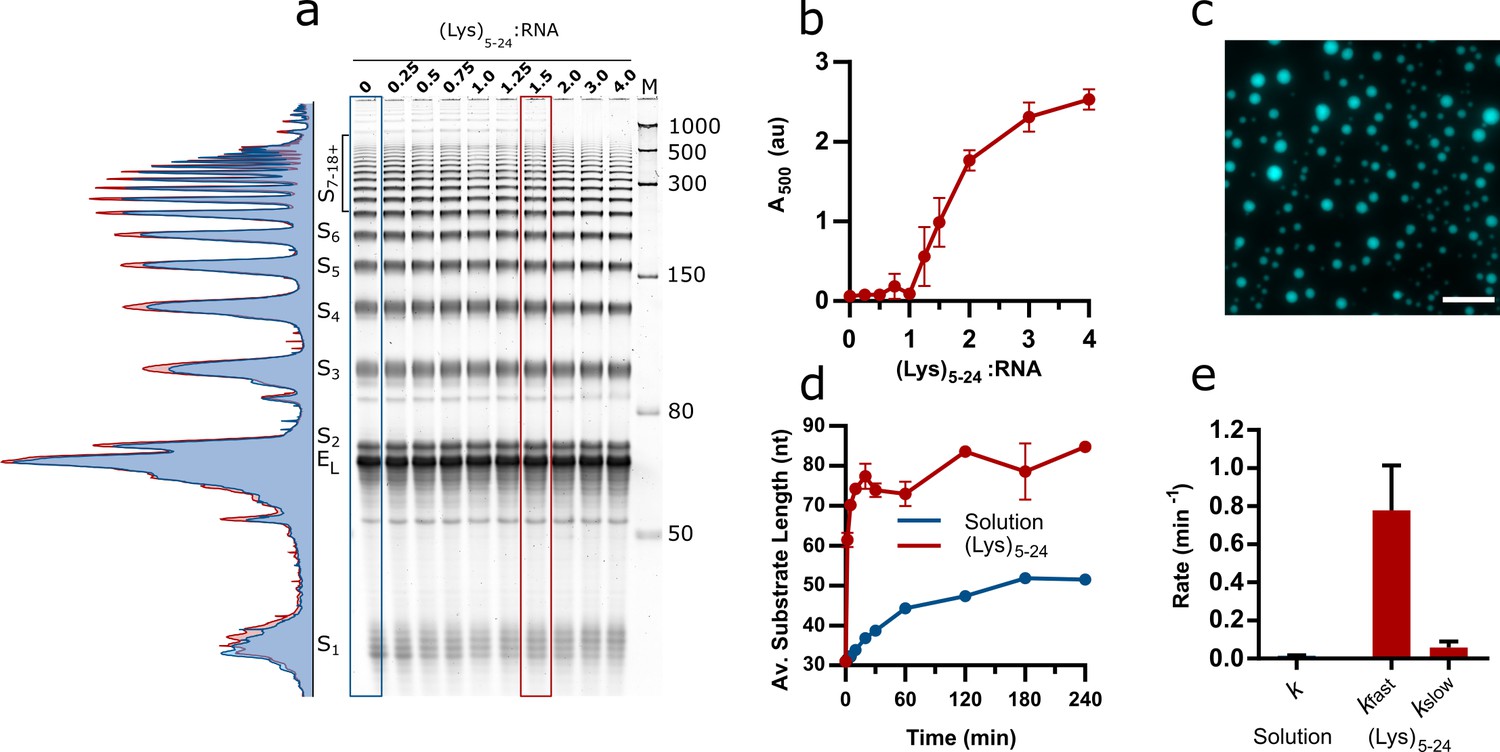
Activity of the EL R3C ladder ribozyme in the presence of short (Lys)5-24 peptides.
(a) A representative 8% urea PAGE gel stained with SYBR gold showing the products of the R3C ladder system in solution and varying ratios of (Lys)5-24 to R3C RNA (total monomer concentration = 1 mM) after a 2 hr reaction at 30°C in 50 mM Tris-HCl pH 8.6 and 10 mM MgCl2. The integrated lane profiles of the solution and 1.5:1 (Lys)5-24:RNA conditions are shown in blue and red, respectively. (b) Variation in absorbance at 500 nm as a proxy for coacervate formation upon addition of varying ratios of (Lys)5-24 to the EL RNA after ligation for 3 hr at 30°C. Data points are an average of n = 3 independent replicates assembled from the same stock solutions with error bars reporting standard deviations. (c) Example fluorescence microscopy image of (Lys)5-24:RNA condensates at a ratio of 3:1 (Lys)5-24:RNA, imaged using 10% Cy5-tagged substrate strand. Scale bar = 20 μm. (d) Kinetics of chain elongation in solution (blue, first-order model), and with 3:1 (Lys)5-24:RNA (red, second-order model) at 30°C, pH 8.6, and 10 mM MgCl2. Data points are an average of n = 3 independent replicates assembled from the same stock solutions. Error bars represent standard deviations (e) Chain extension rate constants for the R3C ladder ribozyme in solution (blue, first-order model) and in the presence of 3:1 (Lys)5-24:RNA (red, second-order model). Error bars are the standard errors for each parameter computed during non-linear regression. Poor sample recovery led to an artificially reduced average substrate length at the t = 30 and t = 60 min time points for the reaction in the presence of (Lys)5-24. These points were therefore excluded when fitting data.
-
Figure 1—figure supplement 2—source data 1
Unedited and uncropped gel image for Figure 1—figure supplement 2, and labelled image showing key bands and conditions.
Content identical to Figure 1—source data 2.
- https://cdn.elifesciences.org/articles/83543/elife-83543-fig1-figsupp2-data1-v2.zip
-
Figure 1—figure supplement 2—source data 2
Numerical turbidity data.
Content identical to Figure 1—source data 2.
- https://cdn.elifesciences.org/articles/83543/elife-83543-fig1-figsupp2-data2-v2.zip
-
Figure 1—figure supplement 2—source data 3
Unprocessed and uncropped fluorescence microscope image for 3:1 (Lys)5-24:RNA condensates imaged using 10% Cy5-tagged substrate strand.
- https://cdn.elifesciences.org/articles/83543/elife-83543-fig1-figsupp2-data3-v2.zip
-
Figure 1—figure supplement 2—source data 4
Unedited and uncropped gel images for ribozyme kinetics (Figure 1e).
Lane identities are listed in the included spreadsheet. Content identical to Figure 1—source data 2.
- https://cdn.elifesciences.org/articles/83543/elife-83543-fig1-figsupp2-data4-v2.zip
Figure 1—figure supplement 3
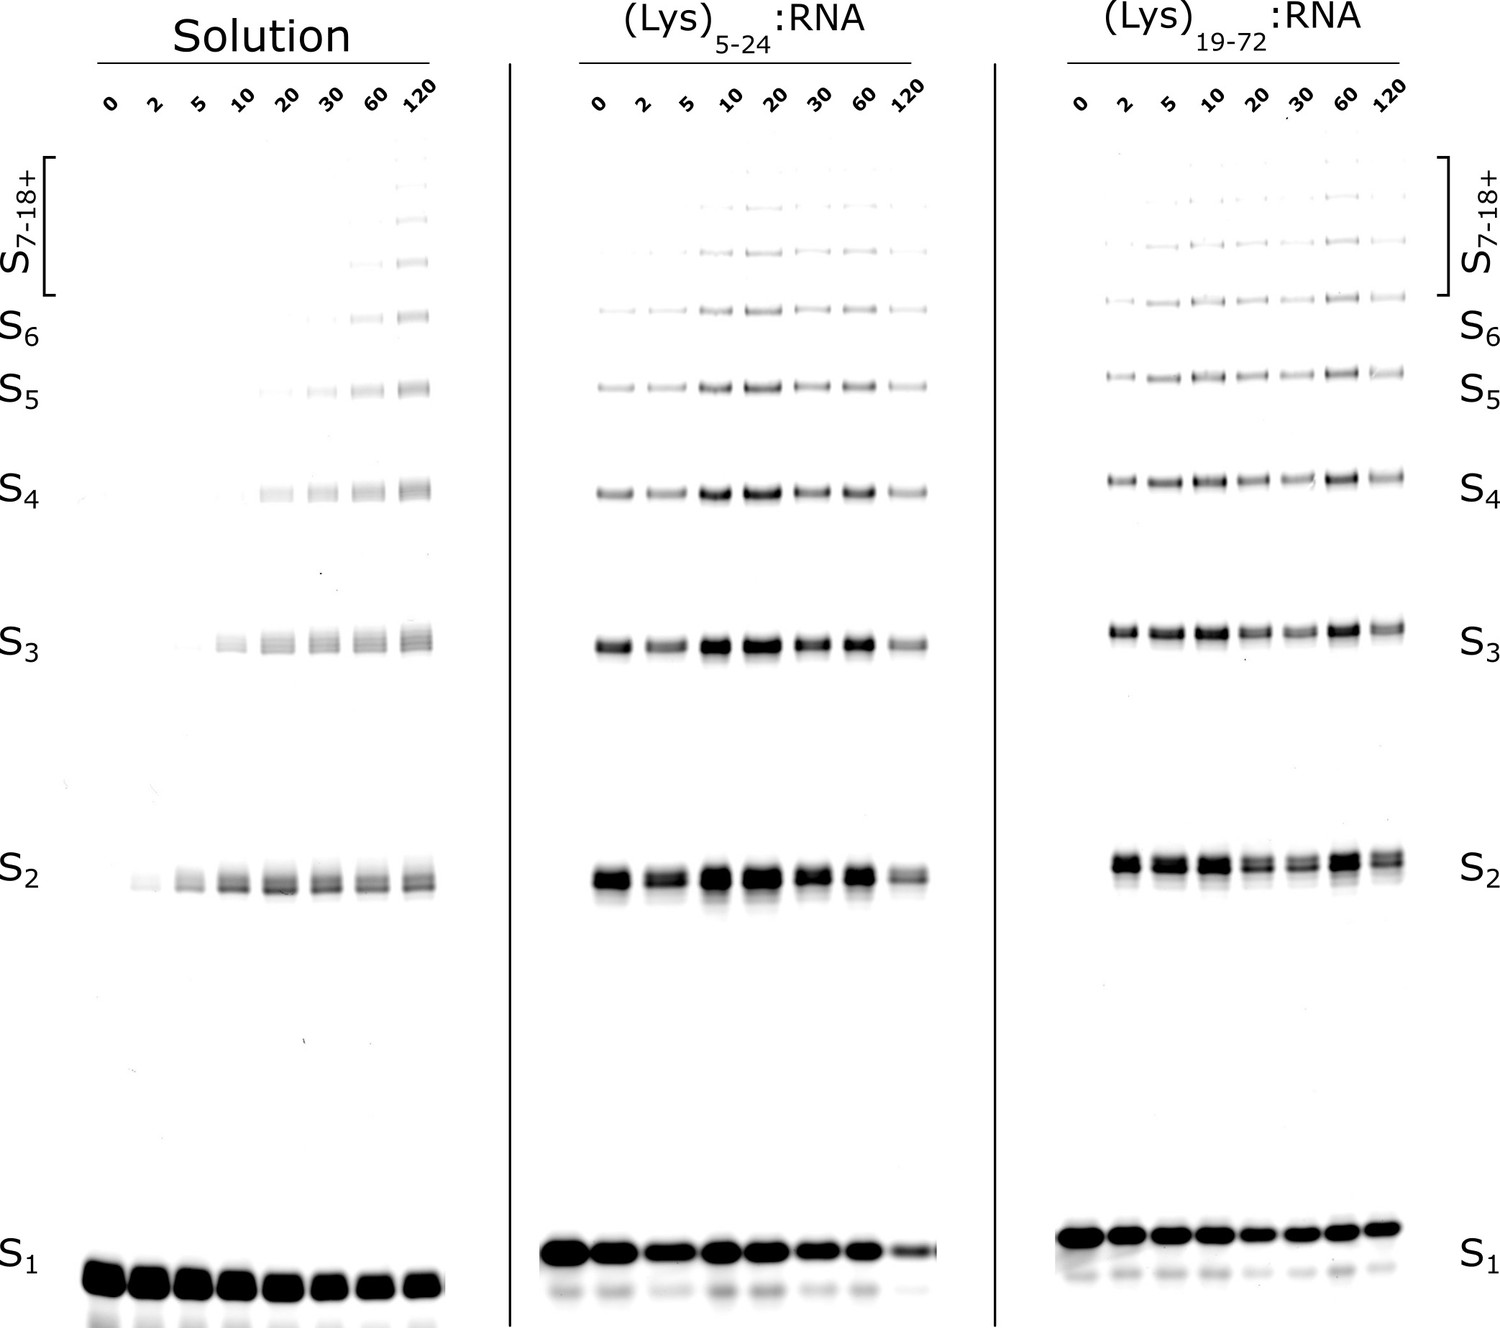
Representive urea PAGE gels showing the activity of the EL R3C ladder ribozyme over time in solution and in the presence of short and long (Lys)n peptides.
Experiments were performed in solution at 30°C in 50 mM Tris-HCl pH 8.6, 10 mM MgCl2, and with the addition of either 1.5:1 (Lys)5-24:RNA or 0.75:1 (Lys)19-72:RNA. The reaction run using 10% Cy5-tagged substrate strand, and the reaction product were visualised on an 8% urea PAGE. The displayed gels correspond to the kinetic plots shown in Figure 1d and Figure 1—figure supplement 2d.
-
Figure 1—figure supplement 3—source data 1
Source data contains unedited and uncropped gel images used to estimate yields, as well as labelled images showing key bands and conditions and is identical to Figure 1—source data 4.
- https://cdn.elifesciences.org/articles/83543/elife-83543-fig1-figsupp3-data1-v2.zip
Figure 1—figure supplement 4
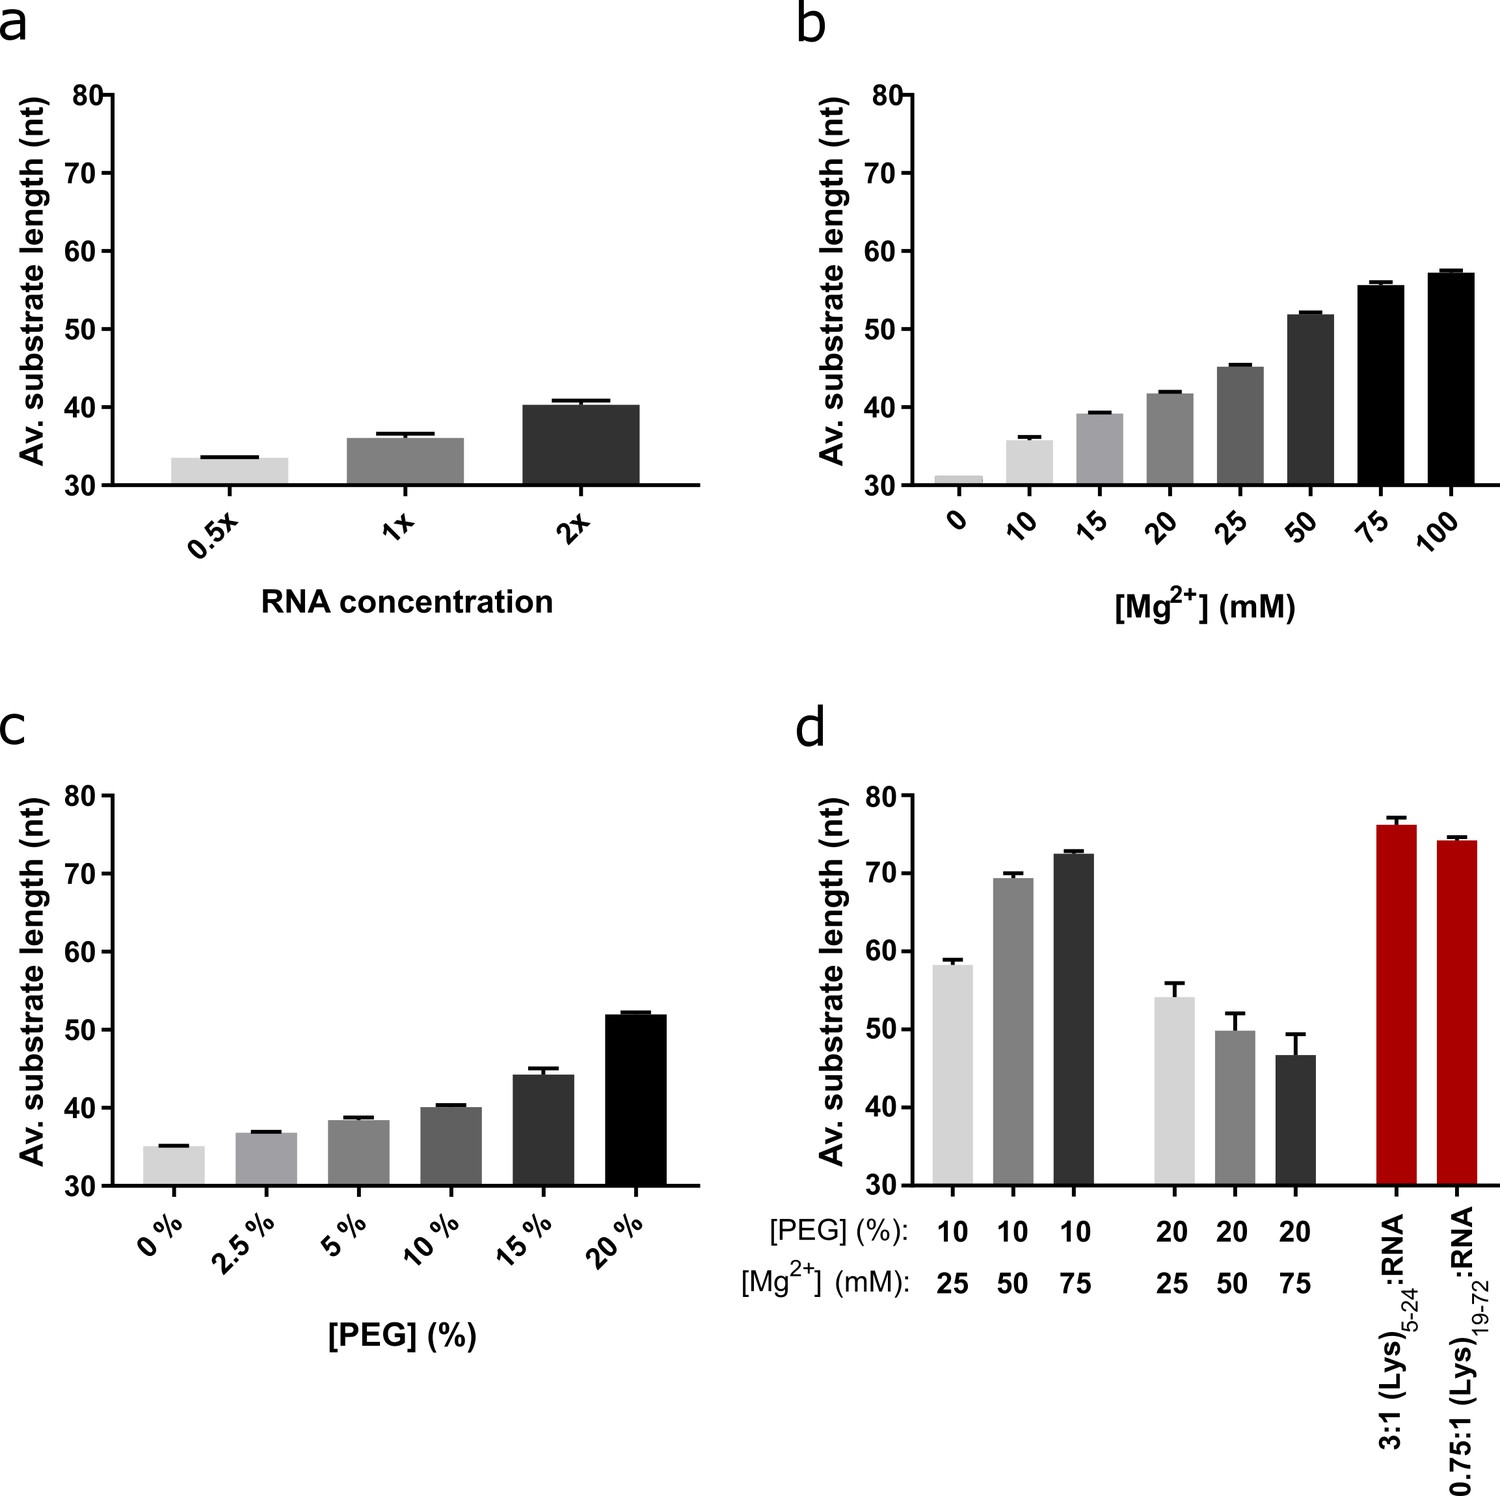
The effect of RNA, Mg2+, and PEG on the activity of the EL ribozyme.
(a) The effect of total RNA concentration on ribozyme activity. Reactions were performed at pH 8.6 and 10 mM MgCl2.The total concentration of RNA was either 5.25 µM (0.5×), 10.5 µM (1×), or 21 µM (2×). (b) The effect of increasing Mg2+ concentrations on ribozyme activity. Reactions were performed at pH 8.6 and 10.5 µM (1×) total RNA concentration. (c) The effect of increasing PEG concentration on ribozyme activity. Reactions were performed at pH 8.6, 10 mM MgCl2, and 10.5 µM (1×) total RNA concentration with between 0 and 20% PEG 8000. (d) The effect of PEG and increased Mg2+ concentration on ribozyme activity. All reactions were performed at pH 8.6 and 10.5 µM (1×) total RNA concentration with between 25 and 75 mM Mg2+ and either 10 or 20% PEG 8000. Reactions containing 3:1 (Lys)5-24:RNA and 0.75:1 (Lys)19-72:RNA performed at pH 8.6 and 10 mM MgCl2 are shown for reference (red). All reactions were run for 10 min at 30°C before being quenched and separated on an 8% urea PAGE. The reaction products were visualised using the Cy5-tagged substrate included in the reaction mixture. Data points in all panels are averages of n = 3 independent replicates assembled from the same stock solutions. Error bars represent standard deviations.
-
Figure 1—figure supplement 4—source data 1
Source data contains unedited and uncropped gel image, as well as labelled image showing the key bands and conditions.
- https://cdn.elifesciences.org/articles/83543/elife-83543-fig1-figsupp4-data1-v2.zip
Figure 1—figure supplement 5

Formation of circular RNA products by the R3C ladder ribozyme.
Ribozyme assays were performed at 45 °C in solution and in the presence of poly(L-lysine) (0.75:1 Lys19-72:RNA or 3:1 Lys5-24:RNA). The ribozyme reaction buffer contained 10 mM MgCl2 and 50 mM Tris-HCl pH 8.6. The reaction was stopped after 3 hr and the extracted RNA was digested with RNase R, leaving only circular products. Circular bands are marked with an asterisk. The formation of circular products is observed in solution but is suppressed in the presence of poly(L-lysine).
-
Figure 1—figure supplement 5—source data 1
Unedited and uncropped gel image, and labelled image showing key bands and conditions.
- https://cdn.elifesciences.org/articles/83543/elife-83543-fig1-figsupp5-data1-v2.zip
Figure 2 with 5 supplements
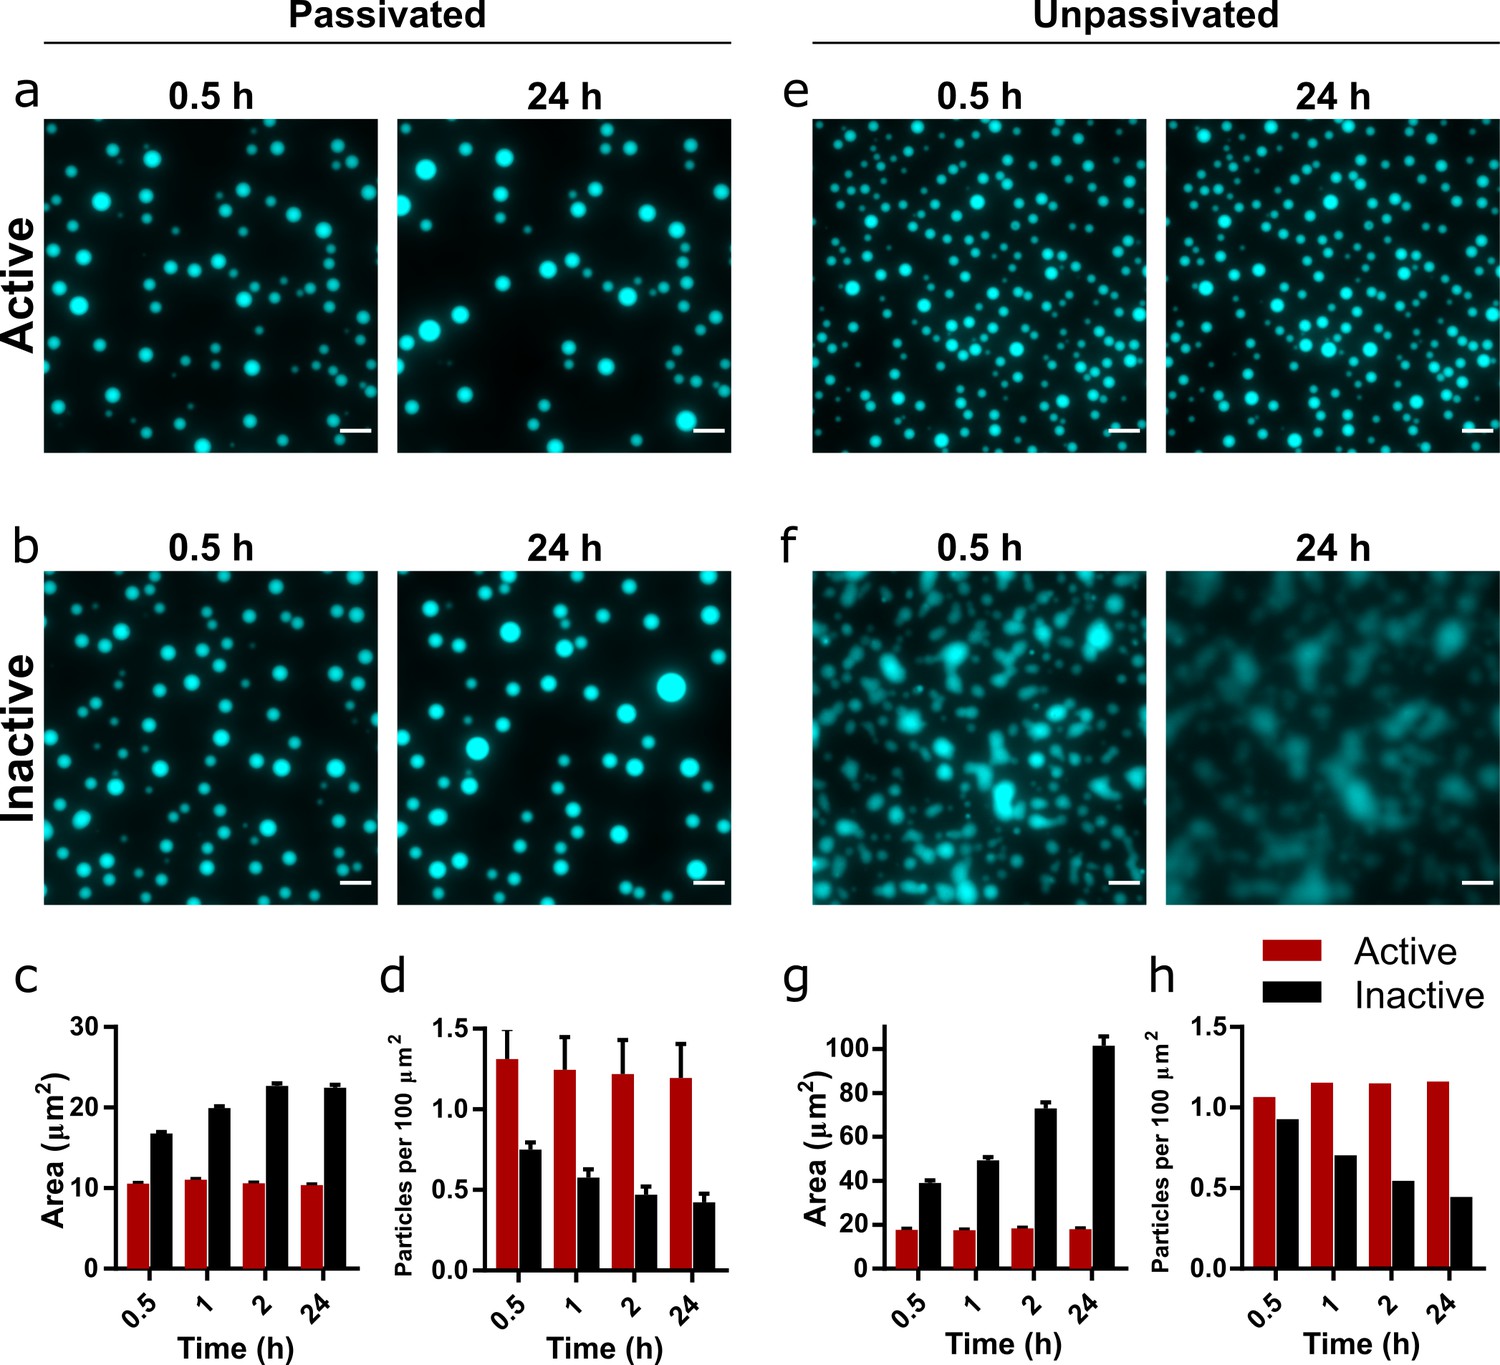
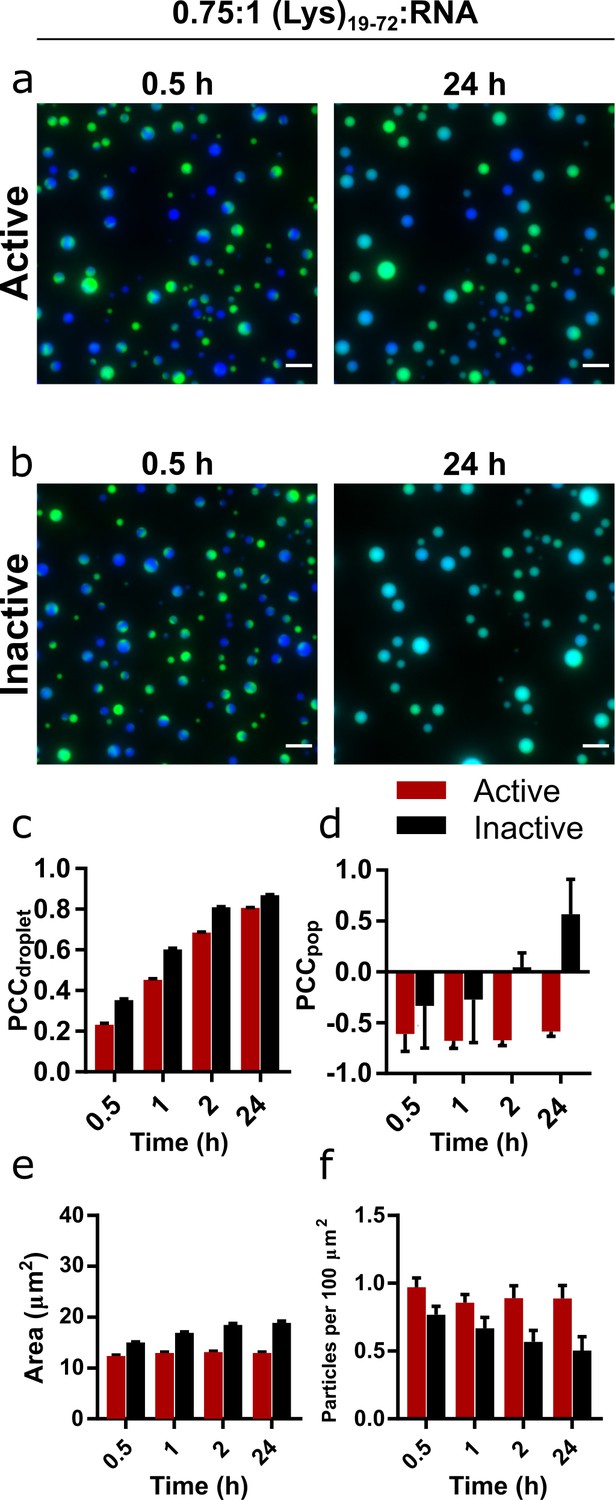
Droplet morphology over time in active and inactive coacervate systems formed from R3C RNA and (Lys)19-72.
Representative images of coacervate droplets prepared with active (a, e) or inactive ribozyme (b, f) and 0.75:1 (Lys)19-72:RNA in passivated (a, b) and unpassivated (e, f,) environments. Scale bars = 10 μm. Average particle areas and population density over time for the passivated environment are shown in (c) and (d), respectively. Equivalent data for the unpassivated environment are shown in (g) and (h). All experiments were performed with 1 mM total RNA monomer concentration, a 0.75:1 ratio of (Lys)19-72:RNA monomers, and at 30°C, pH 8.6, and 10 mM MgCl2. The RNA reaction mixture contained 10% Cy5-labelled substrate for fluorescence imaging. Particles were measured from at least nine separate images, except for unpassivated samples for which a single image was captured. Error bars are standard errors. Data from active populations are shown in red, while data from inactive populations are shown in black. The number of droplets analysed was n=1702 - 5272 for the passivated environment and n = 199 - 518 for the unpassivated environment. Droplet areas and particle counts were measured using the CellPose segmentation algorithm (Stringer et al., 2021). Data for condensates formed from the shorter (Lys)5-24 peptide are shown in Figure 2—figure supplement 2.
-
Figure 2—source data 1
Unprocessed and uncropped fluorescence microscope image for 0.75:1 (Lys)19-72:RNA condensates on passivated surfaces imaged using 10% Cy5-tagged substrate strand.
Extracted numerical parameters are listed in the accompanying spreadsheet.
- https://cdn.elifesciences.org/articles/83543/elife-83543-fig2-data1-v2.zip
-
Figure 2—source data 2
Unprocessed and uncropped fluorescence microscope image for 0.75:1 (Lys)19-72:RNA condensates on unpassivated surfaces imaged using 10% Cy5-tagged substrate strand.
Extracted numerical parameters are listed in the accompanying spreadsheet.
- https://cdn.elifesciences.org/articles/83543/elife-83543-fig2-data2-v2.zip
Figure 2—figure supplement 1
Comparison of active and inactive ribozyme variants.
The activity of the active and inactive ligase ribozyme variants was tested in solution and in the presence of poly(L-lysine) (0.75:1 Lys19-72:RNA or 3:1 Lys5-24:RNA). The ribozyme reaction buffer contained 10 mM MgCl2 and 50 mM Tris-HCl pH 8.6. The reaction was stopped after 2 hr. No ligation activity was detected in the presence of the inactive ribozyme in all conditions tested.
-
Figure 2—figure supplement 1—source data 1
Unedited and uncropped gel image, and labelled image showing key bands and conditions.
- https://cdn.elifesciences.org/articles/83543/elife-83543-fig2-figsupp1-data1-v2.zip
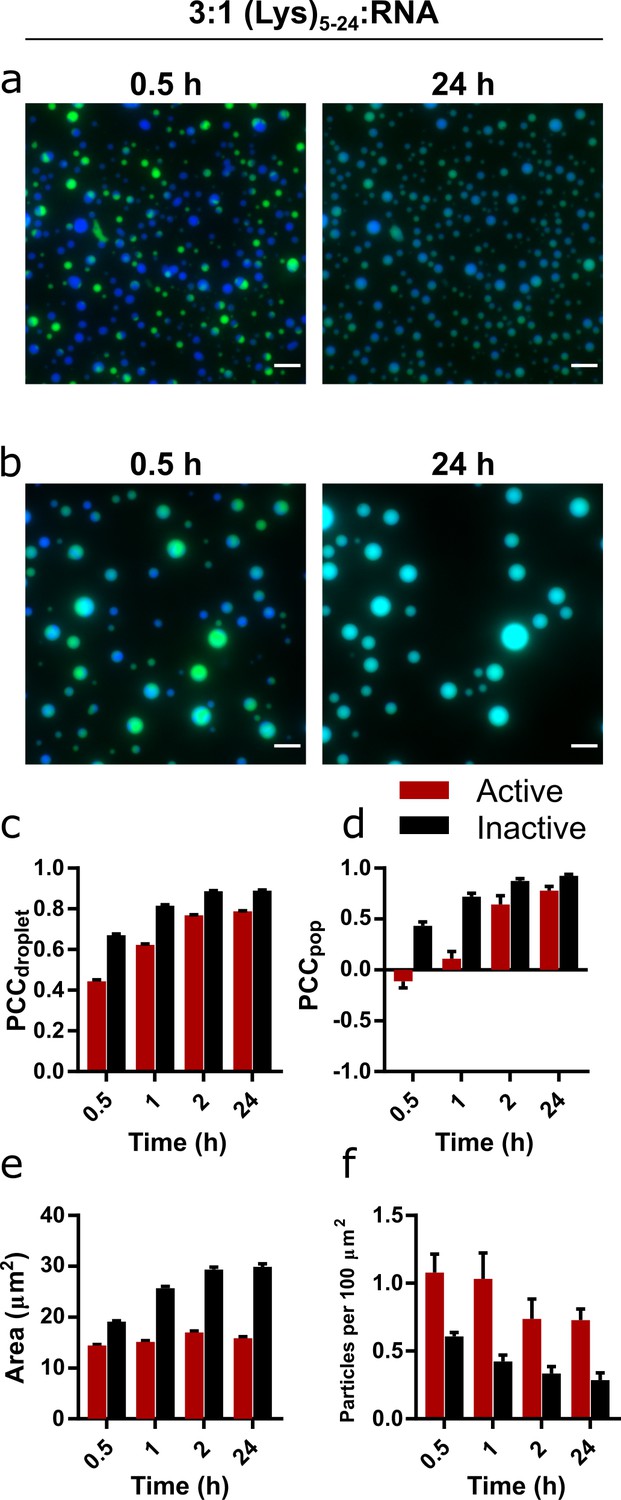
Figure 2—figure supplement 2
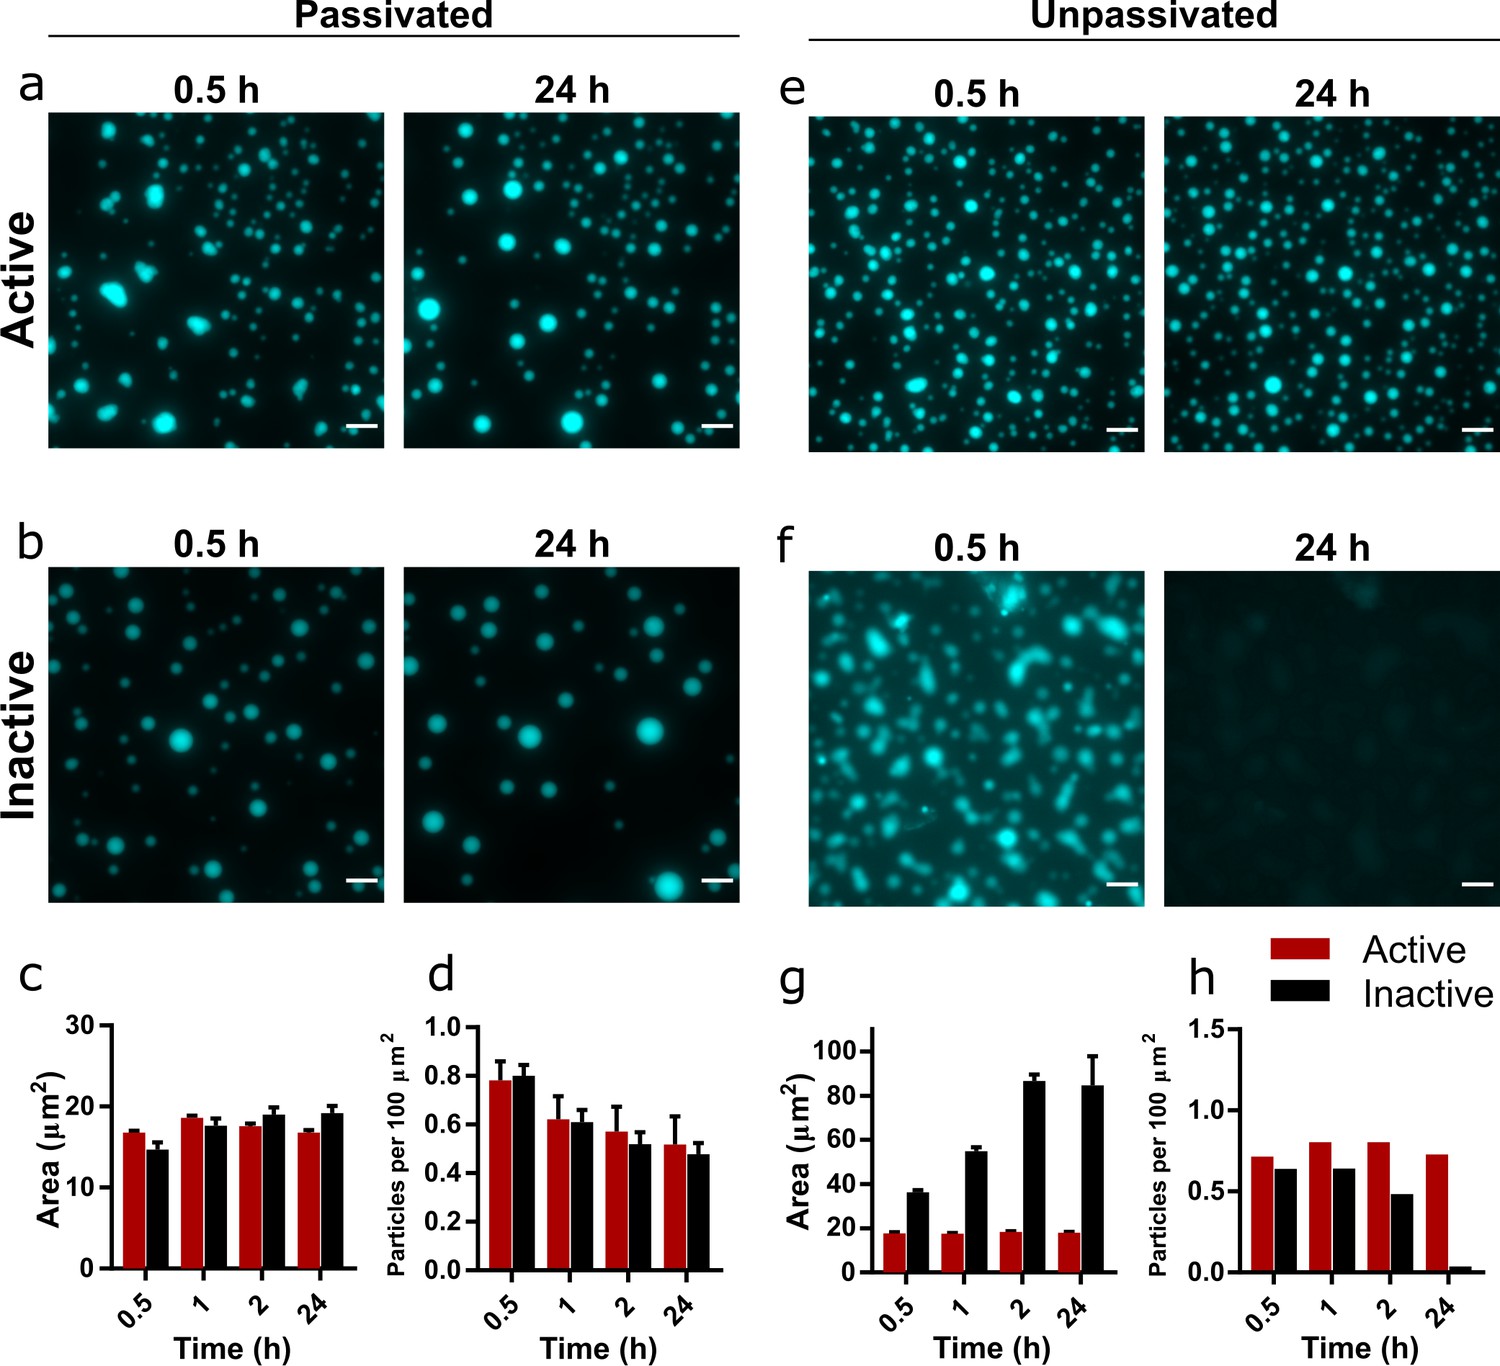
Development of droplet morphology over time in active and inactive coacervate systems formed from R3C RNA and (Lys)5-24 peptide.
Representative images of coacervate droplets prepared with active (a, e) or inactive ribozyme (b, f) and 3:1 (Lys)5-24:RNA in passivated (a, b) and unpassivated (e, f) environments. Scale bars = 10 μm. For the passivated environment, plots of average particle areas and number of particles per unit area over time are shown in (c) and (d) respectively. For the unpassivated environment, these plots are shown in (g and h) respectively. All experiments were performed with 1 mM total RNA monomer concentration and a 3:1 ratio of (Lys)5-24:RNA. All reactions were performed at 30°C, pH 8.6, and 10 mM MgCl2. Particles were measured from at least nine separate images, except for unpassivated samples, for which a single image was captured. Data from active populations are shown in red, while data from inactive populations are shown in black. The number of droplets analysed was n = 1921- 3217 for the passivated environment and n = 16 - 359 for the unpassivated environment. Error bars are standard errors. The RNA reaction mixture contained 10% Cy5-labelled substrate for fluorescence imaging. Droplet areas and particle counts were measured using the CellPose segmentation algorithm.
-
Figure 2—figure supplement 2—source data 1
Unprocessed and uncropped fluorescence microscope image for 3:1 (Lys)5-24:RNA condensates on passivated surfaces imaged using 10% Cy5-tagged substrate strand.
Extracted numerical parameters are listed in the accompanying spreadsheet.
- https://cdn.elifesciences.org/articles/83543/elife-83543-fig2-figsupp2-data1-v2.zip
-
Figure 2—figure supplement 2—source data 2
Unprocessed and uncropped fluorescence microscope image for 3:1 (Lys)5-24:RNA condensates on unpassivated surfaces imaged using 10% Cy5-tagged substrate strand.
Extracted numerical parameters are listed in the accompanying spreadsheet.
- https://cdn.elifesciences.org/articles/83543/elife-83543-fig2-figsupp2-data2-v2.zip
Figure 2—figure supplement 3
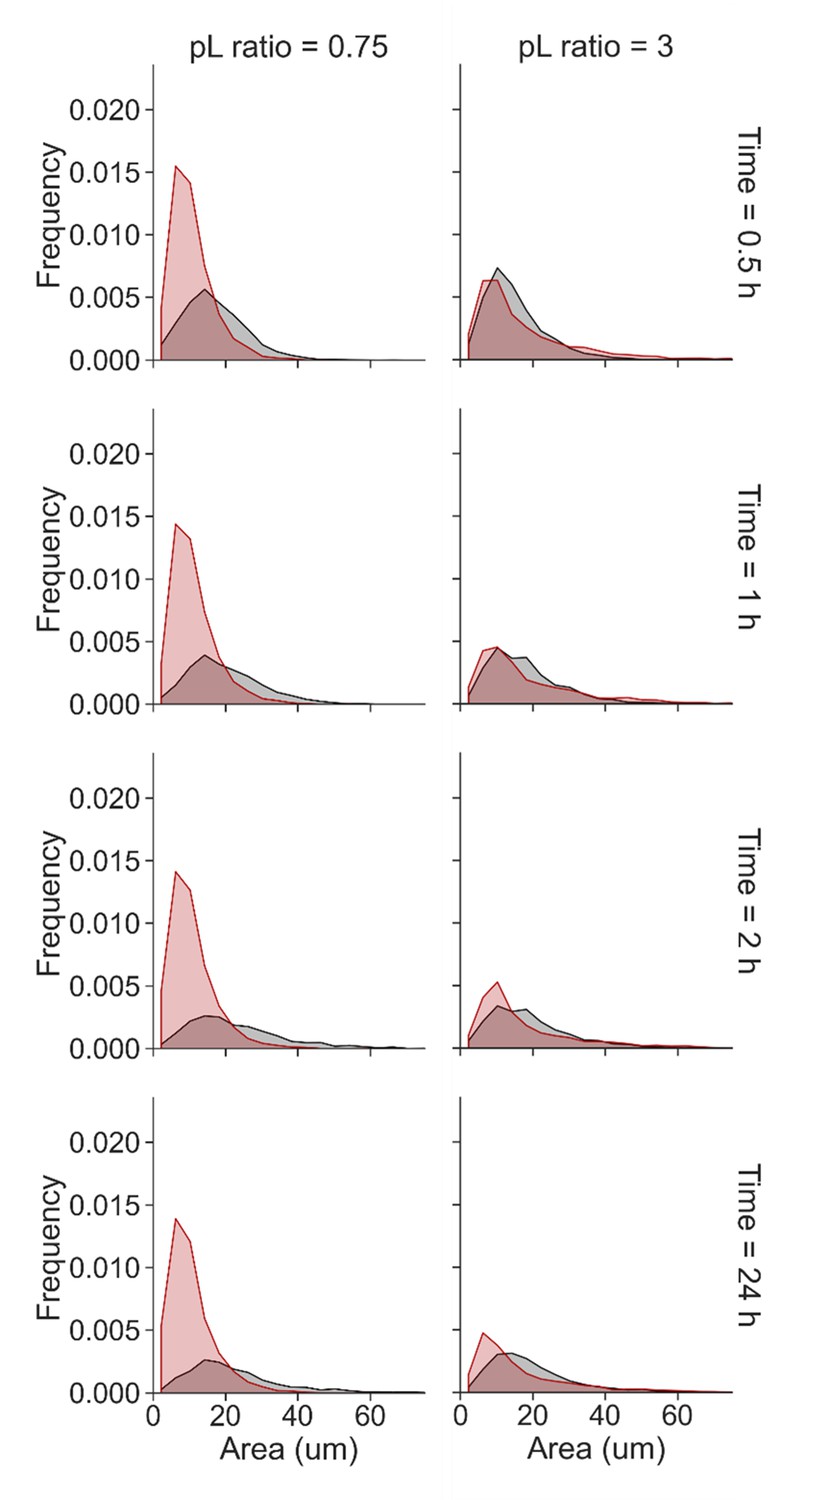
Frequency histograms area of Cy5-labelled coacervate droplet area over time.
Droplets were from either 0.75:1 (Lys)19-72:RNA (left) or 3:1 (Lys)5-24:RNA (right) and contained active (red) or inactive (black) ribozyme.
Figure 2—figure supplement 4

Circularity of Cy5-labelled coacervate droplets over time.
Droplets were from either 0.75:1 (Lys)19-72:RNA (left, n = 1702 - 5272) or 3:1 (Lys)5-24:RNA (right, n = 1921- 3217) and contained active (red) or inactive (black) ribozyme. Error bars are standard deviations.
Figure 2—figure supplement 5

Comparison between condensates formed from pre-reacted EL ribozyme and substrate and (Lys)n at 1 hr and 24 hr after mixing.
RNA and substrate were incubated for 2 hr at 30°C with 10 mM MgCl2. (Lys)n was added, then the samples were incubated for 24 hr at 30°C. Images were captured 1 hr and 24 hr after mixing.
-
Figure 2—figure supplement 5—source data 1
Unprocessed and uncropped fluorescence microscope image for 0.75:1 (Lys)19-72: pre-reacted RNA condensates imaged using 10% FAM-tagged substrate strand.
- https://cdn.elifesciences.org/articles/83543/elife-83543-fig2-figsupp5-data1-v2.zip
-
Figure 2—figure supplement 5—source data 2
Unprocessed and uncropped fluorescence microscope image for 3:1 (Lys)5-24: pre-reacted RNA condensates imaged using 10% FAM-tagged substrate strand.
- https://cdn.elifesciences.org/articles/83543/elife-83543-fig2-figsupp5-data2-v2.zip
Figure 3 with 3 supplements
Mixing and content exchange between populations of active or inactive coacervate systems formed from R3C RNA and (Lys)19-72 peptide.
(a, b) Example images of mixtures of orthogonally labelled coacervate droplets prepared with 0.75:1 (Lys)19-72:RNA containing either active (a) or inactive (b) ribozyme. Each population in the set contained either 10% FAM- or 10% Cy5-tagged substrate (green and blue, respectively). The two populations in each set were mixed shortly after preparation and then imaged over 24 hr in a passivated environment. All experiments were performed at 30°C, pH 8.6, and 10 mM MgCl2 with a 1 mM total RNA monomer concentration and a 0.75:1 ratio of (Lys)19-72:RNA. The colocalisation of the two fluorophores within single droplets is measured by the droplet Pearson coefficient (PCCdroplet) (c), whilst the colocalisation of fluorophores in the overall population of droplets is measured by the population Pearson coefficient (PCCpop) (d). The average particle area and number of particles per unit area over time are shown in (e) and (f) respectively. Particles were measured from at least six separate images. Data from active populations are shown in red, while data from inactive populations are shown in black. The number of droplets analysed was n = 1350 - 3174. Error bars are standard errors. Scale bars = 10 μm. Data for condensates formed from the shorter (Lys)5-24 peptide are shown in Figure 3—figure supplement 1.
-
Figure 3—source data 1
Unprocessed and uncropped fluorescence microscope images of mixed populations of 0.75:1 (Lys)19-72:RNA condensates containing active ribozyme imaged in both FAM and Cy5 channels.
Extracted numerical parameters are listed in the accompanying spreadsheet.
- https://cdn.elifesciences.org/articles/83543/elife-83543-fig3-data1-v2.zip
-
Figure 3—source data 2
Unprocessed and uncropped fluorescence microscope images of mixed populations of 0.75:1 (Lys)19-72:RNA condensates containing inactive ribozyme imaged in both FAM and Cy5 channels.
Extracted numerical parameters are listed in the accompanying spreadsheet.
- https://cdn.elifesciences.org/articles/83543/elife-83543-fig3-data2-v2.zip
Figure 3—figure supplement 1
Mixing and content exchange between populations of active or inactive coacervate systems formed from R3C RNA and the (Lys)5-24 peptide.
(a, b) Example images of mixtures of orthogonally labelled coacervate droplets prepared with 3:1 (Lys)5-24:RNA containing either active (a) or inactive (b) ribozyme. Each population in the set contained either 10% FAM- or 10% Cy5-tagged substrate (green and blue, respectively). The two populations in each set were mixed shortly after preparation and then imaged over 24 hr in a passivated environment. All experiments were performed at 30°C, pH 8.6, and 10 mM MgCl2 with a 1 mM total RNA monomer concentration and a 3:1 ratio of (Lys)19-72:RNA. The colocalisation of the two fluorophores within single droplets is measured by the droplet Pearson coefficient (PCPdroplet) (c), whilst the colocalisation of fluorophores in the overall population of droplets is measured by the population Pearson coefficient (PCCpop) (d). The average particle area and number of particles per unit area over time are shown in (e) and (f), respectively. Particles were measured from at least six separate images. Data from active populations are shown in red, while data from inactive populations are shown in black. The number of droplets analysed was n = 1143 - 2921. Error bars are standard errors. Scale bars = 10 μm.
-
Figure 3—figure supplement 1—source data 1
Unprocessed and uncropped fluorescence microscope images of mixed populations of 3:1 (Lys)5-24:RNA condensates containing active ribozyme imaged in both FAM and Cy5 channels.
Extracted numerical parameters are listed in the accompanying spreadsheet.
- https://cdn.elifesciences.org/articles/83543/elife-83543-fig3-figsupp1-data1-v2.zip
-
Figure 3—figure supplement 1—source data 2
Unprocessed and uncropped fluorescence microscope images of mixed populations of 3:1 (Lys)5-24:RNA condensates containing inactive ribozyme imaged in both FAM and Cy5 channels.
Extracted numerical parameters are listed in the accompanying spreadsheet.
- https://cdn.elifesciences.org/articles/83543/elife-83543-fig3-figsupp1-data2-v2.zip
Figure 3—figure supplement 2

Comparison of mixing of labelled RNA in individual fusion droplets over time measured using the droplet Pearson correlation coefficient (PCCdroplet).
The plot displays a comparison between fluorophore colocalisation over time in long (0.75:1 (Lys)19-72:RNA, solid lines) and short (3:1 (Lys)5-24:RNA) coacervate systems that contain either active (red) or inactive (black). All data are fitted with a single exponential. Error bars are standard errors.
-
Figure 3—figure supplement 2—source data 1
Numerical data for all plots displayed in Figure 3—figure supplements 2 and 3.
- https://cdn.elifesciences.org/articles/83543/elife-83543-fig3-figsupp2-data1-v2.zip
Figure 3—figure supplement 3
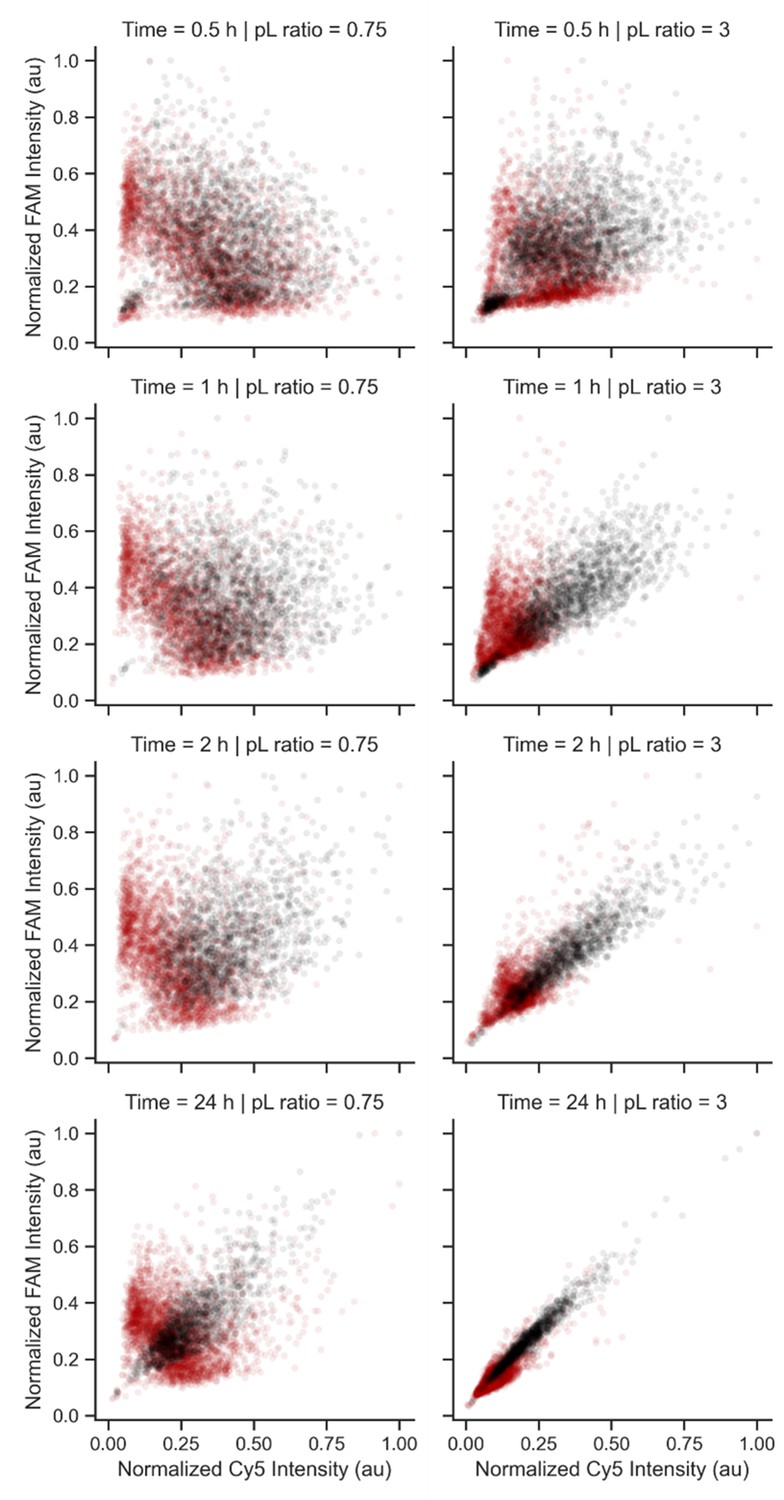
Intensity scatter plots showing the colocalisation of FAM- and Cy5-labelled RNA in mixed droplet populations.
Normalised Cy5 intensity is plotted on the X axis, whilst normalised FAM intensity is plotted on the Y axis. Each data point represents a single coacervate droplet. Droplets were from either 0.75:1 (Lys)19-72:RNA (left) or 3:1 (Lys)5-24:RNA (right) and contained active (red) or inactive (black) ribozyme. Data correspond to results reported in Figure 3 and Figure 3—figure supplement 1 .
Tables
Table 1
Sequences of DNA oligomers used in this study.
| Name | Length | Sequence (5' to 3') |
|---|---|---|
| Substrate | 53 | ATACTTCCAACAGCAGTTAAGTTGCGGTCTCTATAGTGAGTCGTATTAATTTC |
| Active ribozyme | 87 | AACTGCCGTTATCATACTTCAACCCATCCAAAGTGTTACTTACGTAACAAGTGATAACAACTTCCTATAGTGAGTCGTATTAATTTC |
| Inactive ribozyme | 87 | AACTGCCGTTAAAATACAAAAACCCATCCACGCTGTTACGGACGTAACAGGTGATAACAACTTCCTATAGTGAGTCGTATTAATTTC |
| T7 promoter PFWD | 23 | GAAATTAATACGACTCACTATAG |
Table 2
Sequences of RNA oligomers used in thisstudy.
| Name | Length | 5' end | Sequence (5' to 3') | Source |
|---|---|---|---|---|
| Substrate | 31 | Triphosphate | GAGACCGCAACUUAACUGCUGUUGGAAGUAU | IVT |
| Fluorescent sub | 31 | FAM or Cy5 | GAGACCGCAACUUAACUGCUGUUGGAAGUAU | IDT |
| Active ribozyme | 65 | - | GGAAGUUGUUAUCACUUGUUACGUAAGUAACA CUUUGGAUGGGUUGAAGUAUGAUAACGGCAGUU | IVT/IDT |
| Inactive ribozyme | 65 | - | GGAAGUUGUUAUCACCUGUUACGUCCGUAACA GCGUGGAUGGGUUUUUGUAUUUUAACGGCAGUU | IVT/IDT |
-
Red bases represent inactivating mutations.
-
IVT: in vitro transcription.
Additional files
Download links
A two-part list of links to download the article, or parts of the article, in various formats.
Downloads (link to download the article as PDF)
Open citations (links to open the citations from this article in various online reference manager services)
Cite this article (links to download the citations from this article in formats compatible with various reference manager tools)
Ribozyme activity modulates the physical properties of RNA–peptide coacervates
eLife 12:e83543.
https://doi.org/10.7554/eLife.83543


