The rostral intralaminar nuclear complex of the thalamus supports striatally mediated action reinforcement
- Department of Pharmacology, University of Maryland School of Medicine, United States
Figures
Figure 1 with 1 supplement
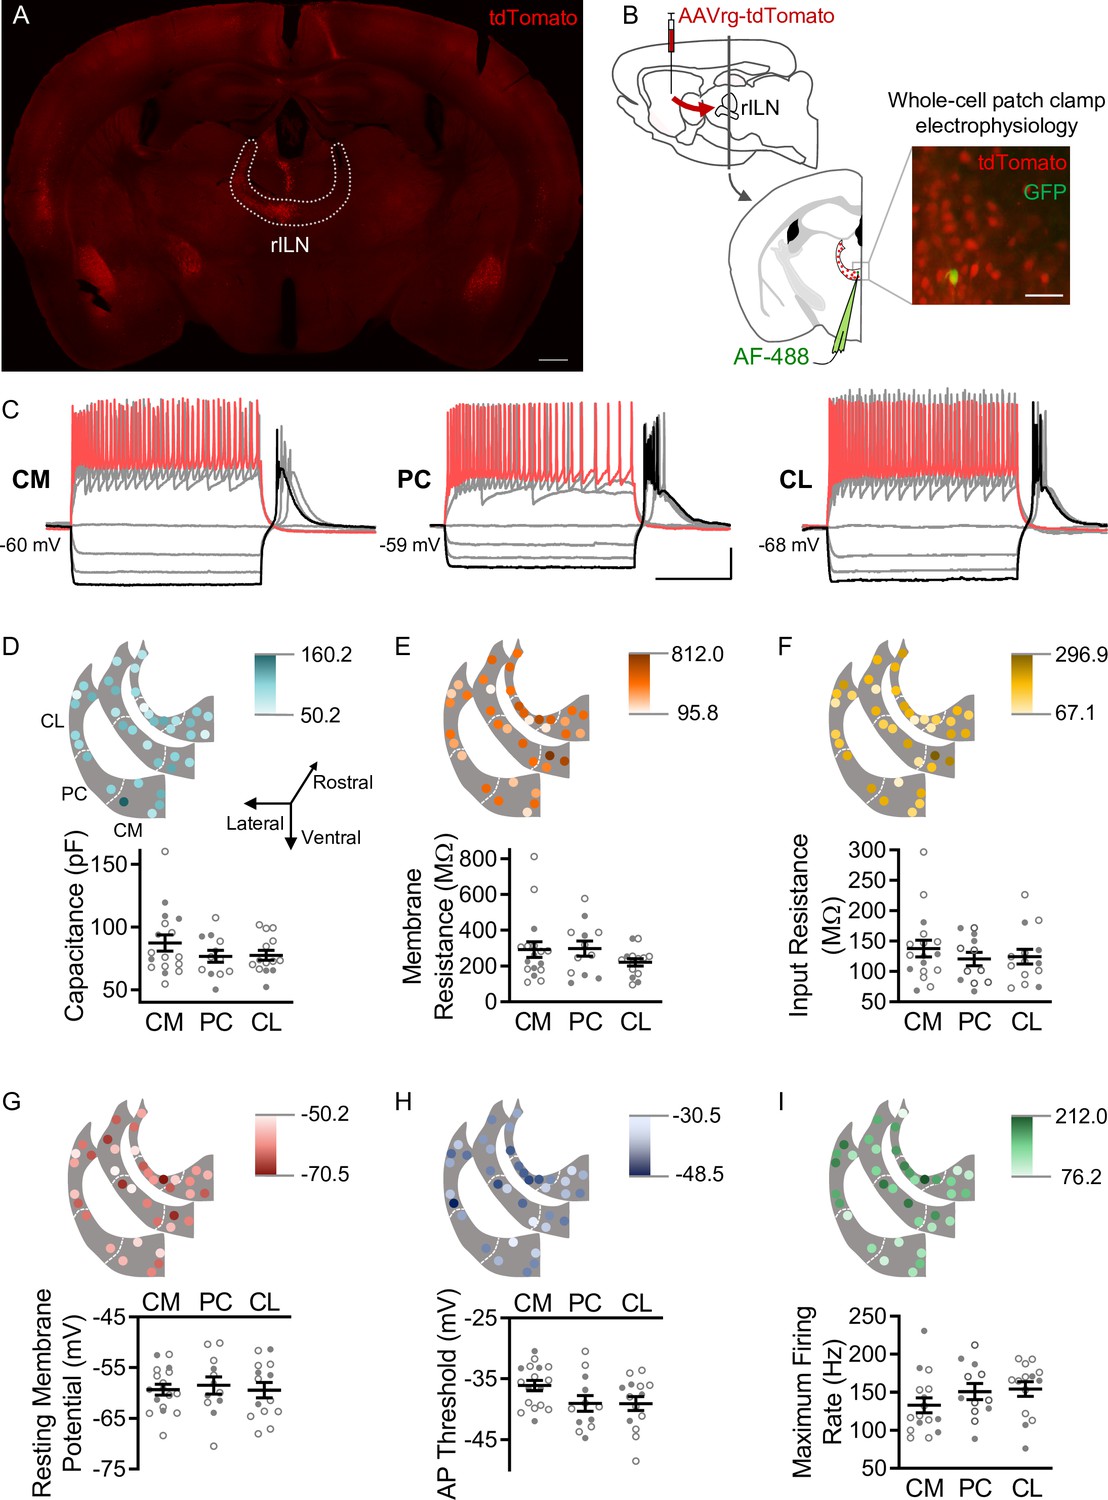
Dorsal striatum (DS)-projecting neurons of the rostral intralaminar nuclei (rILN→DS) thalamus exhibit uniform physiological properties.
(A) rILN→DS neurons project ipsilaterally. Coronal mouse brain section through the rILN. Following AAVrg-tdTomato injection in the left DS left rILN→DS neurons labeled with tdTomato. (B) Left: schematic of experimental strategy to label rILN→DS neurons. Right: a patched neuron (GFP, injected with AlexaFluor[AF]–488) among tdTomato-labeled rILN neurons. (C) Representative traces showing central medial (CM), paracentral (PC), and central lateral (CL) neuronal responses to 500 ms current injection steps. (D) Top: neuronal membrane capacitance of rILN neurons mapped across three rostral-caudal coronal planes in light to dark color gradient spanning minimum to maximum capacitance values. Bottom: membrane capacitance did not differ between CM (n=17), PC (n=12), and CL (n=13) nuclei. (E–I) Analysis of membrane resistance (E), input resistance (F), resting membrane potential (G), action potential (AP) threshold (H), and maximum firing rate elicited by current steps (I; CM n=16), for which no significant differences existed between the three rILN nuclei. Scale bars: 500 µm (A), 100 µm (B), 20 mV and 200 ms (C). One-way ANOVA (D–I). n=number of cells. Filled and open data points represent cells from male and female mice, respectively. Error bars = standard error of the mean (SEM).
-
Figure 1—source data 1
Source electrophysiological data for Figure 1.
- https://cdn.elifesciences.org/articles/83627/elife-83627-fig1-data1-v1.xlsx
Figure 1—figure supplement 1
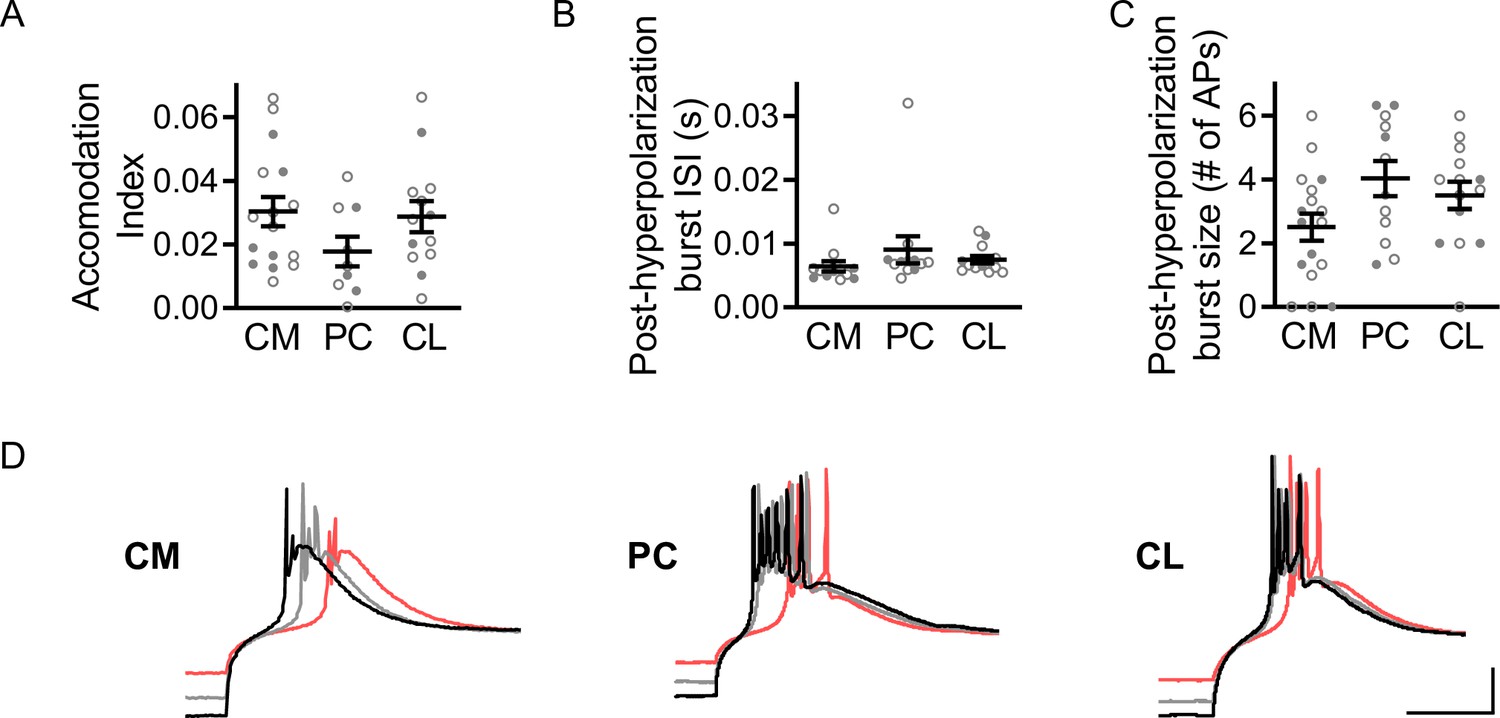
Additional rostral intralaminar nuclei (rILN) firing properties.
(A) The accommodation index for the maximum rate of action potential (AP) firing in response to a depolarizing current step did not differ significantly between central medial (CM; n=16), paracentral (PC; n=9), and central lateral (CL; n=12) neurons. (B) AP burst firing following hyperpolarizing current steps did not significantly differ in inter-spike interval (ISI) between CM (n=13), PC (n=12), and CL (n=12) neurons. (C) The number of APs evoked following hyperpolarizing current steps did not differ significantly between CM (n=17), PC (n=12), and CL (n=13) neurons. (D) Representative traces showing CM, PC, and CL neuronal responses following hyperpolarizing current steps. Scale bars: 20 mV and 100 ms. One-way ANOVA (A–C). n=number of cells. Filled and open data points represent cells from male and female mice, respectively. Error bars = SEM.
-
Figure 1—figure supplement 1—source data 1
Source electrophysiological data for Figure 1—figure supplement 1.
- https://cdn.elifesciences.org/articles/83627/elife-83627-fig1-figsupp1-data1-v1.xlsx
Figure 2 with 1 supplement

Rostral intralaminar nuclei (rILN)→dorsal striatum (DS) activity aligns to action initiation.
(A) Top: experimental strategy for fiber photometric recording of rILN→DS neurons. Bottom: representative expression of cre recombinase (mCherry) and cre-dependent GCaMP6s (GFP) in the DS (left) and rILN (right) with fiber placement in the rILN (right). (B) Left: schematic of lever press trial design. Each trial starts with a 3 s inter-trial interval (ITI) followed by lever extension. A sucrose pellet is delivered following the fifth press, with an 8 s consumption period before the next trial. Right: cartoon of operant chamber with lever and sucrose pellet dispenser. (C) Left: average calcium-dependent activity of rILN→DS neurons aligned to the first press for the first training schedule (red; Fixed-rate 1 no time limit; FR1-NTL), an intermediate protocol (orange; FR5-NTL), and the terminal training schedule (blue; FR5-5s time limit). Right: rILN→DS activity was significantly greater at the time of the first press compared to 1.5 s prior for all three operant schedules (N=13). (D) Representative rILN→DS activity from a mouse completing the FR5 sequence on FR5-NTL (top) and FR5-5s (bottom left) schedules. Gray lines indicate time of lever extension, and colored lines show individual lever presses. (E) Average rILN→DS activity for presses 2–5 from FR5-NTL (top) and FR5-5s (bottom) schedules. (F) The change in z-score from –0.7 s to 0.4 s (relative to press) was positive for all presses on the FR5-NTL schedule (orange) and negative for all presses on the FR5-5s schedule. (G) Left: photometrically recorded rILN→DS activity aligned to the extension of the lever on completed FR5 trials from FR1 (red), FR5-NTL (orange), and FR5-5s (blue) training schedules. Right: rILN→DS signaling increased following lever extension on all schedules except for FR1. (H) The average latency to initiate pressing progressively decreased with training. (I) Left: first press-aligned rILN→DS activity from completed (blue) and incomplete (yellow) FR5 trials in trained mice. Right: the average rILN→DS activity change from –1.5 to 0 s relative to first press differed by trial performance. Scale bars: 500 µm. Two-way repeated measures ANOVA (C, F, G, and I); one-way repeated measures ANOVA (H). N=number of mice. Filled and open data points represent male and female mice, respectively. Error bars = SEM. * p<0.05, ** p<0.01, *** p<0.001, and **** p<0.0001.
-
Figure 2—source data 1
Source photometric and FR5 data for Figure 2.
- https://cdn.elifesciences.org/articles/83627/elife-83627-fig2-data1-v1.xlsx
Figure 2—figure supplement 1

Rostral intralaminar nuclei (rILN)→dorsal striatum (DS) neuronal activity correlates with movement initiation.
(A) Movement speed-aligned rILN→DS activity was recorded in mice freely moving in an open arena. (B) Left: average rILN→DS activity (blue) aligned to movement onset (gray). Right: rILN→DS activity increased at the time of movement onset (N=6). (C) Left: rILN→DS activity aligned to maximum speed in movement epochs. Right: rILN→DS signal peak preceded movement epochs. (D) Left: rILN→DS activity aligned to movement cessation. Right: cessation did not correspond to changes in rILN→DS activity. Paired t-test (B–D). N=number of mice. Filled and open data points represent male and female mice, respectively. Error bars = SEM. * p<0.05, and ** p<0.01.
-
Figure 2—figure supplement 1—source data 1
Source movement and photometric data for Figure 2—figure supplement 1.
- https://cdn.elifesciences.org/articles/83627/elife-83627-fig2-figsupp1-data1-v1.xlsx
Figure 3 with 1 supplement
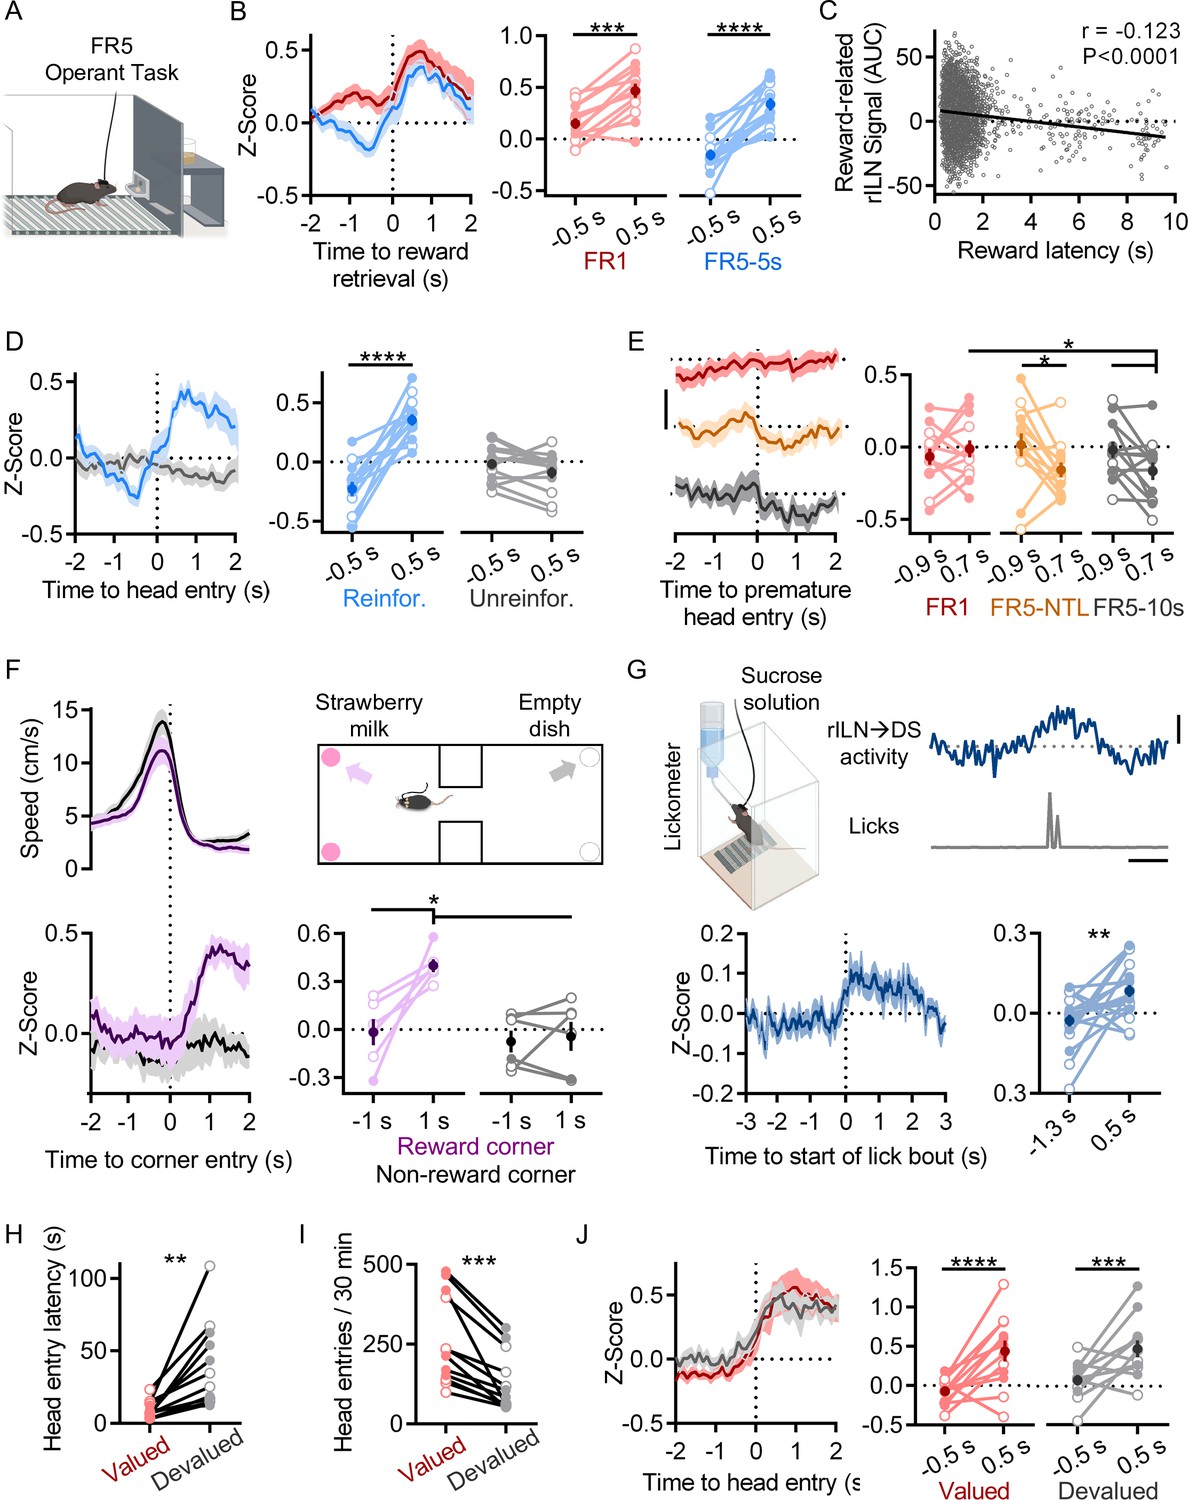
Rostral intralaminar nuclei (rILN)→dorsal striatum (DS) neurons activate with reward acquisition.
(A) Cartoon of operant chamber. (B) Left: rILN→DS activity relative to sucrose pellet retrieval on FR1 (red) and FR5-5s (blue) sessions. Right: rILN→DS activity significantly increased following reward acquisition (N=13). (C) Across all FR5 training schedules, reward retrieval-associated rILN→DS activity negatively correlated with retrieval latency (n=6338). (D) Left: rILN→DS activity aligned to reward receptacle head entry following completed FR5 trials on reinforced (blue) and unreinforced (gray) FR5-5s sessions. Right: rILN→DS activity increased on reinforced sessions only. (E) Left: rILN→DS activity aligned to premature reward receptacle head entries on completed FR1 trials (red), FR5-NTL (orange), and FR5-10s (gray) schedules. Right: rILN→DS activity significantly decreased on FR5-NTL and –10 s protocols. (F) Movement speed (top left) and corresponding rILN→DS activity (bottom) from mice approaching strawberry milk-containing (purple) and empty (gray) corners of a two-chambered arena (top right; N=6). rILN→DS activity increased following entry to strawberry milk-baited corners (top right). (G) rILN→DS activity relative to sucrose water consumption. Top left: sample trace of rILN→DS activity (blue) and corresponding licks (gray). Top right: cartoon of drinking chamber. Bottom: average rILN→DS activity aligned to onset of lick bouts (left) which significantly increased following bout onset (right; N=19). (H–J) rILN→DS activity was recorded from food-restricted mice over multiple sessions in which sucrose pellets were pseudo-randomly dispensed (valued condition; red). Mice were then recorded for multiple sessions that were preceded by 30 min free feeding of sucrose pellets in their home cages (devalued condition; gray; N=12). (H) Mice retrieved dispensed sucrose pellets at a slower latency in the devalued state. (I) Mice entered the food receptacle fewer times during devalued sessions. (J) rILN→DS activity aligned to sucrose pellet retrieval was not significantly different between valued and devalued states. Scale bars: 0.3 z-score (E); 1 s and 0.2 z-score (G). Two-way repeated measures ANOVA (B, D–F, and J); linear correlation (C); paired t-test (G, H, and I). N=number of mice; n=number of trials. Filled and open data points represent male and female mice, respectively. Error bars = SEM. * p<0.05, ** p<0.01, *** p<0.001, and **** p<0.0001.
-
Figure 3—source data 1
Source behavioral and photometric data for Figure 3.
- https://cdn.elifesciences.org/articles/83627/elife-83627-fig3-data1-v1.xlsx
Figure 3—figure supplement 1
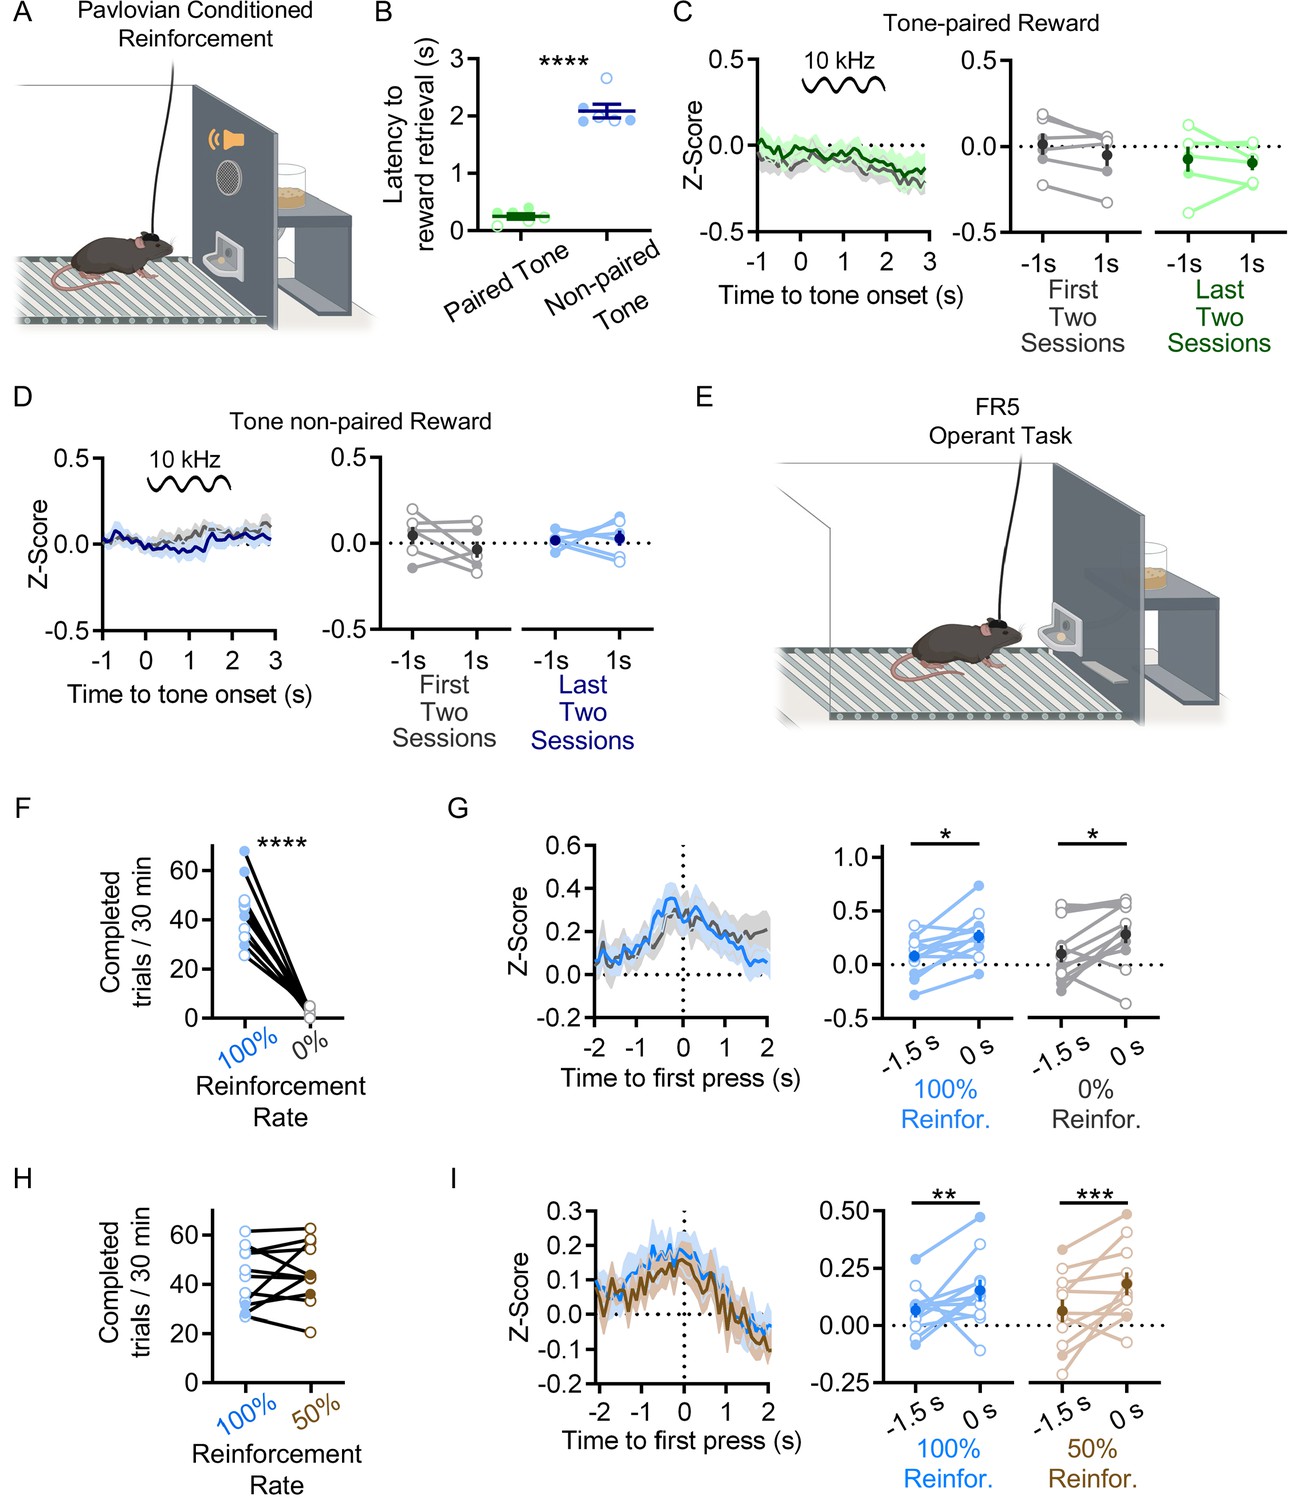
Rostral intralaminar nuclei (rILN)→dorsal striatum (DS) activity does not correlate with reward-predicting Pavlovian cues or changes in operant task reward probability.
(A) Mice underwent a Pavlovian conditioning paradigm in which sucrose pellet delivery immediately followed a pseudo-randomly presented 2 s long tone (tone paired) or in the control group, and 2 s tones and sucrose pellets were pseudo-randomly delivered (tone non-paired). (B) In the last two conditioning sessions, the average latency to retrieve delivered sucrose pellets was significantly shorter for the tone-paired group than the tone non-paired control cohort (t=14.46, p<0.0001). (C) Fiber photometric recordings of rILN→DS neurons did not show significant differences in activity 1 s before and 1 s after the onset of the tone in either early (gray) or late (green) conditioning sessions (N=6). (D) rILN→DS activity in the non-paired cohort was not significantly different 1 s before and 1 s after the onset of the tone in either early (gray) or late (blue) conditioning sessions (N=6). (E) Reinforcement manipulations were conducted in mice well-trained on the FR5 lever press task in F–I. (F and G) rILN→DS activity was recorded from mice in which completed FR5s were reinforced (blue) or not reinforced (gray) with sucrose pellets in separate sessions (N=12). (F) Mice extinguished FR5 responding over two to three sessions in which correct responses were not reinforced (data shown from last session). (G) Left: first press-aligned rILN→DS activity on completed FR5 trials from reinforced (blue) or unreinforced (gray) sessions. Right: comparison of rILN→DS signal at –1.5 s and 0 s relative to first press on completed FR5 trials. (H and I) rILN→DS activity was recorded in a separate cohort of mice that alternated between FR5 sessions in which completed trials were reinforced at 100% (blue) or 50% (brown) rates (N=11). (H) The number of completed FR5 trials did not significantly differ between 100 and 50% reinforcement rate sessions. (I) Left: first press-aligned rILN activity on completed FR5 trials for each reinforcement rate. Right: comparison of average rILN→DS activity at –1.5 s and 0 s relative to first press on completed trials at each reinforcement rate. Unpaired t-test (B), two-way repeated measures ANOVA (C, D, G, and I), paired t-test (F and H). N=number of mice. Filled and open data points represent male and female mice, respectively. Error bars = SEM. * p<0.05, ** p<0.01, *** p<0.001, and **** p<0.0001.
-
Figure 3—figure supplement 1—source data 1
Source behavioral and photometric data for Figure 3—figure supplement 1.
- https://cdn.elifesciences.org/articles/83627/elife-83627-fig3-figsupp1-data1-v1.xlsx
Figure 4 with 1 supplement

Modulating rostral intralaminar nuclei (rILN)→dorsal striatum (DS) neuronal activity bidirectionally alters FR5 performance.
(A) Top: strategy for optical inhibition of rILN→DS neurons in FR5-trained mice. Bottom: representative cre recombinase (mCherry) and halorhodopsin (eNpHR-eYFP; GFP) expression in DS (left) and rILN (right) with optical fibers implanted in the rILN. (B) Schematic of 470 nm light delivery during the FR5 trial starting 0.5 s prior to lever extension and terminating either 2 s following FR5 completion or at time of lever retraction (for incomplete and omitted FR5 trials). Light was delivered pseudo-randomly on 33% of the trials. (C) NpHR-eYFP-expressing (N=15) but not eYFP control (N=13) mice completed fewer FR5s on light-delivered trials (yellow) than non-light-delivered trials (black). (D) NpHR-eYFP but not eYFP-expressing mice had a greater omission rate on light-delivered trials. (E) Light delivery did not alter the proportion of incomplete FR5 trials for either group. (F) Top: strategy for optogenetic activation of rILN→DS neurons. Bottom: representative mCherry-cre (mCherry) and channelrhodopsin (ChR2-eYFP; GFP) expression in DS (left) and rILN (right) with optic fibers implanted in the rILN. (G) 2 s 470 nm blue light was delivered 1 s prior to lever extension on 33% of trials. (H) ChR2-eYFP mice (N=16) completed more FR5s on light-delivered trials (blue) compared to non-light-delivered trials (black) and eYFP control mice (N=11). (I) ChR2-eYFP mice had fewer omissions on light-delivered trials than non-light-delivered trials and eYFP controls. (J) There were no significant differences in the rate of incomplete FR5 trials. Scale bars: 500 µm. Two-way repeated measures ANOVA (C–E and H–J). N=number of mice. Filled and open data points represent male and female mice, respectively. Error bars = SEM. *** p<0.001 and **** p<0.0001. See Figure 4—figure supplement 1 for summary statistics.
-
Figure 4—source data 1
Source behavioral data for Figure 4.
- https://cdn.elifesciences.org/articles/83627/elife-83627-fig4-data1-v1.xlsx
Figure 4—figure supplement 1

Rostral intralaminar nuclei (rILN)→dorsal striatum (DS) manipulation alters FR5 task performance.
Group means and SEM are reported for experimental and control cohorts in percent completed (left), omitted (middle), and incomplete (right) trials, as related to Figure 4C–E (top) and H–J (bottom).
Figure 5 with 2 supplements
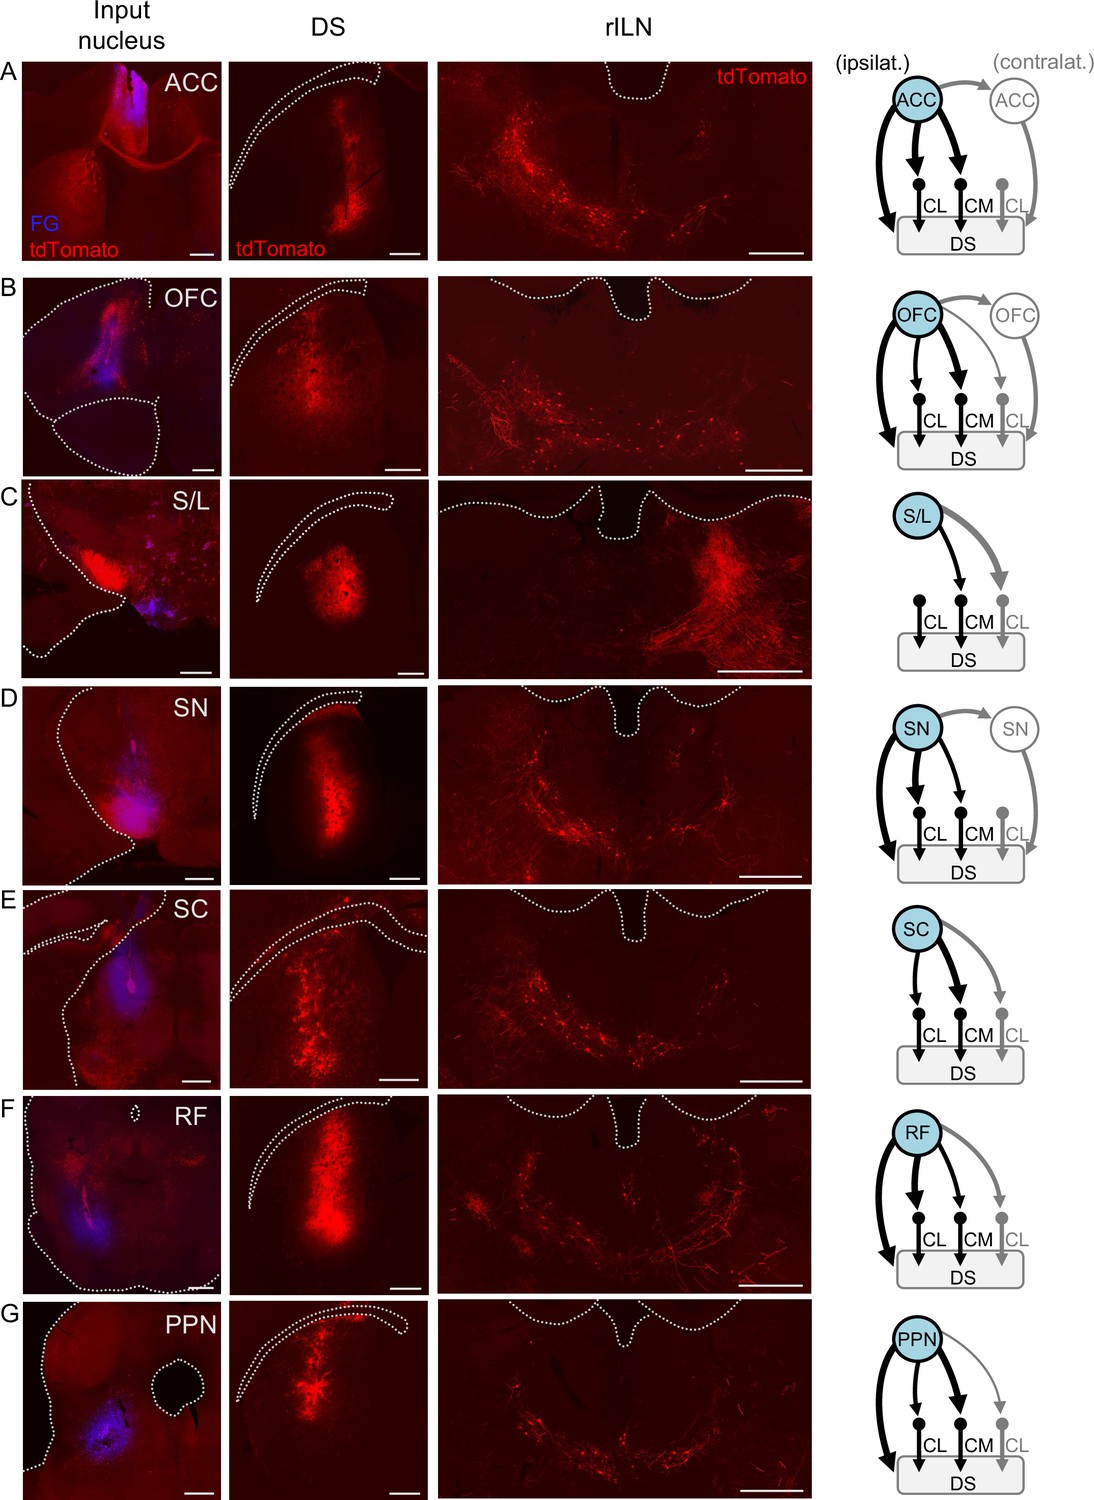
Afferent innervation of rostral intralaminar nuclei (rILN)→dorsal striatum (DS) neurons.
(A) Left: injection sites of AAV1-cre and fluorogold (FG) in the anterior cingulate cortex (ACC). Middle left: injection site for retrograde cre-dependent tdTomato expressing virus in the central DS. Middle right: representative tdTomato labeling of DS-projecting rILN neurons post-synaptic to ACC projections. Right: summary of ACC connectivity to rILN nuclei, with the blue filled nuclei indicating the injected hemisphere. (B–G) Same as A but for orbitofrontal cortex (OFC; B), supramammillary and lateral hypothalamus (S/L; C), substantia nigra (SN; D), superior colliculus (SC; E), reticular formation (RF; F), and pedunculopontine nucleus (PPN; G). Summary diagrams are based on two to four cases per region. Line thickness indicates a difference of ≥40% of labeled neurons between the compared rILN nuclei and (if applicable) contralateral versus ipsilateral direct projections to the striatum. Gray lines indicate circuits contralateral to the injected hemisphere. See Figure 5—figure supplement 2 for circuit quantification. Scale bars: 500 µm.
Figure 5—figure supplement 1
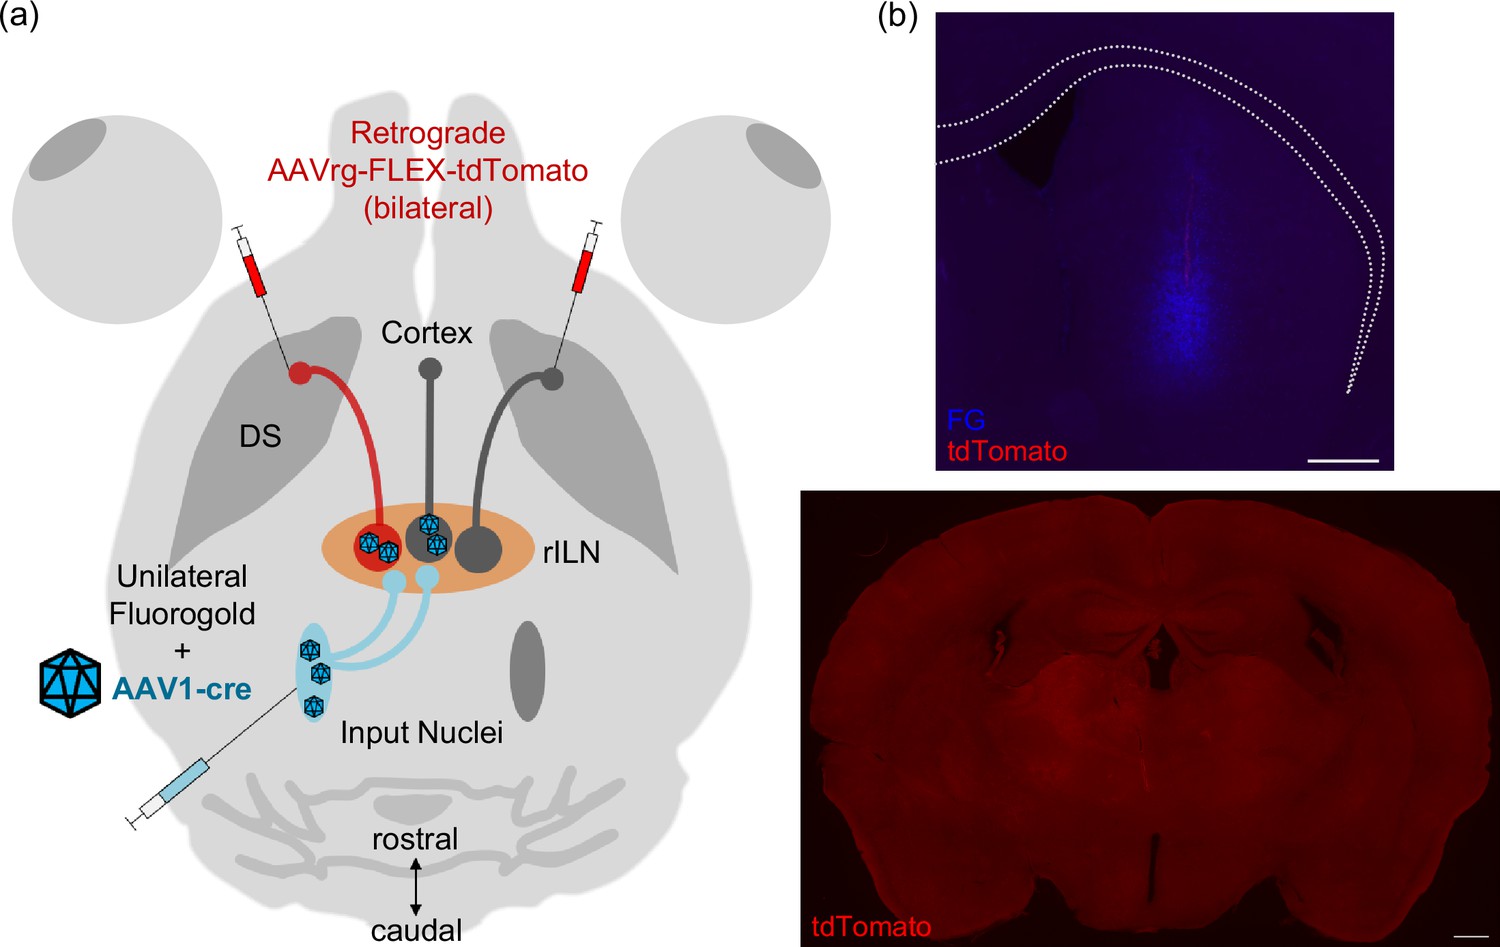
Trans-synaptic neuronal tract tracing to identify specific afferents to the rostral intralaminar nuclei (rILN)→dorsal striatum (DS) circuit.
(A) Experimental strategy. An anterograde trans-synaptic virus expressing cre recombinase (AAV1-cre) was unilaterally injected into a nucleus that projects to the rILN, while a retrograde virus that cre-dependently expresses tdTomato (AAVrg-FLEX-tdTomato) was bilaterally injected into the DS. (B) Top: injection site for fluorogold (FG; as an injection site marker) and AAVrg-FLEX-tdTomato in DS. Bottom: image of thalamus showing no tdTomato labeling in the absence of AAV1-cre injection, demonstrating the necessity for viral transfection of cre for tdTomato expression in efferent cells. Scale bars: 500 µm.
Figure 5—figure supplement 2
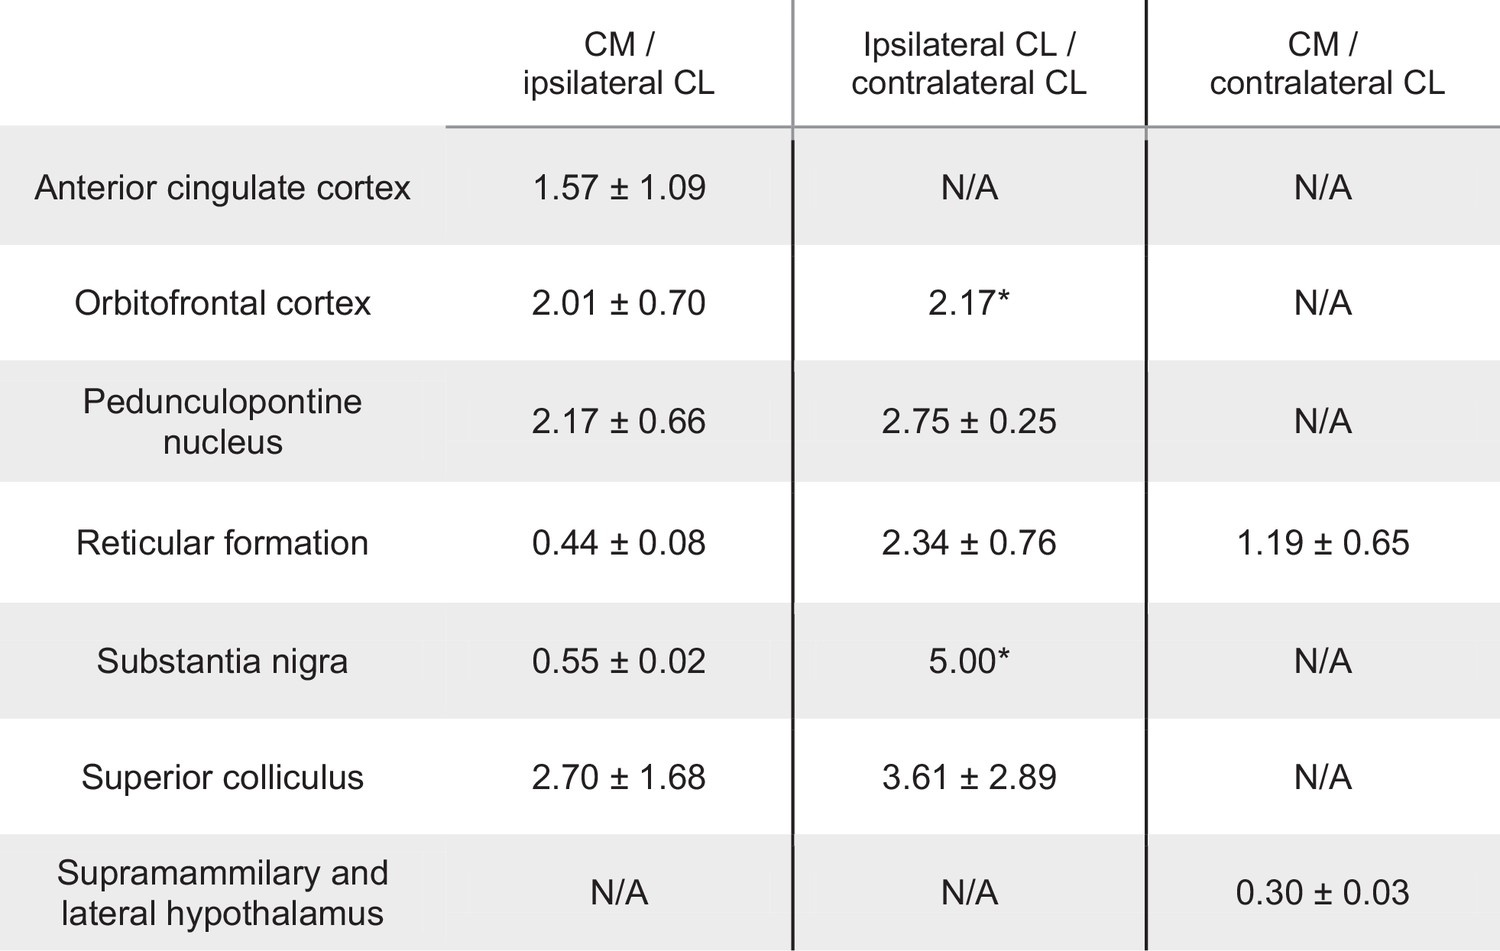
Differences in afferent connectivity to rostral intralaminar nuclei (rILN)→dorsal striatum (DS) projection neurons across the three rILN nuclei.
Ratios of cell counts (corrected for area) of DS-projecting rILN neurons innervated by targeted afferents (left column). The average ratio and SEM are reported. Averages are derived from two cases per afferent. *Contralaterally labeled central lateral (CL) cells were only observed in one case.
Tables
Key resources table
| Reagent type (species) or resource | Designation | Source or reference | Identifiers | Additional information |
|---|---|---|---|---|
| Strain and strain background (Mus musculus) | Wild-type | C57BL/6J; Jackson Laboratory | #000664 | Male and female; 2–5 months old |
| Antibody | Goat polyclonal anti-GFP | Abcam | #ab6673 | 1:2000 |
| Antibody | Chicken polyclonal anti-mCherry | Novus Biologicals | #NBP2-25158 | 1:2000 |
| Antibody | Donkey polyclonal anti-goat conjugated to Alexa Fluor 488 | Jackson ImmunoResearch | #703-545-155 | 1:1500 |
| Antibody | Donkey polyclonal anti-chicken conjugated to Alexa Fluor 594 | Jackson ImmunoResearch | #703-585-155 | 1:1500 |
| Software and algorithm | Clampex 10.4.1.4 | Molecular Devices | ||
| Software and algorithm | Clampfit 10.4.1.4 | Molecular Devices | ||
| Software and algorithm | Med-PC | Med Associates Inc. | ||
| Software and algorithm | Ethovision XT | Noldus | ||
| Software and algorithm | Prism 6.01 | Graphpad | ||
| Software and algorithm | Matlab R2019a | The MathWorks Inc. | ||
| Other (AAV) | AAVrg-EF1a-mcherry-IRES-Cre | Addgene | #55632-AAVrg | See Materials and methods: Surgical procedures |
| Other (AAV) | AAV5-Syn-Flex-GCaMP6s | Addgene | #100845-AAV5 | See Materials and methods: Surgical procedures |
| Other (AAV) | AAV5-EF1a-DIO-eNpHR3.0-eYFP-WPRE | Addgene | #26966-AAV5 | See Materials and methods: Surgical procedures |
| Other (AAV) | AAV5-EF1a-DIO-hSyn-ChR2-eYFP-WPRE | Addgene | #20298-AAV5 | See Materials and methods: Surgical procedures |
| Other (AAV) | AAV5-EF1a-DIO-eYFP-WPRE | Addgene | #27056-AAV5 | See Materials and methods: Surgical procedures |
| Other (AAV) | AAVrg-CAG-tdTomato | Addgene | #59462-AAVrg | See Materials and methods: Surgical procedures |
| Other (AAV) | AAVrg-CAG-FLEX-tdTomato-WPRE | Addgene | #28306-AAVrg | See Materials and methods: Surgical procedures |
| Other (AAV) | AAV1-hSyn-Cre-WPRE-hGH | Addgene | #105553-AAV1 | See Materials and methods: Surgical procedures |
| Other (motivator) | Sucrose pellet, 14 mg | BioServ | #F05684 | See Materials and methods: Behavioral testing |
Additional files
-
MDAR checklist
- https://cdn.elifesciences.org/articles/83627/elife-83627-mdarchecklist1-v1.docx
-
Source code 1
Source code for the processing and alignment of the photometric signal to experiment-related events.
- https://cdn.elifesciences.org/articles/83627/elife-83627-code1-v1.zip
Download links
A two-part list of links to download the article, or parts of the article, in various formats.
Downloads (link to download the article as PDF)
Open citations (links to open the citations from this article in various online reference manager services)
Cite this article (links to download the citations from this article in formats compatible with various reference manager tools)
The rostral intralaminar nuclear complex of the thalamus supports striatally mediated action reinforcement
eLife 12:e83627.
https://doi.org/10.7554/eLife.83627


