Fever integrates antimicrobial defences, inflammation control, and tissue repair in a cold-blooded vertebrate
- University of Alberta, Canada
- Emory University, United States
Figures
Figure 1
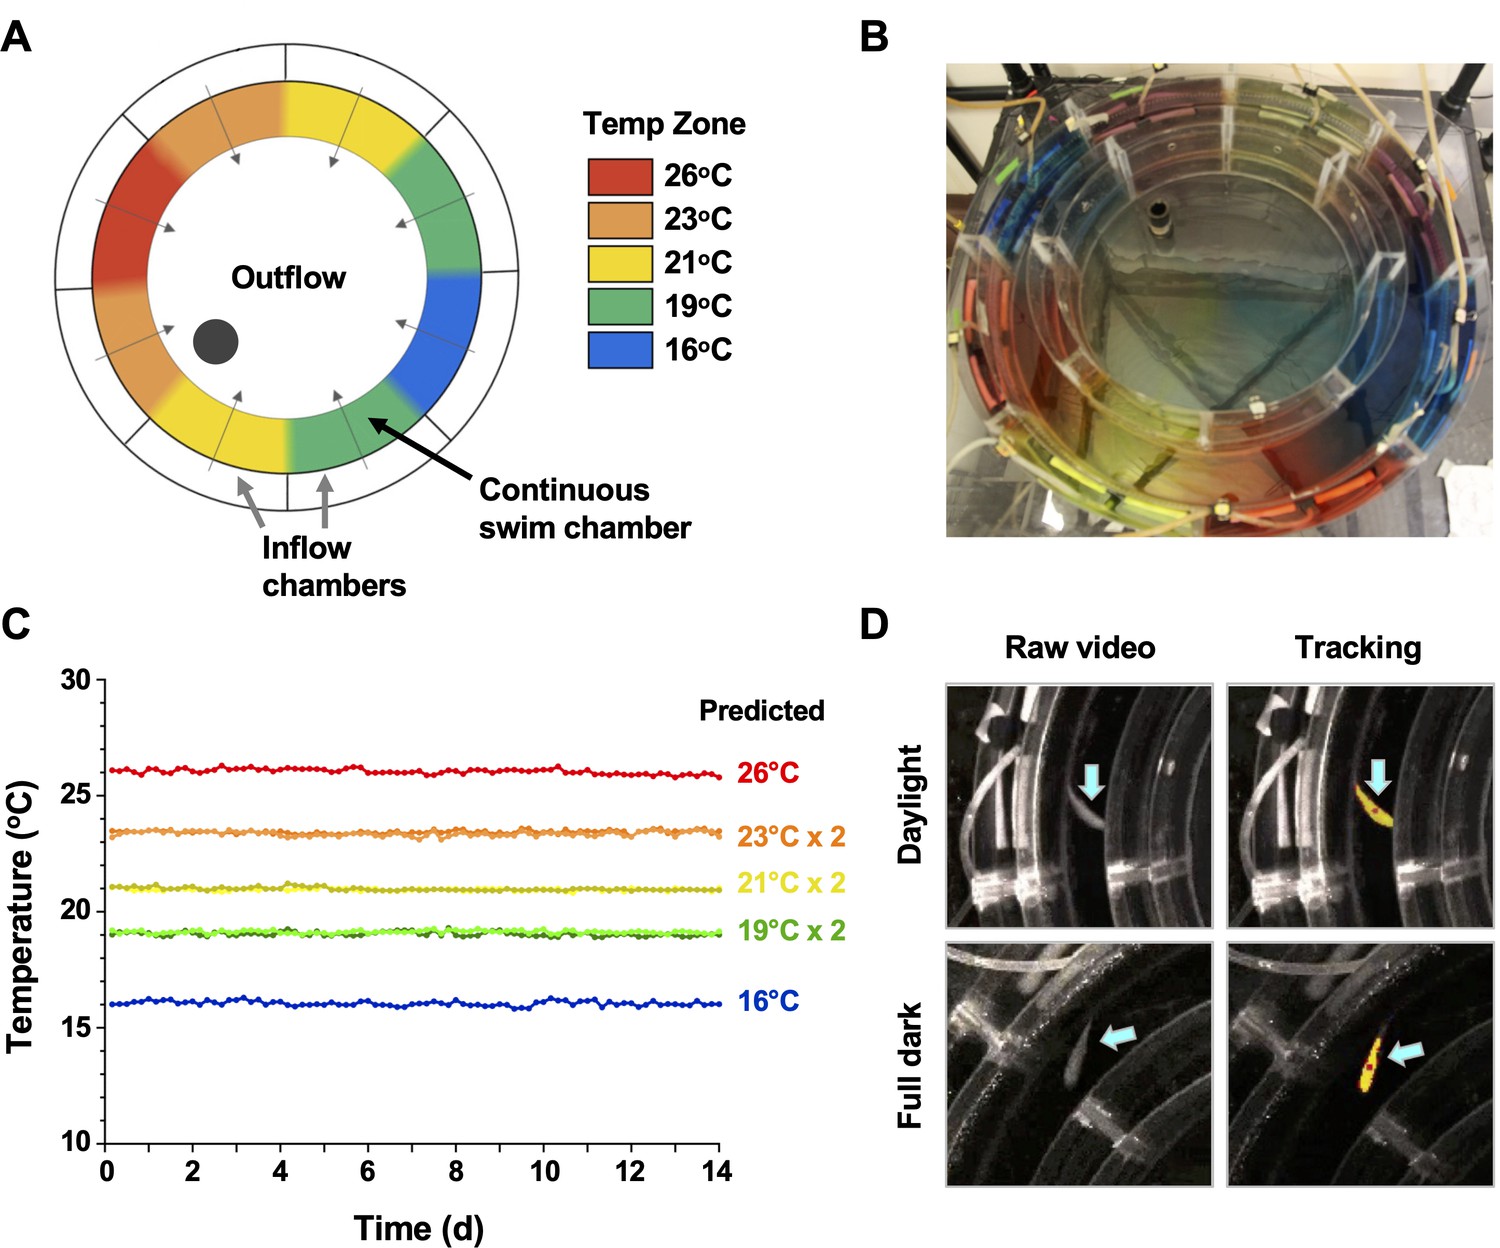
Annular temperature preference tank (ATPT) design, validation, and fish tracking.
(A) The ATPT established a continuous ring-shaped swim chamber that offered distinct temperature environments separated by fluid dynamics instead of physical barriers. (B) Dye flow test highlights eight distinct thermal zones created using concentric flow directed towards the centre of the apparatus. (C) Analysis of temperature stability for established thermal zones. Single lines correspond to highest (26°C) and lowest (16°C) temperatures. Double lines denote values from equivalent zones on opposing sides of the apparatus for 19, 21, and 23°C target temperatures. Raw data included as Figure 1—source data 1. (D) Representative images of a fish (blue arrows) in raw infrared and processed video, under simulated daylight and night (full dark) conditions. Yellow identifier denotes strong tracking signal achieved for experimental setup. Red dot denotes centre point used to set coordinates for raw behavioural data.
-
Figure 1—source data 1
Numerical data contributing to Figure 1.
- https://cdn.elifesciences.org/articles/83644/elife-83644-fig1-data1-v1.xlsx
Figure 2
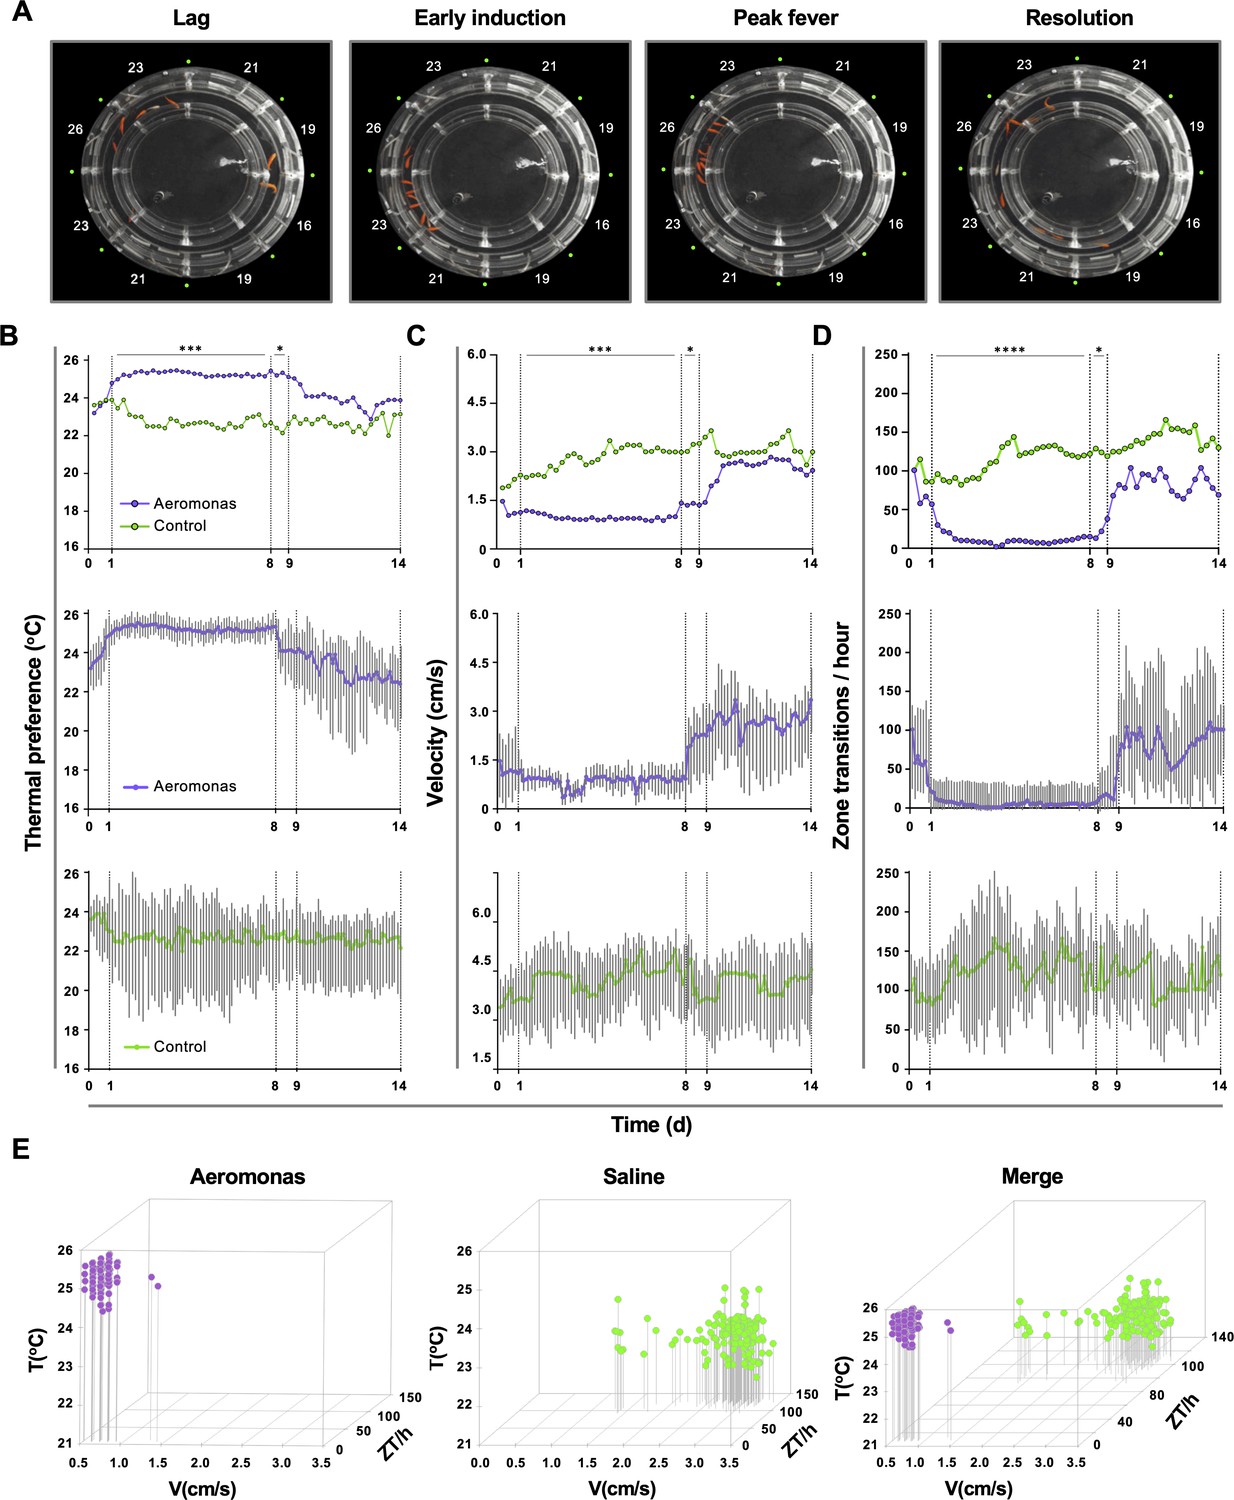
Homogeneity in thermal preference and sickness behaviours among fish eliciting fever.
(A) Fish infected with Aeromonas veronii were free to select a range of environmental temperatures within the annular temperature preference tank (ATPT). Video still images show collective positioning of fish during distinct phases of fever response. Labels correspond to mean temperature for each ATPT thermal zone. (B) Temperature preference, (C) velocity, and (D) total transitions across thermal zones for fish infected with Aeromonas (n = 5) or mock infected with saline (n = 5). Fish were placed separately in the ATPT and individually monitored for 2 weeks. Evaluation of behavioural variance shows distinct periods of marked consistency in temperature preference, swimming velocity, and thermal zone transitions across Aeromonas-infected fish. Solid lines represent mean hourly values and vertical grey bars correspond to standard deviation at each time point. Results were analyzed by an ordinary two-way analysis of variance (ANOVA) and Šídák’s multiple comparisons test. *p < 0.05, p < 0.01, ***p < 0.001, ****p < 0.0001. (E) Simultaneous three-parameter representation of behaviour hourly data points for Aeromonas-infected and saline control fish (n = 5 fish and 168 data points per group; mean values for 5 fish shown). 3D plots correspond to 1–8 dpi febrile period. Merged graph highlights segregation of behavioural responses. Figure produced using R (version 3.3). Raw data and open-source code included as Figure 2—source data 1–5.
-
Figure 2—source data 1
Numerical data contributing to Figure 2.
- https://cdn.elifesciences.org/articles/83644/elife-83644-fig2-data1-v1.xlsx
-
Figure 2—source data 2
Numerical data contributing to Figure 2.
- https://cdn.elifesciences.org/articles/83644/elife-83644-fig2-data2-v1.xlsx
-
Figure 2—source data 3
Numerical data contributing to Figure 2.
- https://cdn.elifesciences.org/articles/83644/elife-83644-fig2-data3-v1.xlsx
-
Figure 2—source data 4
Numerical data contributing to Figure 2.
- https://cdn.elifesciences.org/articles/83644/elife-83644-fig2-data4-v1.xlsx
-
Figure 2—source data 5
Code contributing to Figure 2.
- https://cdn.elifesciences.org/articles/83644/elife-83644-fig2-data5-v1.zip
Figure 3 with 1 supplement
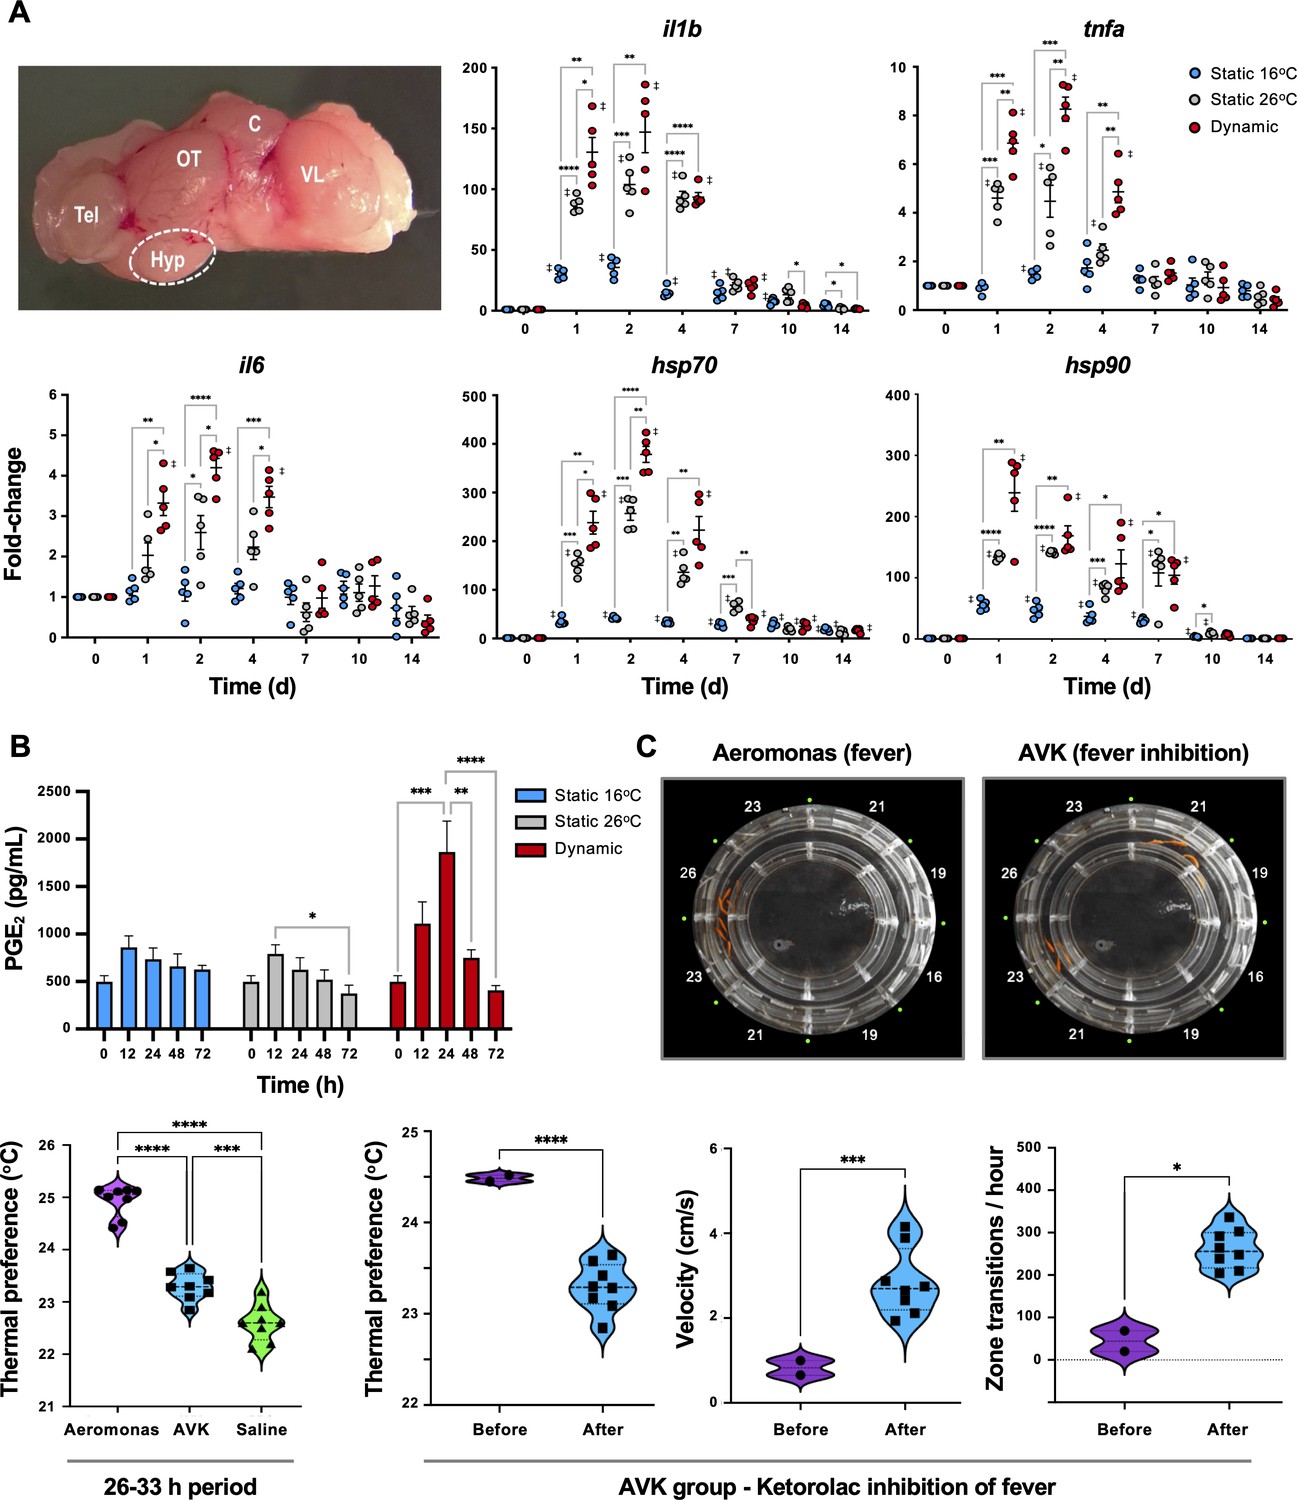
Confirmation that fish fever engages central nervous system (CNS) and systemic pyrogenic signals following Aeromonas infection.
Fish were inoculated and placed in static 16°C (basal acclimated temperature), static 26°C (mechanical hyperthermia; maximum temp. that fish selected during behavioural fever), or dynamic fever (where fish could move freely between thermal zones). (A) Quantitative PCR (qPCR) evaluation of hypothalamic responses following infection (n = 5 per group per time point; 3 technical replicates per fish per time point). Symbols correspond to individual samples; lines represent the mean ± standard error of the mean (SEM); actinb served as reference gene. Results analyzed by an ordinary two-way analysis of variance (ANOVA) using Tukey post hoc test. (B) Plasma collected at 0, 12, 24, 48 and 72 hr post-infection (n = 6 per group per time point) and prostaglandin E2 (PGE2) concentrations determined via ELISA. Results analyzed by an ordinary one-way ANOVA followed by a Tukey’s post hoc test. Error bars represent + SEM. (C) Confirmation that an antipyretic inhibits fish fever. Video still images illustrate disruption of high thermal preference collective positioning following treatment of Aeromonas-infected fish with ketorolac tromethamine. Quantitation of thermal preference shows differences between fish infected with Aeromonas, those infected with Aeromonas and treated with ketorolac (AVK), and those mock infected with saline (n = 5 fish per group per time point). Observation period began 2 hr after start of peak febrile response (26 hr) and continued for 8-hr duration of ketorolac action. One way ANOVA followed by Tukey’s multiple comparisons test compared Aeromonas, AVK, and saline groups. Changes were further evaluated within AVK group before and after ketorolac administration. Welch’s t-tests compared behavioural parameters. For all, *p < 0.05, **p < 0.01, ***p < 0.001, ****p < 0.0001; ‡ denotes significant difference from time 0, p < 0.05. Raw data included as Figure 3—source data 1–3.
-
Figure 3—source data 1
Numerical data contributing to Figure 3.
- https://cdn.elifesciences.org/articles/83644/elife-83644-fig3-data1-v1.xlsx
-
Figure 3—source data 2
Numerical data contributing to Figure 3.
- https://cdn.elifesciences.org/articles/83644/elife-83644-fig3-data2-v1.xlsx
-
Figure 3—source data 3
Numerical data contributing to Figure 3.
- https://cdn.elifesciences.org/articles/83644/elife-83644-fig3-data3-v1.xlsx
Figure 3—figure supplement 1
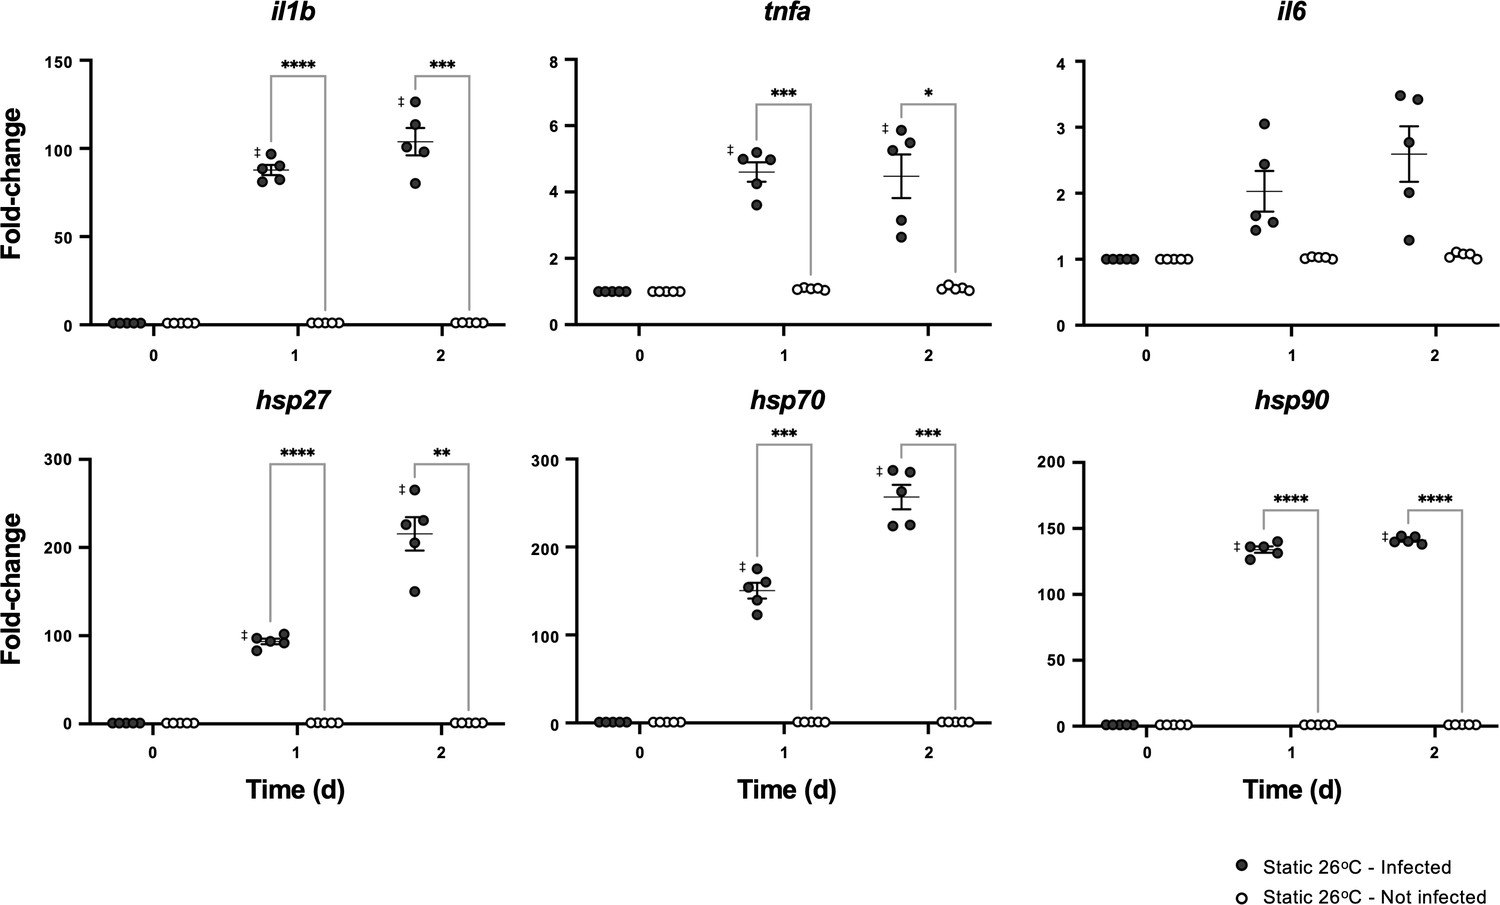
Thermal increases alone are not sufficient to engage central nervous system (CNS) and stimulate immune regulatory and cytoprotective genes.
Aeromonas- or mock-infected fish were placed in 26°C static thermal conditions following inoculation. Quantitative real-time PCR evaluated gene expression in the hypothalamus following infection (n = 5 per group per time point; 3 technical replicates per fish per time point; actinb served as reference gene). Symbols correspond to individual samples and lines represent the mean ± standard error of the mean (SEM). Results were analyzed by an ordinary two-way analysis of variance (ANOVA) using Tukey post hoc test. *p < 0.05, **p < 0.01, ***p < 0.001, ****p < 0.0001; ‡ denotes significant difference from time 0, p<0.05. Raw data included as Figure 3—figure supplement 1—source data 1.
-
Figure 3—figure supplement 1—source data 1
Numerical data contributing to Figure 3—figure supplement 1.
- https://cdn.elifesciences.org/articles/83644/elife-83644-fig3-figsupp1-data1-v1.xlsx
Figure 4 with 1 supplement
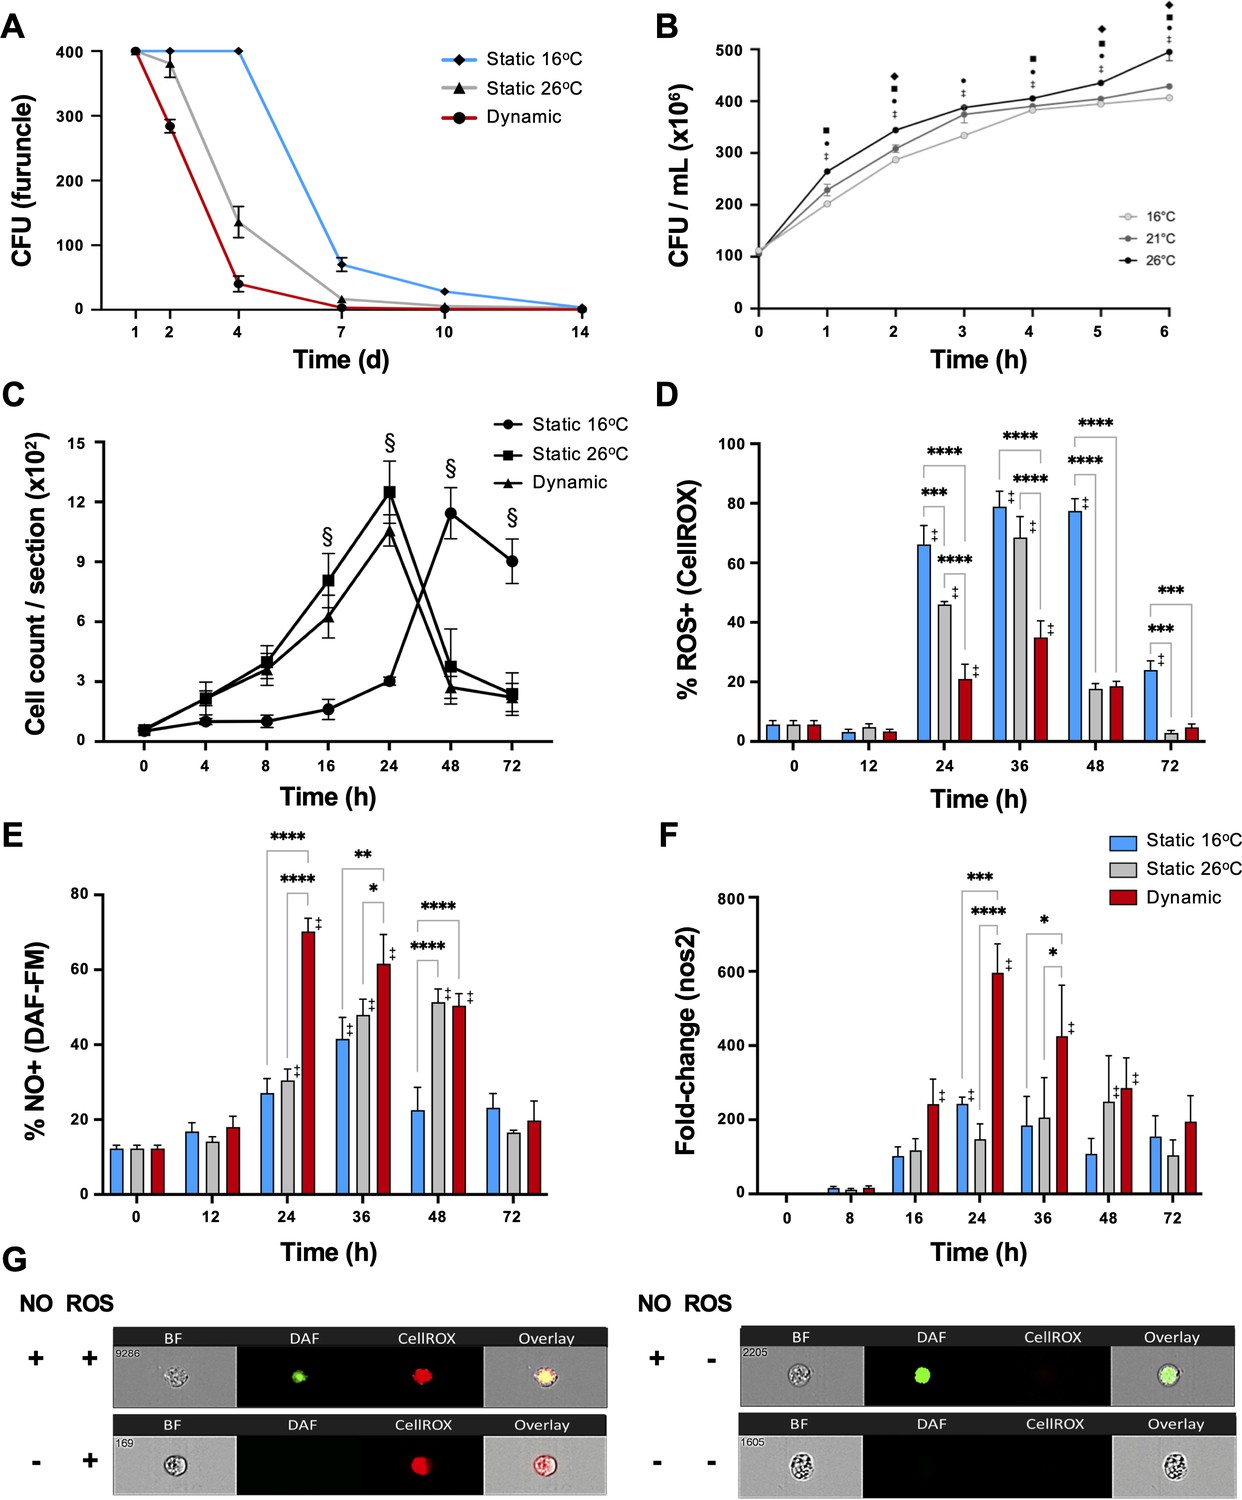
Fever enhances pathogen clearance while showing selectivity in the induction of reactive oxygen species (ROS) and nitric oxide (NO) antimicrobial defenses.
Fish were infected with Aeromonas and placed under 16°C static, 26°C static (mechanical hyperthermia), or dynamic host-driven fever conditions. (A) Bacterial loads and pathogen shedding potential assessed following surface sampling of infection site. Mean values ± standard error of the mean (SEM) shown (n = 5 per group per time point; 3 technical replicates per fish per time point). (B) Effect of temperature on Aeromonas growth assessed in vitro (n = 3 per group per time point). Results analyzed by an ordinary two-way analysis of variance (ANOVA) using Tukey post hoc test. Differences correspond to statistical significance of p < 0.05 between 16 vs. 26°C (•), 16 vs. 21°C (♦), and 21°C vs. 26°C (■); ‡ denotes significant difference from time 0, p < 0.05. (C) Hematoxylin and eosin were used to stain infected wounds. ImageJ analysis assessed differential cell recruitment (n = 3 per group per time point); refer to Figure 4—figure supplement 1 for source data. Results analyzed by an ordinary two-way ANOVA using Tukey post hoc test. § corresponds to statistical significance of p < 0.01 when dynamic and static 26°C groups were compared to 16°C static conditions. No significant differences found between dynamic and static 26°C groups at any time point. Following Aeromonas challenge, cutaneous leukocytes were isolated from fish held at 16°C static, 26°C static, or fever dynamic thermal conditions. Imaging flow cytometry evaluated leukocyte production of (D) ROS via CellROX, and (E) nitric oxide production via DAF-FM-DA (n = 5 per group per time point). (F) qPCR analysis of wound tissue shows kinetics gene encoding inducible nitric oxide synthase (iNOS; n = 5 per group per time point; 3 technical replicates per fish per time point; actinb served as reference gene). (G) ImageStream MKII flow cytometer images show positive and negative cells after CellROX and DAF-FM-DA staining. Results analyzed using a two-way ANOVA followed by Tukey’s post hoc test. *p < 0.05, **p < 0.01, ***p < 0.001, ****p < 0.0001; ‡ denotes significant difference from time 0, p < 0.05. Raw data included as Figure 4—source data 1–4.
-
Figure 4—source data 1
Numerical data contributing to Figure 4.
- https://cdn.elifesciences.org/articles/83644/elife-83644-fig4-data1-v1.xlsx
-
Figure 4—source data 2
Numerical data contributing to Figure 4.
- https://cdn.elifesciences.org/articles/83644/elife-83644-fig4-data2-v1.xlsx
-
Figure 4—source data 3
Numerical data contributing to Figure 4.
- https://cdn.elifesciences.org/articles/83644/elife-83644-fig4-data3-v1.xlsx
-
Figure 4—source data 4
Numerical data contributing to Figure 4.
- https://cdn.elifesciences.org/articles/83644/elife-83644-fig4-data4-v1.xlsx
Figure 4—figure supplement 1
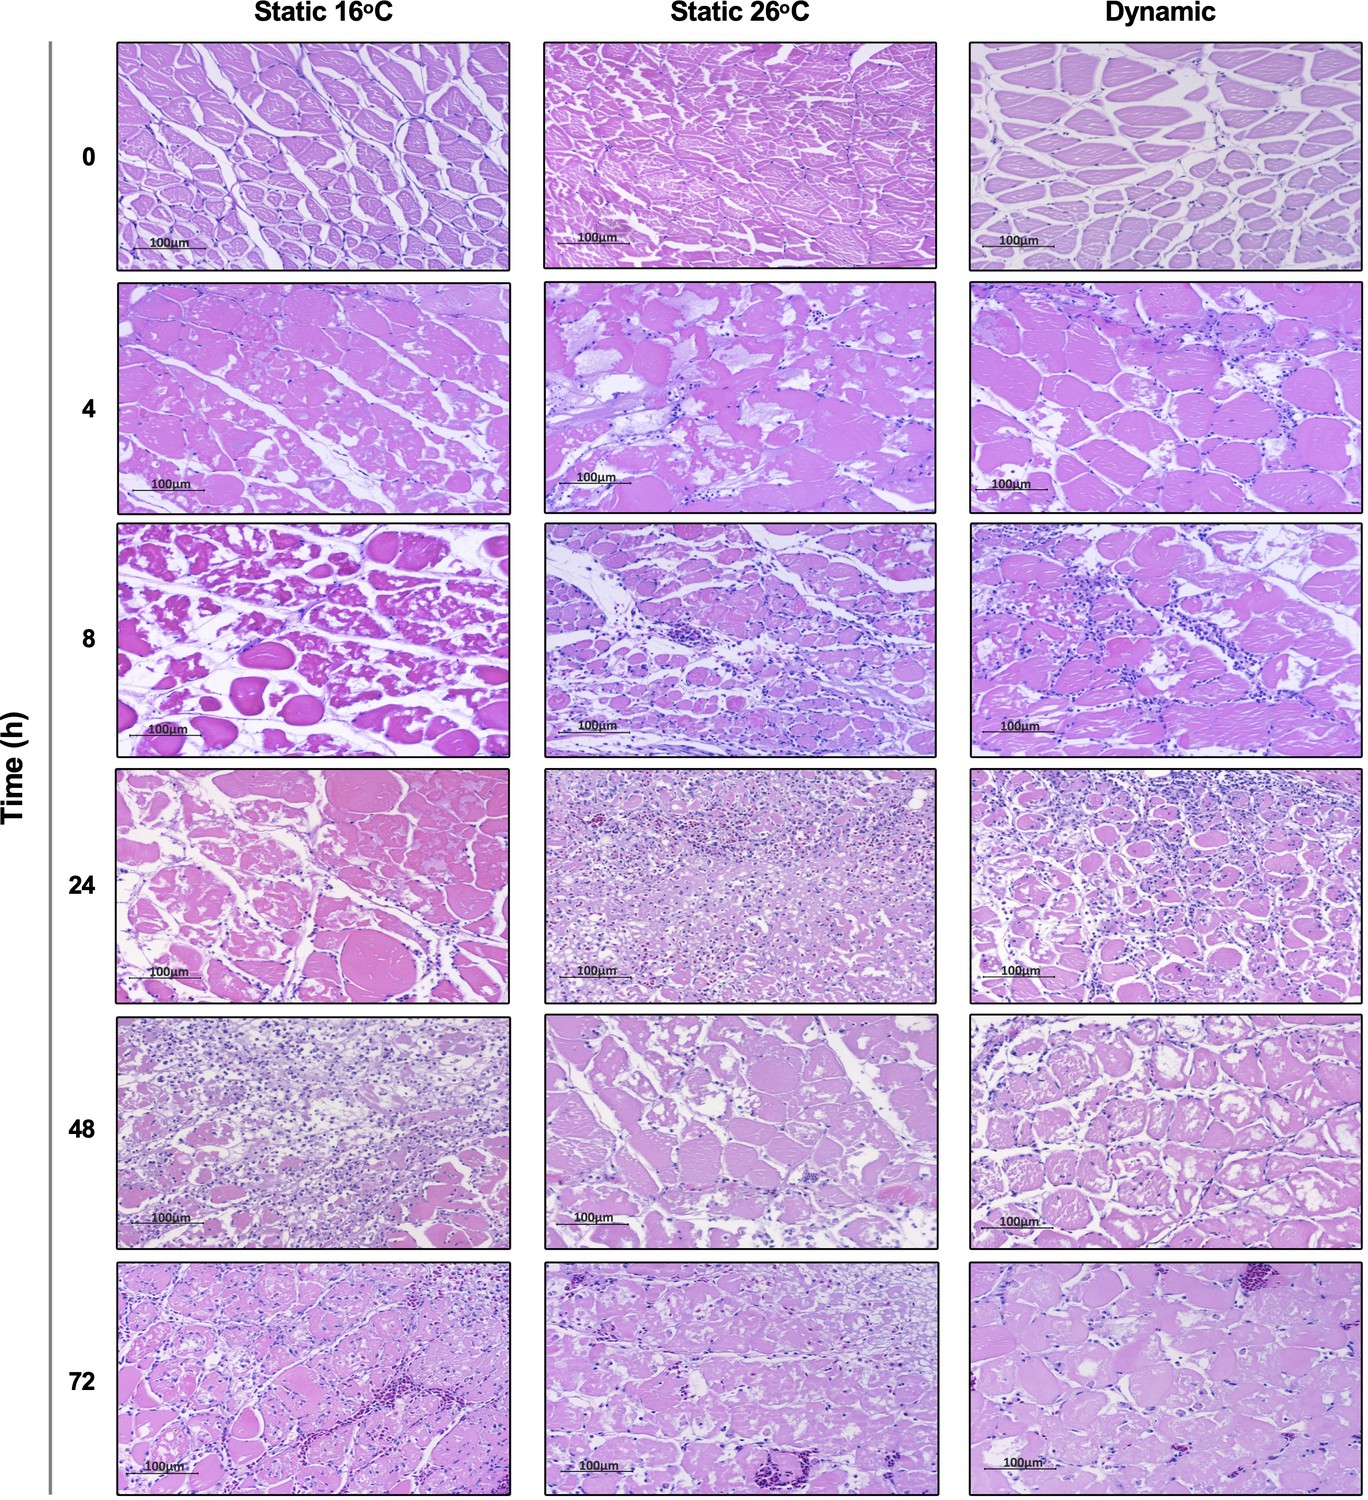
Thermal promotion of leukocyte recruitment to skin wounds in Aeromonas-infected fish.
Hematoxylin and eosin were used to stain tissues sectioned from the skin infection site after housing of fish at 16°C static, 26°C static, or dynamic host-driven fever conditions. Time points capture initial 0–72 hr of acute inflammation (n = 3 per group per time point). Scale bar: 100 μm.
Figure 5
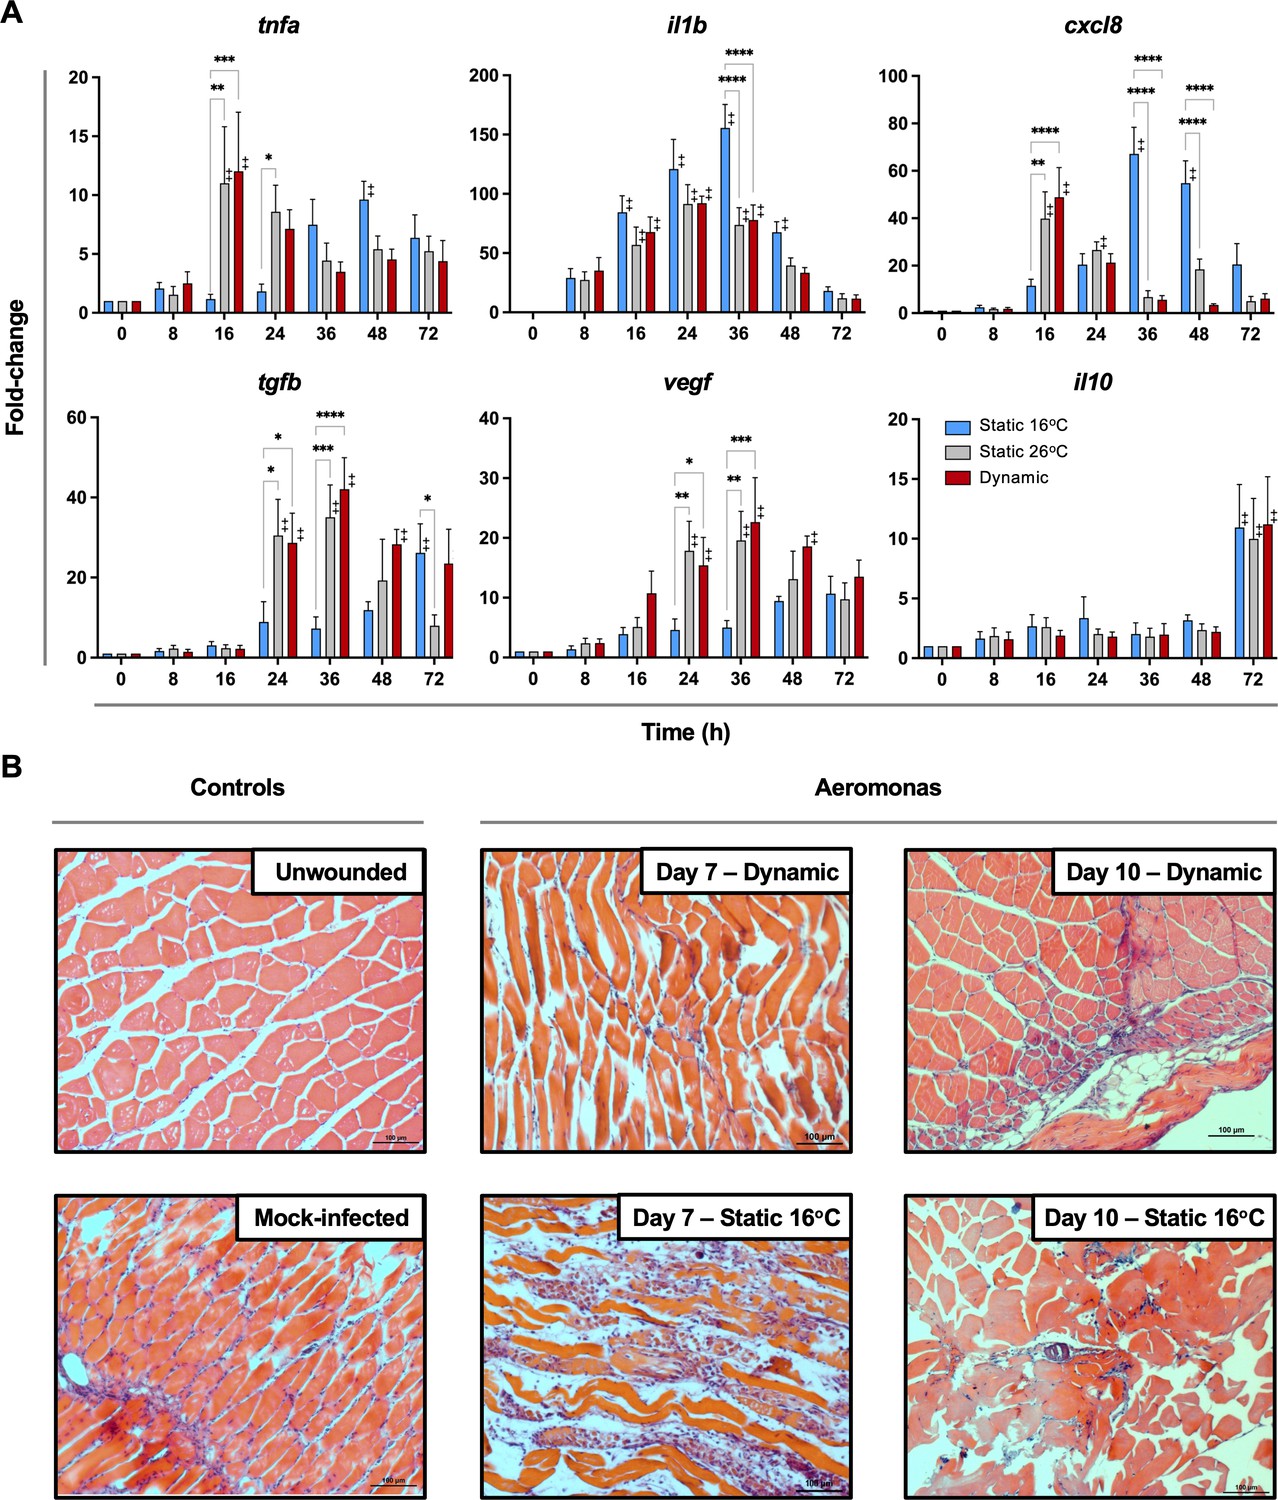
Fever promotes inflammation control and shows early engagement of tissue repair regulators following Aeromonas infection.
(A) Cutaneous wounds were evaluated for expression of genes encoding pyrogenic cytokines tumor necrosis factor alpha (TNFA) and interleukin-1 beta (IL1B), CXCL8 chemokine, and pro-resolution cytokines VEGF, TGFB, and IL10 via qPCR (n = 5 per group per time point; 3 technical replicates per fish per time point; actinb served as reference gene). Data were analyzed with an ordinary two-way analysis of variance (ANOVA) using a Tukey post hoc test. *p < 0.05, **p < 0.01, ***p < 0.001, ****p < 0.0001; ‡ denotes significant difference from time 0, p < 0.05. Raw data included as Figure 5—source data 1. (B) Histopathological assessment highlights inflammation, skin barrier damage, and repair at mid and late stages of the infection process. Hematoxylin and eosin (H&E)-stained tissues sectioned from fish inoculated with Aeromonas and allowed to exert fever (dynamic) or placed under 16°C static conditions. H&E-stained tissues sectioned from healthy controls (day 0; non-inoculated) or mock-infected fish (day 0 saline) are provided as controls. n = 3 for each group. Scale bar: 100 μm.
-
Figure 5—source data 1
Numerical data contributing to Figure 5.
- https://cdn.elifesciences.org/articles/83644/elife-83644-fig5-data1-v1.xlsx
Figure 6
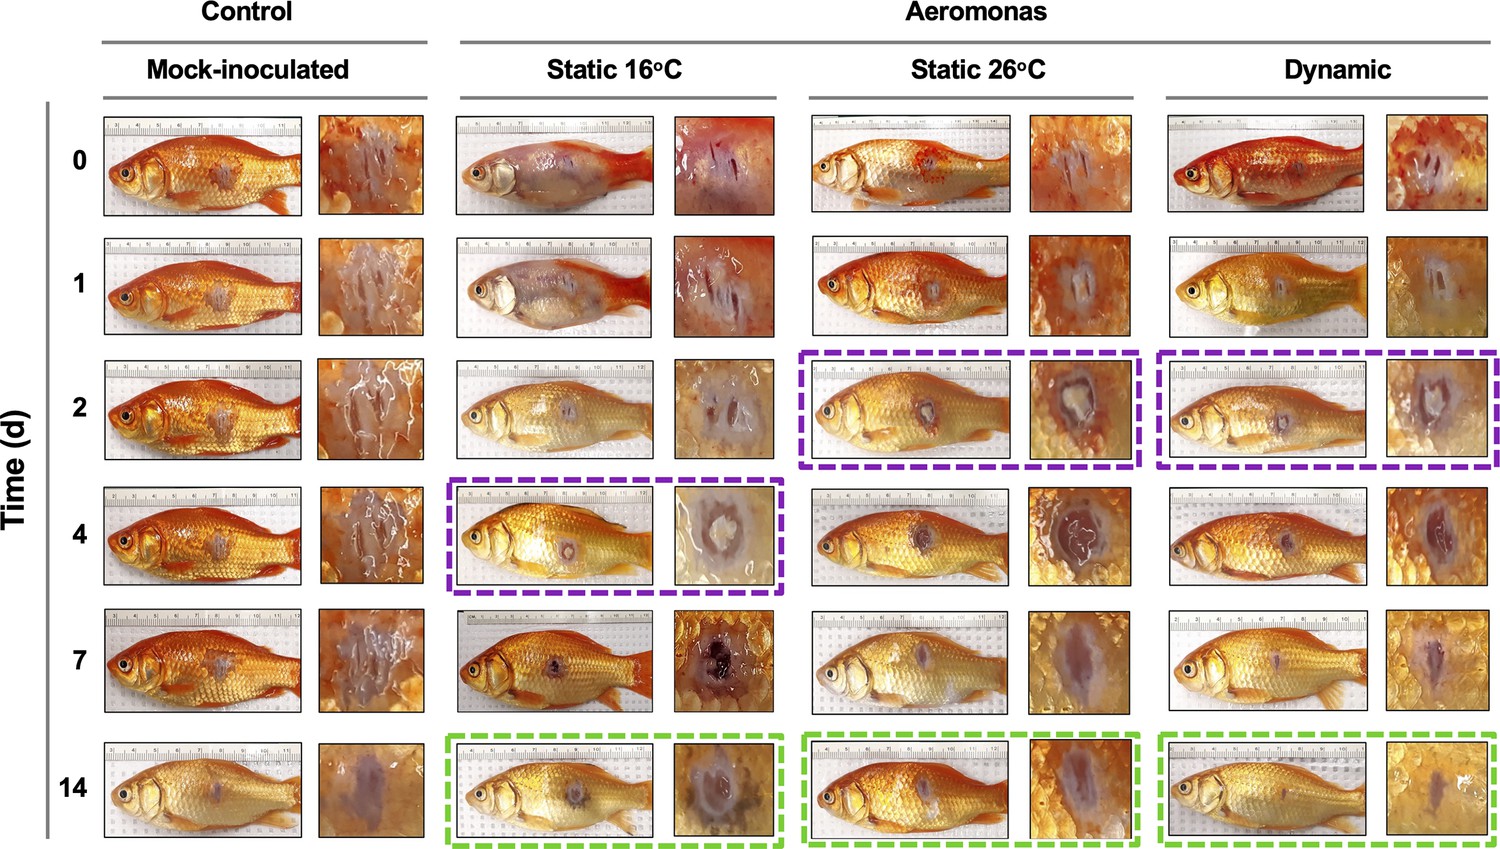
Progression of tissue pathology in Aeromonas-infected fish.
Representative images show focal gross lesions for fish inoculated with Aeromonas veronii and placed under 16°C static, 26°C static (mechanical fever-range hyperthermia), or dynamic host-driven fever conditions. Fish mock infected with saline are provided as controls. Time points capture progression from initial infection to advanced stages of wound repair. Purple boxes highlight differential kinetics of purulent exudate formation. Green boxes showcase distinct degrees of wound closure achieved across Aeromonas-infected groups by 14 dpi.
Figure 7
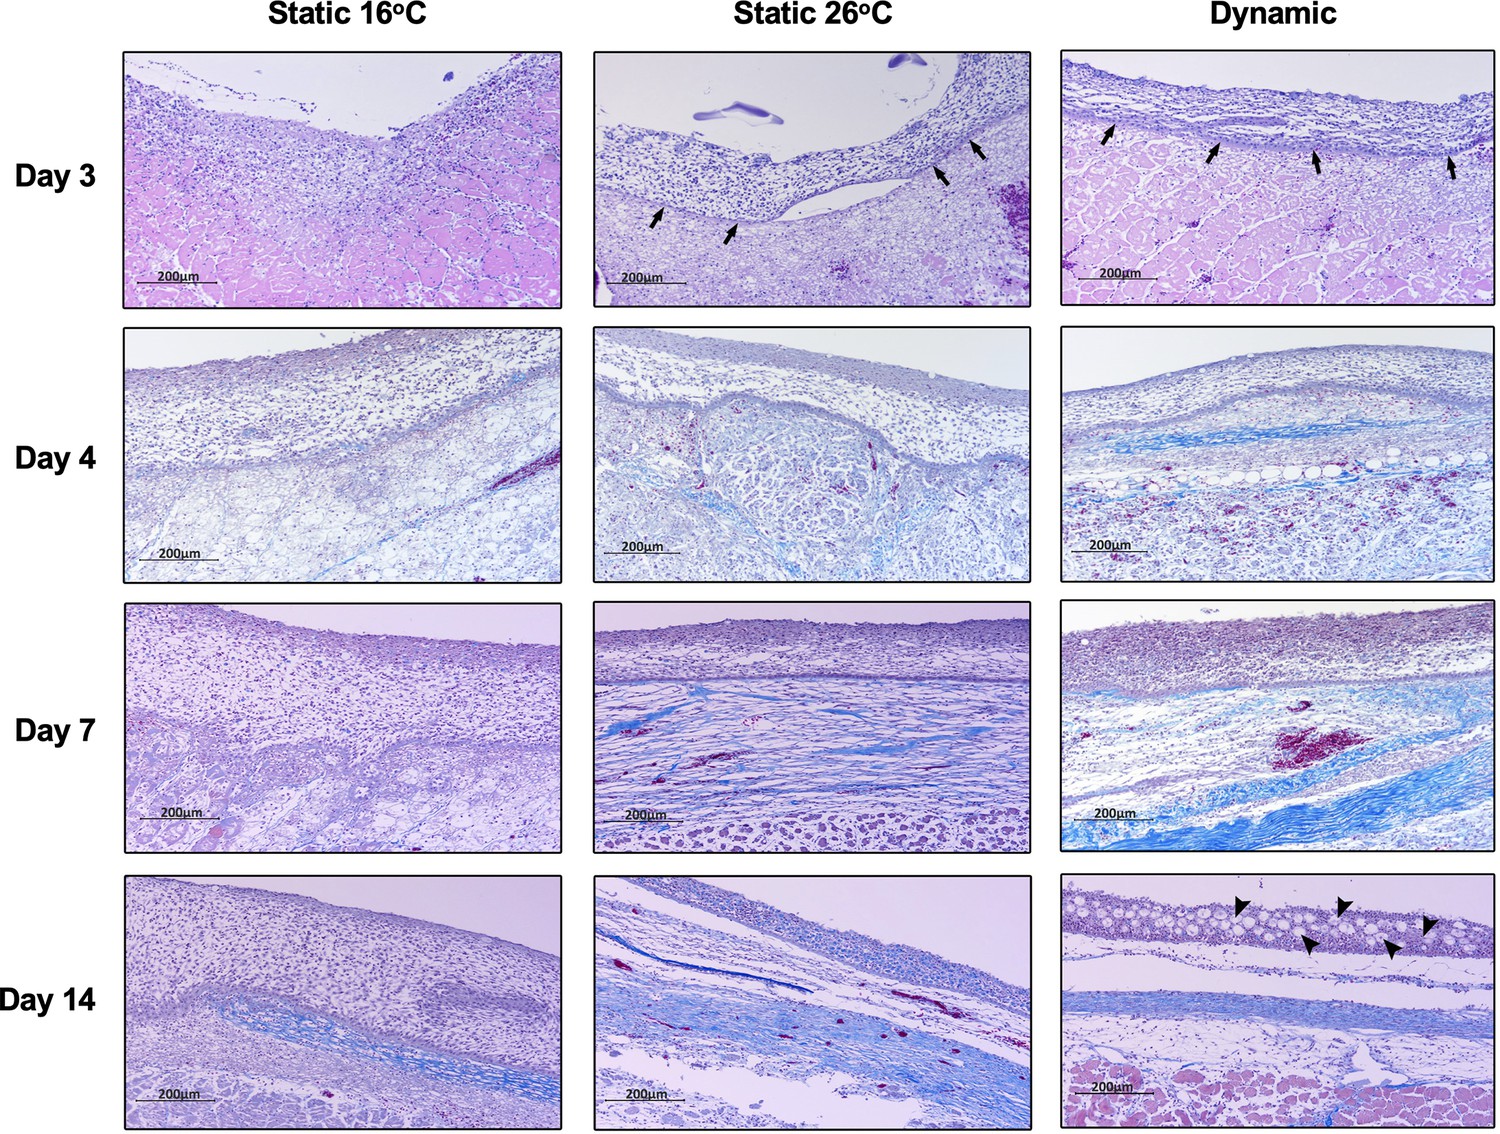
Fever enhances re-epithelialization and collagen deposition.
Wound tissue from Aeromonas-infected fish was collected at the indicated time points, sectioned, and stained with Masson’s Trichrome stain (n = 3 per group per time point). Histopathological examination highlights early development of basal layer of epidermis (arrows; day 3) and overlying layers of keratinocytes among fish in 26°C static and dynamic host-driven fever conditions. Subsequent differential progression of collagen deposition is shown by the increased abundance and organization of blue-stained fibres. Restitution of mucus producing cells in epidermis is highlighted by arrowheads (day 14). Scale bar: 200 μm.
Tables
Key resources table
| Reagent type (species) or resource | Designation | Source or reference | Identifiers | Additional information |
|---|---|---|---|---|
| Genetic reagent (Goldfish; Carassius auratus) | WT | Aquatic Imports | 10–15 cm in length; mix-sex | |
| Strain, strain background (Aeromonas veronii) | WT | Field isolated | NCBI Taxonomy ID: 114517 | |
| Chemical compound, drug | Ketorolac tromethamine | ATNAHS Pharma | Cat #: 2162644 | 0.5 mg/kg of body weight |
| Chemical compound, drug | Trizol | Thermo Fisher Scientific | Cat #: 15596026 | |
| Chemical compound, drug | CellROX Deep Red Reagent | Thermo Fisher Scientific | Cat #: C10491 | |
| Chemical compound, drug | DAF-FM DA | Invitrogen | Cat #: D23844 | |
| Commercial assay, kit | iScript cDNA synthesis kit | Bio-Rad | Cat #: 1708891 | |
| Commercial assay, kit | Prostaglandin E2 ELISA Kit | Cayman Chemical | Cat #: 514010 | |
| Software, algorithm | IDEAS Image Data Exploration and Analysis Software | IDEAS (https://www.luminexcorp.com/imagestreamx-mk-ii/#software) | RRID:SCR_019195 | |
| Software, algorithm | Ethovision XT software | Ethovision XT (https://www.noldus.com/ethovision) | RRID:SCR_000441 | |
| Software, algorithm | R software | R (http://www.r-project.org/) | RRID:SCR_001905 | |
| Software, algorithm | ImageJ software | ImageJ (http://imagej.nih.gov/ij/) | RRID:SCR_003070 | |
| Software, algorithm | GraphPad Prism software | GraphPad Prism (https://graphpad.com) | RRID:SCR_002798 |
Additional files
-
MDAR checklist
- https://cdn.elifesciences.org/articles/83644/elife-83644-mdarchecklist1-v1.pdf
-
Supplementary file 1
Primer sequences for quantitative PCR.
- https://cdn.elifesciences.org/articles/83644/elife-83644-supp1-v1.xlsx
Download links
A two-part list of links to download the article, or parts of the article, in various formats.
Downloads (link to download the article as PDF)
Open citations (links to open the citations from this article in various online reference manager services)
Cite this article (links to download the citations from this article in formats compatible with various reference manager tools)
Fever integrates antimicrobial defences, inflammation control, and tissue repair in a cold-blooded vertebrate
eLife 12:e83644.
https://doi.org/10.7554/eLife.83644


