The shared and unique neural correlates of personal semantic, general semantic, and episodic memory
- School of Psychology, University of Ottawa, Canada
- School of Psychology, University of East Anglia, United Kingdom
- Department of Psychology, University of British Columbia, Canada
Figures
Figure 1
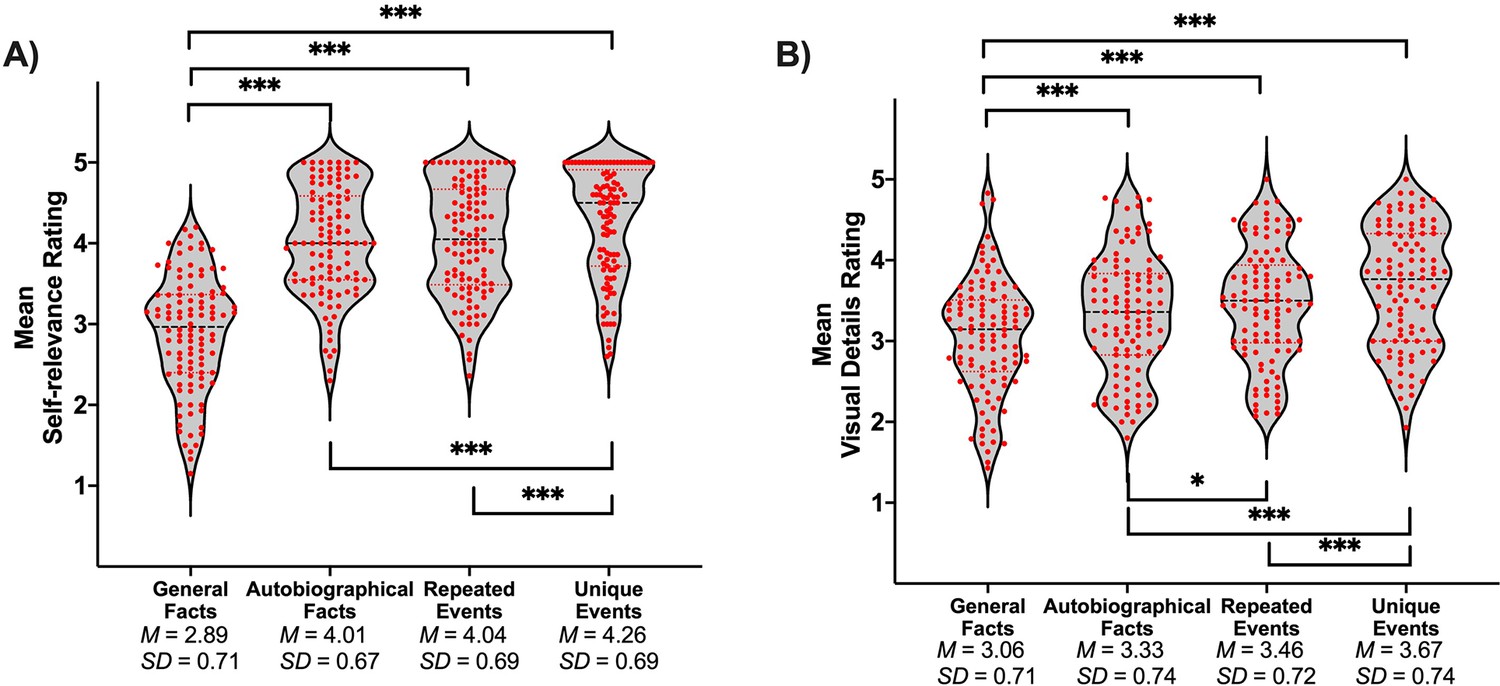
Violin plots of (A) self-relevance ratings and (B) visual details ratings per condition.
Red points represent scores of individual participants (N = 106). A black line shows the median and red lines show the quartiles. *p < .05, ***p < .001.
Figure 2
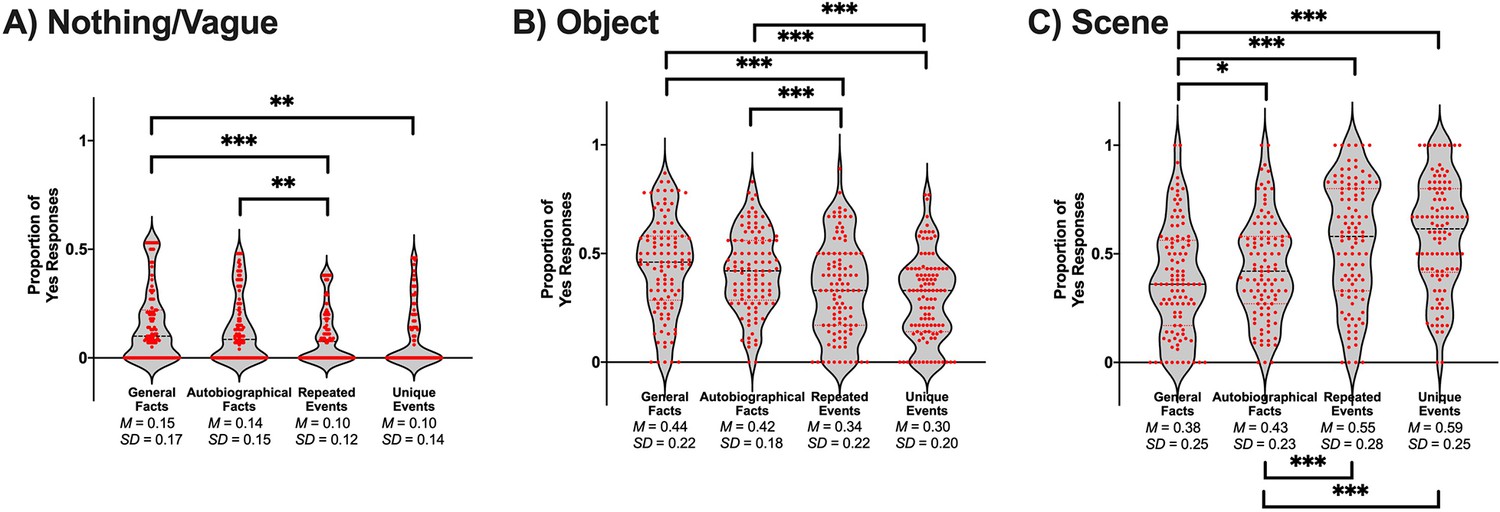
Violin plots of the proportion of yes responses that were perceived as (A) nothing/vague, (B) an object, (C) a scene.
Red points represent scores of individual participants (N = 106). A black line shows the median and red lines show the quartiles. *p < .05, **p < .01, ***p < .001.
Figure 3
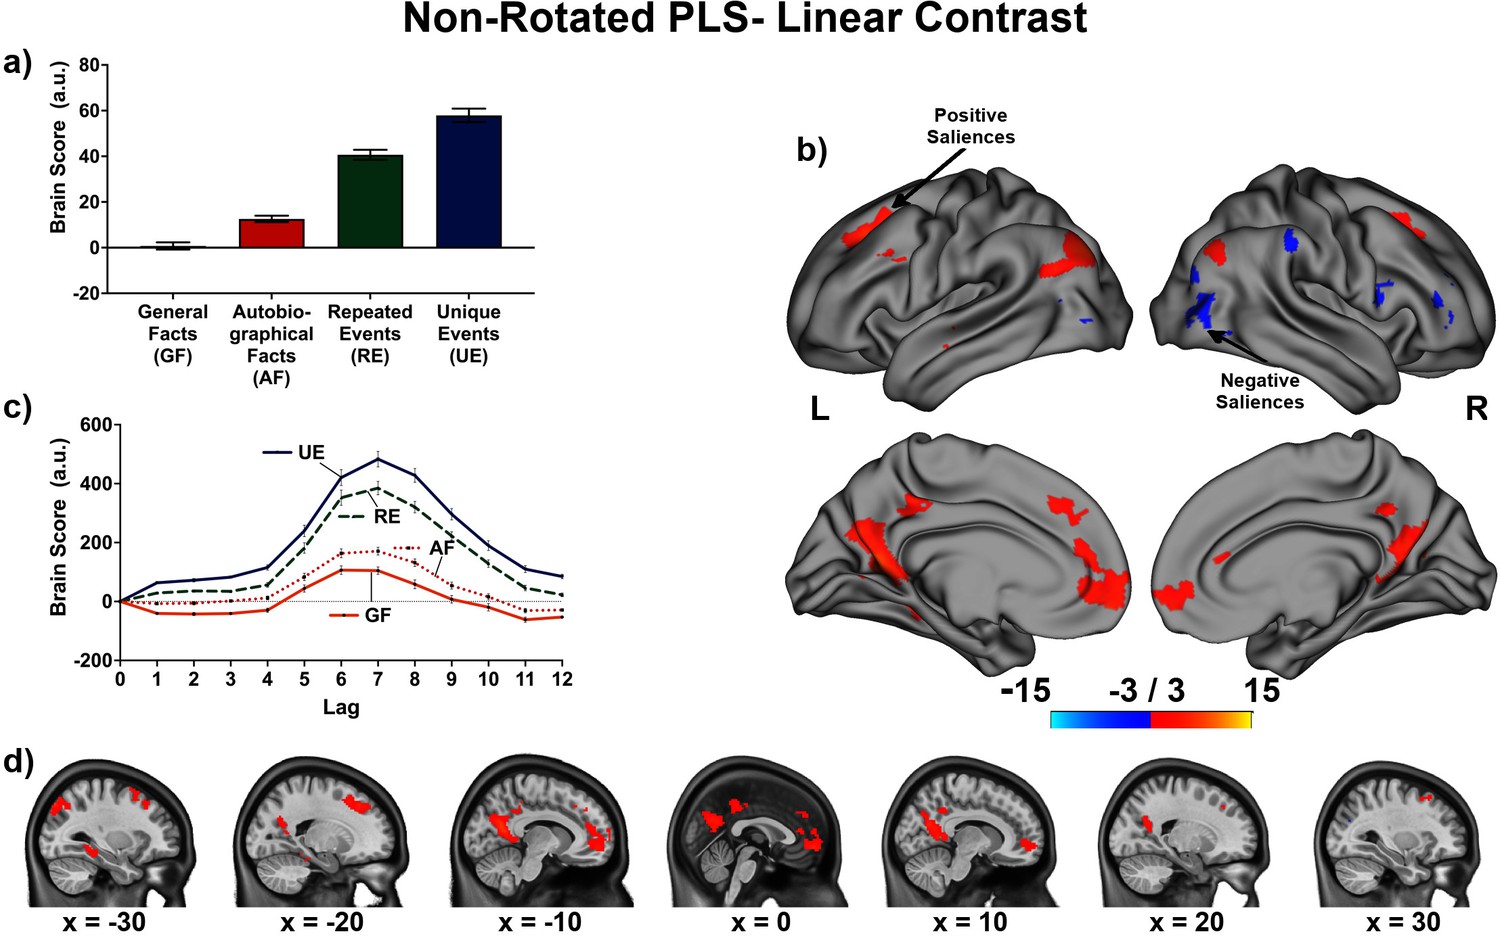
This non-rotated partial least squares (PLS) tested a linear contrast (−3, –1, 1, 3).
This latent variable (LV) shows regions associated with an increase in activity from general facts to autobiographical facts to repeated events to unique events. (a) Average brain score. Error bars are ±1 SE of bootstrap estimates. (c) Brain scores shown at each lag (i.e., each TR/1.2 s). Error bars are ±1 SE. (b and d) Brain scores with positive saliences shown in warm colors (increased activity from general facts to autobiographical facts to repeated events to unique events) and negative saliences shown in cold colors (decreased activity from general facts to autobiographical facts to repeated events to unique events). Brain scores are projected onto a surface from the Human Connectome Project (S1200; Van Essen et al., 2012) using Connectome Workbench (Marcus et al., 2011) in (b) and the MNI152NLin2009cAsym volume using FSLeyes (McCarthy, 2021), in (d). Bootstrap ratios are thresholded at ± 3, p < .001, cluster size ≥ 80 voxels. See Appendix 2—figure 1 for additional lags.
Figure 4
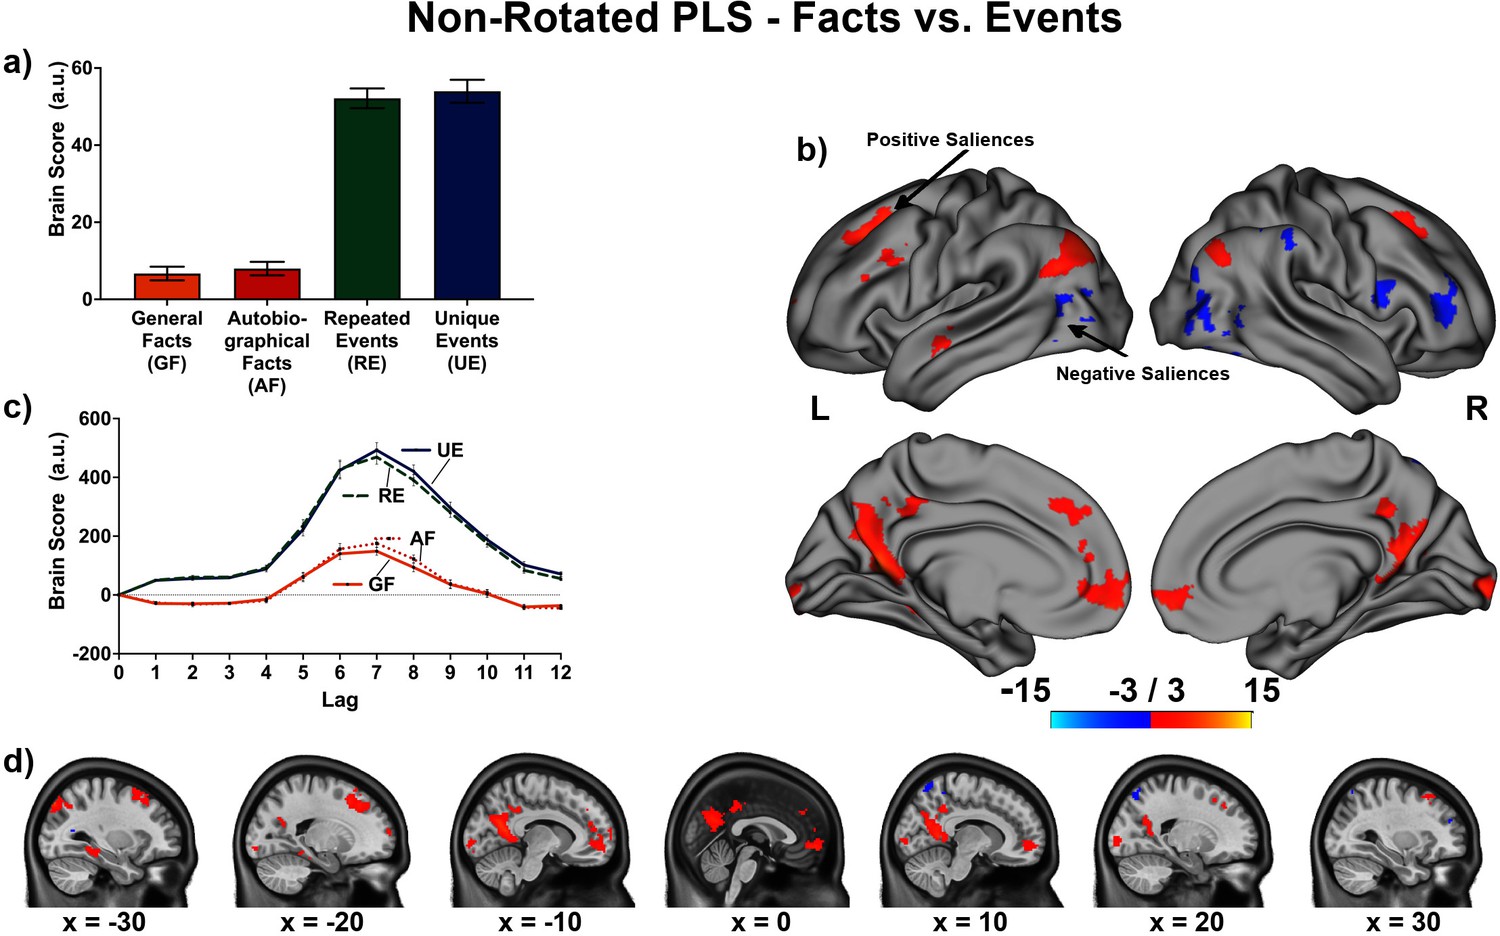
This non-rotated partial least squares (PLS) tested a contrast comparing general/autobiographical facts and repeated/unique events (−1, –1, 1, 1).
(a) Average brain score. Error bars are ±1 SE of bootstrap estimates. (c) Brain scores shown at each lag (i.e., each TR/1.2 s). Error bars are ±1 SE. (b and d) Brain scores with positive saliences shown in warm colors (increased activity for repeated/unique events relative to general/autobiographical) and negative saliences shown in cold colors (reduced activity for repeated/ unique events relative to general/autobiographical). Brain scores are projected onto a surface from the Human Connectome Project (S1200; Van Essen et al., 2012) using Connectome Workbench (Marcus et al., 2011) in (b) and the MNI152Nlin2009cAsym volume using FSLeyes (McCarthy, 2021) in (d). Bootstrap ratios are thresholded at ± 3, p < .001, cluster size ≥ 80 voxels. See Appendix 3—figure 1 for additional lags.
Figure 5
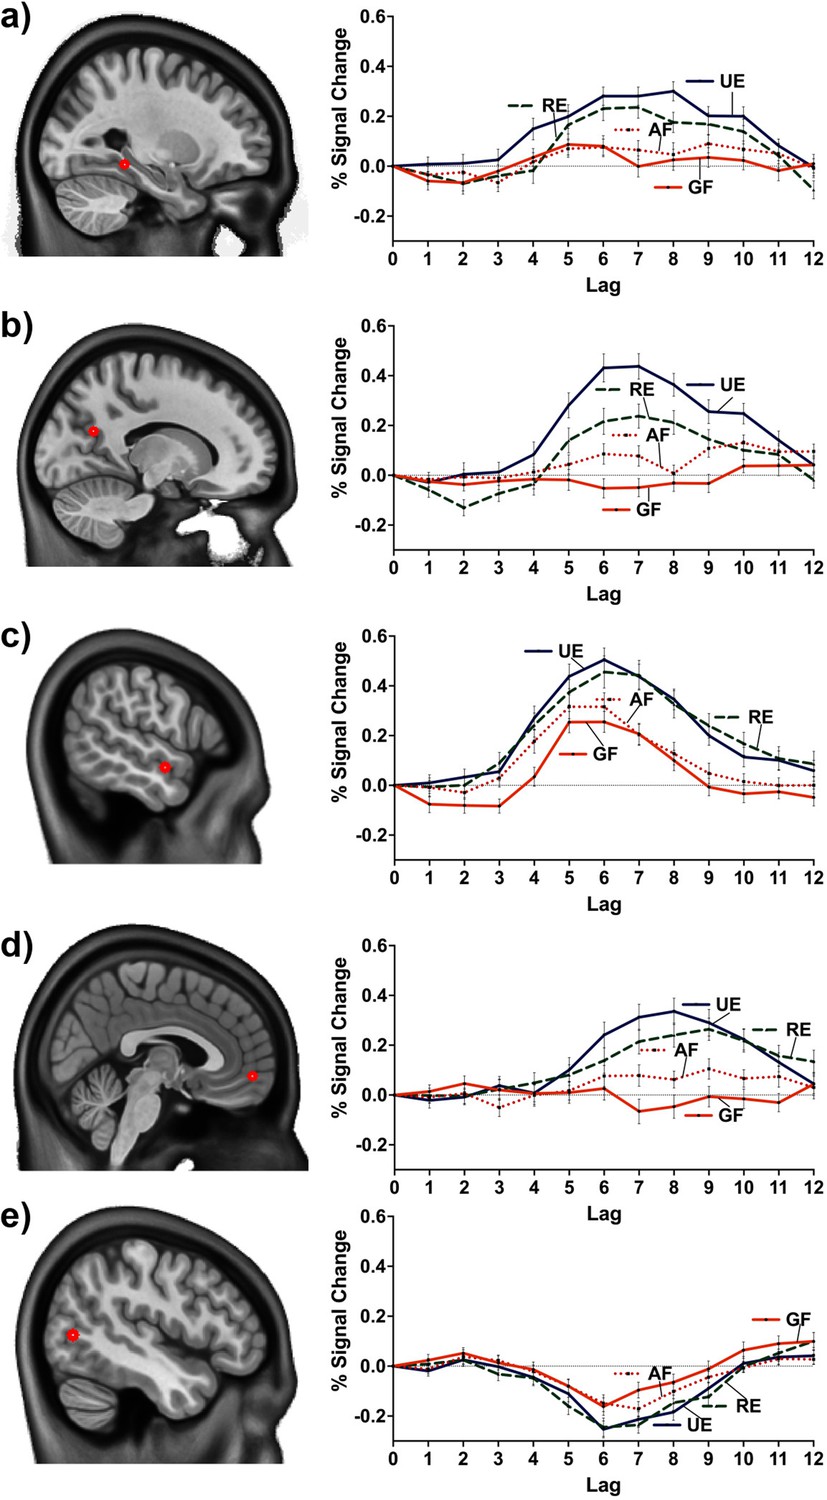
Percent BOLD signal change at MNI coordinates: (a) –27.5 –40 –10 (posterior division of the left parahippocampal gyrus), (b) –15.0 –62.5 22.5 (left precuneus cortex), (c) –57.5 –5 –12.5 (anterior division of the left middle temporal gyrus), (d) 2.5 55.0 –7.5 (right frontal pole), (e) –47.5 –70 5 (inferior division of the left lateral occipital cortex).
(a and c) were common peaks for the two contrasts (linear and facts vs. events). (b, d, and e) were peaks of the linear contrast, but facts vs. events had a peak at nearby location (i.e., –47.5 –70 2.5 to e). GF = general facts, AF = autobiographical facts; RE = repeated events; UE = unique events.
Figure 6
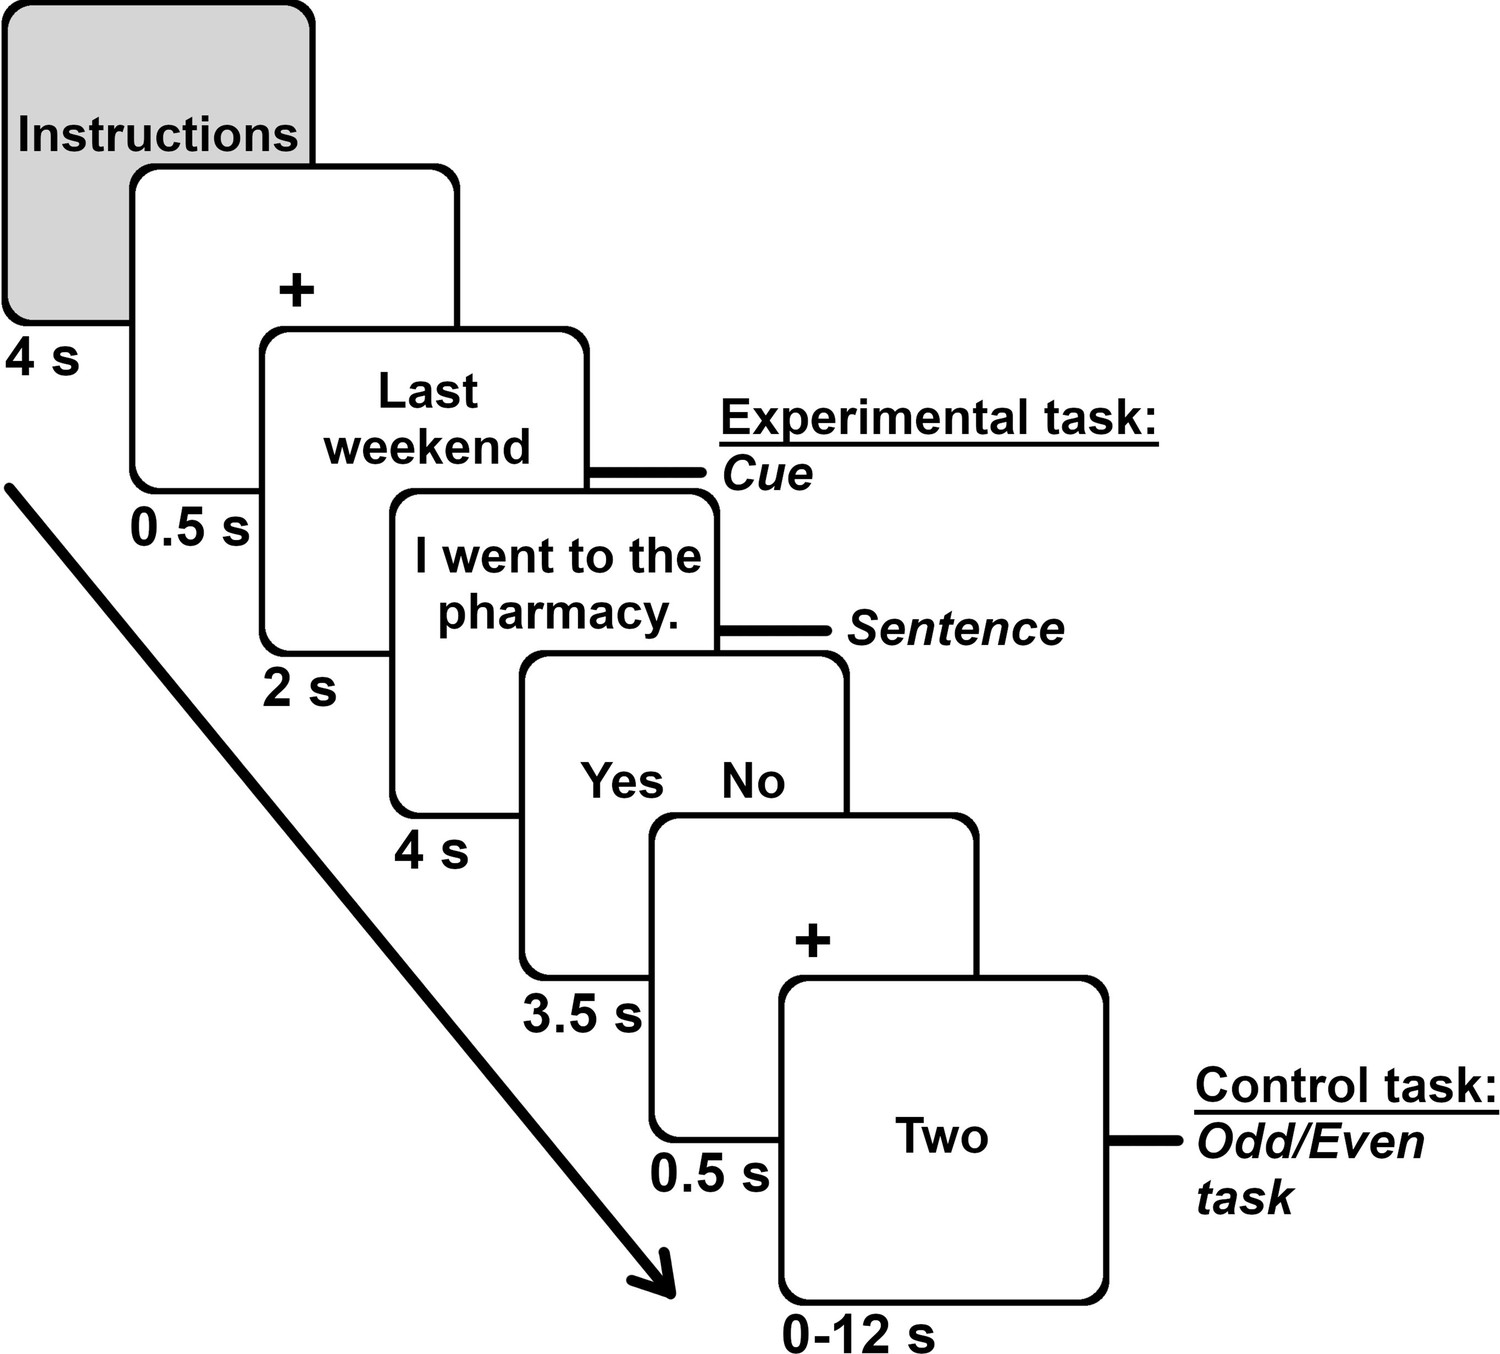
Task structure and durations.
Each of the seven runs included the four memory conditions (general facts, autobiographical facts, repeated events, unique events). Each memory block started with instructions, followed with the 10 trials for that memory condition. Each trial unfolded in this order: fixation cross (0.5 s), cue (2 s), sentence (4 s), response screen (3.5 s). We presented the odd/even task (range 0–12 s, M = 4.6 s, 1 number per 2 s) during the interstimulus interval.
Appendix 2—figure 1
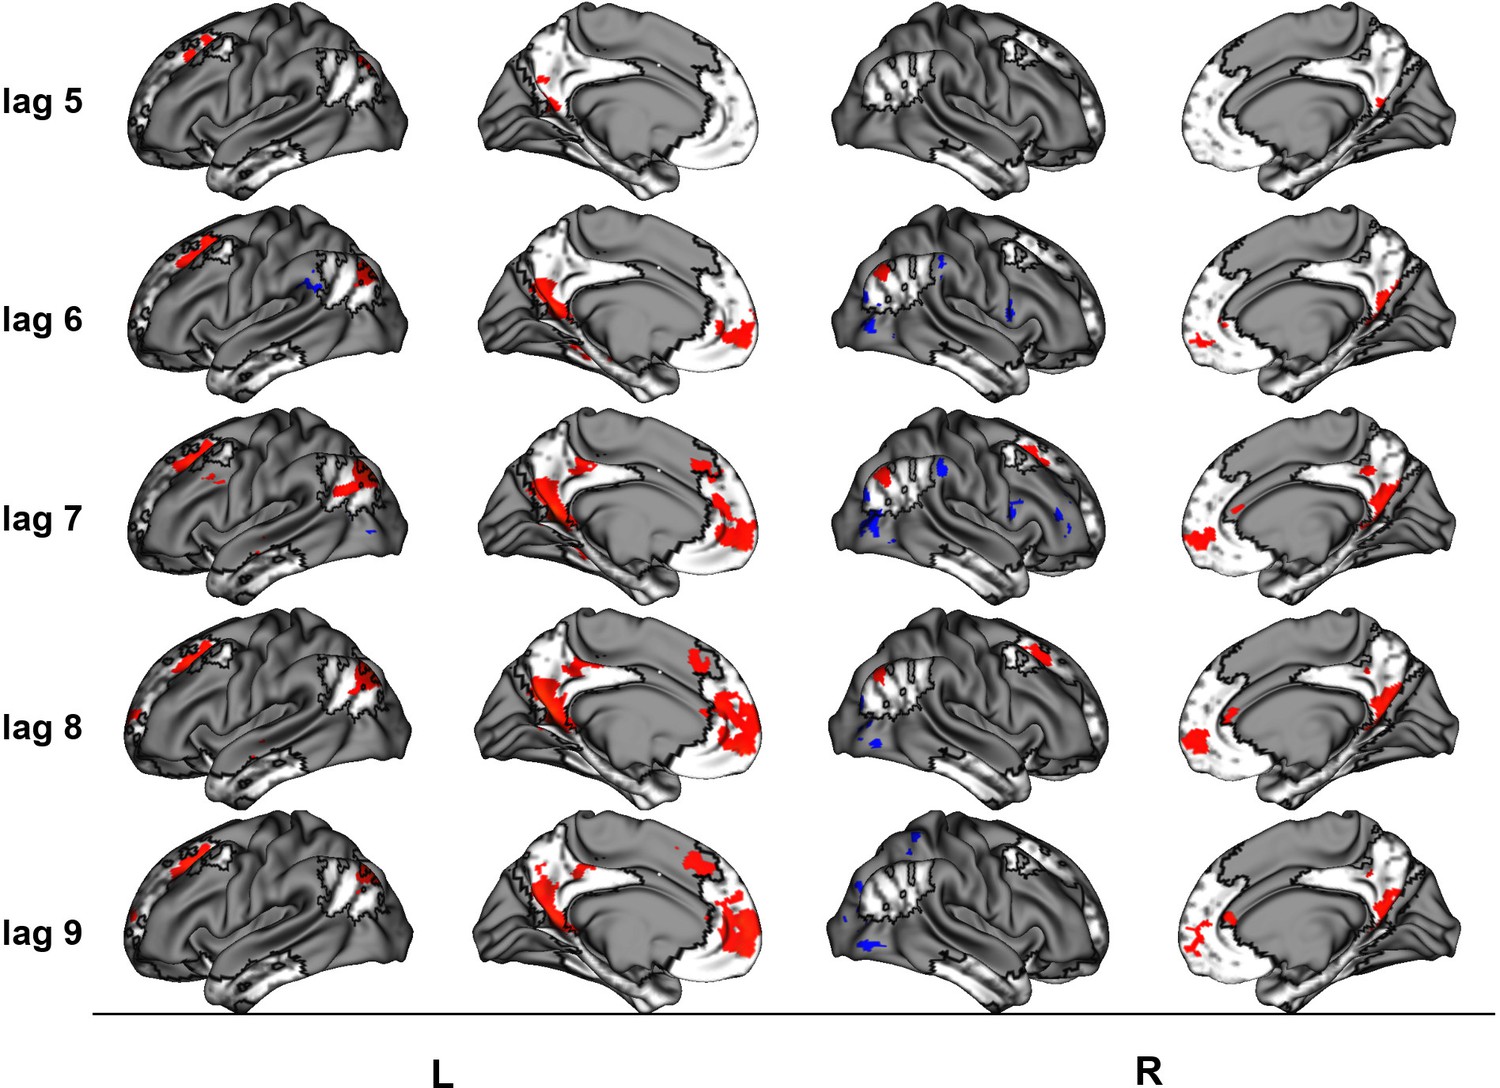
Brain scores in orange and blue tones for the latent variable (LV) 1 of the non-rotated partial least squares (PLS) with the linear contrast between memory conditions overlayed on the default mode and medial temporal networks from Barnett et al., 2021 shown in white with black contour and projected onto a surface template from the Human Connectome Project (Van Essen et al., 2012) using Connectome Workbench (Marcus et al., 2011).
Appendix 3—figure 1
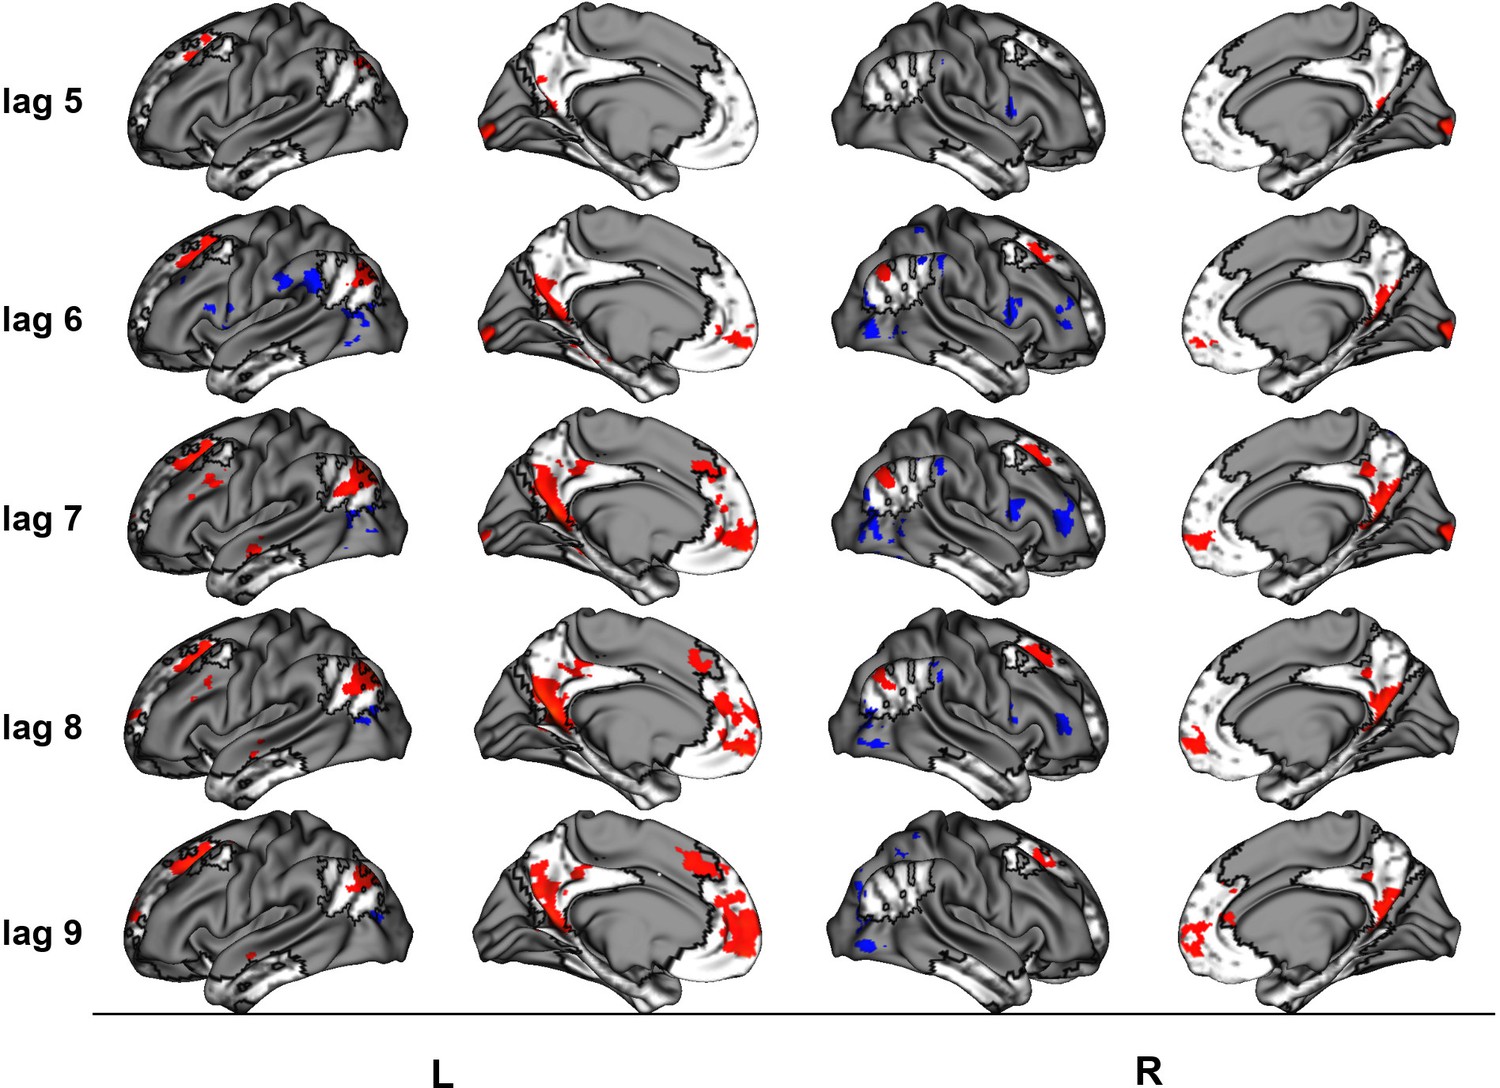
Brain scores for the latent variable (LV) 1 of the non-rotated partial least squares (PLS) with the facts vs. events contrast between memory conditions overlayed on the default mode and medial temporal networks from Barnett et al., 2021 shown in white with black contour and projected onto a surface template from the Human Connectome Project (Van Essen et al., 2012) using Connectome Workbench (Marcus et al., 2011).
Appendix 4—figure 1
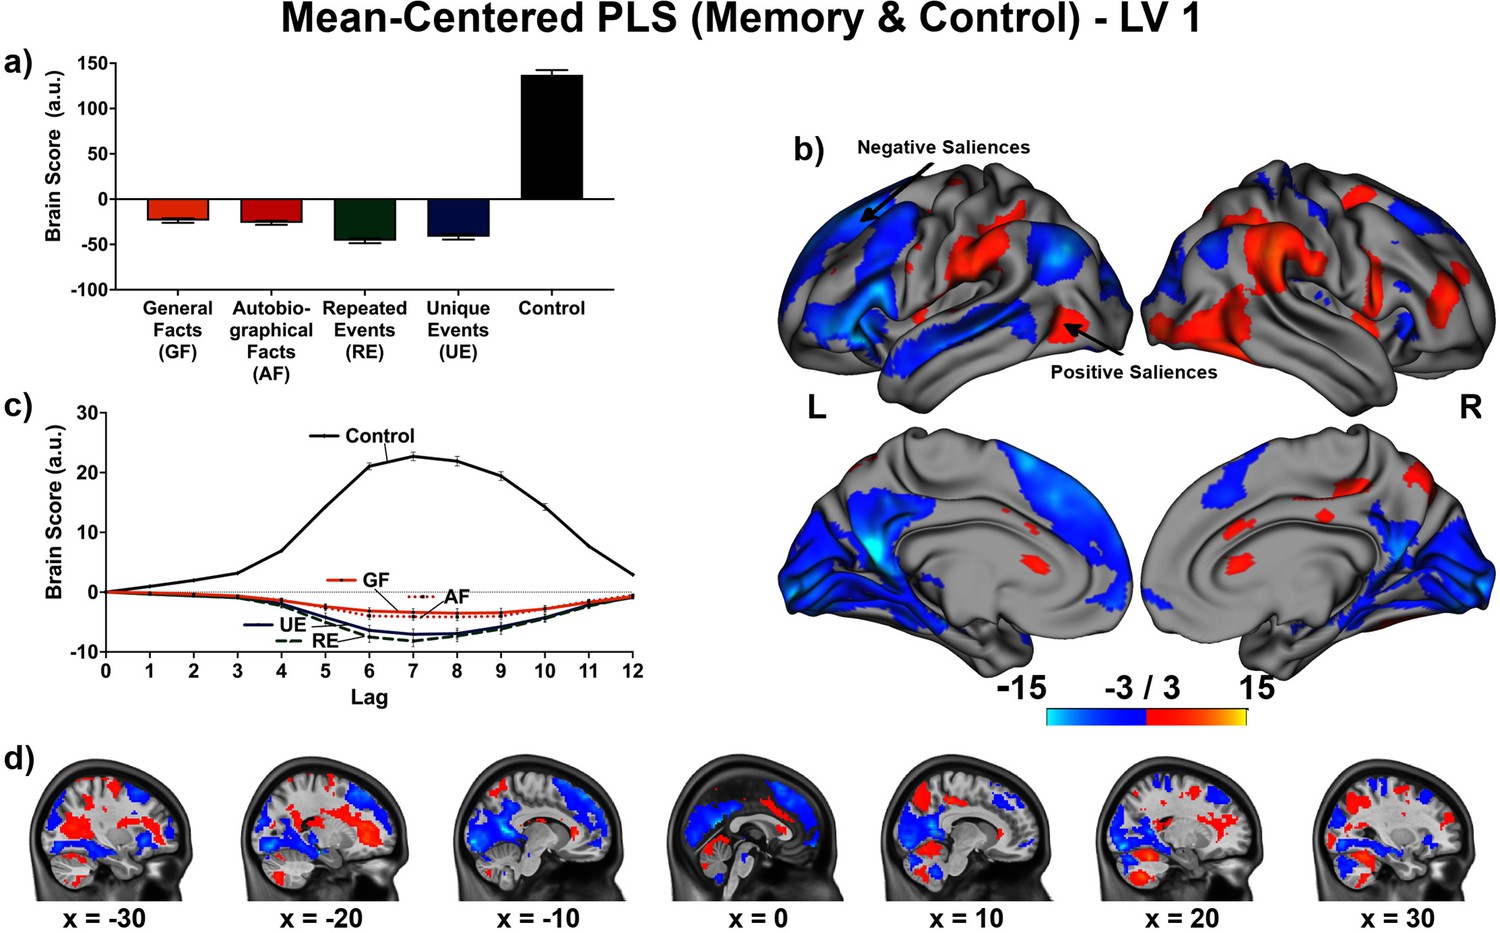
This mean-centered partial least squares (PLS) included the control task in addition to the memory conditions.
The first significant latent variable (LV) identified activation that dissociated all memory conditions from the control task. (a) Average brain score. Error bars are ±1 SE of bootstrap estimates. (c) Brain scores shown at each lag (i.e., each TR/1.2 s). Error bars are ±1 SE. (b and d) Brain scores at lag 7 with positive saliences shown in warm colors (increased activity for the control task relative to memory conditions) and negative saliences shown in cold colors (increased activity for the memory conditions relative to the control task). Brain scores are projected onto a surface from the Human Connectome Project (S1200; Van Essen et al., 2012) using Connectome Workbench (Marcus et al., 2011) in (b) and the MNI152NLin2009cAsym volume using FSLeyes (McCarthy, 2021) in (d). Bootstrap ratios are thresholded at ± 3, p < .001, cluster size ≥ 80 voxels.
Appendix 4—figure 2
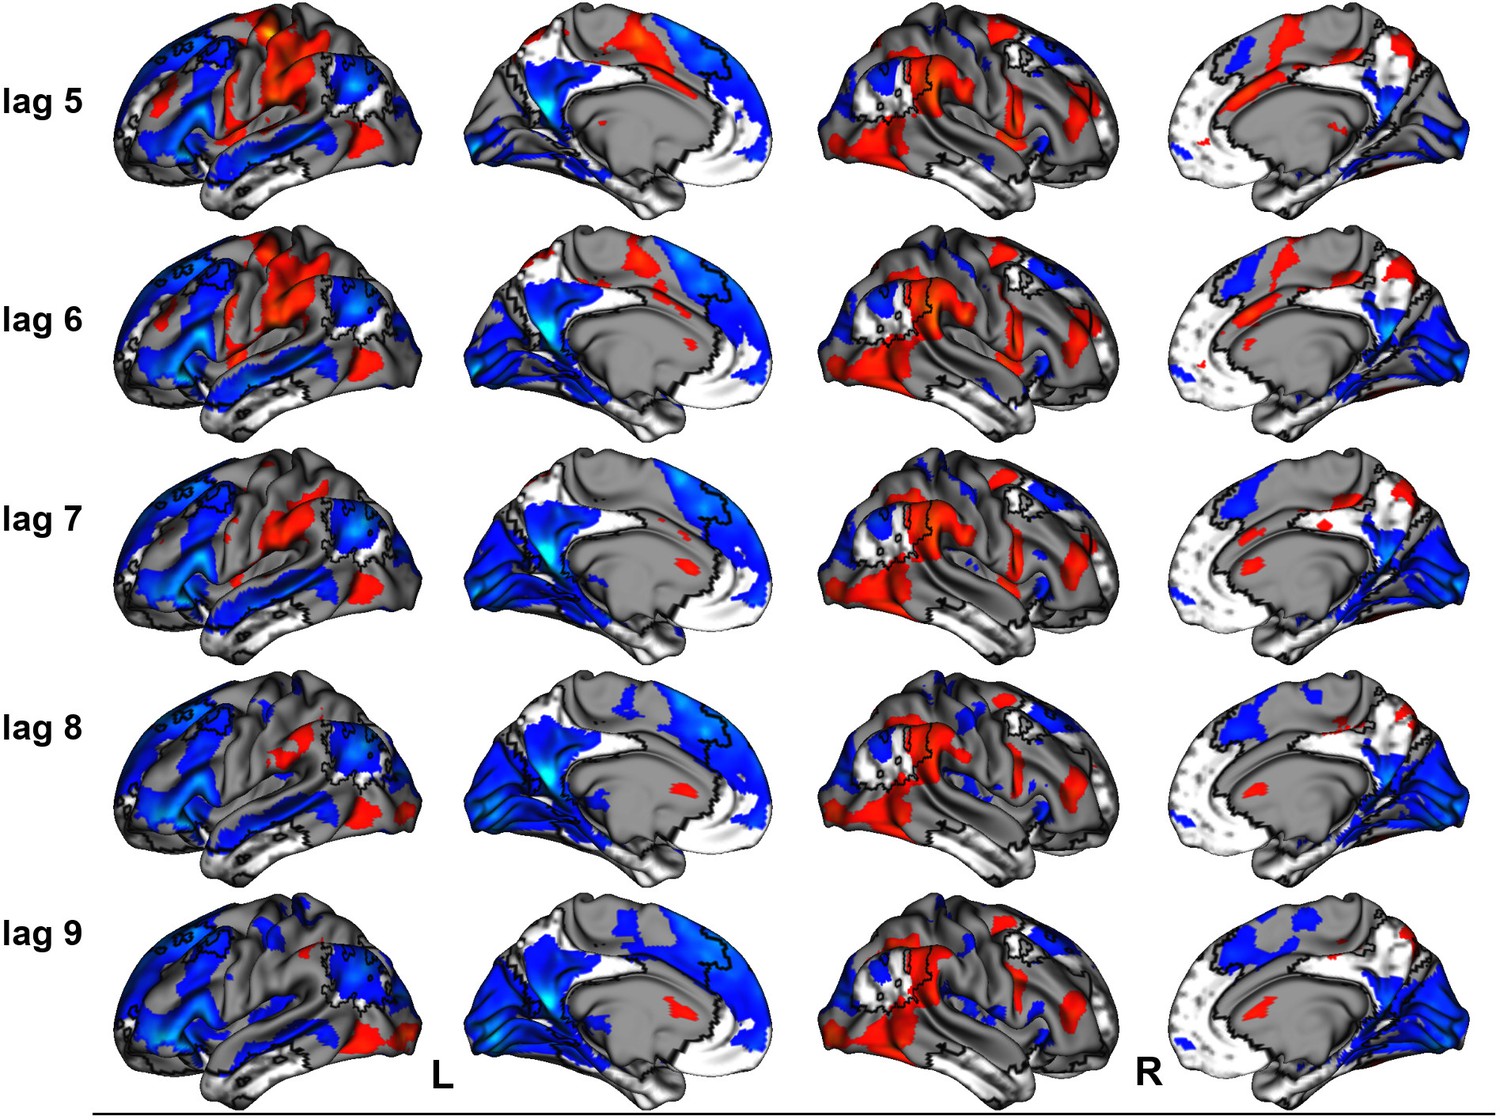
Brain scores for the latent variable (LV) 1 of the mean-centered partial least squares (PLS) that comprised the control task and the memory conditions overlayed on the default mode and medial temporal networks from Barnett et al., 2021 shown in white with black contour and projected onto a surface template from the Human Connectome Project (Van Essen et al., 2012) using Connectome Workbench (Marcus et al., 2011).
Appendix 5—figure 1
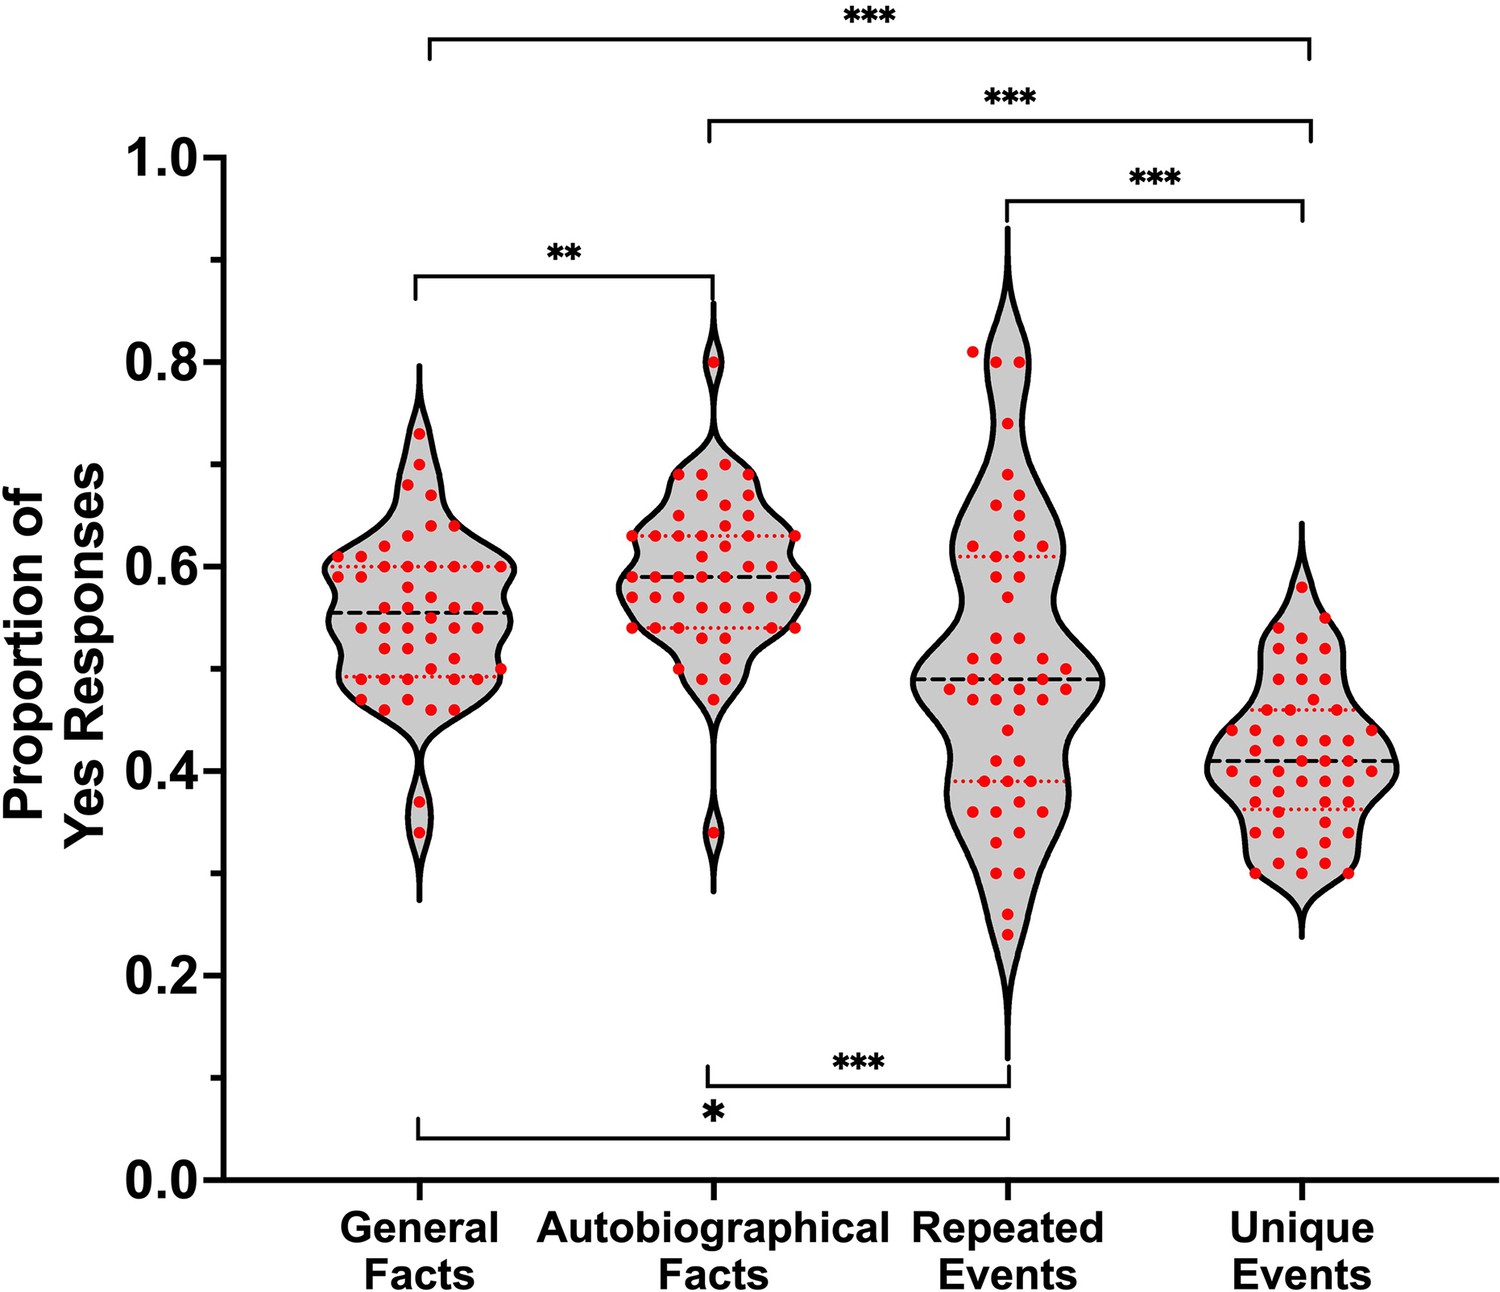
Proportion of yes responses relative to the total number of responses a participant made.
Red points represent scores of individual participants (N = 48). A black line shows the median and red lines show the quartiles. *p < .05, **p < .01, ***p < .001.
Tables
Table 1
t-test values for pairwise comparisons of memory types on self-relevance and visual details.
| Comparison | t(105) | p | g | CI 95% of g |
|---|---|---|---|---|
| Self-relevance | ||||
| General facts vs. autobiographical facts | −13.94 | < .001* | −1.35 | [–1.61, –1.08] |
| General facts vs. repeated events | −12.23 | < .001* | −1.18 | [–1.43, –0.93] |
| General facts vs. unique events | −14.90 | < .001* | −1.44 | [–1.71, –1.17] |
| Autobiographical facts vs. repeated events | −0.61 | .541 | −0.06 | [–0.25, 0.13] |
| Autobiographical facts vs. unique events | −4.49 | < .001* | −0.44 | [–0.63, –0.24] |
| Repeated events vs. unique events | −4.32 | < .001* | −0.42 | [–0.62, –0.22] |
| Visual details | ||||
| General facts vs. autobiographical facts | −5.14 | < .001* | −0.50 | [–0.70, –0.30] |
| General facts vs. repeated events | −6.56 | < .001* | −0.64 | [–0.84, –0.43] |
| General facts vs. unique events | −8.98 | < .001* | −0.87 | [–1.09, –0.64] |
| Autobiographical facts vs. repeated events | −2.07 | .041* | −0.20 | [–0.39, –0.01] |
| Autobiographical facts vs. unique events | −5.46 | < .001* | −0.53 | [–0.73, –0.33] |
| Repeated events vs. unique events | −3.45 | < .001* | −0.33 | [–0.53, –0.14] |
-
Note: *Significant after correction for multiple comparisons.
Table 2
t-test values for pairwise comparisons of memory types on the proportion of scenes.
| Comparison | t(105) | p | g | CI 95% of g |
|---|---|---|---|---|
| General facts vs. autobiographical facts | −2.34 | .021* | −0.23 | [–0.42, –0.03] |
| General facts vs. repeated events | −6.51 | < .001* | −0.63 | [–0.84, –0.42] |
| General facts vs. unique events | −7.98 | < .001* | −0.77 | [–0.99, –0.56] |
| Autobiographical facts vs. repeated events | −4.75 | < .001* | −0.46 | [–0.66, –0.26] |
| Autobiographical facts vs. unique events | −6.52 | < .001* | −0.63 | [–0.84, –0.42] |
| Repeated events vs. unique events | −1.28 | .204 | −0.12 | [–0.31, 0.07] |
-
Note: *Significant after correction for multiple comparisons.
Table 3
Peaks of clusters for the linear contrast at lag 7.
| Bootstrap ratio | Cluster size (voxels) | X (mm) | Y (mm) | Z (mm) | Harvard-Oxford, probability atlas |
|---|---|---|---|---|---|
| Negative saliences | |||||
| −5.21 | 362 | 40.0 | −80.0 | 25.0 | 72.0% Right Lateral Occipital Cortex Superior Division |
| −4.76 | 188 | 42.5 | −50.0 | 57.5 | 46.0% Right Superior Parietal Lobule; 20.0% Right Angular Gyrus |
| −4.75 | 103 | −47.5 | −70.0 | 5.0 | 84.0% Left Lateral Occipital Cortex inferior division |
| −4.61 | 102 | 50.0 | 15.0 | 17.5 | 46.0% Right Inferior Frontal Gyrus pars opercularis |
| Positive saliences | |||||
| 5.03 | 113 | −5.0 | 30.0 | 37.5 | 63.0% Left Paracingulate Gyrus; 13.0% Left Superior Frontal Gyrus |
| 5.29 | 116 | 25.0 | 20.0 | 42.5 | 22.0% Right Middle Frontal Gyrus; 19.0% Right Superior Frontal Gyrus |
| 6.10 | 94 | −57.5 | −5.0 | −12.5 | 37.0% Left Middle Temporal Gyrus Anterior Division; 23.0% Left Superior Temporal Gyrus Anterior Division; 9.0% Left Superior Temporal Gyrus Posterior Division |
| 6.12 | 105 | −52.5 | 15.0 | 37.5 | 54.0% Left Middle Frontal Gyrus; 5.0% Left Inferior Frontal Gyrus pars opercularis |
| 6.24 | 110 | −27.5 | −40.0 | −10.0 | 29.0% Left Parahippocampal Gyrus Posterior Division; 27.0% Left Lingual Gyrus; 8.0% Left Temporal Occipital Fusiform Cortex; 7.0% Left Temporal Fusiform Cortex Posterior Division |
| 6.25 | 233 | −5.0 | −40.0 | 42.5 | 48.0% Left Cingulate Gyrus Posterior Division; 31.0% Left Precuneus Cortex |
| 6.65 | 137 | 45.0 | −75.0 | 37.5 | 68.0% Right Lateral Occipital Cortex Superior Division |
| 6.85 | 401 | −20.0 | 30.0 | 42.5 | 51.0% Left Superior Frontal Gyrus; 8.0% Left Middle Frontal Gyrus |
| 7.19 | 647 | 2.5 | 55.0 | −7.5 | 43.0% Right Frontal Pole; 28.0% Right Frontal Medial Cortex; 8.0% Right Paracingulate Gyrus |
| 8.87 | 444 | −30.0 | −82.5 | 45.0 | 44.0% Left Lateral Occipital Cortex Superior Division |
| 10.36 | 1118 | −15.0 | −62.5 | 22.5 | 54.0% Left Precuneus Cortex; 12.0% Left Supracalcarine Cortex |
-
Note: Thresholded at bootstrap ratio at ± 3 (p < .001), minimal cluster size of 80 voxels, and a minimal distance of 10 voxels. Labels from the Harvard-Oxford (Desikan et al., 2006) atlas obtained using AtlasReader (Notter et al., 2019).
Table 4
Peaks of clusters for the facts vs. events contrast at lag 7.
| Bootstrap ratio | Cluster size (voxels) | X (mm) | Y (mm) | Z (mm) | Harvard-Oxford, probability atlas |
|---|---|---|---|---|---|
| Negative saliences | |||||
| −5.94 | 251 | 42.5 | 45 | 5 | 85.0% Right Frontal Pole |
| −5.59 | 170 | 57.5 | 12.5 | 15 | 55.0% Right Inferior Frontal Gyrus pars opercularis; 23.0% Right Precentral Gyrus |
| −5.30 | 465 | 57.5 | −62.5 | −10 | 52.0% Right Lateral Occipital Cortex Inferior Division; 15.0% Right Inferior Temporal Gyrus temporooccipital part; 9.0% Right Middle Temporal Gyrus temporooccipital part |
| −5.17 | 100 | 67.5 | −42.5 | 22.5 | 19.0% Right Supramarginal Gyrus Posterior Division |
| −5.05 | 153 | 20 | −70 | 55 | 58.0% Right Lateral Occipital Cortex Superior Division |
| −5.05 | 300 | 60 | −35 | 45 | NA |
| −4.70 | 202 | −47.5 | −70 | 2.5 | 87.0% Left Lateral Occipital Cortex Inferior Division |
| Positive saliences | |||||
| 4.32 | 90 | −5 | 30 | 37.5 | 63.0% Left Paracingulate Gyrus; 13.0% Left Superior Frontal Gyrus |
| 4.87 | 101 | −10 | −95 | 0 | 65.0% Left Occipital Pole |
| 5.85 | 155 | 25 | 22.5 | 42.5 | 29.0% Right Superior Frontal Gyrus; 23.0% Right Middle Frontal Gyrus |
| 5.86 | 87 | 17.5 | −95 | 0 | 50.0% Right Occipital Pole |
| 6.21 | 153 | −52.5 | 15 | 37.5 | 54.0% Left Middle Frontal Gyrus; 5.0% Left Inferior Frontal Gyrus pars opercularis |
| 6.40 | 115 | −57.5 | −5 | −12.5 | 37.0% Left Middle Temporal Gyrus Anterior Division; 23.0% Left Superior Temporal Gyrus Anterior Division; 9.0% Left Superior Temporal Gyrus Posterior Division |
| 6.65 | 115 | −27.5 | −40 | −10 | 29.0% Left Parahippocampal Gyrus Posterior Division; 27.0% Left Lingual Gyrus; 8.0% Left Temporal Occipital Fusiform Cortex; 7.0% Left Temporal Fusiform Cortex Posterior Division |
| 6.88 | 487 | 0 | 55 | −5 | 17.0% Right Frontal Pole; 12.0% Left Frontal Pole; 9.0% Right Paracingulate Gyrus; 9.0% Right Frontal Medial Cortex; 6.0% Left Paracingulate Gyrus; 6.0% Left Frontal Medial Cortex |
| 7.08 | 421 | −20 | 17.5 | 47.5 | 37.0% Left Superior Frontal Gyrus; 6.0% Left Middle Frontal Gyrus |
| 7.09 | 163 | 45 | −75 | 37.5 | 68.0% Right Lateral Occipital Cortex Superior Division |
| 9.43 | 470 | −32.5 | −82.5 | 42.5 | 65.0% Left Lateral Occipital Cortex Superior Division |
| 9.55 | 1394 | −7.5 | −57.5 | 12.5 | 51.0% Left Precuneus Cortex; 7.0% Left Intracalcarine Cortex; 5.0% Left Supracalcarine Cortex |
-
Note: Thresholded at bootstrap ratio at ± 3 (p < .001), minimal cluster size of 80 voxels, and a minimal distance of 10 voxels. Labels from the Harvard-Oxford (Desikan et al., 2006) atlas obtained using AtlasReader (Notter et al., 2019).
Appendix 2—table 1
Peaks of clusters for the linear contrast at lags 5–6 and 8–9.
| Lag | Bootstrap ratio | Cluster size (voxels) | X (mm) | Y (mm) | Z (mm) | Harvard-Oxford, probability atlas |
|---|---|---|---|---|---|---|
| Negative saliences | ||||||
| 6 | −5.92 | 99 | 60.0 | 10.0 | 12.5 | 39.0% Right Precentral Gyrus; 28.0% Right Inferior Frontal Gyrus pars opercularis |
| 6 | −5.47 | 204 | 45.0 | −82.5 | 15.0 | 46.0% Right Lateral Occipital Cortex Superior Division; 18.0% Right Lateral Occipital Cortex inferior division |
| 6 | −5.35 | 279 | 55.0 | −37.5 | 30.0 | 29.0% Right Supramarginal Gyrus Posterior Division; 9.0% Right Parietal Operculum Cortex; 8.0% Right Planum Temporale; 6.0% Right Supramarginal Gyrus Anterior Division |
| 6 | −4.41 | 104 | −55.0 | −37.5 | 25.0 | 46.0% Left Parietal Operculum Cortex; 18.0% Left Planum Temporale; 8.0% Left Supramarginal Gyrus Anterior Division; 6.0% Left Supramarginal Gyrus Posterior Division |
| 8 | −4.65 | 189 | 45.0 | −82.5 | 17.5 | 59.0% Right Lateral Occipital Cortex Superior Division |
| 9 | −5.51 | 387 | 50.0 | −75.0 | 10.0 | 68.0% Right Lateral Occipital Cortex inferior division; 8.0% Right Lateral Occipital Cortex Superior Division |
| 9 | −5.38 | 124 | 32.5 | −47.5 | 60.0 | 55.0% Right Superior Parietal Lobule |
| Positive saliences | ||||||
| 5 | 5.22 | 129 | −35.0 | −82.5 | 37.5 | 77.0% Left Lateral Occipital Cortex Superior Division |
| 5 | 5.58 | 208 | −20.0 | 30.0 | 42.5 | 51.0% Left Superior Frontal Gyrus; 8.0% Left Middle Frontal Gyrus |
| 5 | 5.88 | 151 | 17.5 | −52.5 | 7.5 | 56.0% Right Precuneus Cortex; 9.0% Right Cingulate Gyrus Posterior Division |
| 5 | 6.08 | 237 | −12.5 | −60.0 | 20.0 | 49.0% Left Precuneus Cortex; 11.0% Left Supracalcarine Cortex |
| 6 | 6.01 | 167 | −30.0 | −35.0 | −15.0 | 49.0% Left Parahippocampal Gyrus Posterior Division; 29.0% Left Temporal Fusiform Cortex Posterior Division |
| 6 | 6.50 | 312 | −20.0 | 32.5 | 42.5 | 53.0% Left Superior Frontal Gyrus; 10.0% Left Frontal Pole; 6.0% Left Middle Frontal Gyrus |
| 6 | 7.11 | 379 | −5.0 | 47.5 | −2.5 | 70.0% Left Paracingulate Gyrus; 15.0% Left Cingulate Gyrus Anterior Division |
| 6 | 7.18 | 114 | 45.0 | −75.0 | 37.5 | 68.0% Right Lateral Occipital Cortex Superior Division |
| 6 | 8.14 | 234 | −32.5 | −82.5 | 42.5 | 65.0% Left Lateral Occipital Cortex Superior Division |
| 6 | 9.21 | 856 | −15.0 | −62.5 | 22.5 | 54.0% Left Precuneus Cortex; 12.0% Left Supracalcarine Cortex |
| 8 | 5.05 | 152 | 25.0 | 30.0 | 47.5 | 34.0% Right Superior Frontal Gyrus; 22.0% Right Middle Frontal Gyrus |
| 8 | 5.83 | 115 | 45.0 | −75.0 | 37.5 | 68.0% Right Lateral Occipital Cortex Superior Division |
| 8 | 6.40 | 261 | −2.5 | −35.0 | 45.0 | 60.0% Left Cingulate Gyrus Posterior Division; 25.0% Left Precuneus Cortex |
| 8 | 6.62 | 91 | −57.5 | −5.0 | −12.5 | 37.0% Left Middle Temporal Gyrus Anterior Division; 23.0% Left Superior Temporal Gyrus Anterior Division; 9.0% Left Superior Temporal Gyrus Posterior Division |
| 8 | 8.25 | 449 | −22.5 | 32.5 | 45.0 | 47.0% Left Superior Frontal Gyrus; 10.0% Left Middle Frontal Gyrus; 10.0% Left Frontal Pole |
| 8 | 9.97 | 367 | −32.5 | −82.5 | 42.5 | 65.0% Left Lateral Occipital Cortex Superior Division |
| 8 | 10.03 | 961 | −2.5 | 50.0 | −7.5 | 43.0% Left Frontal Medial Cortex; 38.0% Left Paracingulate Gyrus |
| 8 | 10.43 | 1096 | −5.0 | −62.5 | 15.0 | 42.0% Left Precuneus Cortex; 16.0% Left Intracalcarine Cortex; 12.0% Left Supracalcarine Cortex |
| 9 | 5.66 | 134 | −10.0 | 25.0 | 42.5 | 11.0% Left Superior Frontal Gyrus; 9.0% Left Paracingulate Gyrus |
| 9 | 6.16 | 196 | −2.5 | −35.0 | 42.5 | 81.0% Left Cingulate Gyrus Posterior Division; 16.0% Left Precuneus Cortex |
| 9 | 7.72 | 910 | −7.5 | 55.0 | 10.0 | 43.0% Left Paracingulate Gyrus; 25.0% Left Frontal Pole; 5.0% Left Superior Frontal Gyrus |
| 9 | 7.98 | 476 | −20.0 | 17.5 | 47.5 | 37.0% Left Superior Frontal Gyrus; 6.0% Left Middle Frontal Gyrus |
| 9 | 8.94 | 862 | −5.0 | −65.0 | 15.0 | 31.0% Left Precuneus Cortex; 23.0% Left Supracalcarine Cortex; 21.0% Left Intracalcarine Cortex |
| 9 | 9.80 | 243 | −32.5 | −82.5 | 42.5 | 65.0% Left Lateral Occipital Cortex Superior Division |
-
Thresholded at bootstrap ratio at ± 3 (p < .001), minimal cluster size of 80 voxels, and a minimal distance of 10 voxels. Labels from the Harvard-Oxford (Desikan et al., 2006) atlas obtained using AtlasReader (Notter et al., 2019).
Appendix 3—table 1
Peaks of clusters for the facts vs. events contrast at lags 5–6 and 8–9.
| Lag | Bootstrap ratio | Cluster size (voxels) | X (mm) | Y (mm) | Z (mm) | Harvard-Oxford, probability atlas |
|---|---|---|---|---|---|---|
| Negative saliences | ||||||
| 5 | −5.82 | 140 | 57.5 | 10 | 12.5 | 43.0% Right Inferior Frontal Gyrus pars opercularis; 39.0% Right Precentral Gyrus |
| 5 | −4.92 | 100 | 67.5 | −42.5 | 27.5 | 14.0% Right Supramarginal Gyrus Posterior Division |
| 6 | −7.13 | 182 | 60 | 10 | 12.5 | 39.0% Right Precentral Gyrus; 28.0% Right Inferior Frontal Gyrus pars opercularis |
| 6 | −6.18 | 267 | 55 | −37.5 | 30 | 29.0% Right Supramarginal Gyrus Posterior Division; 9.0% Right Parietal Operculum Cortex; 8.0% Right Planum Temporale; 6.0% Right Supramarginal Gyrus Anterior Division |
| 6 | −5.69 | 303 | 45 | −47.5 | 55 | NA |
| 6 | −5.63 | 363 | 52.5 | −75 | −2.5 | 80.0% Right Lateral Occipital Cortex Inferior Division |
| 6 | −5.13 | 294 | −57.5 | −47.5 | 25 | 46.0% Left Supramarginal Gyrus Posterior Division; 13.0% Left Angular Gyrus |
| 6 | −4.96 | 213 | 45 | 42.5 | 22.5 | 87.0% Right Frontal Pole; 5.0% Right Middle Frontal Gyrus |
| 6 | −4.64 | 145 | −60 | 5 | 12.5 | 79.0% Left Precentral Gyrus |
| 6 | −4.59 | 204 | −50 | −75 | −2.5 | 78.0% Left Lateral Occipital Cortex Inferior Division |
| 6 | −4.52 | 85 | −37.5 | 47.5 | 27.5 | 74.0% Left Frontal Pole |
| 8 | −5.56 | 137 | 45 | 37.5 | 10 | 54.0% Right Frontal Pole; 21.0% Right Inferior Frontal Gyrus pars triangularis |
| 8 | −5.00 | 111 | 12.5 | −62.5 | 70 | 29.0% Right Lateral Occipital Cortex Superior Division; 6.0% Right Superior Parietal Lobule |
| 8 | −4.91 | 288 | 45 | −82.5 | 17.5 | 59.0% Right Lateral Occipital Cortex Superior Division |
| 8 | −4.88 | 136 | −47.5 | −75 | 7.5 | 62.0% Left Lateral Occipital Cortex Inferior Division; 11.0% Left Lateral Occipital Cortex Superior Division |
| 8 | −4.76 | 85 | 60 | 12.5 | 12.5 | 43.0% Right Inferior Frontal Gyrus pars opercularis; 27.0% Right Precentral Gyrus |
| 8 | −4.64 | 140 | 42.5 | −47.5 | 45 | 27.0% Right Angular Gyrus; 27.0% Right Supramarginal Gyrus Posterior Division; 11.0% Right Superior Parietal Lobule |
| 8 | −4.42 | 120 | 57.5 | −35 | 32.5 | 22.0% Right Parietal Operculum Cortex; 18.0% Right Supramarginal Gyrus Posterior Division; 10.0% Right Supramarginal Gyrus Anterior Division; 8.0% Right Planum Temporale |
| 9 | −5.53 | 466 | 47.5 | −80 | 12.5 | 46.0% Right Lateral Occipital Cortex Inferior Division; 34.0% Right Lateral Occipital Cortex Superior Division |
| 9 | −4.81 | 106 | −40 | −82.5 | 12.5 | 40.0% Left Lateral Occipital Cortex Inferior Division; 35.0% Left Lateral Occipital Cortex Superior Division |
| 9 | −4.80 | 187 | 32.5 | −52.5 | 50 | 44.0% Right Superior Parietal Lobule; 14.0% Right Angular Gyrus; 8.0% Right Lateral Occipital Cortex Superior Division |
| Positive saliences | ||||||
| 5 | 5.54 | 131 | −32.5 | −82.5 | 42.5 | 65.0% Left Lateral Occipital Cortex Superior Division |
| 5 | 5.60 | 193 | −27.5 | 15 | 52.5 | 37.0% Left Middle Frontal Gyrus; 15.0% Left Superior Frontal Gyrus |
| 5 | 5.79 | 378 | −12.5 | −60 | 20 | 49.0% Left Precuneus Cortex; 11.0% Left Supracalcarine Cortex |
| 5 | 7.25 | 101 | 17.5 | −92.5 | 0 | 48.0% Right Occipital Pole; 6.0% Right Lateral Occipital Cortex Inferior Division |
| 5 | 7.29 | 150 | −12.5 | −95 | 0 | 55.0% Left Occipital Pole |
| 6 | 5.58 | 152 | −22.5 | −22.5 | −17.5 | 44.0% Left Hippocampus; 12.0% Left Parahippocampal Gyrus Posterior Division; 6.0% Left Parahippocampal Gyrus Anterior Division |
| 6 | 5.76 | 228 | −5 | 57.5 | −10 | 61.0% Left Frontal Pole; 24.0% Left Frontal Medial Cortex |
| 6 | 6.10 | 96 | 25 | 25 | 45 | 35.0% Right Middle Frontal Gyrus; 34.0% Right Superior Frontal Gyrus |
| 6 | 6.38 | 100 | 45 | −75 | 37.5 | 68.0% Right Lateral Occipital Cortex Superior Division |
| 6 | 6.44 | 120 | −12.5 | −95 | −2.5 | 62.0% Left Occipital Pole |
| 6 | 6.92 | 100 | 17.5 | −95 | 0 | 50.0% Right Occipital Pole |
| 6 | 7.52 | 333 | −22.5 | 15 | 50 | 40.0% Left Superior Frontal Gyrus; 14.0% Left Middle Frontal Gyrus |
| 6 | 8.26 | 261 | −32.5 | −82.5 | 42.5 | 65.0% Left Lateral Occipital Cortex Superior Division |
| 6 | 8.68 | 823 | −15 | −62.5 | 22.5 | 54.0% Left Precuneus Cortex; 12.0% Left Supracalcarine Cortex |
| 8 | 4.60 | 84 | −5 | 32.5 | 40 | 47.0% Left Paracingulate Gyrus; 35.0% Left Superior Frontal Gyrus |
| 8 | 4.64 | 110 | −52.5 | 15 | 37.5 | 54.0% Left Middle Frontal Gyrus; 5.0% Left Inferior Frontal Gyrus pars opercularis |
| 8 | 5.60 | 183 | 25 | 30 | 50 | 43.0% Right Superior Frontal Gyrus; 18.0% Right Middle Frontal Gyrus |
| 8 | 5.99 | 143 | 45 | −75 | 37.5 | 68.0% Right Lateral Occipital Cortex Superior Division |
| 8 | 6.34 | 94 | −57.5 | −5 | −12.5 | 37.0% Left Middle Temporal Gyrus Anterior Division; 23.0% Left Superior Temporal Gyrus Anterior Division; 9.0% Left Superior Temporal Gyrus Posterior Division |
| 8 | 6.55 | 255 | −2.5 | −35 | 45 | 60.0% Left Cingulate Gyrus Posterior Division; 25.0% Left Precuneus Cortex |
| 8 | 7.14 | 438 | −22.5 | 25 | 45 | 47.0% Left Superior Frontal Gyrus; 20.0% Left Middle Frontal Gyrus |
| 8 | 10.43 | 1115 | −5 | −62.5 | 15 | 42.0% Left Precuneus Cortex; 16.0% Left Intracalcarine Cortex; 12.0% Left Supracalcarine Cortex |
| 8 | 10.58 | 424 | −35 | −82.5 | 42.5 | 57.0% Left Lateral Occipital Cortex Superior Division |
| 8 | 11.07 | 668 | −2.5 | 50 | −7.5 | 43.0% Left Frontal Medial Cortex; 38.0% Left Paracingulate Gyrus |
| 9 | 5.15 | 153 | 27.5 | 25 | 52.5 | 29.0% Right Middle Frontal Gyrus; 24.0% Right Superior Frontal Gyrus |
| 9 | 5.36 | 85 | −57.5 | −5 | −12.5 | 37.0% Left Middle Temporal Gyrus Anterior Division; 23.0% Left Superior Temporal Gyrus Anterior Division; 9.0% Left Superior Temporal Gyrus Posterior Division |
| 9 | 6.20 | 188 | −7.5 | 27.5 | 45 | 25.0% Left Superior Frontal Gyrus; 6.0% Left Paracingulate Gyrus |
| 9 | 7.35 | 1051 | 0 | 57.5 | −5 | 25.0% Right Frontal Pole; 20.0% Left Frontal Pole; 5.0% Right Frontal Medial Cortex |
| 9 | 7.50 | 554 | −25 | 27.5 | 45 | 30.0% Left Superior Frontal Gyrus; 29.0% Left Middle Frontal Gyrus |
| 9 | 7.85 | 1075 | 0 | −62.5 | 25 | 74.0% Left Precuneus Cortex; 16.0% Right Precuneus Cortex |
| 9 | 9.38 | 280 | −32.5 | −82.5 | 42.5 | 65.0% Left Lateral Occipital Cortex Superior Division |
-
Thresholded at bootstrap ratio at ± 3 (p < .001), minimal cluster size of 80 voxels, and a minimal distance of 10 voxels. Labels from the Harvard-Oxford (Desikan et al., 2006) atlas obtained using AtlasReader (Notter et al., 2019).
Appendix 4—table 1
Peaks of clusters for latent variable (LV) 1 of the mean-centered partial least squares (PLS) (memory and control) at lag 7.
| Bootstrap ratio | Cluster size (voxels) | X (mm) | Y (mm) | Z (mm) | Harvard-Oxford, probability atlas |
|---|---|---|---|---|---|
| Negative saliences | |||||
| −19.56 | 9172 | −5.0 | −57.5 | 15.0 | 49% Left Precuneus Cortex; 8% Left Cingulate Gyrus Posterior Division |
| −15.77 | 5015 | −45.0 | 27.5 | −10.0 | 67% Left Frontal Orbital Cortex; 7% Left Inferior Frontal Gyrus Pars Triangularis |
| −13.30 | 260 | 5.0 | −55.0 | −47.5 | No Label |
| −13.21 | 2622 | −2.5 | 30.0 | 42.5 | 45% Left Paracingulate Gyrus; 30% Left Superior Frontal Gyrus |
| −12.42 | 364 | 47.5 | −72.5 | 37.5 | 57% Right Lateral Occipital Cortex Superior Division |
| −12.25 | 289 | 0.0 | 60.0 | −10.0 | 36% Right Frontal Pole; 31% Left Frontal Pole |
| −11.48 | 846 | 40.0 | −75.0 | −37.5 | No Label |
| −8.03 | 805 | 37.5 | −17.5 | 45.0 | 50% Right Precentral Gyrus; 26% Right Postcentral Gyrus |
| −7.96 | 221 | 40.0 | 40.0 | −10.0 | 36% Right Frontal Pole; 7% Right Frontal Orbital Cortex |
| −5.23 | 130 | 47.5 | −20.0 | 17.5 | 45% Right Parietal Operculum Cortex; 31% Right Central Opercular Cortex; 5% Right Postcentral Gyrus |
| −5.10 | 192 | 55.0 | 25.0 | 17.5 | 41% Right Inferior Frontal Gyrus Pars Triangularis; 21% Right Inferior Frontal Gyrus Pars Opercularis; 5% Right Middle Frontal Gyrus |
| Positive saliences | |||||
| 5.77 | 143 | −30.0 | −65.0 | −22.5 | No Label |
| 6.37 | 231 | 20.0 | 5.0 | 52.5 | 18% Right Superior Frontal Gyrus |
| 6.84 | 587 | 7.5 | −75.0 | 45.0 | 42% Right Precuneus Cortex; 17% Right Cuneal Cortex; 10% Right Lateral Occipital Cortex Superior Division |
| 7.86 | 329 | −27.5 | −12.5 | 57.5 | 39% Left Precentral Gyrus; 9% Left Superior Frontal Gyrus |
| 7.87 | 224 | −20.0 | −75.0 | −47.5 | No Label |
| 8.51 | 284 | 40.0 | −10.0 | −10.0 | 32% Right Planum Polare; 25% Right Insular Cortex |
| 8.63 | 417 | 7.5 | −32.5 | 47.5 | 30% Right Cingulate Gyrus Posterior Division; 27% Right Precentral Gyrus; 16% Right Precuneus Cortex; 9% Right Postcentral Gyrus |
| 8.74 | 1477 | −30.0 | −65.0 | 12.5 | No Label |
| 9.21 | 536 | 50.0 | 7.5 | 20.0 | 35% Right Precentral Gyrus; 31% Right Inferior Frontal Gyrus Pars Opercularis |
| 10.10 | 2341 | −15.0 | 32.5 | 5.0 | 8% Left Lateral Ventricle |
| 10.43 | 2352 | −60.0 | −32.5 | 52.5 | 20% Left Supramarginal Gyrus Anterior Division |
| 12.24 | 1112 | 57.5 | −35.0 | 52.5 | 43% Right Supramarginal Gyrus Posterior Division; 18% Right Supramarginal Gyrus Anterior Division |
| 12.40 | 3966 | 20.0 | −52.5 | −25.0 | No Label |
-
Note: Thresholded at bootstrap ratio at ± 3 (p < .001), minimal cluster size of 80 voxels, and a minimal distance of 10 voxels. Labels from the Harvard-Oxford (Desikan et al., 2006) atlas obtained using AtlasReader (Notter et al., 2019).
Appendix 4—table 2
Peaks of clusters for latent variable (LV) 1 of the mean-centered partial least squares (PLS) (memory and control) at lags 5–6 and 8–9.
| Lag | Bootstrap ratio | Cluster size (voxels) | X (mm) | Y (mm) | Z (mm) | Harvard-Oxford, probability atlas |
|---|---|---|---|---|---|---|
| Negative saliences | ||||||
| 5 | −17.08 | 2903 | −2.5 | −57.5 | 17.5 | 74% Left Precuneus Cortex; 19% Left Cingulate Gyrus Posterior Division |
| 5 | −15.47 | 5464 | −45.0 | 25.0 | −10.0 | 74% Left Frontal Orbital Cortex; 6% Left Frontal Operculum Cortex |
| 5 | −14.49 | 436 | −12.5 | −95.0 | −5.0 | 55% Left Occipital Pole |
| 5 | −13.18 | 1486 | −45.0 | −65.0 | 30.0 | 54% Left Lateral Occipital Cortex Superior Division; 8% Left Angular Gyrus |
| 5 | −12.36 | 555 | −55.0 | −7.5 | −12.5 | 28% Left Superior Temporal Gyrus Anterior Division; 24% Left Middle Temporal Gyrus Anterior Division; 14% Left Superior Temporal Gyrus Posterior Division; 5% Left Middle Temporal Gyrus Posterior Division |
| 5 | −12.16 | 1856 | 20.0 | −95.0 | 0.0 | 44% Right Occipital Pole |
| 5 | −10.94 | 380 | 50.0 | −72.5 | 35.0 | 47% Right Lateral Occipital Cortex Superior Division |
| 5 | −10.07 | 160 | 37.5 | 40.0 | −12.5 | 57% Right Frontal Pole; 11% Right Frontal Orbital Cortex |
| 5 | −8.82 | 416 | 35.0 | −65.0 | −30.0 | No Label |
| 5 | −8.51 | 105 | 60.0 | −5.0 | −17.5 | 48% Right Middle Temporal Gyrus Anterior Division; 14% Right Middle Temporal Gyrus Posterior Division; 5% Right Superior Temporal Gyrus Posterior Division |
| 5 | −8.11 | 134 | 5.0 | −57.5 | −50.0 | No Label |
| 5 | −7.17 | 658 | 47.5 | −15.0 | 52.5 | 44% Right Postcentral Gyrus; 23% Right Precentral Gyrus |
| 5 | −4.62 | 124 | 57.5 | 27.5 | 15.0 | 50% Right Inferior Frontal Gyrus Pars Triangularis; 14% Right Inferior Frontal Gyrus Pars Opercularis |
| 6 | −19.95 | 7309 | −2.5 | −57.5 | 17.5 | 74% Left Precuneus Cortex; 19% Left Cingulate Gyrus Posterior Division |
| 6 | −16.49 | 7663 | −45.0 | 27.5 | −10.0 | 67% Left Frontal Orbital Cortex; 7% Left Inferior Frontal Gyrus Pars Triangularis |
| 6 | −13.44 | 675 | −45.0 | −72.5 | 35.0 | 78% Left Lateral Occipital Cortex Superior Division |
| 6 | −12.30 | 388 | 50.0 | −70.0 | 35.0 | 78% Right Lateral Occipital Cortex Superior Division |
| 6 | −11.98 | 208 | 5.0 | −52.5 | −45.0 | No Label |
| 6 | −9.92 | 649 | 35.0 | −65.0 | −30.0 | No Label |
| 6 | −8.61 | 228 | 37.5 | 40.0 | −10.0 | 44% Right Frontal Pole; 11% Right Frontal Orbital Cortex |
| 6 | −8.51 | 757 | 45.0 | −22.5 | 52.5 | 44% Right Postcentral Gyrus; 5% Right Precentral Gyrus |
| 6 | −8.42 | 135 | 60.0 | −5.0 | −17.5 | 48% Right Middle Temporal Gyrus Anterior Division; 14% Right Middle Temporal Gyrus Posterior Division; 5% Right Superior Temporal Gyrus Posterior Division |
| 6 | −4.73 | 95 | 57.5 | 25.0 | 20.0 | 40% Right Inferior Frontal Gyrus Pars Triangularis; 16% Right Inferior Frontal Gyrus Pars Opercularis; 7% Right Middle Frontal Gyrus |
| 8 | −17.60 | 11,337 | −5.0 | −55.0 | 17.5 | 51% Left Precuneus Cortex; 20% Left Cingulate Gyrus Posterior Division |
| 8 | −14.98 | 8569 | −45.0 | 27.5 | −10.0 | 67% Left Frontal Orbital Cortex; 7% Left Inferior Frontal Gyrus Pars Triangularis |
| 8 | −13.29 | 299 | 5.0 | −52.5 | −45.0 | No Label |
| 8 | −11.48 | 315 | 50.0 | −70.0 | 37.5 | 59% Right Lateral Occipital Cortex Superior Division |
| 8 | −8.13 | 135 | −10.0 | −30.0 | −30.0 | 97% Brain-Stem |
| 8 | −7.75 | 238 | 35.0 | 25.0 | −2.5 | 40% Right Insular Cortex; 36% Right Frontal Orbital Cortex; 5% Right Frontal Operculum Cortex |
| 8 | −7.45 | 93 | −10.0 | 7.5 | 17.5 | 58% Left Lateral Ventricle; 41% Left Caudate |
| 8 | −7.06 | 285 | 45.0 | −25.0 | 17.5 | 76% Right Parietal Operculum Cortex; 6% Right Planum Temporale; 5% Right Heschl’s Gyrus (includes H1 and H2) |
| 8 | −7.02 | 788 | 37.5 | −15.0 | 45.0 | 61% Right Precentral Gyrus; 13% Right Postcentral Gyrus |
| 8 | −5.23 | 157 | −2.5 | −12.5 | 62.5 | 50% Left Juxtapositional Lobule Cortex; 34% Left Precentral Gyrus |
| 8 | −4.85 | 96 | −35.0 | −32.5 | 22.5 | 44% Left Parietal Operculum Cortex |
| 9 | −17.53 | 11,252 | −22.5 | −80.0 | −7.5 | 43% Left Occipital Fusiform Gyrus; 13% Left Lingual Gyrus |
| 9 | −14.91 | 9678 | −47.5 | 40.0 | −5.0 | 70% Left Frontal Pole; 8% Left Inferior Frontal Gyrus Pars Triangularis; 5% Left Frontal Orbital Cortex |
| 9 | −14.14 | 332 | 7.5 | −52.5 | −45.0 | No Label |
| 9 | −9.50 | 728 | −60.0 | −45.0 | −5.0 | 33% Left Middle Temporal Gyrus Temporooccipital Part; 18% Left Middle Temporal Gyrus Posterior Division |
| 9 | −9.11 | 251 | 50.0 | −70.0 | 37.5 | 59% Right Lateral Occipital Cortex Superior Division |
| 9 | −8.04 | 581 | 37.5 | −17.5 | 12.5 | 69% Right Insular Cortex; 9% Right Heschl’s Gyrus (includes H1 and H2) |
| 9 | −7.82 | 210 | 40.0 | 42.5 | −10.0 | 47% Right Frontal Pole |
| 9 | −6.74 | 120 | 17.5 | 5.0 | 17.5 | 72% Right Caudate |
| 9 | −6.15 | 195 | 37.5 | −15.0 | 42.5 | 57% Right Precentral Gyrus; 16% Right Postcentral Gyrus |
| 9 | −6.06 | 262 | −37.5 | −30.0 | 22.5 | 53% Left Parietal Operculum Cortex; 6% Left Central Opercular Cortex |
| 9 | −5.81 | 105 | 55.0 | 20.0 | 7.5 | 47% Right Inferior Frontal Gyrus Pars Opercularis; 25% Right Inferior Frontal Gyrus Pars Triangularis |
| 9 | −5.73 | 302 | 25.0 | −25.0 | 70.0 | 45% Right Precentral Gyrus; 15% Right Postcentral Gyrus |
| Positive saliences | ||||||
| 5 | 7.42 | 671 | 42.5 | 47.5 | 15.0 | 78% Right Frontal Pole |
| 5 | 7.64 | 380 | −35.0 | −50.0 | −30.0 | No Label |
| 5 | 8.93 | 189 | −22.5 | −75.0 | −52.5 | No Label |
| 5 | 10.12 | 1257 | 42.5 | 5.0 | 0.0 | 71% Right Insular Cortex; 7% Right Central Opercular Cortex |
| 5 | 13.79 | 5490 | 25.0 | −55.0 | −20.0 | No Label |
| 5 | 16.45 | 11,000 | −42.5 | −17.5 | 60.0 | 46% Left Precentral Gyrus; 15% Left Postcentral Gyrus |
| 6 | 6.87 | 84 | −15.0 | −27.5 | 37.5 | 23% Left Precentral Gyrus; 18% Left Cingulate Gyrus Posterior Division; 5% Left Precuneus Cortex |
| 6 | 7.61 | 318 | −35.0 | −50.0 | −30.0 | No Label |
| 6 | 7.95 | 672 | 45.0 | 47.5 | 15.0 | 88% Right Frontal Pole |
| 6 | 9.13 | 132 | 10.0 | −35.0 | 45.0 | 39% Right Cingulate Gyrus Posterior Division; 32% Right Precuneus Cortex; 5% Right Postcentral Gyrus; 5% Right Precentral Gyrus |
| 6 | 10.23 | 1203 | 40.0 | −10.0 | −7.5 | 55% Right Insular Cortex; 20% Right Planum Polare |
| 6 | 13.30 | 945 | 15.0 | −65.0 | −45.0 | No Label |
| 6 | 13.58 | 10,698 | −50.0 | −35.0 | 50.0 | 36% Left Supramarginal Gyrus Anterior Division; 23% Left Postcentral Gyrus; 14% Left Superior Parietal Lobule |
| 6 | 15.35 | 4346 | 17.5 | −55.0 | −17.5 | No Label |
| 8 | 5.27 | 123 | 22.5 | 5.0 | 60.0 | 43% Right Superior Frontal Gyrus |
| 8 | 5.35 | 132 | −25.0 | −62.5 | 32.5 | 24% Left Lateral Occipital Cortex Superior Division |
| 8 | 6.13 | 322 | −45.0 | −70.0 | −7.5 | 75% Left Lateral Occipital Cortex Inferior Division |
| 8 | 6.45 | 271 | 15.0 | −62.5 | −45.0 | No Label |
| 8 | 6.71 | 140 | −22.5 | −75.0 | −52.5 | No Label |
| 8 | 7.23 | 90 | −32.5 | −92.5 | −5.0 | 53% Left Occipital Pole; 21% Left Lateral Occipital Cortex Inferior Division |
| 8 | 7.35 | 331 | 12.5 | −65.0 | 40.0 | 43% Right Precuneus Cortex |
| 8 | 7.99 | 230 | −17.5 | −5.0 | 30.0 | No Label |
| 8 | 8.04 | 159 | 5.0 | −27.5 | 45.0 | 62% Right Cingulate Gyrus Posterior Division; 15% Right Precentral Gyrus; 7% Right Precuneus Cortex |
| 8 | 8.10 | 331 | 45.0 | 45.0 | 10.0 | 87% Right Frontal Pole |
| 8 | 8.14 | 455 | 50.0 | 7.5 | 22.5 | 41% Right Precentral Gyrus; 33% Right Inferior Frontal Gyrus Pars Opercularis |
| 8 | 8.52 | 384 | −25.0 | −55.0 | 15.0 | 10% Left Lateral Ventricle |
| 8 | 9.08 | 840 | −55.0 | −35.0 | 52.5 | 48% Left Supramarginal Gyrus Anterior Division |
| 8 | 9.84 | 1103 | −17.5 | 32.5 | 5.0 | 6% Left Lateral Ventricle |
| 8 | 11.53 | 3742 | 57.5 | −37.5 | 55.0 | 22% Right Supramarginal Gyrus Posterior Division |
| 9 | 5.45 | 152 | 22.5 | 7.5 | 60.0 | 40% Right Superior Frontal Gyrus; 6% Right Middle Frontal Gyrus |
| 9 | 6.37 | 131 | −22.5 | −75.0 | −47.5 | No Label |
| 9 | 7.02 | 444 | −55.0 | −37.5 | 55.0 | 33% Left Supramarginal Gyrus Anterior Division; 8% Left Supramarginal Gyrus Posterior Division |
| 9 | 7.02 | 123 | 7.5 | −32.5 | 47.5 | 30% Right Cingulate Gyrus Posterior Division; 27% Right Precentral Gyrus; 16% Right Precuneus Cortex; 9% Right Postcentral Gyrus |
| 9 | 7.70 | 150 | −17.5 | −7.5 | 30.0 | No Label |
| 9 | 7.89 | 284 | 45.0 | 45.0 | 10.0 | 87% Right Frontal Pole |
| 9 | 8.30 | 532 | −25.0 | −55.0 | 15.0 | 10% Left Lateral Ventricle |
| 9 | 9.07 | 714 | −12.5 | 30.0 | 2.5 | 12% Left Lateral Ventricle |
| 9 | 9.20 | 433 | 42.5 | 10.0 | 30.0 | 25% Right Precentral Gyrus; 21% Right Middle Frontal Gyrus; 17% Right Inferior Frontal Gyrus Pars Opercularis |
| 9 | 9.23 | 553 | −30.0 | −92.5 | −5.0 | 46% Left Occipital Pole; 14% Left Lateral Occipital Cortex Inferior Division |
| 9 | 10.06 | 2805 | 55.0 | −37.5 | 52.5 | 64% Right Supramarginal Gyrus Posterior Division; 11% Right Supramarginal Gyrus Anterior Division |
| 9 | 10.78 | 840 | 32.5 | −95.0 | −7.5 | 62% Right Occipital Pole; 10% Right Lateral Occipital Cortex Inferior Division |
-
Note: Thresholded at bootstrap ratio at ± 3 (p < .001), minimal cluster size of 80 voxels, and a minimal distance of 10 voxels. Labels from the Harvard-Oxford (Desikan et al., 2006) atlas obtained using AtlasReader (Notter et al., 2019).
Appendix 5—table 1
Practice task.
| Unique events (UE)‘Please respond (yes or no) if the following events happened to you.’ 1 | Repeated events (RE)‘Please respond (yes or no) if the following events have happened to you repeatedly in the last year.’ | Autobiographical facts (AF)‘Please respond (yes or no) according to what is usually true for you.’ | General facts (GF)‘Please respond (yes or no) according to what is usually true for people in this country.’ | |||||
|---|---|---|---|---|---|---|---|---|
| StimuliID | Cue | Sentence | Cue | Sentence | Cue | Sentence | Cue | Sentence |
| Ex. 1 | Yesterday | I bought a lottery ticket. | When with friends | I have bought a lottery ticket. | Often | I buy lottery tickets. | Few people | Buy lottery tickets. |
| Ex. 2 | Last weekend | I attended a wedding. | When on vacation | I attended a wedding. | Usually | I attend weddings. | Everyone | Attends weddings. |
-
For the first one, please answer yes or no according to what happened to you once. For example, it could say: This morning, I paid bills. If that happened once, you would say yes.
-
For the second one, please answer yes or no accord to what happened to you repeatedly in the last year. For example, it could say: When at work, I paid bills. The key word is ‘repeatedly’. If that happened repeatedly, you would say yes.
-
For the third one, please answer yes or no according to what is usually true to you. For example, it could say: Often, I pay bills. If that were true for you, you would say yes.
-
Last, please answer yes or no according to what you think is true of most people in this country. For example, a statement could be: Everyone pays bills. If you agree with this, you would say ‘yes’.
Appendix 5—table 2
Stimuli list.
| Unique events (UE)‘Please respond (yes or no) if the following events happened to you.’ 1 | Repeated events (RE)‘Please respond (yes or no) if the following events have happened to you repeatedly in the last year.’ | Autobiographical facts (AF)‘Please respond (yes or no) according to what is usually true for you.’ | General facts (GF)‘Please respond (yes or no) according to what is usually true for people in this country.’ | |||||||||
|---|---|---|---|---|---|---|---|---|---|---|---|---|
| StimuliID | Run | Cue | Sentence | Run | Cue | Sentence | Run | Cue | Sentence | Run | Cue | Sentence |
| 1 | B | Yesterday | I wore white socks. | G | When shopping | I have worn white socks. | F | Usually | I wear white socks. | C | Everyone | Wears white socks. |
| 2 | E | Last night | I took a shower. | F | When on vacation | I have taken a shower. | D | Often | I take showers. | D | Most people | Take showers. |
| 3 | C | Last night | I used a computer. | E | When at work | I have used a computer. | B | Very often | I use a computer. | G | Few people | Use a computer. |
| 4 | D | Today | I ate breakfast. | F | When with friends | I have eaten breakfast. | F | Usually | I eat breakfast. | F | Some people | Skip breakfast. |
| 5 | G | This morning | I made my bed. | F | When with friends | I have made my bed. | F | Every day | I make my bed. | B | Few people | Make their bed. |
| 6 | G | Last week-end | I drove on a highway. | B | When going to a clinic | I have driven on a highway. | G | Rarely | I drive on a highway. | G | Most people | Drive on the highway. |
| 7 | A | Yesterday | I ate a chocolate. | E | When shopping | I have eaten a chocolate. | D | Rarely | do I eat chocolate. | A | Most people | Eat chocolate. |
| 8 | G | This week | I read a book. | A | When on the bus | I have read books. | G | Rarely | I read books. | C | Few people | Read books. |
| 9 | C | This week | I ate at a restaurant. | C | When alone | I have eaten at a restaurant. | G | Often | I eat at restaurants. | G | No one | Eats at restaurants. |
| 10 | E | Last night | I watched tv. | A | When at work | I have watched TV. | G | Very often | I watch TV. | C | Everyone | Watches TV. |
| 11 | E | This week | I went shopping. | B | When on vacation | I have gone shopping. | C | Very often | I go shopping. | F | Few people | Go shopping. |
| 12 | D | This morning | I drank coffee. | E | When shopping | I have drunk coffee. | D | Every day | I drink coffee. | C | Many people | Drink coffee. |
| 13 | D | Today | I talked on the phone. | A | When on the bus | I have talked on the phone. | E | Very often | I talk on the phone. | F | Everyone | Talks on the phone. |
| 14 | E | Last night | I ate pizza. | E | When shopping | I have eaten pizza. | F | Every day | I eat pizza. | A | Most people | Eat pizza. |
| 15 | A | This week | I went to the movies. | C | When alone | I have gone to the movies. | G | Sometimes | I go to the movies. | D | Many people | Go to the movies. |
| 16 | A | Today | I read a newspaper. | G | When on the bus | I have read a newspaper. | A | Rarely | I read a newspaper. | B | Everyone | Reads a newspaper. |
| 17 | A | Today | I spent money. | C | When at work | I have spent money. | C | Every day | I spend money. | D | No one | Spends money. |
| 18 | D | Last week-end | I rented a movie. | C | When alone | I have rented a movie. | F | Rarely | I rent movies. | G | Some people | Rent movies. |
| 19 | A | Yesterday | I read a magazine. | F | When with friends | I have read a magazine. | B | Often | I read magazines. | G | Most people | Read magazines. |
| 20 | B | Yesterday | I listened to music. | C | When at work | I have listened to music. | D | Often | I listen to music. | G | Most people | Listen to music. |
| 21 | B | Yesterday | I washed dishes. | A | When at work | I have washed dishes. | D | Every day | I wash the dishes. | G | No one | Washes the dishes. |
| 22 | E | This week | I talked to a family member. | D | When at a clinic | I have talked to a family member. | C | Often | I talk to a family member. | D | Most people | Talk to family members. |
| 23 | F | Yesterday | I wore jeans. | A | When at work | I have worn jeans. | A | Sometimes | I wear jeans. | E | Most people | Wear jeans. |
| 24 | C | Last night | I slept well. | A | When alone | I have slept well. | C | Usually | I sleep well. | C | No one | Sleeps well. |
| 25 | F | This morning | I woke up early. | G | When on vacation | I have woken up early. | D | Usually | I wake up early. | C | No one | Wakes up early. |
| 26 | F | Today | I had chicken. | D | When at work | I have eaten chicken. | F | Sometimes | I eat chicken. | C | Everyone | Eats chicken. |
| 27 | G | Today | I listened to the radio. | D | When at a clinic | I have listened to the radio. | C | Every day | I listen to the radio. | F | Few people | Listen to the radio. |
| 28 | F | Last night | I went to bed early. | F | When with friends | I have gone to bed early. | B | Usually | I go to bed early. | A | Some people | Go to bed early. |
| 29 | F | Yesterday | I took a nap. | E | When on vacation | I have taken naps. | A | Often | I take naps. | E | No one | Takes naps. |
| 30 | B | Last night | I cooked dinner. | F | When with friends | I have cooked dinner. | G | Rarely | I cook dinner. | F | Many people | Cook dinner. |
| 31 | C | Last week-end | I went dancing. | C | When alone | I have gone dancing. | E | Often | I go dancing. | D | Few people | Go dancing. |
| 32 | D | This week | I watched sports. | D | When alone | I have watched sports. | B | Often | I watch sports. | D | Everyone | Watches sports. |
| 33 | G | This morning | I checked my email. | D | When on the bus | I have checked my email. | G | Often | I check my email. | G | Everyone | Checks their email. |
| 34 | B | This week | I played with a dog. | C | When alone | I have played with a dog. | G | Rarely | I play with dogs. | D | Some people | Play with dogs. |
| 35 | C | This week | I bought a CD. | G | When on vacation | I have bought CDs. | C | Rarely | I buy CDs. | D | No one | Buys CDs. |
| 36 | D | This week | I ate fries. | B | When on the bus | I have eaten fries. | F | Rarely | I eat fries. | C | Many people | Eat fries. |
| 37 | G | Last week-end | I went to the mall. | B | When on vacation | I have gone to the mall. | C | Often | I go to the mall. | E | No one | Goes to the mall. |
| 38 | F | This morning | I drank juice. | C | When shopping | I have drunk juice. | A | Very often | I drink juice. | B | Many people | Drink juice. |
| 39 | G | Today | I went on a walk. | A | When alone | I have gone on a walk. | A | Sometimes | I go on walks. | F | Some people | Go on walks. |
| 40 | F | Yesterday | I ate candy. | D | When at work | I have eaten candy. | B | Rarely | I eat candy. | E | Some people | Eat candy. |
| 41 | B | This morning | I went to the bank. | G | When with friends | I have gone to the bank. | G | Sometimes | I go to the bank. | A | Few people | Go to the bank. |
| 42 | C | Last week-end | I played a video game. | C | When alone | I have played a video game. | D | Very often | I play video games. | D | Most people | Play video games. |
| 43 | B | This week | I worked out. | E | When on vacation | I have worked out. | E | Very often | I work out. | C | Some people | Work out. |
| 44 | G | Last week-end | I did my laundry. | E | When with friends | I have done my laundry. | B | Very often | I do my laundry. | F | Everyone | Does their laundry. |
| 45 | E | Last week-end | I ate pancakes. | G | When with friends | I have eaten pancakes. | E | Sometimes | I eat pancakes. | B | Some people | Eat pancakes. |
| 46 | D | Yesterday | I logged on to Facebook. | D | When at work | I have logged on to Facebook. | C | Very often | I log on to Facebook. | A | Everyone | Logs on to Facebook. |
| 47 | F | Yesterday | I sent a text message. | D | When on the bus | I have sent a text message. | D | Every day | I send text messages. | A | Some people | Send text messages. |
| 48 | A | This week | I ate a sandwich. | B | When at work | I have eaten a sandwich. | F | Rarely | I eat sandwiches. | B | Some people | Eat sandwiches. |
| 49 | A | Last week-end | I hugged a friend. | F | When on vacation | I have hugged a friend. | E | Sometimes | I hug a friend. | E | Many people | Hug friends. |
| 50 | F | Last week-end | I watered a plant. | G | When on vacation | I have watered a plant. | G | Often | I water a plant. | A | Many people | Water plants. |
| 51 | A | Last night | I sang a tune. | E | When shopping | I have sung a tune. | F | Sometimes | I sing a tune. | F | No one | Sings tunes. |
| 52 | A | This morning | I kissed somebody. | B | When on vacation | I have kissed somebody. | B | Every day | I kiss somebody. | B | Most people | Kiss others. |
| 53 | A | Last week-end | I bought a gift. | F | When with friends | I have bought a gift. | D | Rarely | I buy gifts. | E | Everyone | Buys gifts. |
| 54 | E | This morning | I went to the gym. | B | When on vacation | I have been to the gym. | E | Sometimes | I go to the gym. | B | Few people | Go to the gym. |
| 55 | C | Today | I missed a meeting. | A | When at work | I have missed a meeting. | D | Often | I miss a meeting. | A | No one | Misses meetings. |
| 56 | B | Last night | I had a drink. | C | When alone | I have had a drink. | A | Very often | I have a drink. | B | Many people | Gave a drink. |
| 57 | D | Yesterday | I took a picture. | F | When shopping | I have taken a picture. | A | Very often | I take pictures. | E | Few people | Take pictures. |
| 58 | D | Today | I went to a pharmacy. | B | When on vacation | I have been to the pharmacy. | A | Rarely | I go to the pharmacy. | C | Everyone | Goes to the pharmacy. |
| 59 | C | This morning | I prayed. | F | When with friends | I have prayed. | A | Sometimes | I pray. | A | Few people | Pray. |
| 60 | F | Last night | I heard jokes. | E | When shopping | I have heard jokes. | C | Every day | I hear jokes. | F | Everyone | Hears jokes. |
| 61 | C | This week | I gave to a charity. | E | When shopping | I have given to charity. | E | Usually | I give to charity. | B | Few people | Give to charity. |
| 62 | E | Last week-end | I visited a museum. | G | When with friends | I have visited a museum. | B | Rarely | I visit a museum. | D | Many people | Visit museums. |
| 63 | G | Yesterday | I took a course. | G | When on vacation | I have taken a course. | A | Every day | I take a course. | E | Many people | Take a course. |
| 64 | E | Last week-end | I had a cold. | G | When on vacation | I have had a cold. | B | Rarely | I have a cold. | B | Many people | Have a cold. |
| 65 | D | This week | I went swimming. | A | When at work | I have gone swimming. | B | Sometimes | I go swimming. | E | No one | Goes swimming. |
| 66 | B | Today | I checked the news online. | D | When at a clinic | I have checked the news online. | E | Every day | I check the news online. | F | Few people | Check the news online. |
| 67 | B | Last night | I drove my car. | A | When going to a clinic | I have driven my car. | F | Very often | I drive my car. | G | Most people | Drive their car. |
| 68 | G | Yesterday | I brushed my teeth. | D | When at a clinic | I brushed my teeth. | E | Very often | I brush my teeth. | E | Everyone | Brushes their teeth. |
| 69 | E | Yesterday | I ate fruit. | B | When shopping | I ate fruit. | C | Every day | I eat fruits. | A | Most people | Eat fruit. |
| 70 | C | Today | I washed my face. | B | When alone | I washed my face. | E | Usually | I wash my face. | G | No one | Washes their face. |
-
Note: 1Brief instructions displayed at the beginning of each block within each run. 2The memory order within each run was based on the Latin Square technique. Run A and G: RE, UE, AF, GF; Run B and D: UE, AF, GF, RE; Run C: AF, GF, RE, UE; Run E and F: GF, RE, UE, AF. Run order was randomized for each participant. Stimuli were randomized within each block per participant.
Additional files
Download links
A two-part list of links to download the article, or parts of the article, in various formats.
Downloads (link to download the article as PDF)
Open citations (links to open the citations from this article in various online reference manager services)
Cite this article (links to download the citations from this article in formats compatible with various reference manager tools)
The shared and unique neural correlates of personal semantic, general semantic, and episodic memory
eLife 12:e83645.
https://doi.org/10.7554/eLife.83645


