The ‘ForensOMICS’ approach for postmortem interval estimation from human bone by integrating metabolomics, lipidomics, and proteomics
- The Forensic Science Unit, Faculty of Health and Life Sciences, Northumbria University, United Kingdom
- Amsterdam Centre for Ancient Studies and Archaeology (ACASA) – Department of Archaeology, Faculty of Humanities, University of Amsterdam, Netherlands
- Forensic Anthropology Center, Texas State University, United States
- Department of Medical Science and Public Health, Section of Legal Medicine, University of Cagliari, Italy
Figures
Figure 1 with 5 supplements
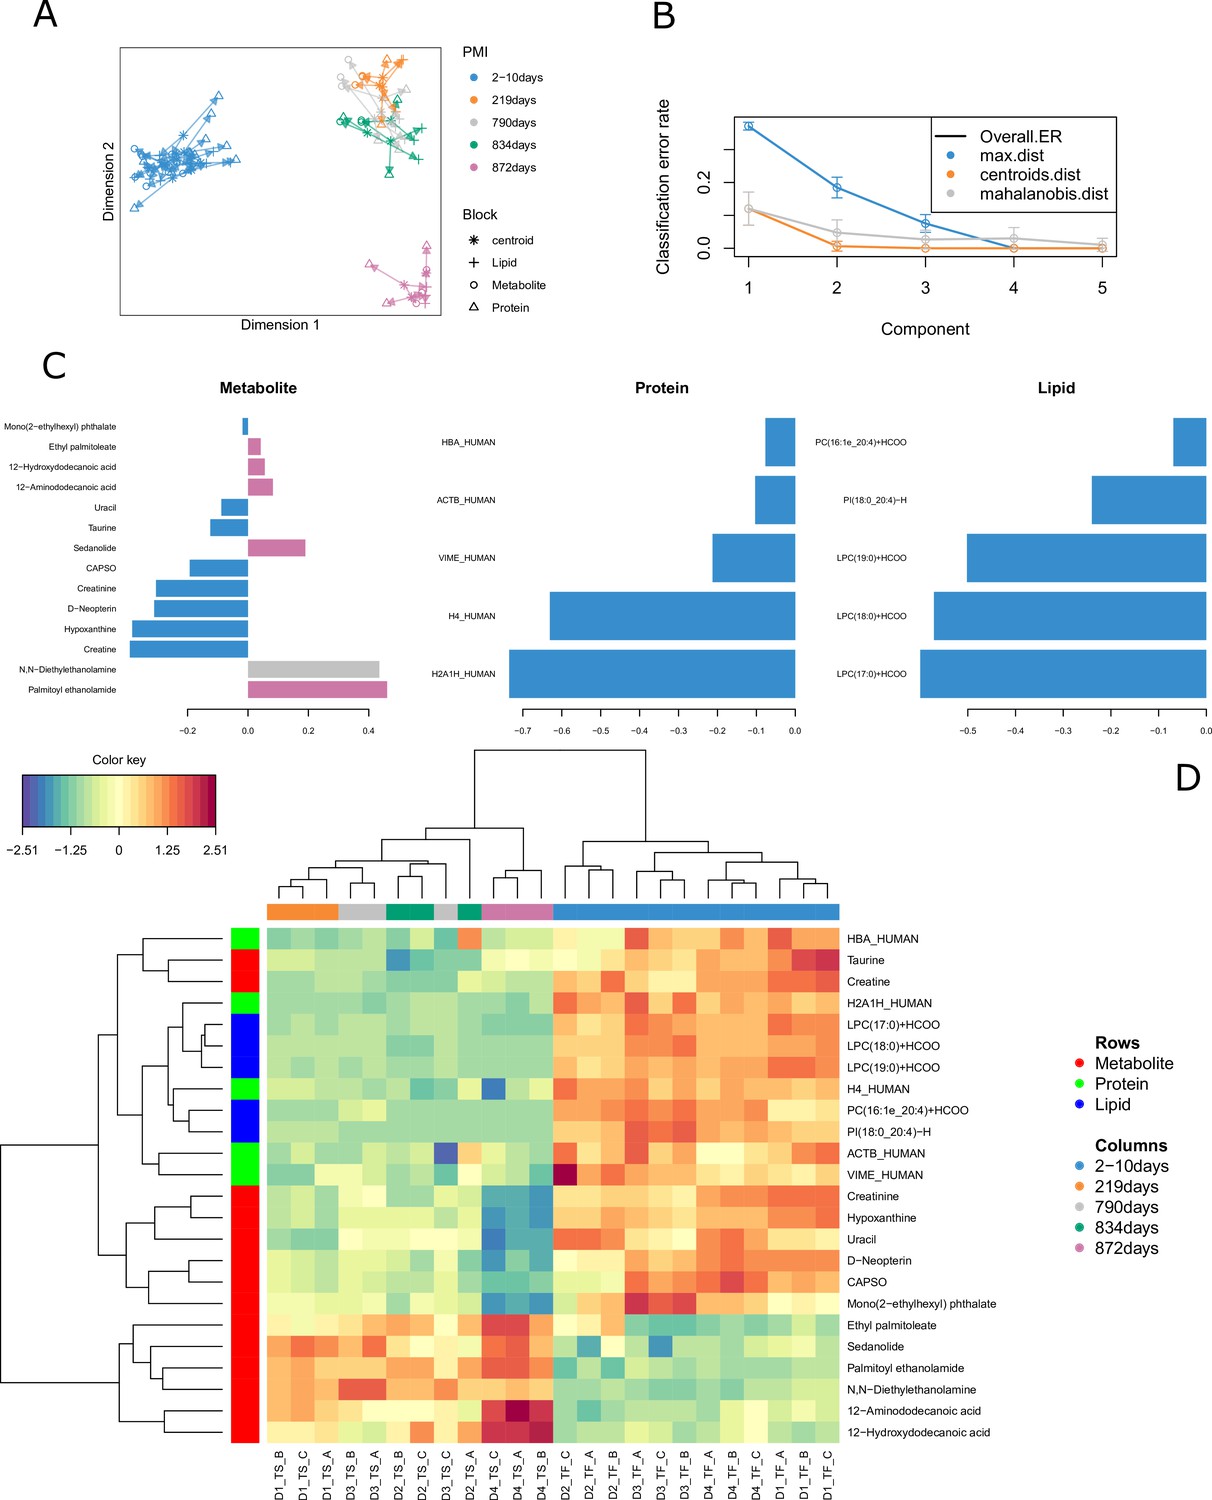
Results for the tuned model.
(A) Arrow plot showing multiblock contexts for the overall model. (B) Optimal number of components to explain model variable calculated via cross-validation (error bars provide standard deviation). (C) Loading plot showing how each variable contributes to the covariance of each group. (D) The clustered image map (CIM) shows the selected compounds in the final model. It is possible to see that most compounds decrease in intensity after decomposition except for few metabolites and two lipids that specifically increase in certain postmortem interval (PMI) intervals.
Figure 1—figure supplement 1
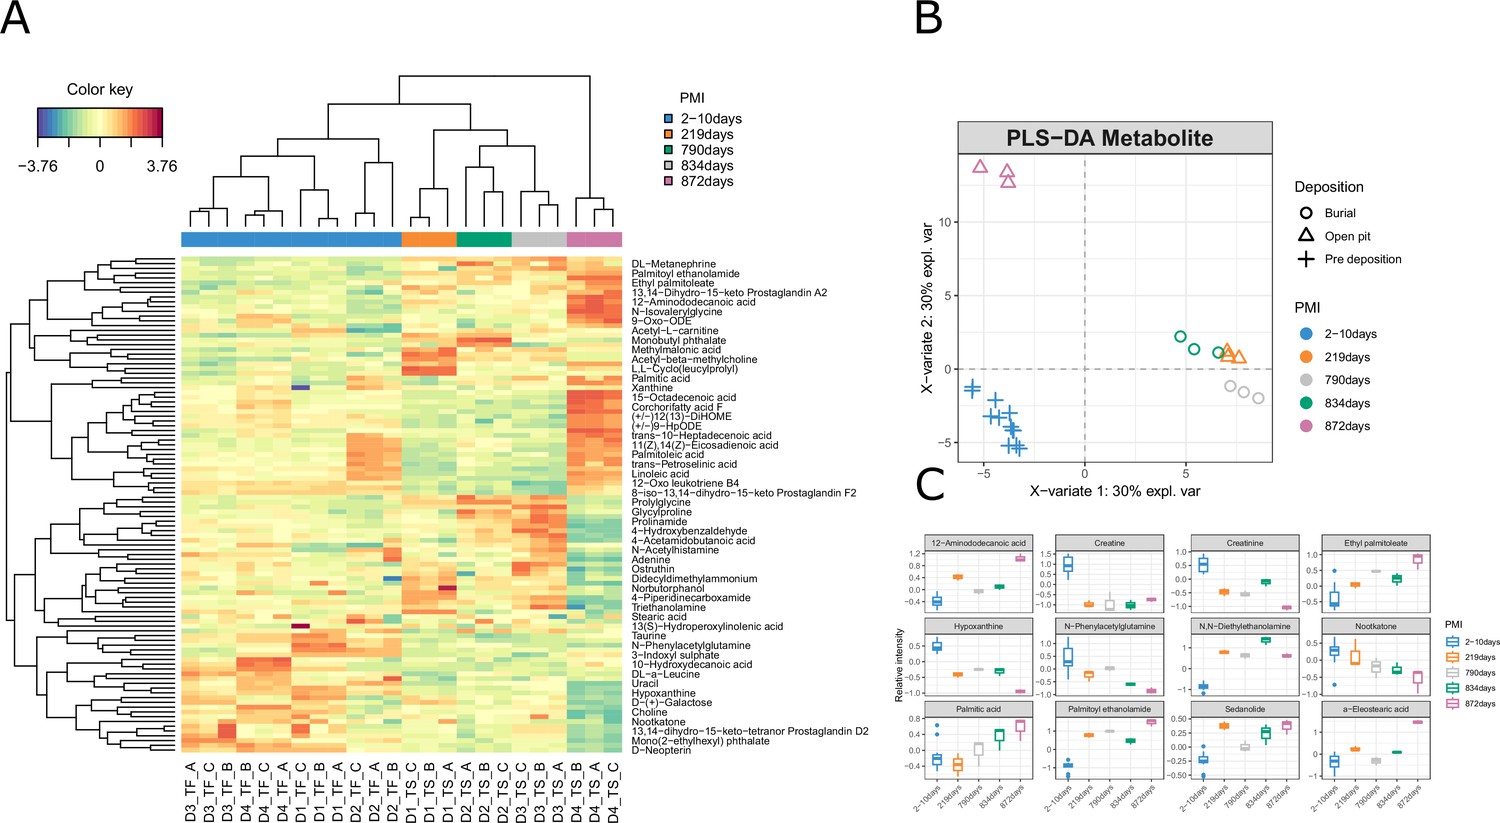
Results for the metabolomics data.
(A) Clustered image map (CIM), (B) sample plot, (C) and boxplot for the metabolomics data.
Figure 1—figure supplement 2
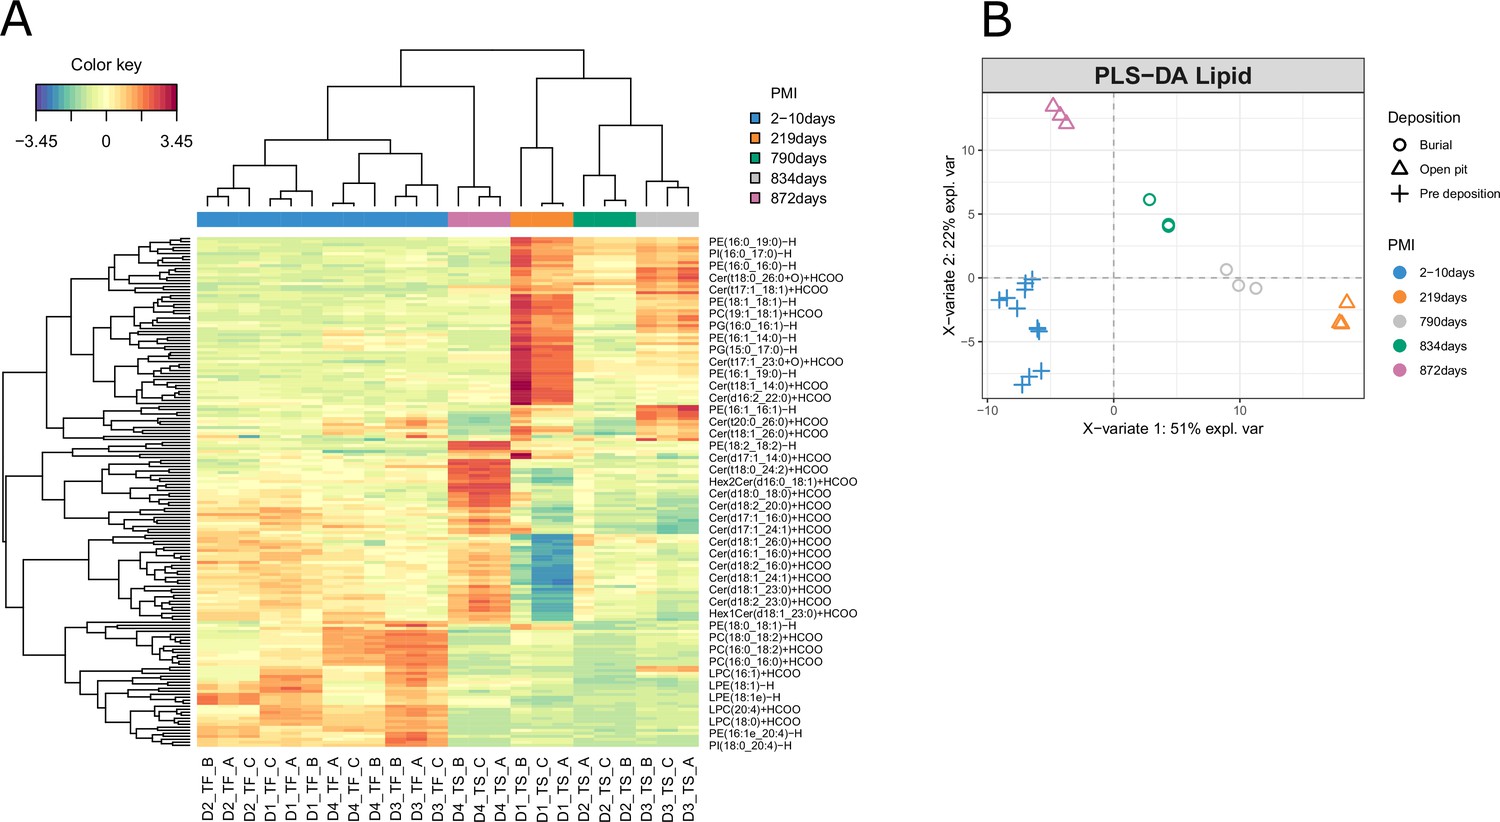
Results for the lipidomics data.
(A) Clustered image map (CIM) and (B) sample plot for the lipidomics data.
Figure 1—figure supplement 3
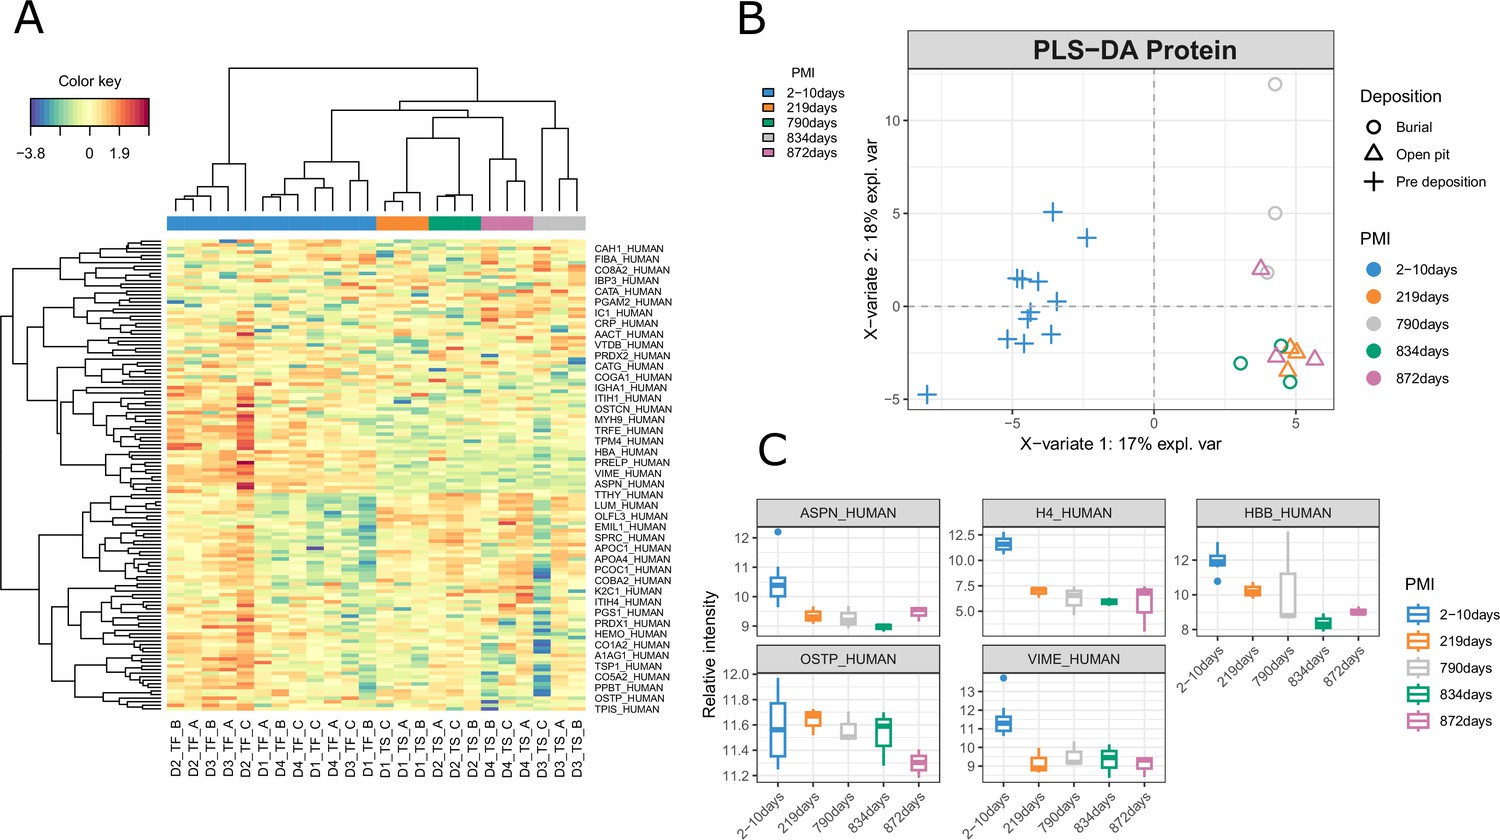
Results for the proteomics data.
(A) Clustered image map (CIM), (B) sample plot, (C) and boxplot for the proteomics data.
Figure 1—figure supplement 4
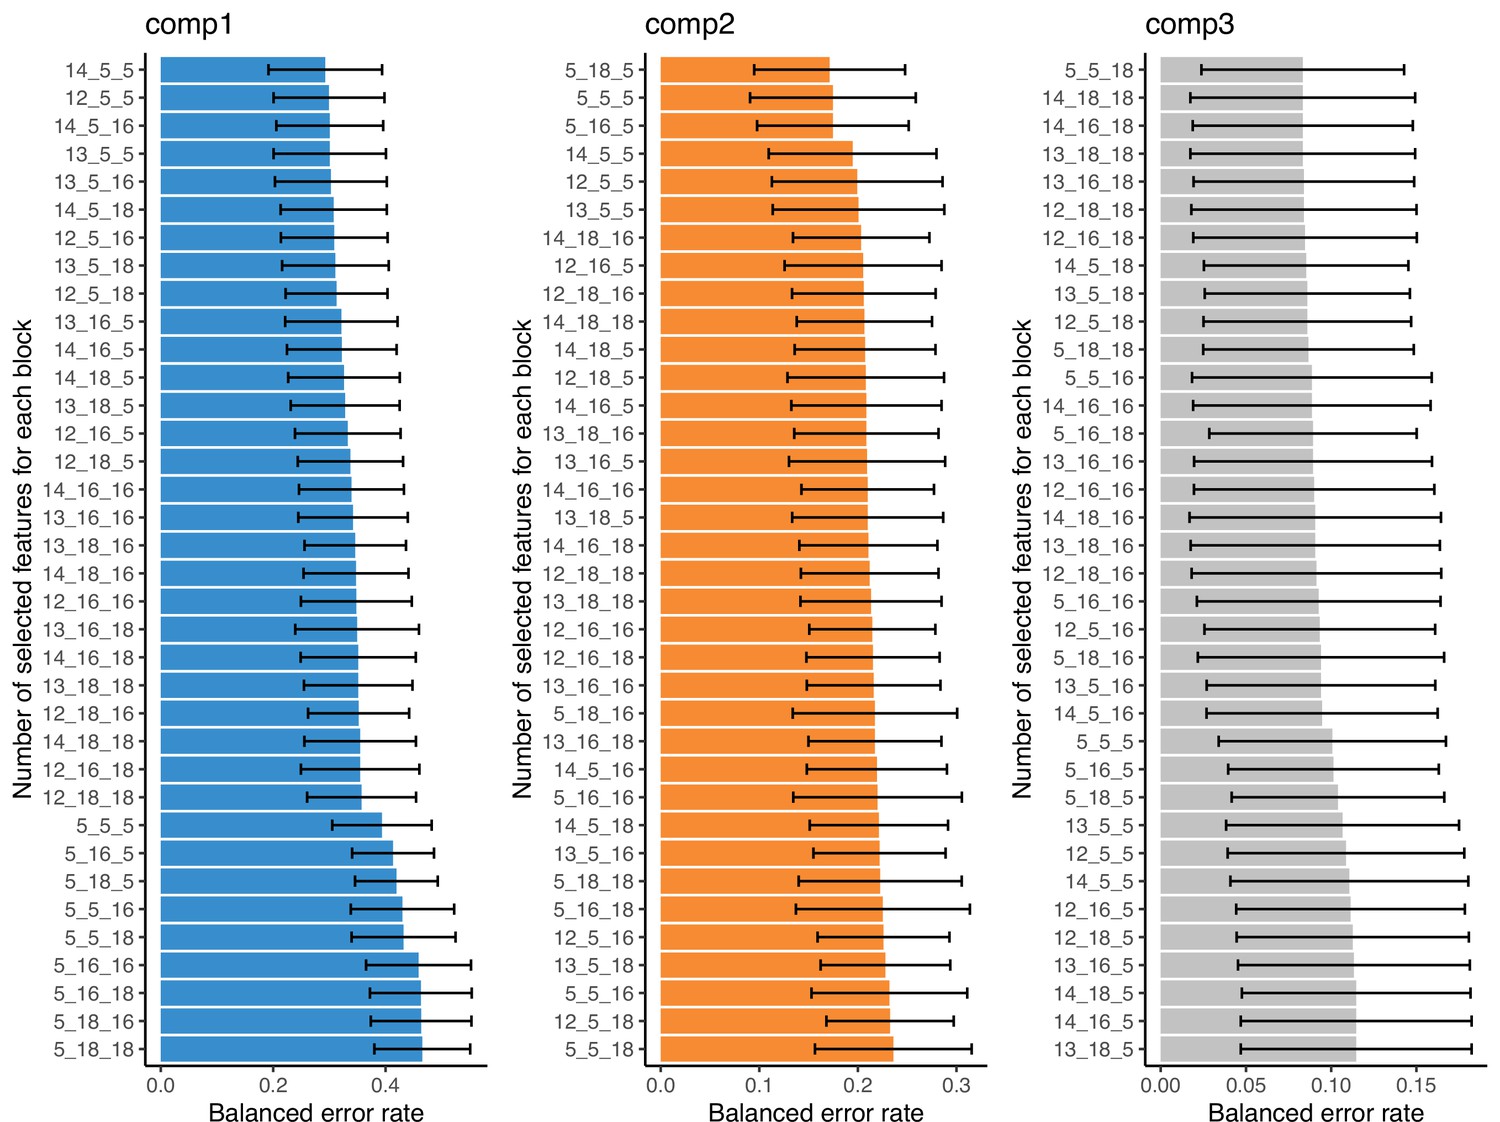
Balanced error variations across variable selection steps.
Figure 1—figure supplement 5
Score plots for partial least square discriminant analysis (PLS-DA) results of all the omics blocks considered.
Figure 2
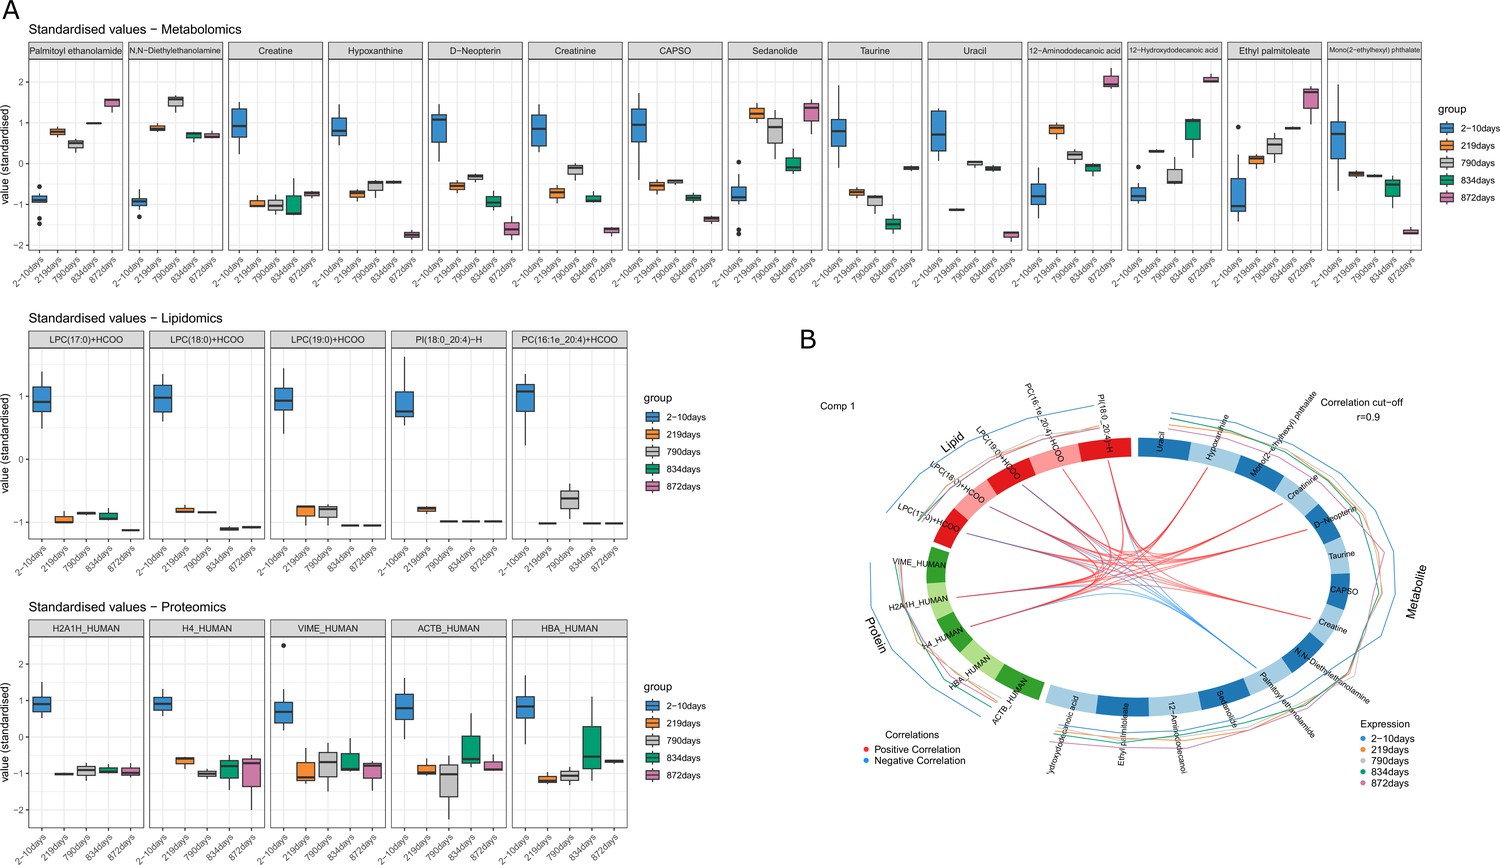
DIABLO selected variables correlated with PMI.
(A) Boxplots of the selected variables after tuning that shows variation with postmortem interval (PMI). Variables are expressed in standardized values. (B) Correlation between different omics blocks highlighting the correlations between different compounds obtained with the three omics selected in the final discriminant analysis model.
Figure 3
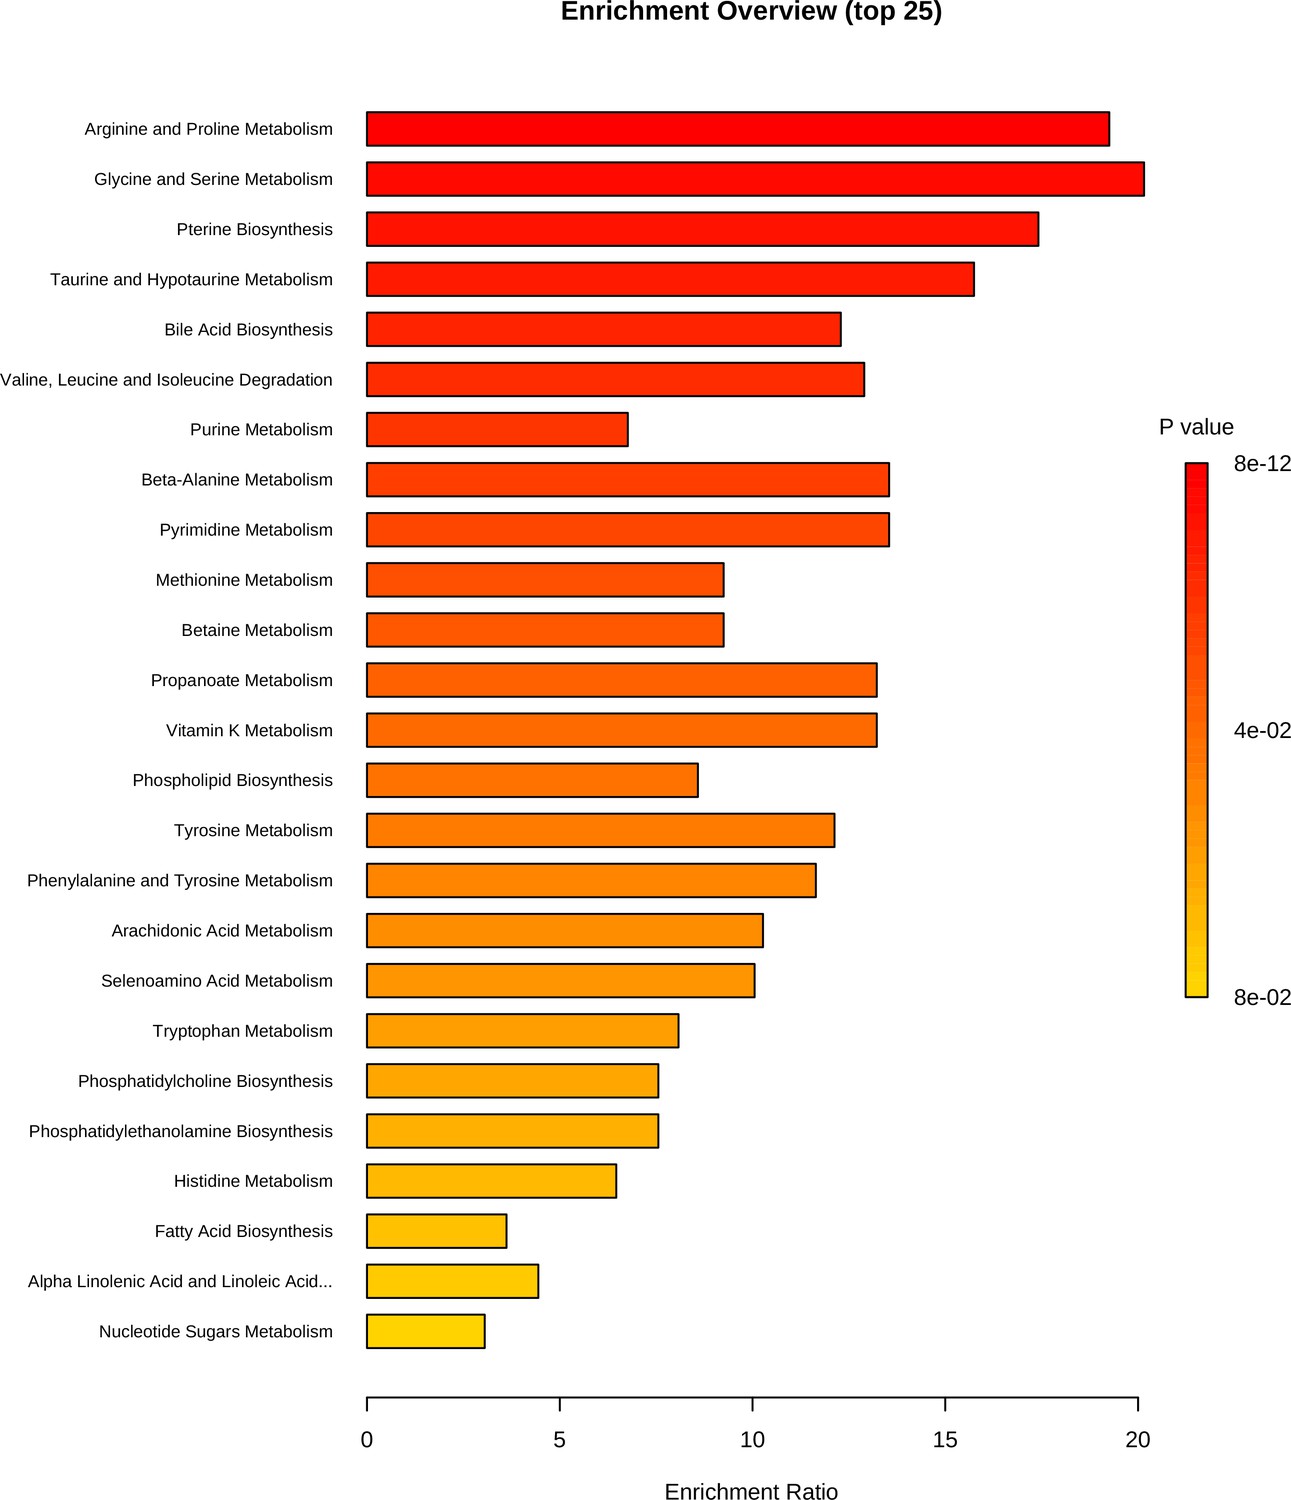
Metabolite set enrichment analysis based on differentially expressed metabolites identified in bone.
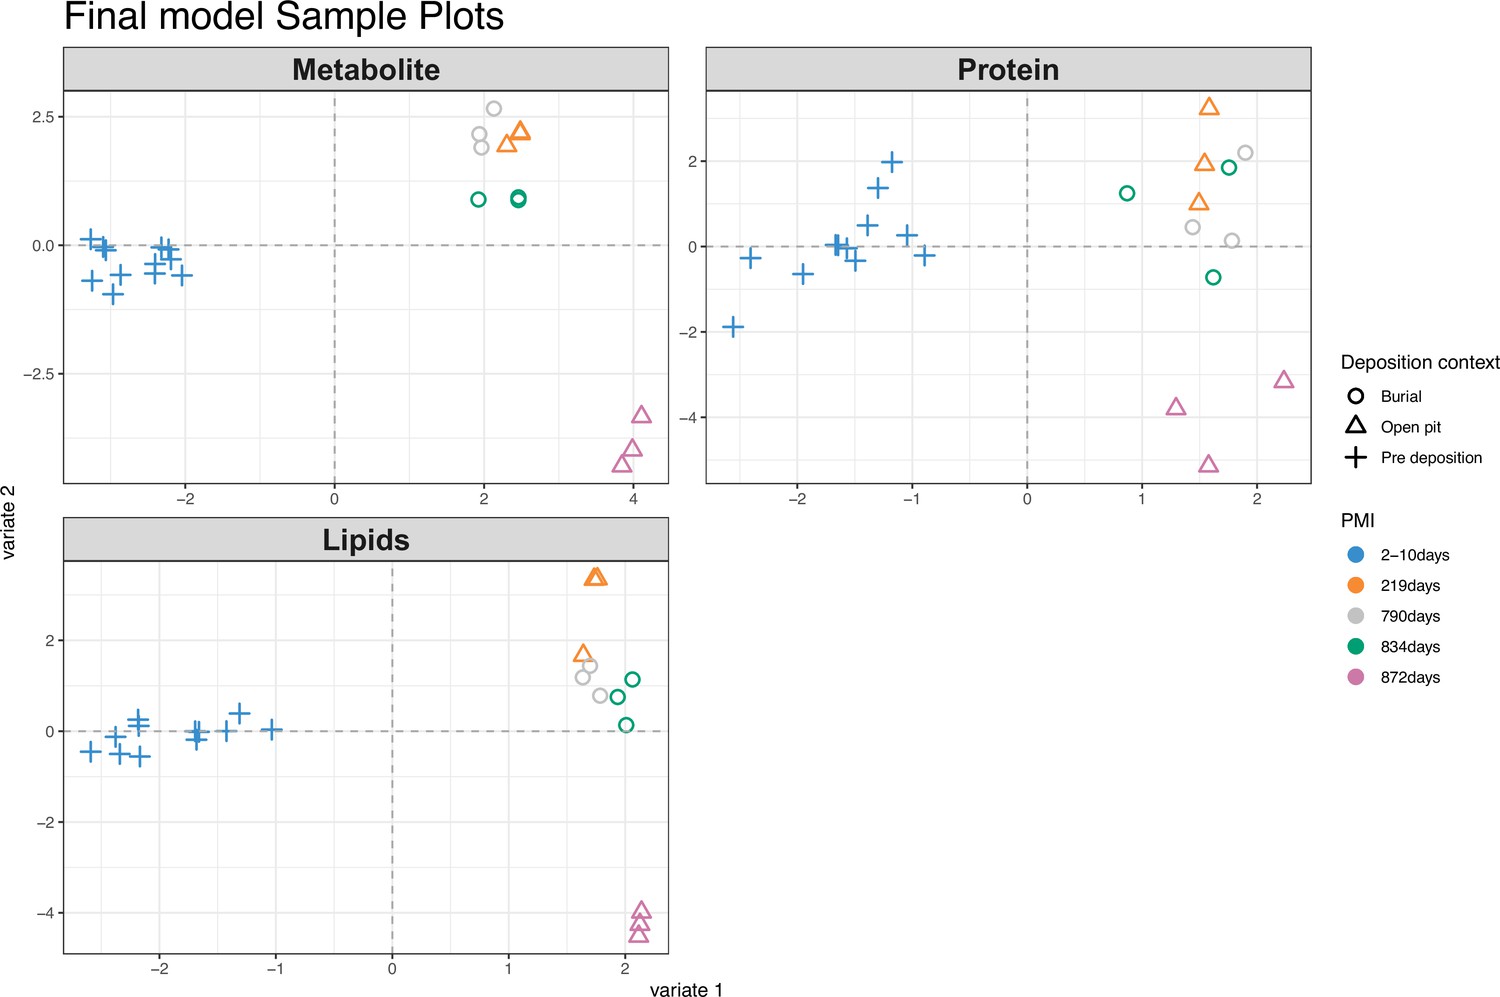
Figure 4 with 1 supplement
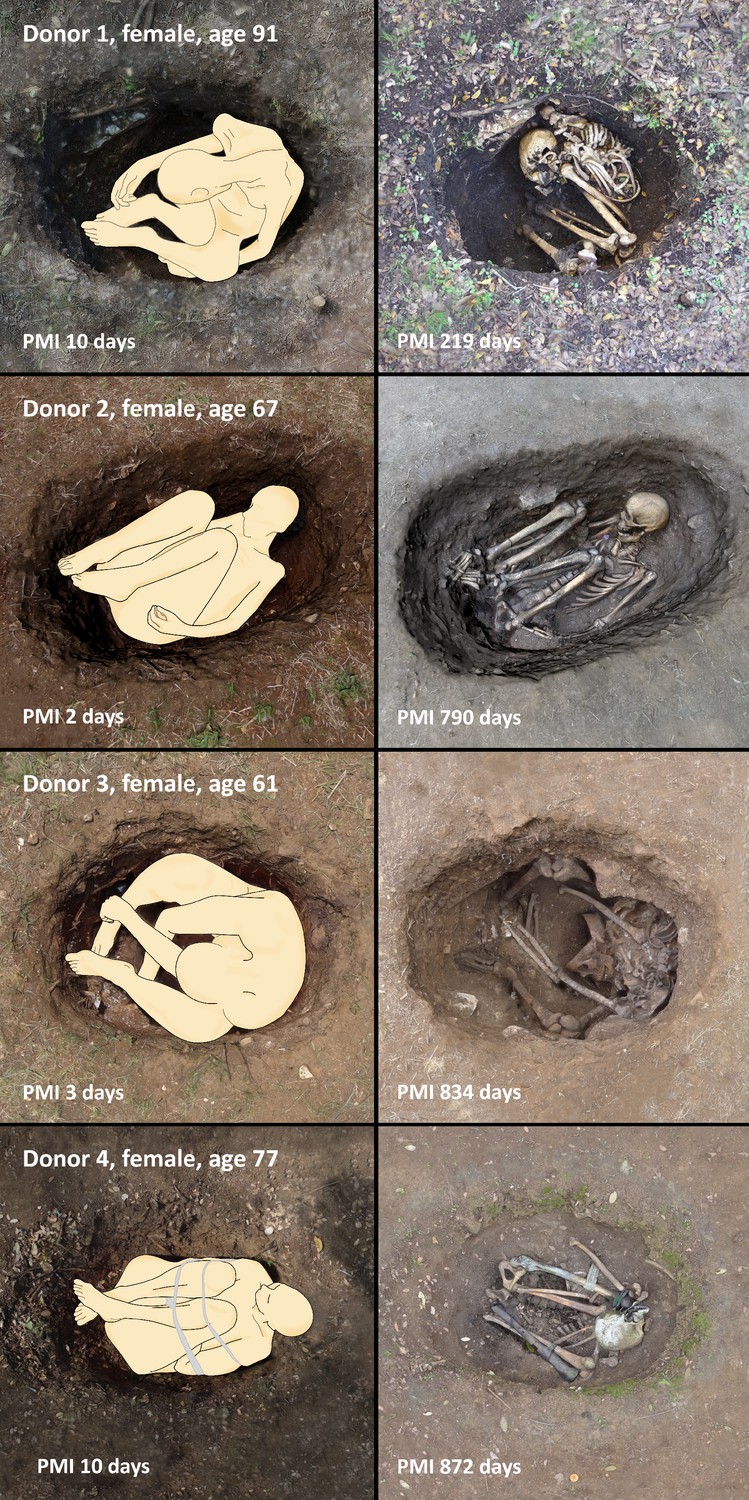
Positioning of the bodies in the single graves (left) pre-decomposition and (right) after complete skeletonization.
Figure 4—figure supplement 1
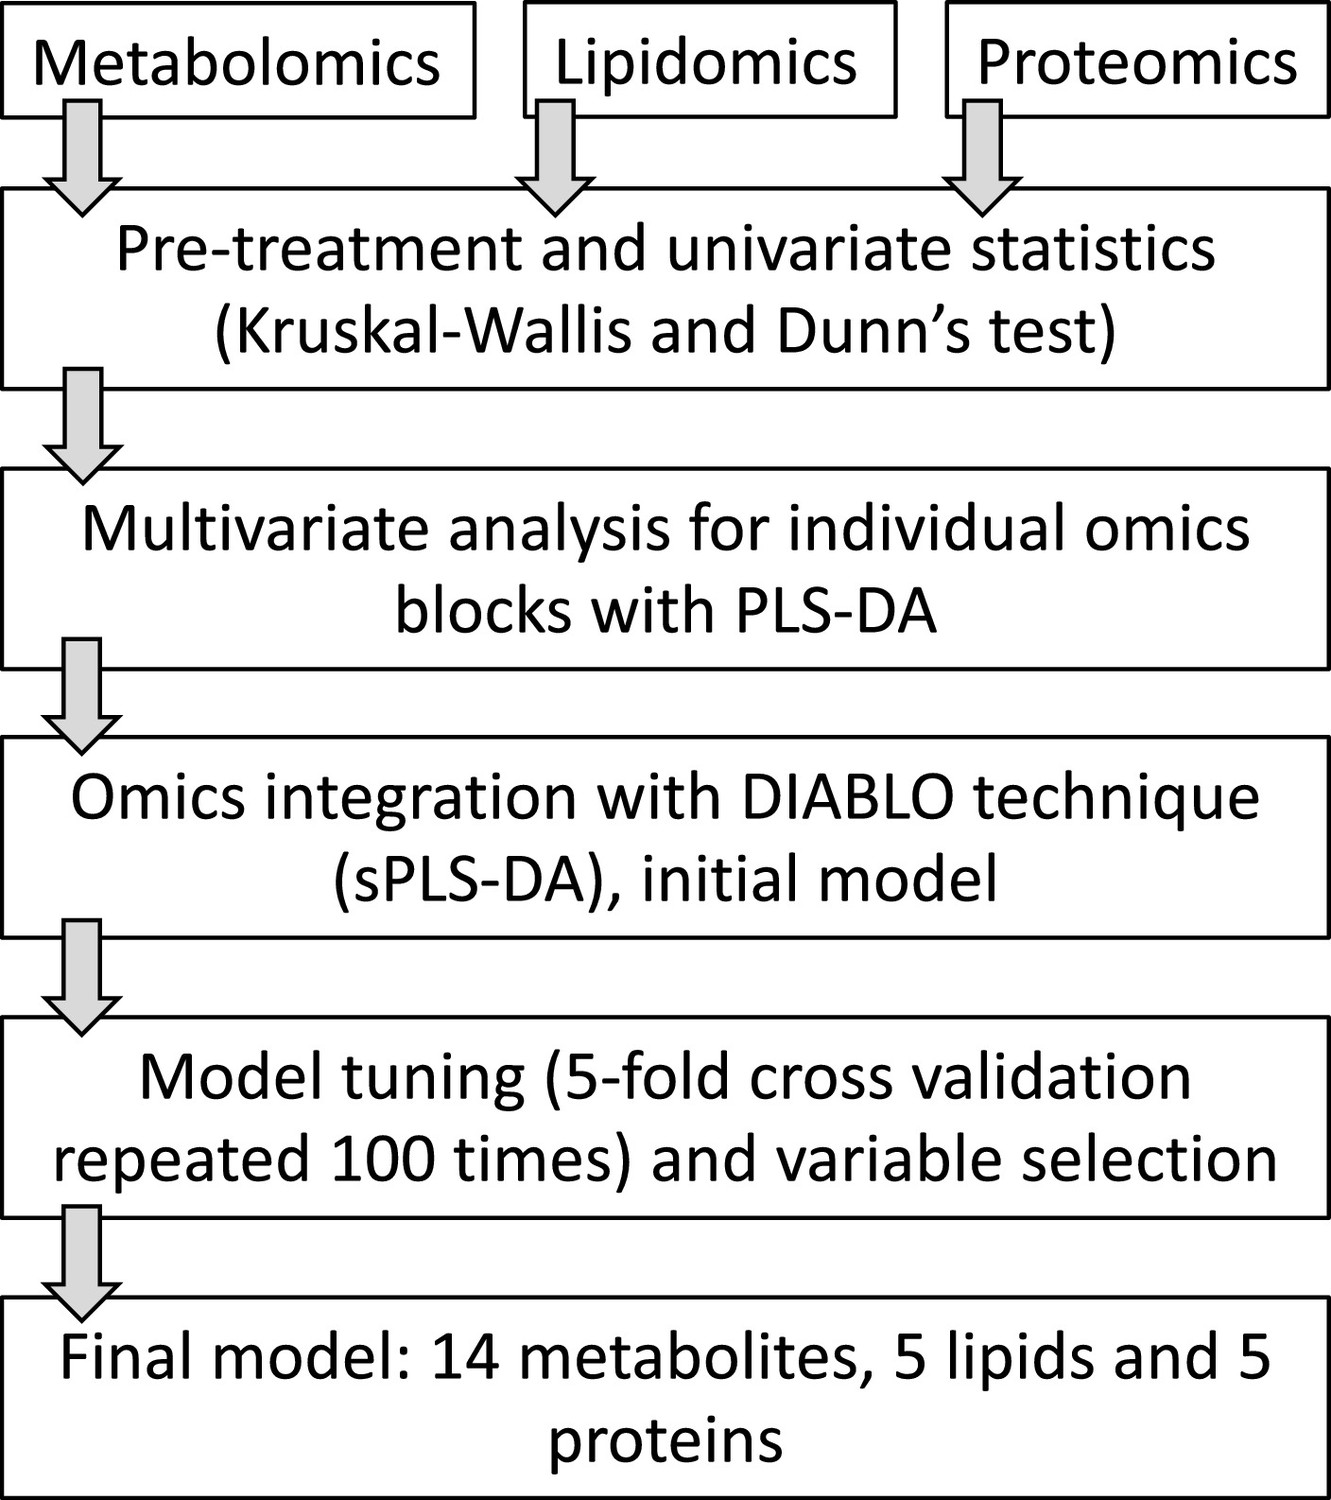
Flowchart of the experimental design of the study.
Tables
Table 1
Sample composition, demographics, deposition context, and postmortem interval (PMI).
The sample ID column reports the biological replicates used. Additional information on the body donors and observations made during collection of bone samples (e.g., medical treatments, bone colour, and density) can be found in the supplementary information in Mickleburgh et al., 2021.
| Sample ID | Sex | Age (years) | PMI | Deposition context | |
|---|---|---|---|---|---|
| Pre-deposition samples | |||||
| D1_TF_A | Female | 91 | 10 days | Open pit | |
| D1_TF_B | Female | 91 | 10 days | Open pit | |
| D1_TF_C | Female | 91 | 10 days | Open pit | |
| D2_TF_A | Female | 67 | 2 days | Burial | |
| D2_TF_B | Female | 67 | 2 days | Burial | |
| D2_TF_C | Female | 67 | 2 days | Burial | |
| D3_TF_A | Female | 61 | 3 days | Burial | |
| D3_TF_B | Female | 61 | 3 days | Burial | |
| D3_TF_C | Female | 61 | 3 days | Burial | |
| D4_TF_A | Female | 77 | 10 days | Open pit | |
| D4_TF_B | Female | 77 | 10 days | Open pit | |
| D4_TF_C | Female | 77 | 10 days | Open pit | |
| Post-deposition samples | |||||
| D1_TS_A | Female | 91 | 219 days | Open pit | |
| D1_TS_B | Female | 91 | 219 days | Open pit | |
| D1_TS_C | Female | 91 | 219 days | Open pit | |
| D2_TS_A | Female | 67 | 834 days | Burial | |
| D2_TS_B | Female | 67 | 834 days | Burial | |
| D2_TS_C | Female | 67 | 834 days | Burial | |
| D3_TS_A | Female | 61 | 790 days | Burial | |
| D3_TS_B | Female | 61 | 790 days | Burial | |
| D3_TS_C | Female | 61 | 790 days | Burial | |
| D4_TS_A | Female | 77 | 872 days | Open pit | |
| D4_TS_B | Female | 77 | 872 days | Open pit | |
| D4_TS_C | Female | 77 | 872 days | Open pit | |
Additional files
-
Supplementary file 1
Univariate analyses for all the individual omics.
- https://cdn.elifesciences.org/articles/83658/elife-83658-supp1-v2.xlsx
-
Supplementary file 2
Environmental data.
- https://cdn.elifesciences.org/articles/83658/elife-83658-supp2-v2.xlsx
-
MDAR checklist
- https://cdn.elifesciences.org/articles/83658/elife-83658-mdarchecklist1-v2.docx
-
Source code 1
R pipeline employed in the study.
- https://cdn.elifesciences.org/articles/83658/elife-83658-code1-v2.zip
Download links
A two-part list of links to download the article, or parts of the article, in various formats.
Downloads (link to download the article as PDF)
Open citations (links to open the citations from this article in various online reference manager services)
Cite this article (links to download the citations from this article in formats compatible with various reference manager tools)
The ‘ForensOMICS’ approach for postmortem interval estimation from human bone by integrating metabolomics, lipidomics, and proteomics
eLife 11:e83658.
https://doi.org/10.7554/eLife.83658


