Population dynamics of immunological synapse formation induced by bispecific T cell engagers predict clinical pharmacodynamics and treatment resistance
- Division of Pharmacotherapy and Experimental Therapeutics, School of Pharmacy, University of North Carolina at Chapel Hill, United States
- Department of Biochemistry and Biophysics, University of North Carolina at Chapel Hill, United States
- Lineberger Comprehensive Cancer Center, School of Medicine, University of North Carolina at Chapel Hill, United States
Figures
Figure 1 with 2 supplements
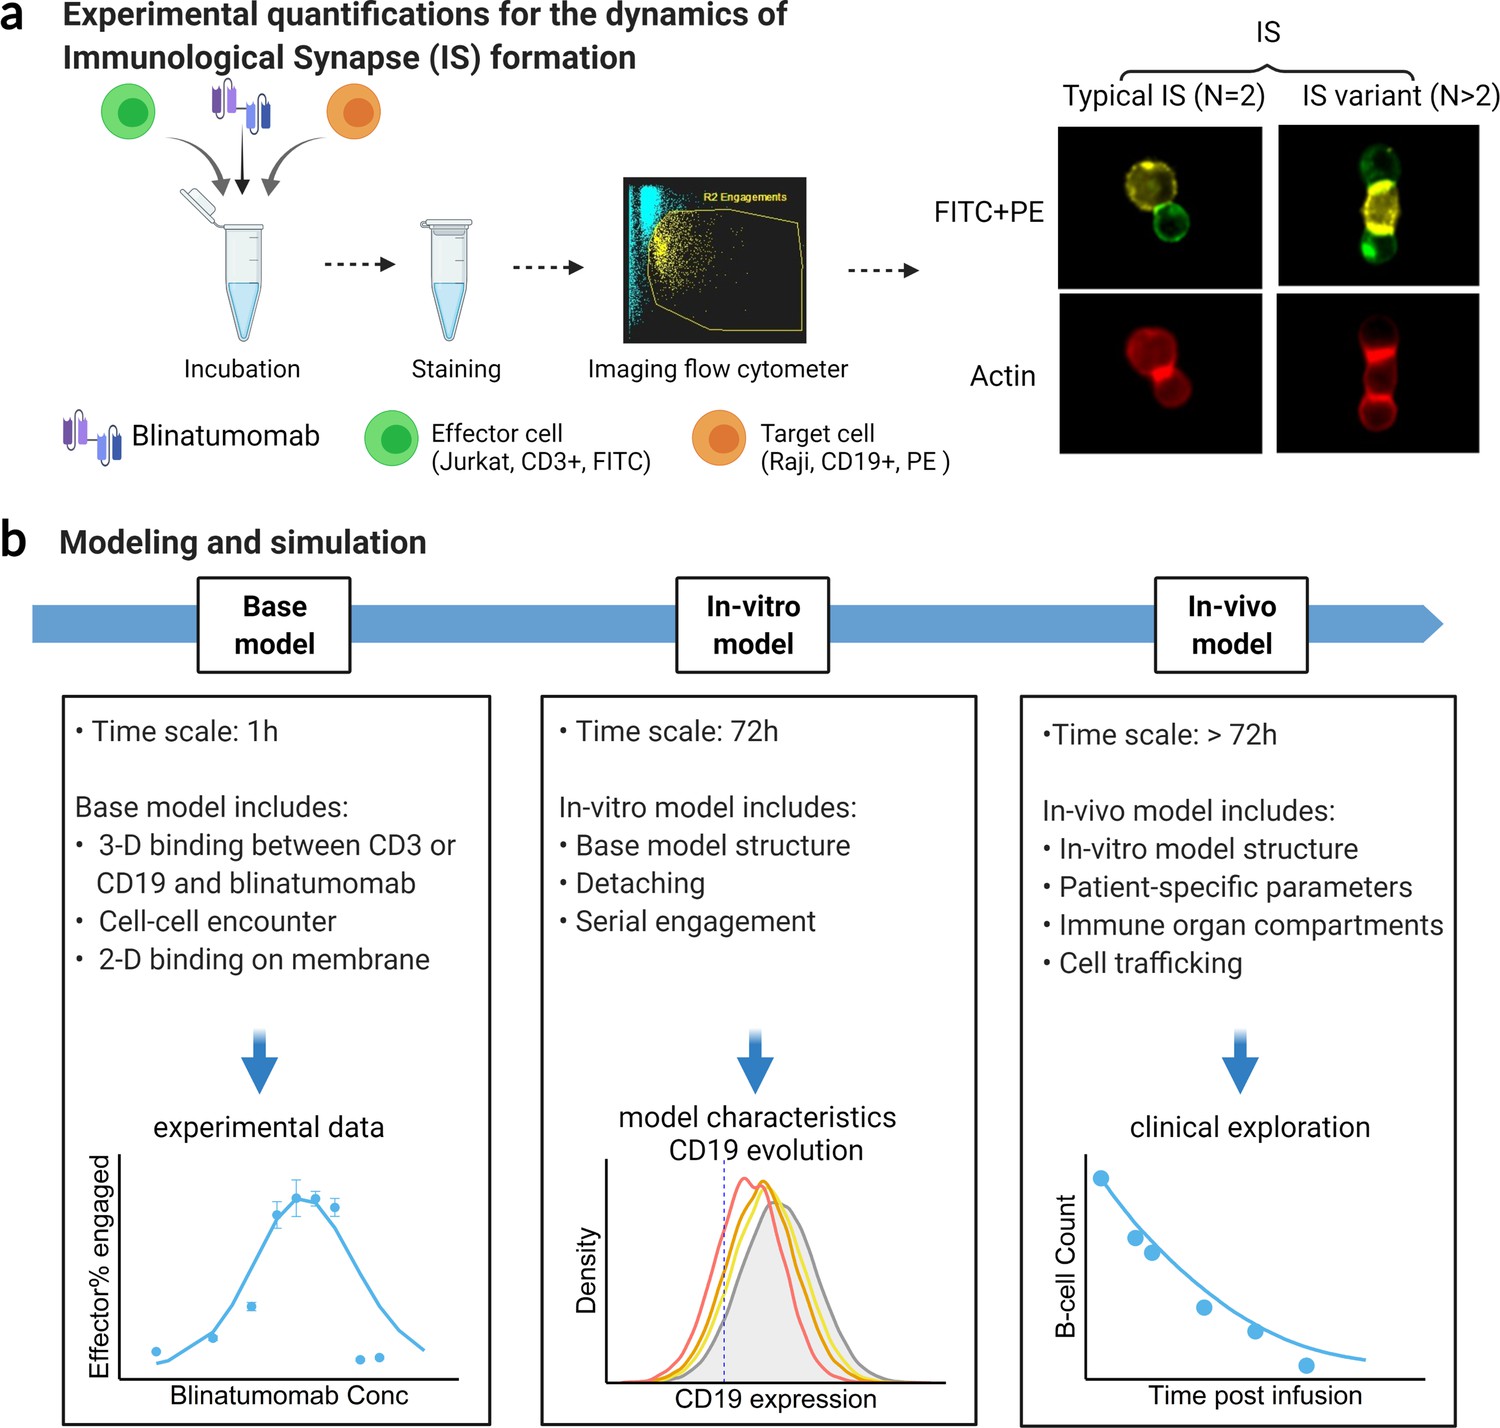
Schematic of experimental design and theoretical models.
The study examined the formation dynamics of immunological synapses (IS) elicited by a bispecific T cell engager (BiTE). (a) The abundance and dynamics of IS formation were quantified by imaging flow cytometry under various experimental conditions. (b) Three mechanistic agent-based models were developed for the comprehensive characterization of cell-cell engagement and tumor-killing effects on different spatiotemporal scales. 3-D, three-dimensional; 2-D, two-dimensional.
Figure 1—figure supplement 1
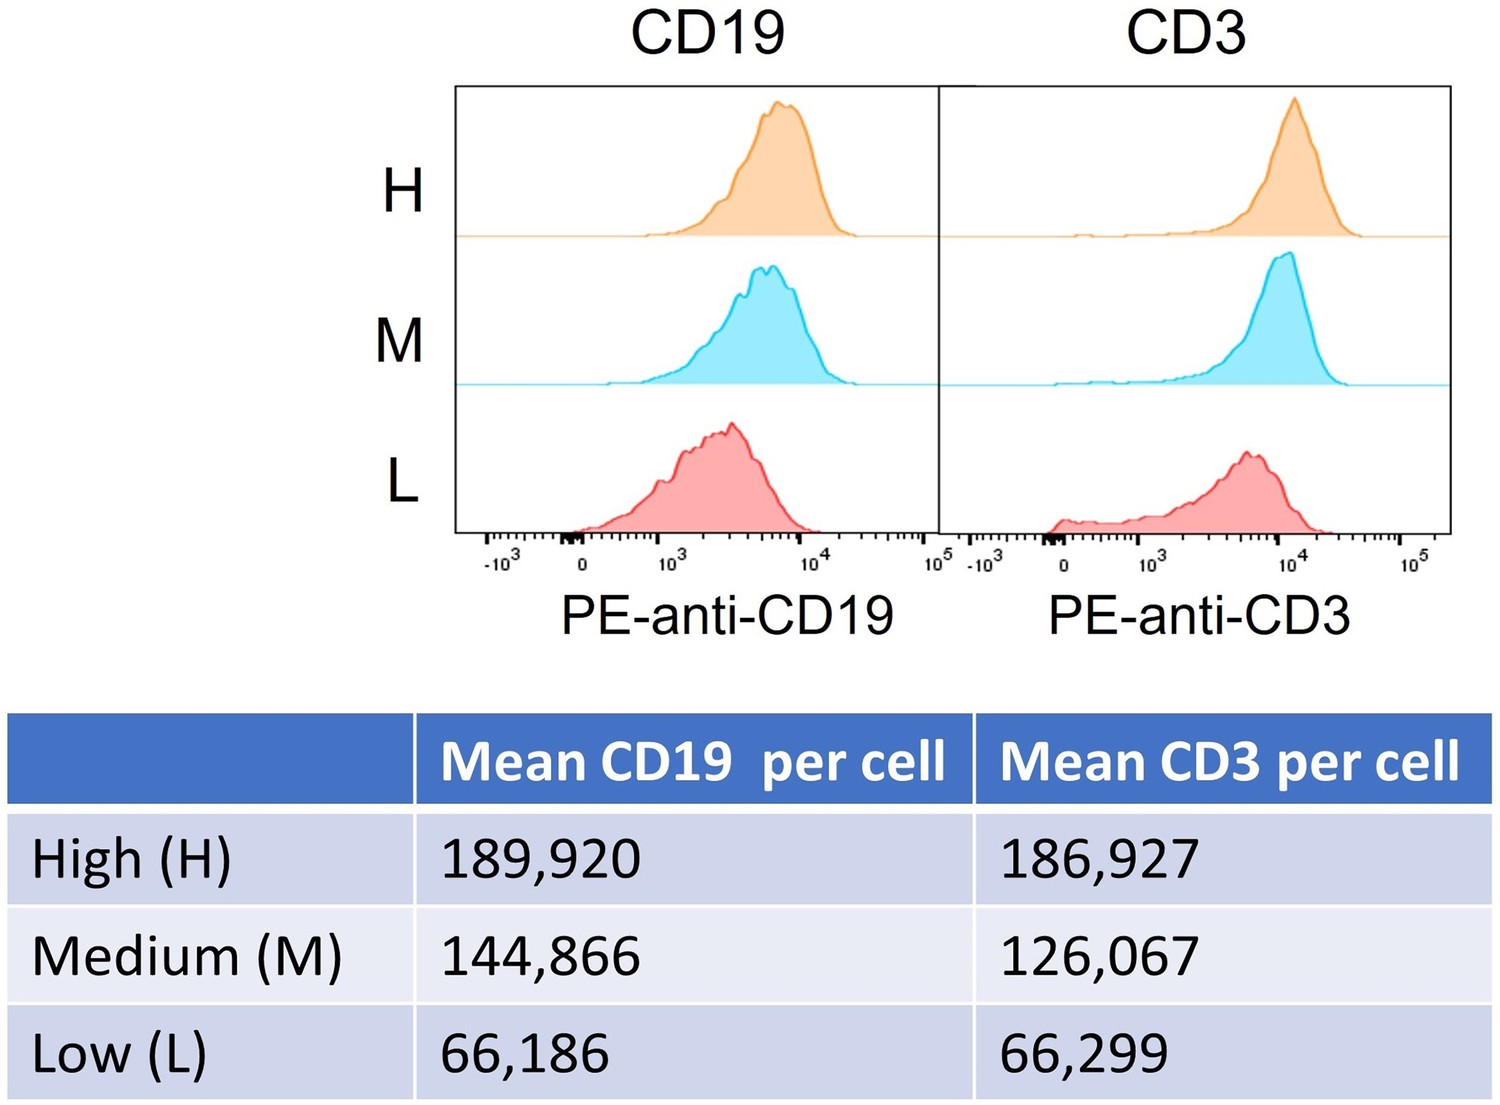
Histogram and quantification of high (H), medium (M), and low (L) antigen expression (CD19 and CD3) in cell subpopulations.
Figure 1—figure supplement 2
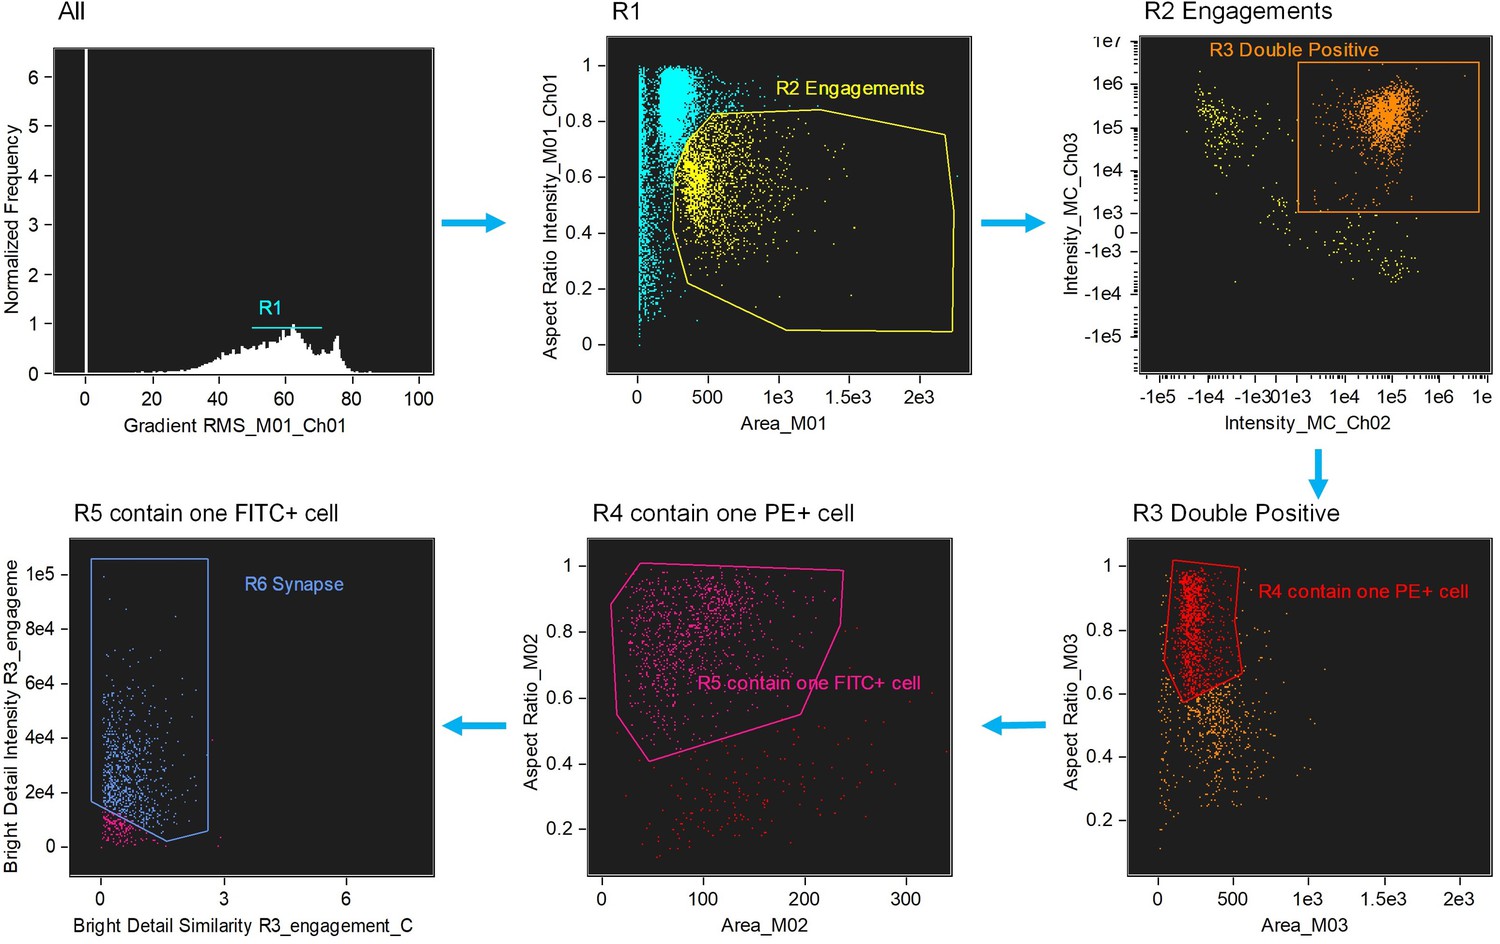
Image-based algorithms and gating strategy to identify typical immunological synapse (IS).
Step 1, gate cells in best focus (R1). Step 2, gate conjugates (R2). Single cells (intermediate area value and high aspect ratio) are excluded. Step 3, gate CD3 and CD19 double positive (R3, FITC+PE+). Step 4, gate conjugates with only one target cell (R4). Step 5, gate conjugates with only one effector cell (R5). This subpopulation consists of doublets with only one effector and one target cell. Step 6, gate immunological synapse (R6). 'Valley’ mask is employed to quantify actin intensity in the region of contact (Bright detail intensity). Co-localization wizard is used to measuring overlap (Bright detail similarity). For technical details, please see the user’s manual of IDEAS.
Figure 2
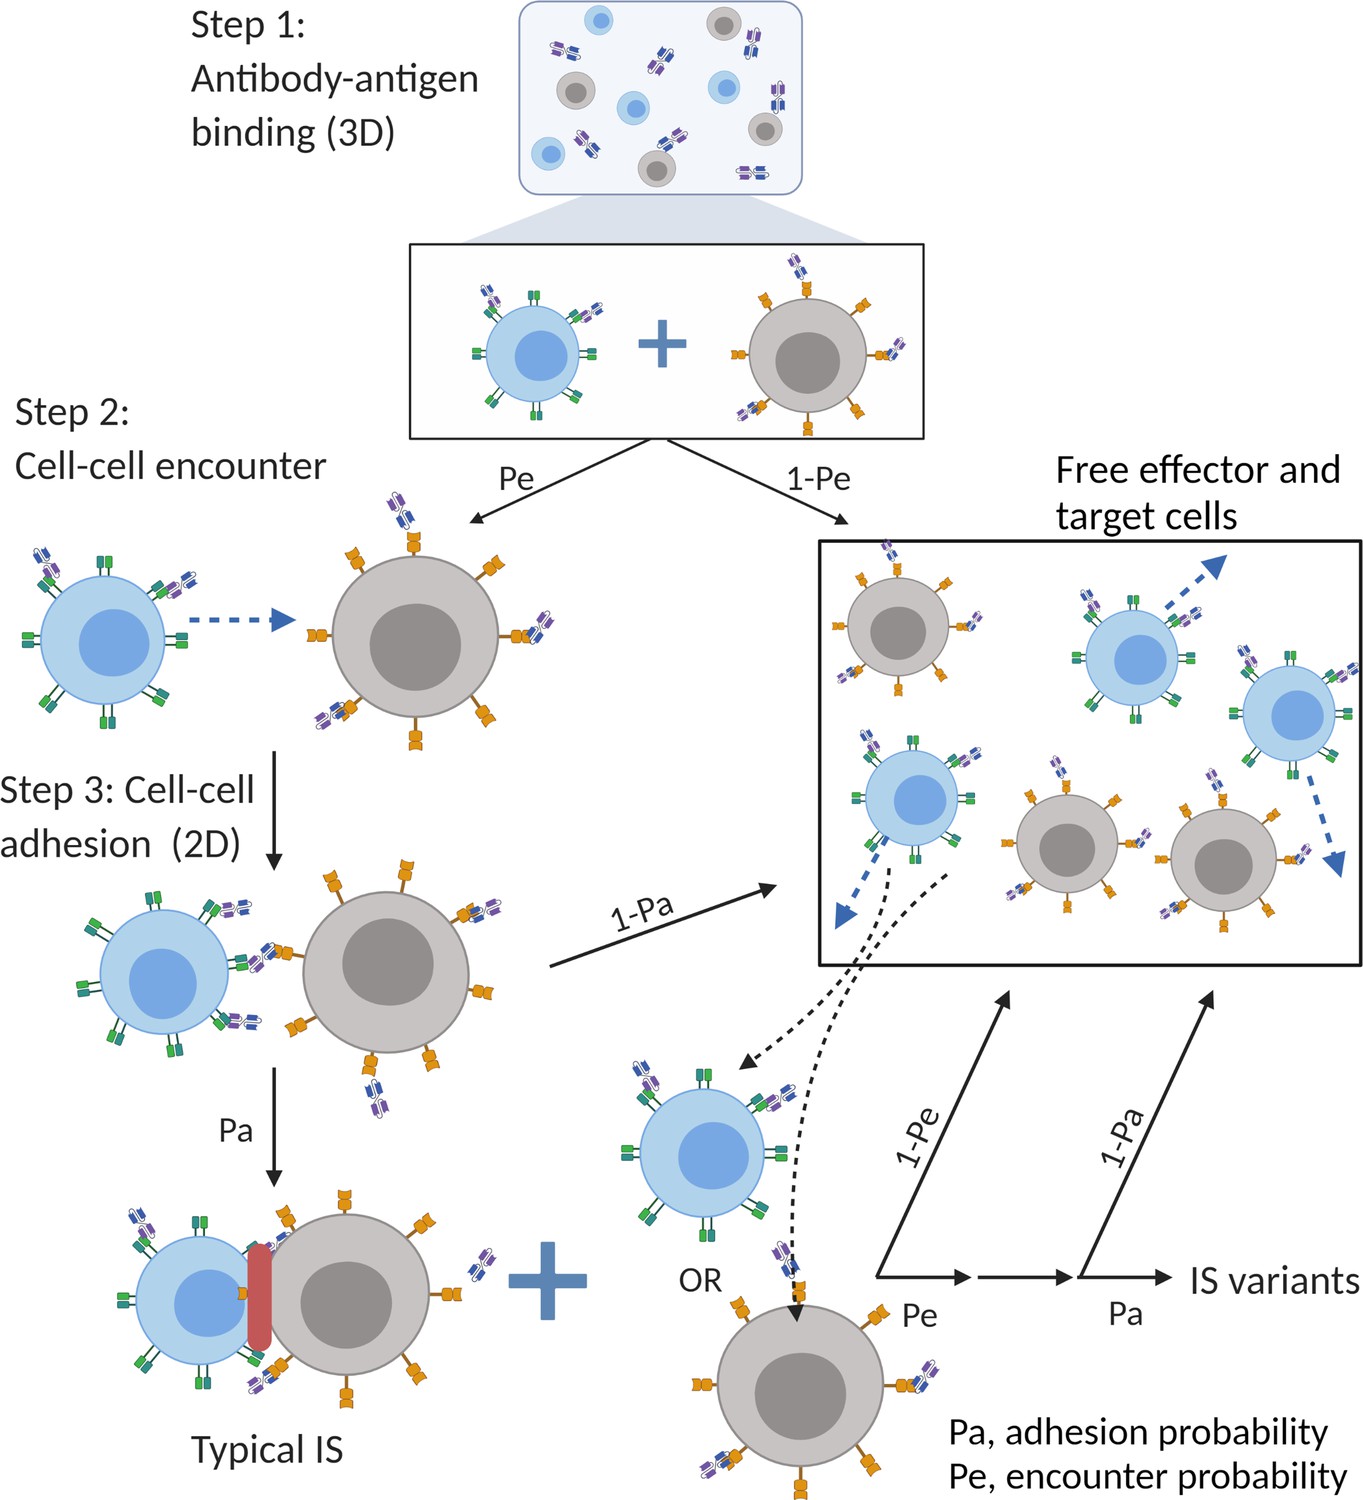
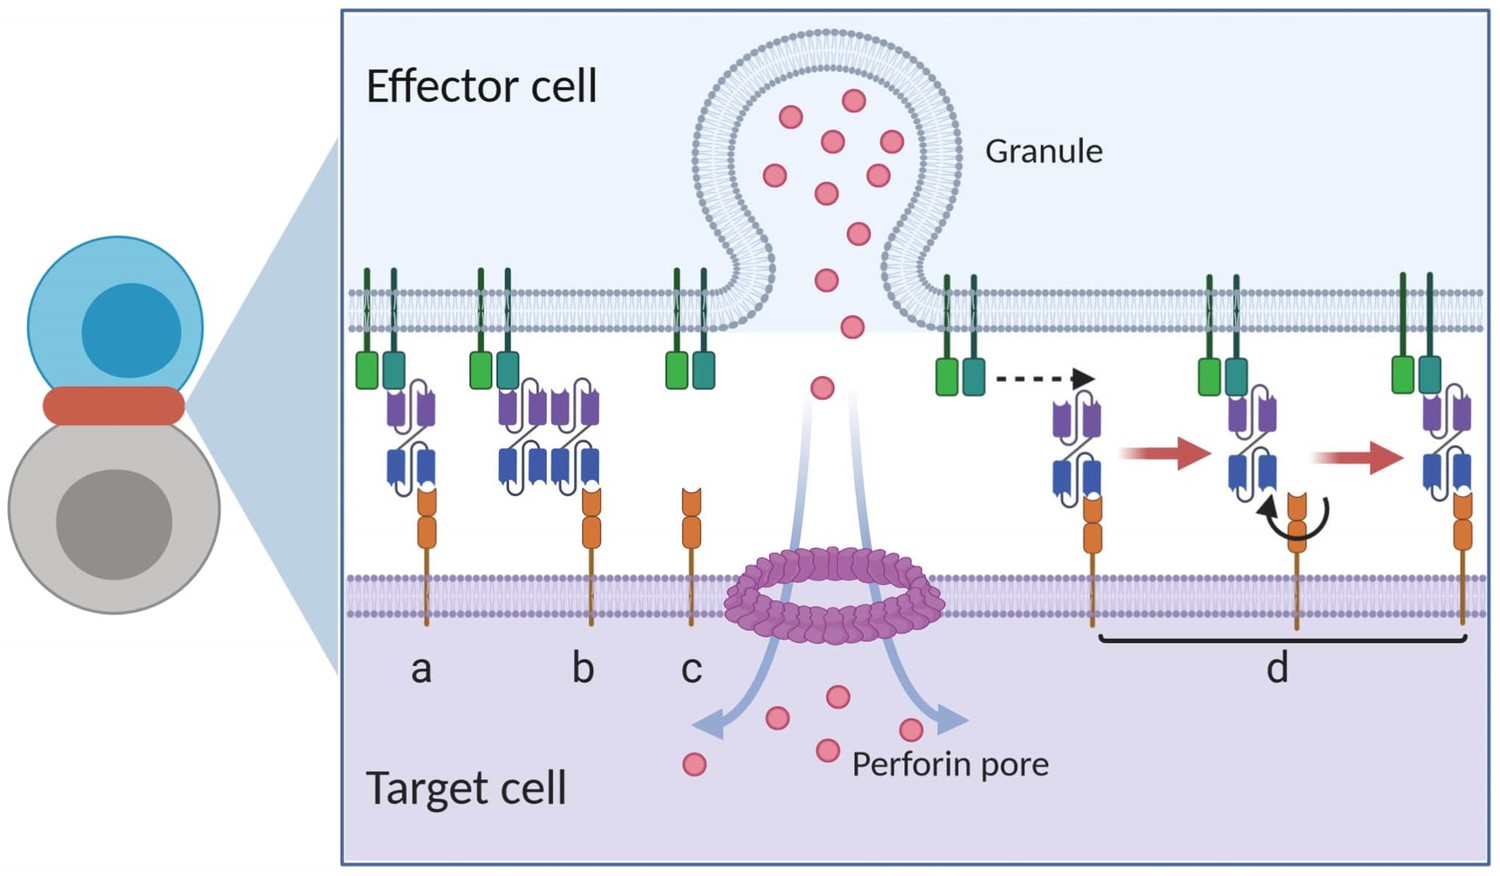
The base model included three essential steps to describe the process of immunological synapses (IS) formation induced by bispecific T cell engagers (BiTEs).
Step 1: three-dimensional (3D) antibody-antigen binding in the media to form a binary complex; Step 2: cell-cell encounter, with encounter probability (Pe) dictated by cell motility and density; Step 3: cell-cell adhesion and IS formation, with adhesion probability (Pa) driven by the density of ternary complexes formed on the cell-cell contact area (two-dimensional (2D) binding) during contact. Newly formed typical IS had a chance to engage additional free effector or target cells to form an IS variant.
Figure 3 with 2 supplements
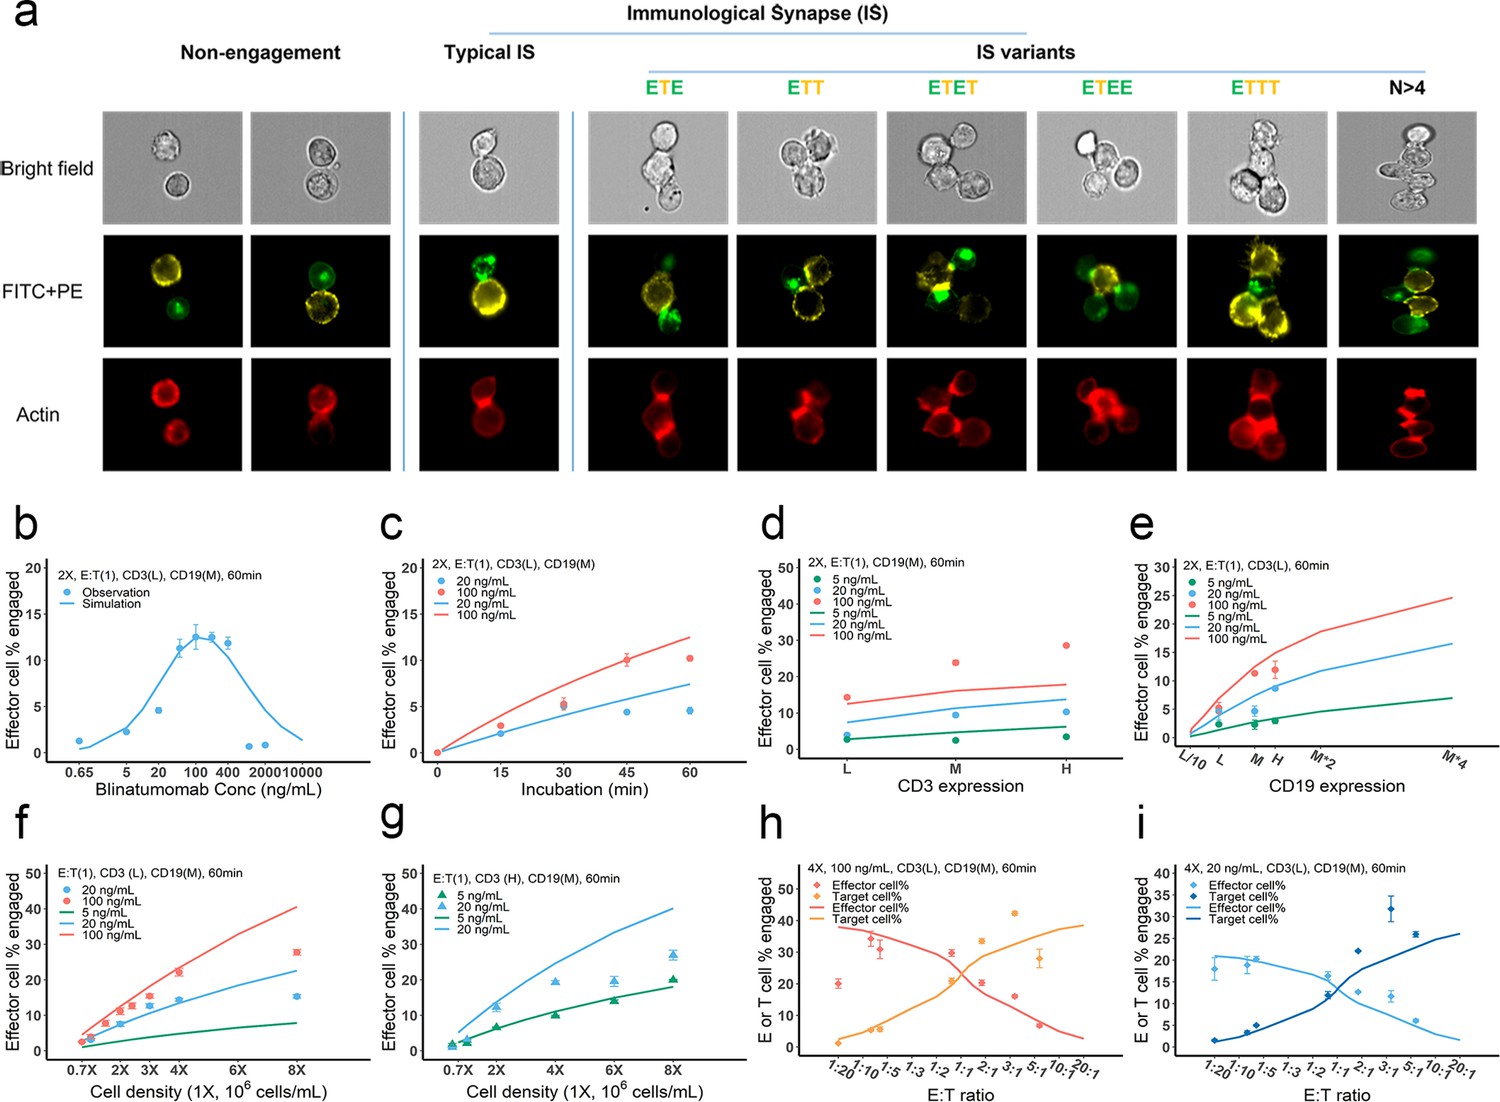
Dynamics of immunological synapse (IS) formation induced by bispecific T cell engager (BiTE) under different conditions.
(a) Representative image of non-engagement (futile encounter), typical IS, and other IS variants. Green (FITC), effector cells (E); Yellow (PE), target cells (T). (b–i), The effects of drug concentration (b), incubation duration (c), antigen density (d, e), cell density (f, g), and E:T ratio (h, i) on IS formation. The base model was applied to simulate IS formation under different conditions. Observations are dots (with SE) and model simulations are solid curves. 2 X, 2 × 10⁶ total cells/mL; E:T(1), E:T ratio = 1; CD3(L), CD3 expression (Low); CD3(H), CD3 expression (High); CD19(M), CD19 expression (medium); 5, 20, 100 ng/mL, blinatumomab concentration; 60 min, incubation duration. All samples were biologically triplicates.
Figure 3—figure supplement 1
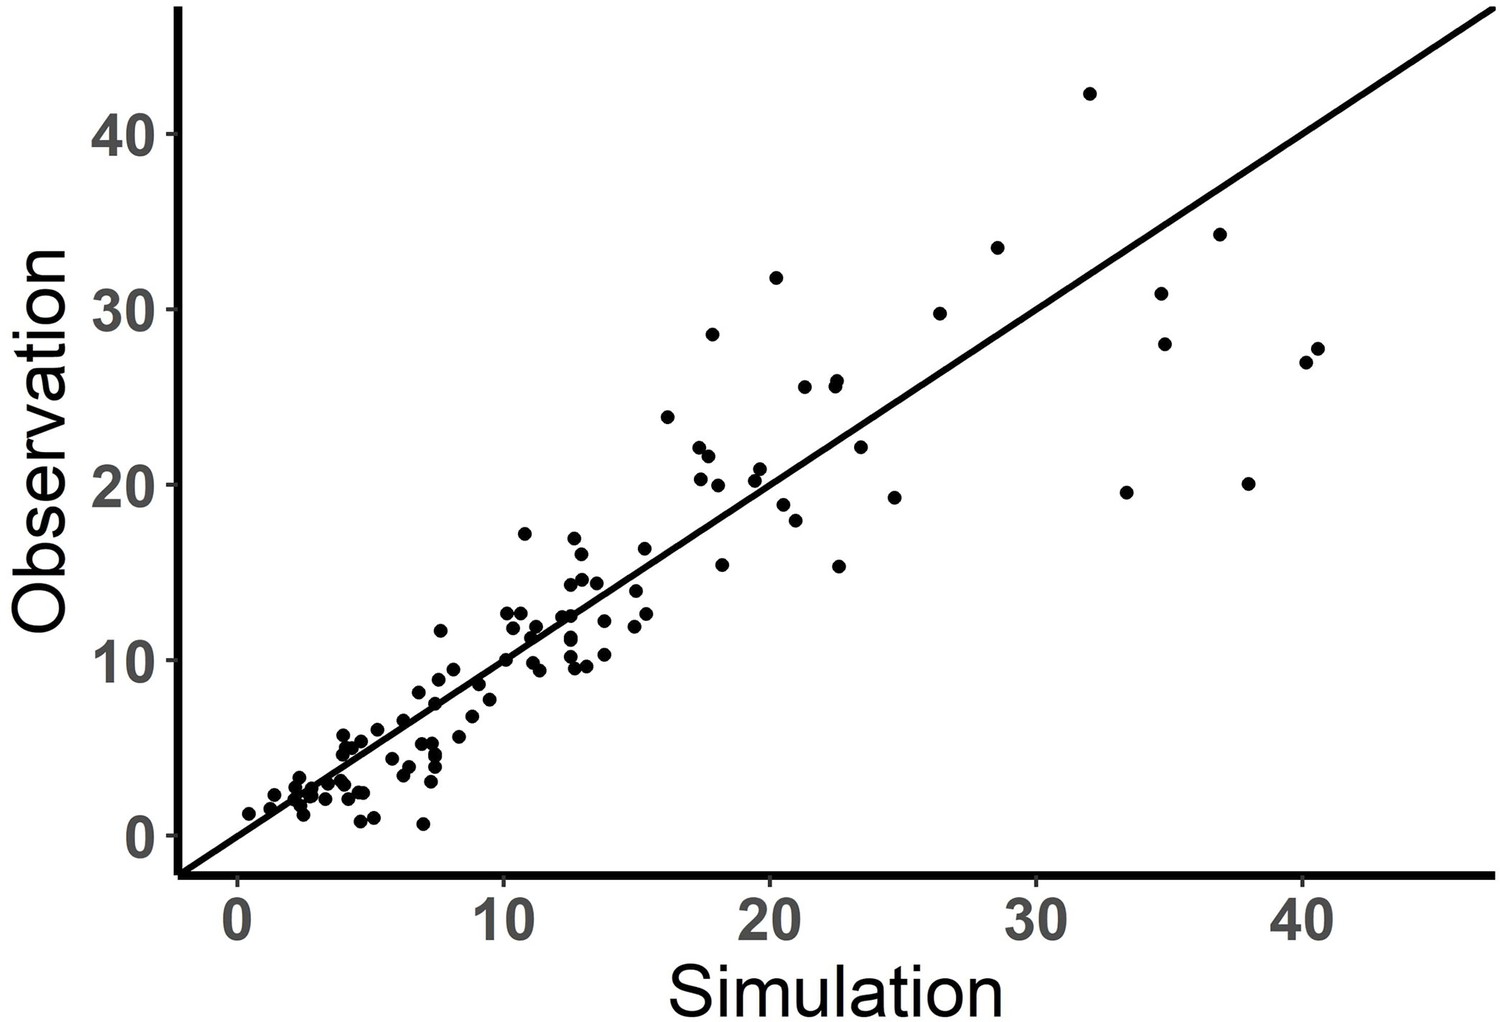
Performance of the base model (observation vs simulation).
Observed and model predicted fraction (%) of effector cells engaged in immunological synapse (IS). solid line, y=x.
Figure 3—figure supplement 2
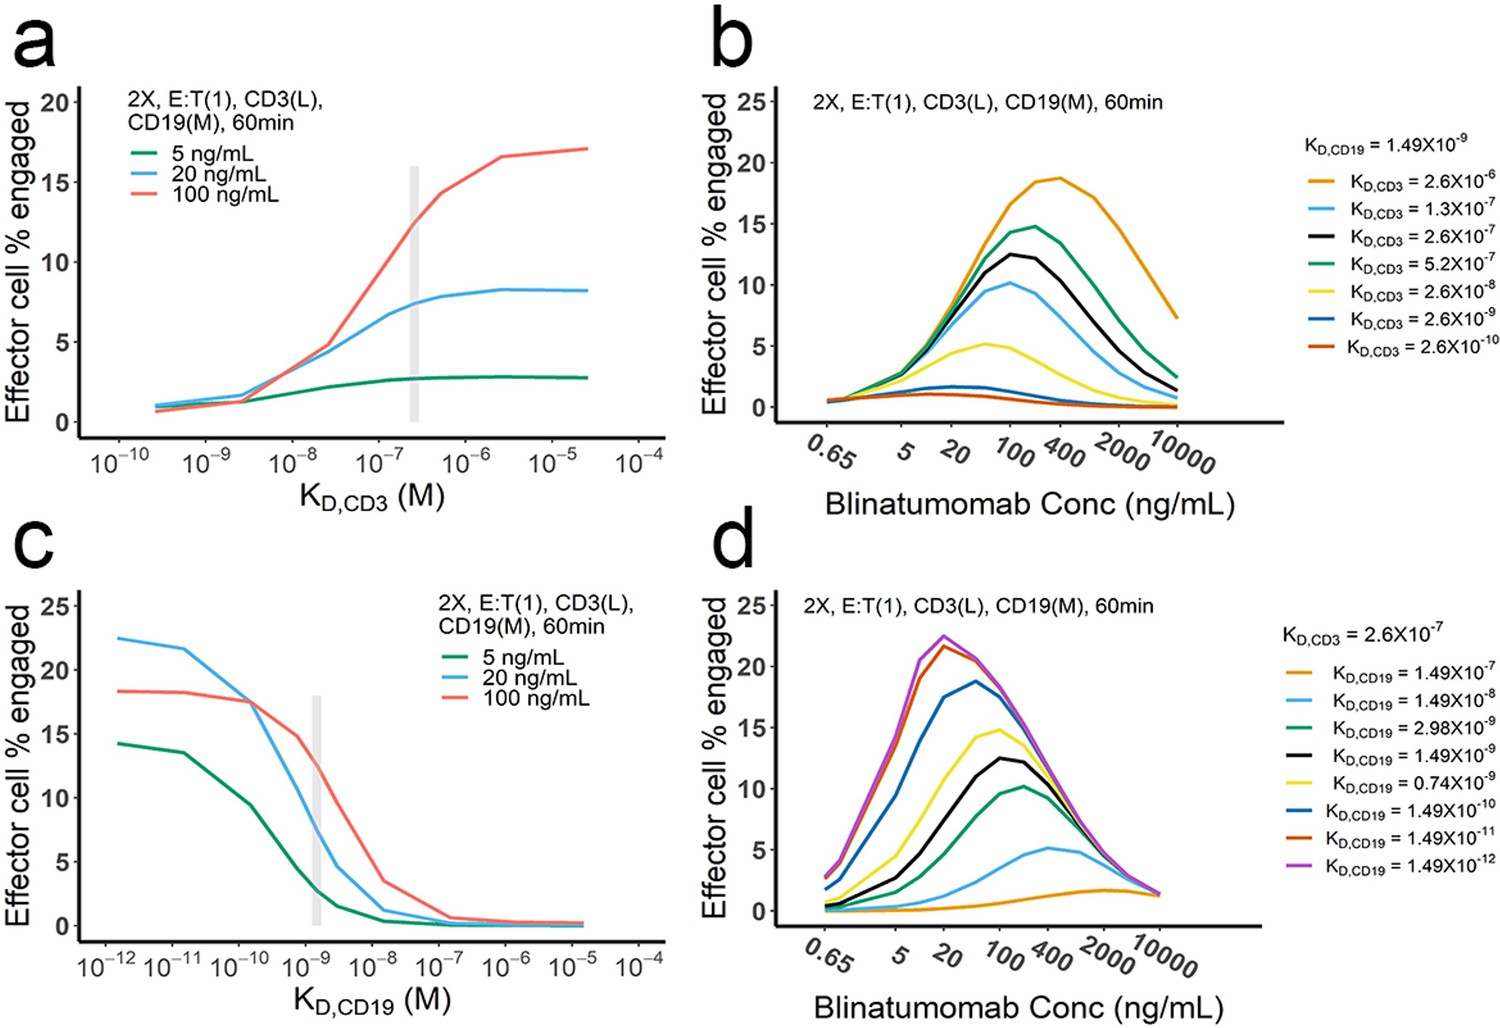
The effect of binding affinity on bispecific T cell engager (BiTE)-mediated cell-cell engagement.
The base model was applied to perform simulations. KD, dissociation constant; gray vertical line, the KD value of blinatumomab;. 2 X, 2 × 10⁶ total cells/mL; E:T(1), E:T ratio = 1; CD3(L), CD3 expression (Low); CD19(M), CD19 expression (medium); 5, 20, 100 ng/mL, blinatumomab concentration; 60 min, incubation duration.
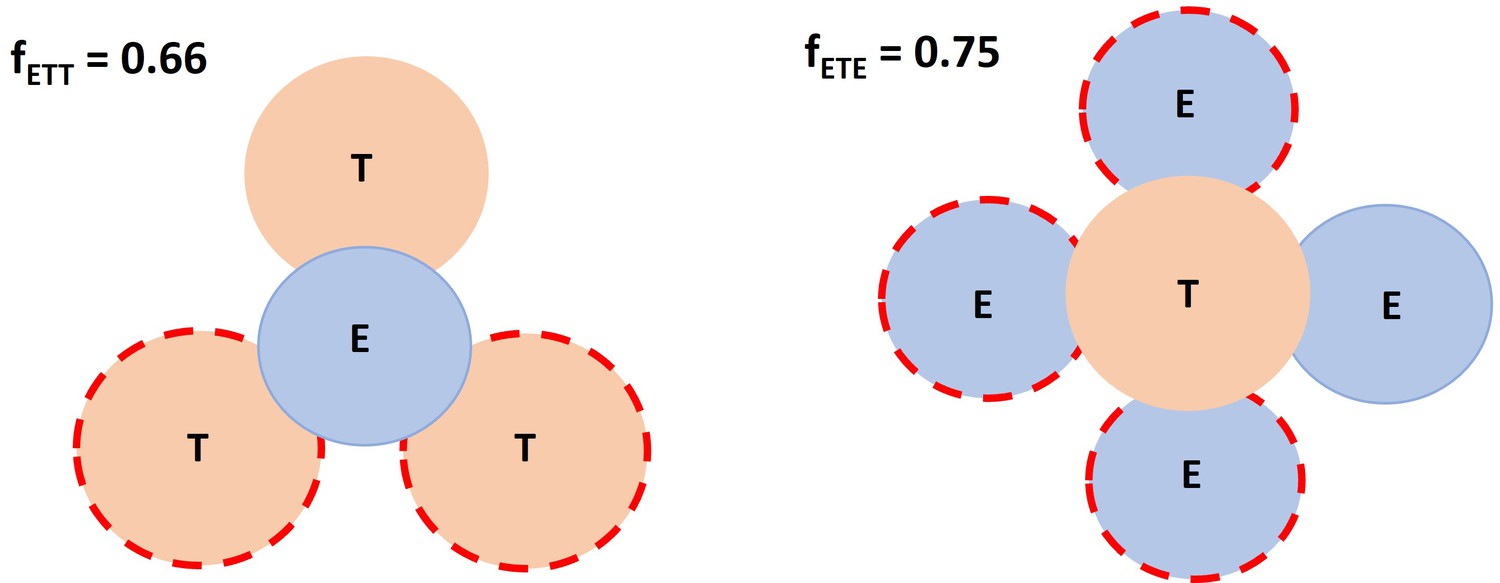
Figure 4
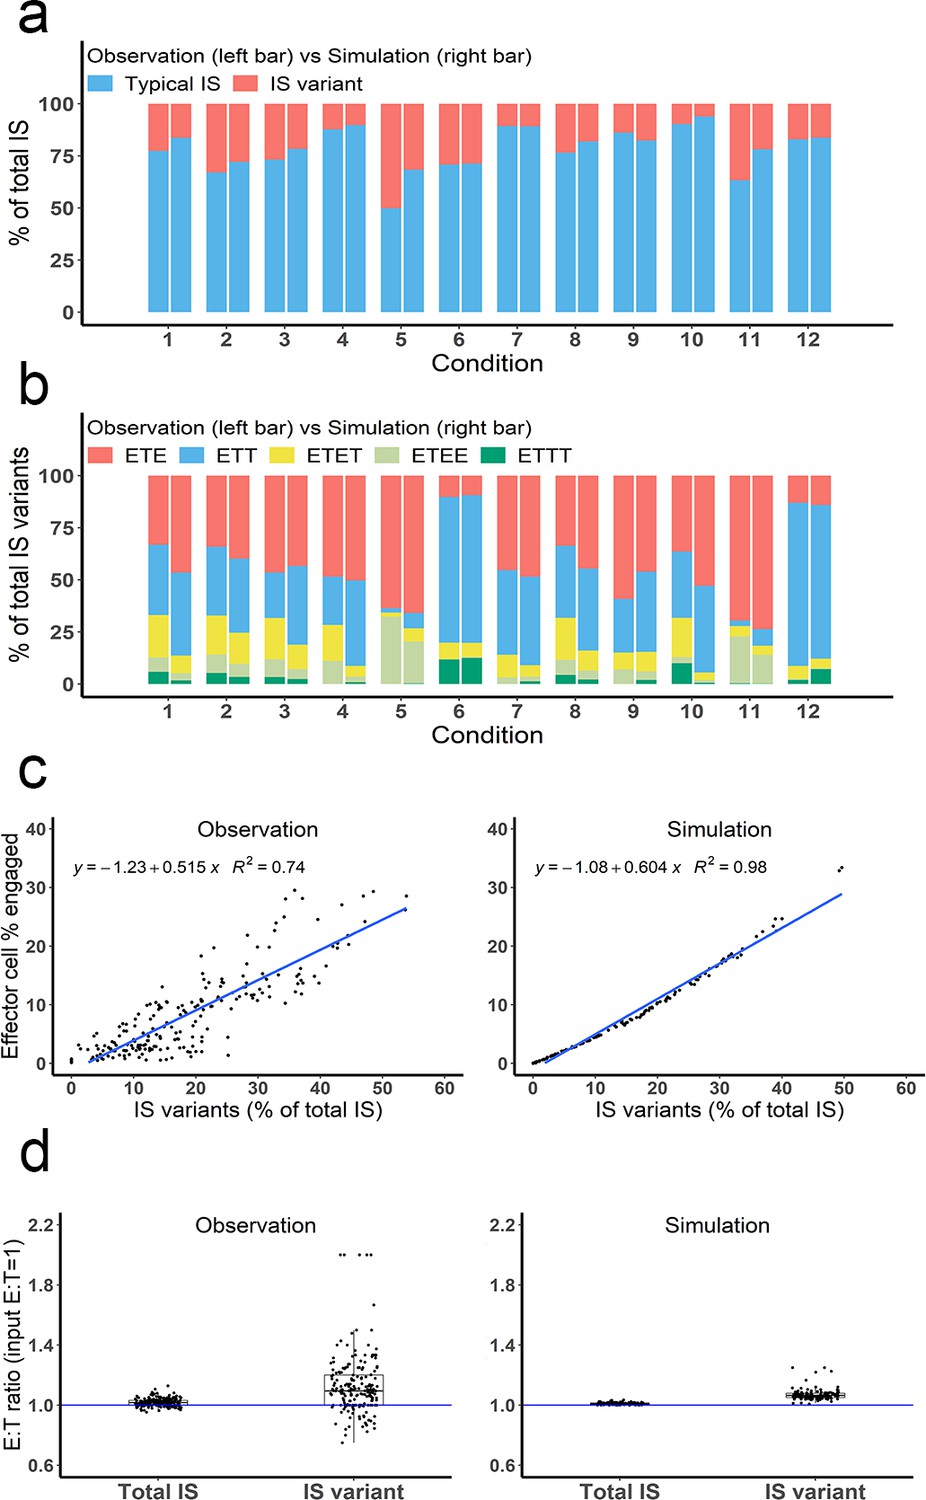
Multiple types of immunological synapses (IS) variants were observed and well-predicted by the base model.
In total, six types of IS were quantified, including typical IS (ET), ETE, ETT, ETET, ETEE, and ETTT. (a) The fraction of typical IS and variants under different conditions; (b) The composition of IS variants (ETE, ETT, ETET, ETEE, ETTT) under different conditions; (c) The positive correlation between the fraction of IS variants (% of total IS) and total IS formation (effector cell % engaged). The formula and R2 of linear regressions are shown. (d) The E:T ratios involved in total IS and IS variants. Experimental setup: Condition 1, 2 X, E:T(1), CD3(L), CD19(M), 100 ng/mL, 60 min; Condition 2, 4 X, E:T(1), CD3(L), CD19(M), 100 ng/mL, 60 min; Condition 3, 2 X, E:T(1), CD3(H), CD19(M), 100 ng/mL, 60 min; Condition 4, 2 X, E:T(1), CD3(L), CD19(L), 100 ng/mL, 60 min; Condition 5, 4 X, E:T(6), CD3(L), CD19(M), 100 ng/mL, 60 min; Condition 6, 4 X, E:T(0.17), CD3(L), CD19(M), 100 ng/mL, 60 min; Conditions 7–12 are the same as Conditions 1–6, except with lower bispecific T cell engager (BiTE) concentrations (20 ng/mL).
Figure 5 with 3 supplements
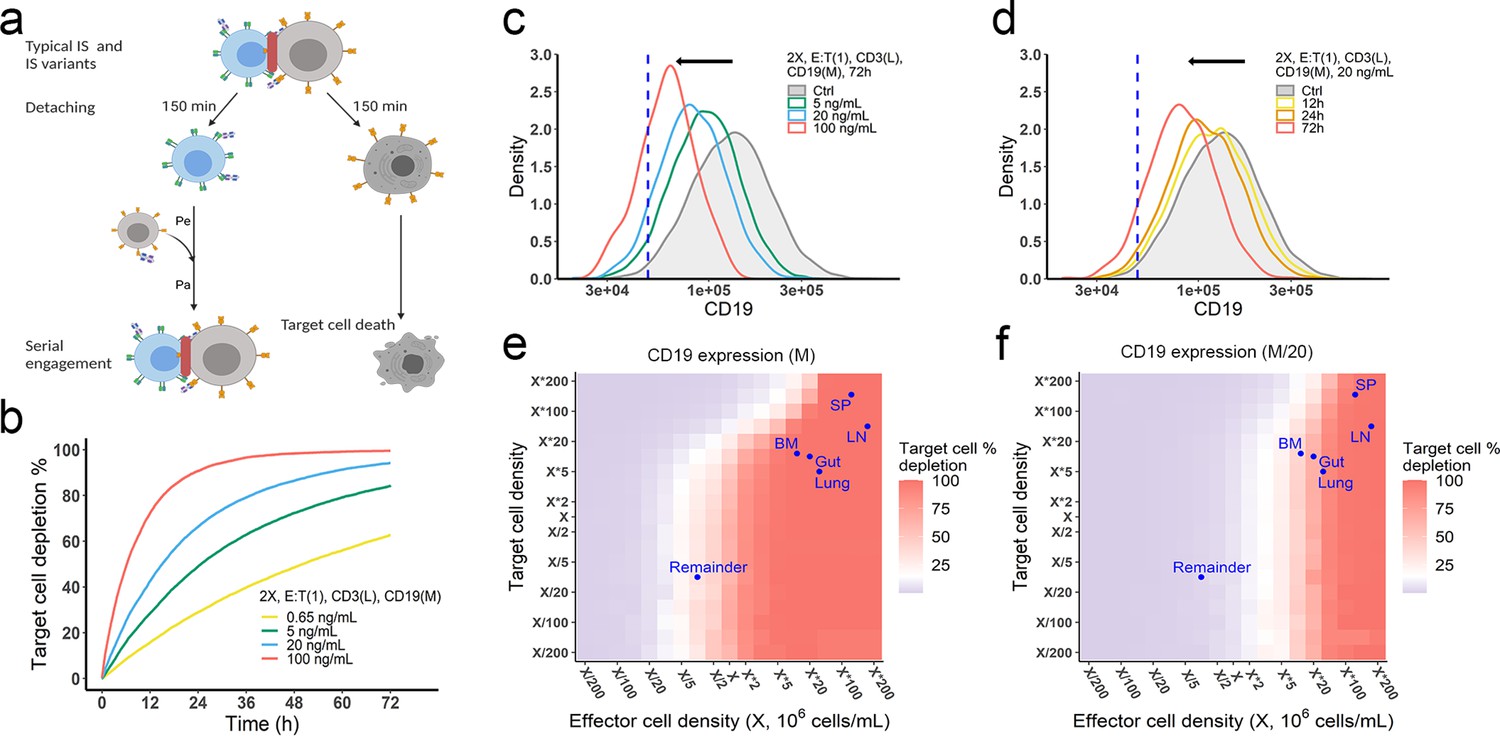
The in vitro model predicted tumor evolution in time and space.
(a) Scheme of cell detachment and serial engagement in the in vitro model. Immunological synapses (IS) duration is set to 150 min. Pe, encounter probability, Pa, adhesion probability; (b) Long-term simulation (72 hr) of target cell depletion across drug concentrations; (c–d) The effects of drug concentration (c) and incubation time (d) on CD19 expression. Dashed line, a pre-defined threshold value of CD19 expression for 15% target cell depletion within 72 hr (initial setup: 2 X, E:T(1), CD3(L), 0.65 ng/mL, 72 h). Ctrl, the initial distribution of CD19 expression in the target cell population. (e–f) the effects of effector and target cell density on target cell depletion (%). Dots indicated the effect and target cell densities in healthy human organs. White color, 15% target cell depletion. BM, bone marrow; LN, lymph nodes; SP, spleen; Remainder, all the rest of the non-lymphoid organs. Initial setup: CD3(L), CD19(M) for (e), CD19 (M/20) for (f), 0.65 ng/mL, 72 h.
Figure 5—figure supplement 1
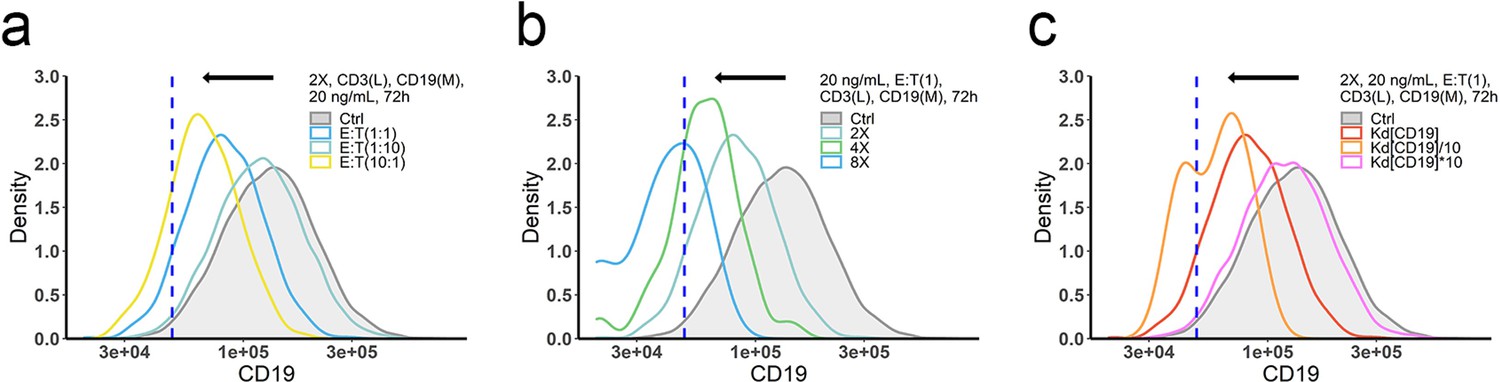
The effects of ET ratio (a), cell density (b), and binding affinity (c) on CD19 evolution.
The in vitro model was applied to perform simulations. Dashed line, the threshold value of CD19 expression for 15% target cell depletion within 72 h (initial setup: 2 X, E:T(1), CD3(L), 0.65 ng/mL, 72 h). Ctrl, initial CD19 distribution in the target cell population. Kd, dissociation constant; 2 X, 2 × 10⁶ total cells/mL; E:T(1), E:T ratio = 1; CD3(L), CD3 expression (Low); CD19(M), CD19 expression (medium); 0.65, 20 ng/mL, blinatumomab concentration; 72 h, incubation duration.
Figure 5—figure supplement 2

The effects of effector and target cell density on target cell depletion (%) at 72 h.
Simulations were performed by the in vitro model. Dots indicated the effect and target cell densities in healthy human organs. White color, 15% target cell depletion. BM, bone marrow; LN, lymph nodes; SP, spleen; Remainder, all the rest of non-lymphoid organs. Initial setup: CD3(L), CD19(M) for a, CD19 (M×4) for b, CD19 (M/4) for c, CD19 (M/20) for d, 0.65 ng/mL, 72 h.
Figure 5—figure supplement 3

Different effects of CD19 on cellular and molecular processes.
(a–b) Different effects of target cell density and CD19 expression on target cell depletion amount (a) and fraction (b). The in vitro model was used in the simulation. Initial setup: CD3(L), effector cell (1 X), target cell (X/20 to 500 X), CD19 expression (M/20 to 500 M), 0.65 ng/mL, 72 h. Total CD19 in the system was jointly influenced by CD19 expression per target cell and target cell density. CD19 expression influenced cell lysis to a similar extent as target cell density when both factors were low (e.g. CD19 expression <M, target cell density <X in (a)). However, further increase of CD19 expression on cell membrane did not further improve cell lysis (e.g. from point A to point C), indicating maximum ternary complexes at each interface have been reached. In contrast, the increase of target cell density continuously promotes cell lysis, e.g., from point A to B, due to enhanced probability of cell-cell encounter. When the target cell density reaches extremely high (>50 X), cell lysis started to decrease, resulting from fewer cell-cell adhesion events due to insufficient bispecific T cell engager (BiTE) concentration. As shown, although total CD19 in the system at point B and C are identical (10 × M × X), different cell lysis level is yielded, supporting different effects of CD19 on cellular and molecular processes. (c) Effects of B cell density and CD19 expression on B cell depletion in vivo. In each group, the change of total CD19 density from the reference (1 X, 200 B cells/μL × 30,000 CD19/cell) was achieved through changing B cell density (red bar) or CD19 expression (gray bar). Their effects on B cell depletion amount were simulated by the in vivo model. Initial setup for reference (1 X): T cell (200 /μL), B cell (200 /μL), CD3 (50, 000 /cell), CD19 (30, 000 /cell), 0.73 ng/mL, 72 h. Different effects of CD19 on cellular and molecular processes have been confirmed by the in vivo model. Similarly, the increase of CD19 expression within low-level range (3 × 10³–3 × 10⁵ CD19/cell from 0.1X to 10X) constantly improved cell depletion, as ternary complexes formation at each interface increased with CD19 expression. By contrast, a bidirectional effect was shown by increasing B cell density, owing to enhanced probability of cell-cell encounter at the population level and then insufficient BiTE concentration. Herein, B cell density at 10 X (2000 /μL) in the blood indicates extremely high organ B cell density in the model, e.g., spleen (~9 × 10⁸ /mL) and lymph nodes (~3 × 10⁸ /mL).
Figure 6 with 2 supplements
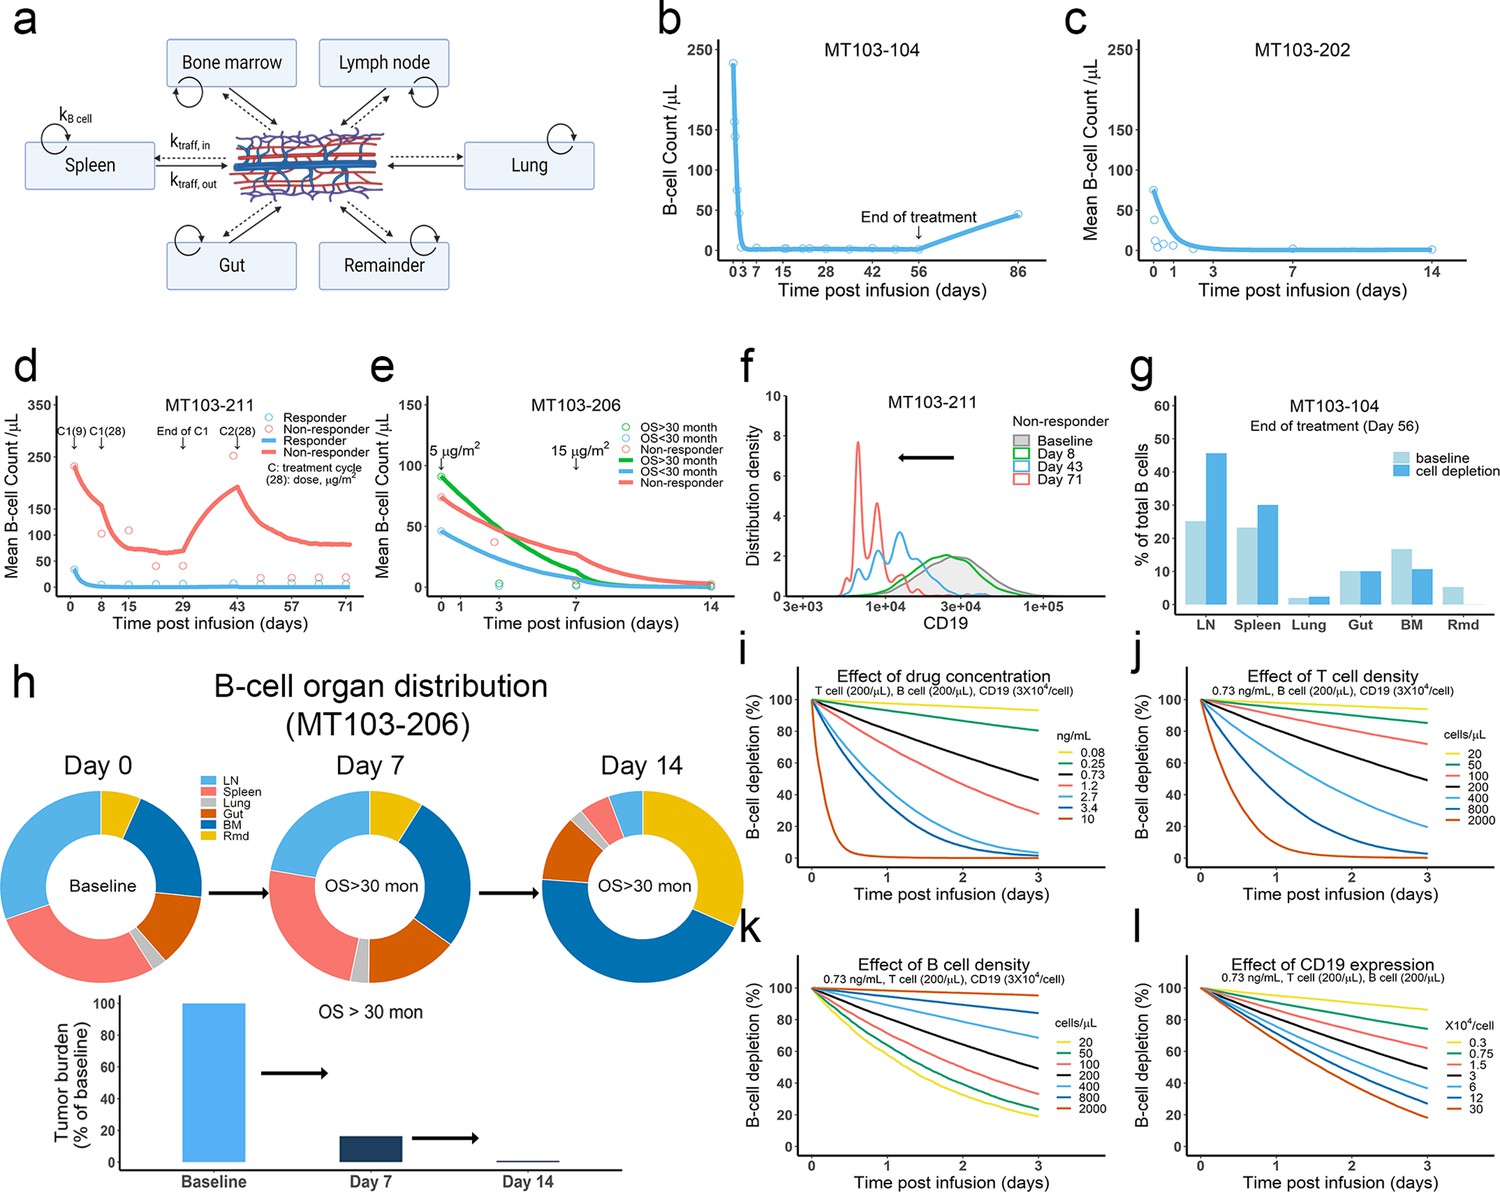
The in vivo model predicted clinical pharmacodynamics and tumor evolution across anatomical sites.
(a) Scheme of organ compartment and cell trafficking. Remainder, all the rest of the non-lymphoid organs; kB cell, the turnover rate of B cell; ktraff, in and ktraff out, B cell trafficking rate. For parameters and trial information, see Materials and methods, and Supplementary file 1b and c; (b–e) Observed and simulated patient B cell profiles in blood; (f) Simulated CD19 evolution in non-responder patients of trial MT103-211; (g) Simulated cell lysis potency for each organ in trial MT103-104; (h) Simulated baseline (day 0), and post-treatment (day 7 and 14) B cell organ distribution in patients with OS >30 months of trial MT103-206. Bar plot, simulated baseline and post-treatment tumor burden; (i–l) Sensitivity analyses for the impact of drug concentration (i), T cell density (j), B cell density (k), and CD19 expression (l) on B cell depletion. T cell density change is allowed in the simulations (b–e), details see Supplementary file 1b. BM, bone marrow; LN, lymph nodes; OS, overall survival; Rmd, remainder.
Figure 6—figure supplement 1
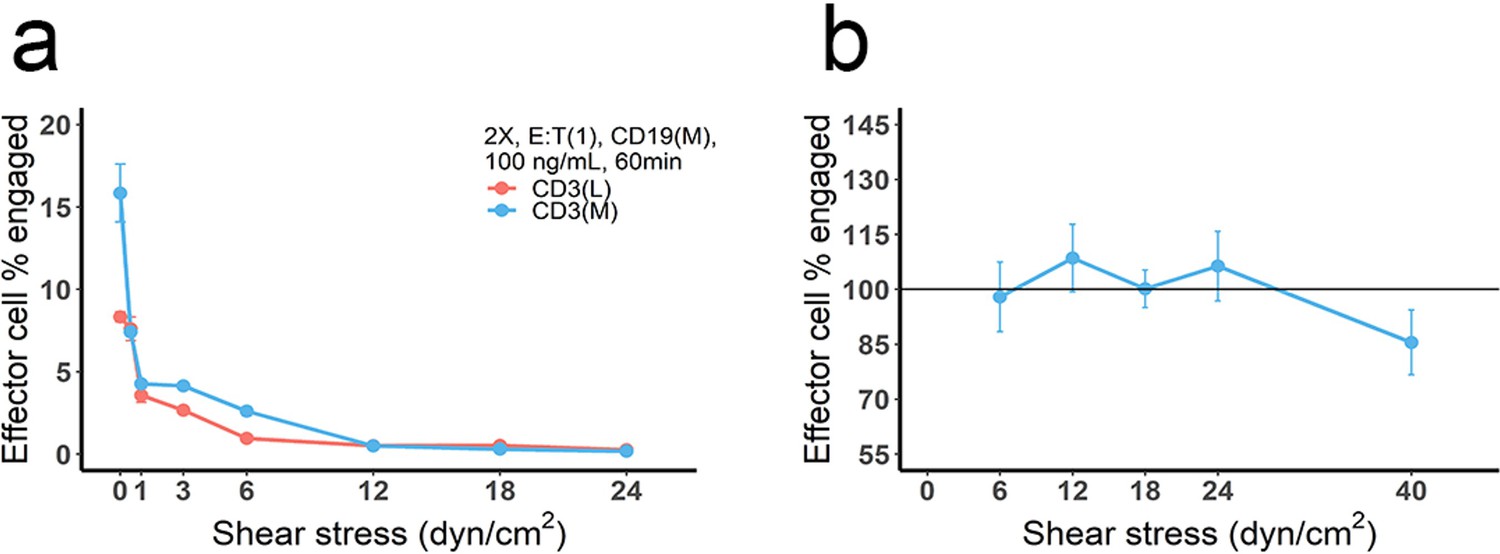
The effect of blood flow on the production and stability of immunological synapses (IS).
(a) Cell co-culture was conducted at different flow velocities, producing different shear stresses to mimic the effect of blood flow. Initial setup: 2 X, 2 × 10⁶ total cells/mL; E:T(1), E:T ratio = 1; CD3(L), CD3 expression (Low); CD3(M), CD3 expression (medium); CD19(M), CD19 expression (medium); 100 ng/mL, blinatumomab concentration; 60 min, incubation duration. (b) Cell incubation was conducted at static condition (initial setup: 2 X, E:T(1), CD19(M), CD3(L), 100 ng/mL, 60 min, shear stress = 0) and followed by adding different shear stresses (5 min) to test the stability of pre-existing IS. The reference line (100%) indicated the frequency of the effector cells engaged at static condition.
Figure 6—figure supplement 2
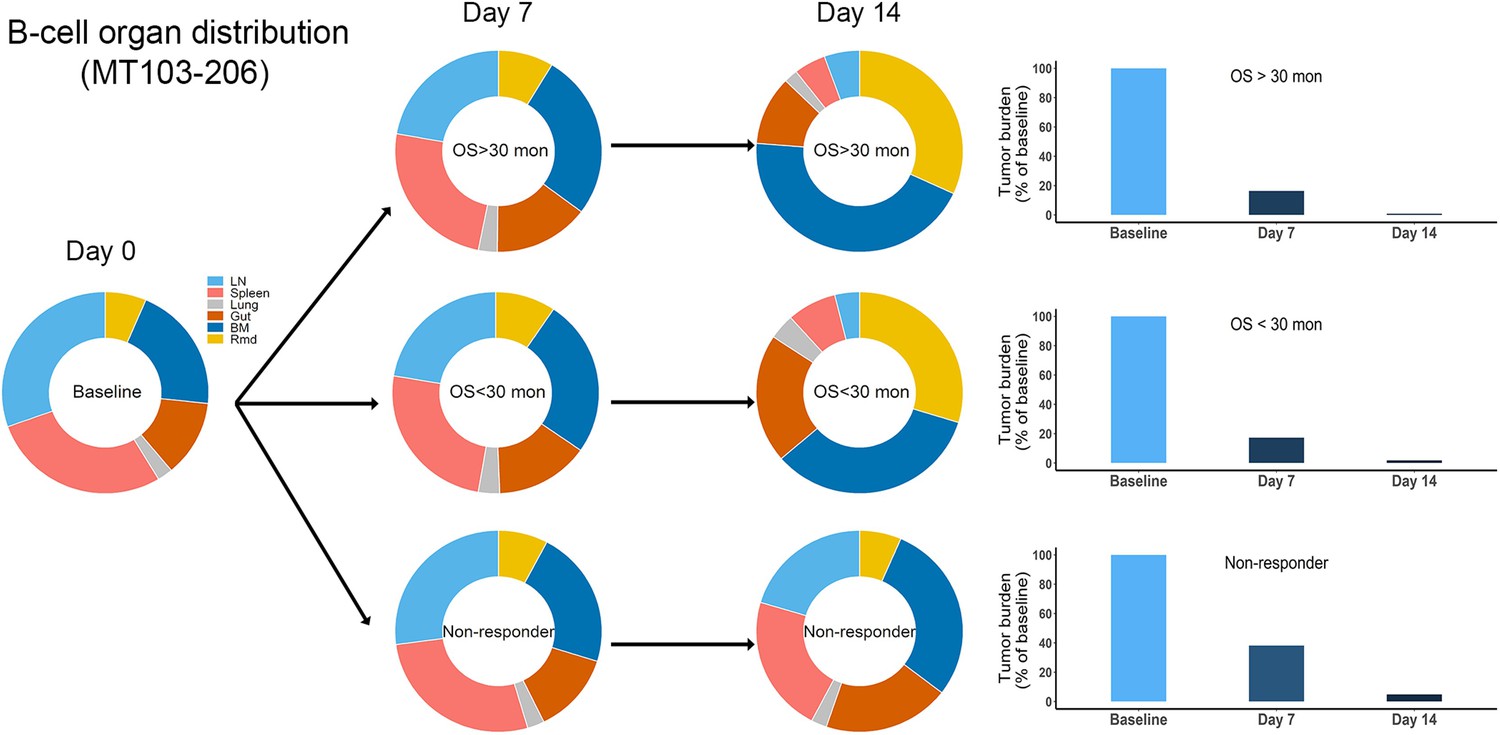
Simulated baseline (day 0), and post-treatment (day 7 and 14) B cell organ distribution in patients of trial MT103-206.
The in vivo model was applied to perform the simulations. Bar plot showed the simulated tumor burden at baseline and post-treatment. BM, bone marrow; LN, lymph nodes; OS, overall survival; Rmd, remainder, all the rest of the non-lymphoid organs.
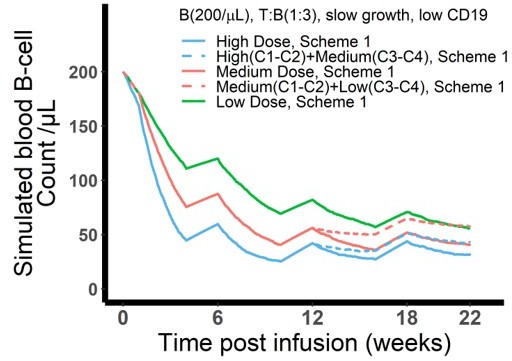
Figure 7
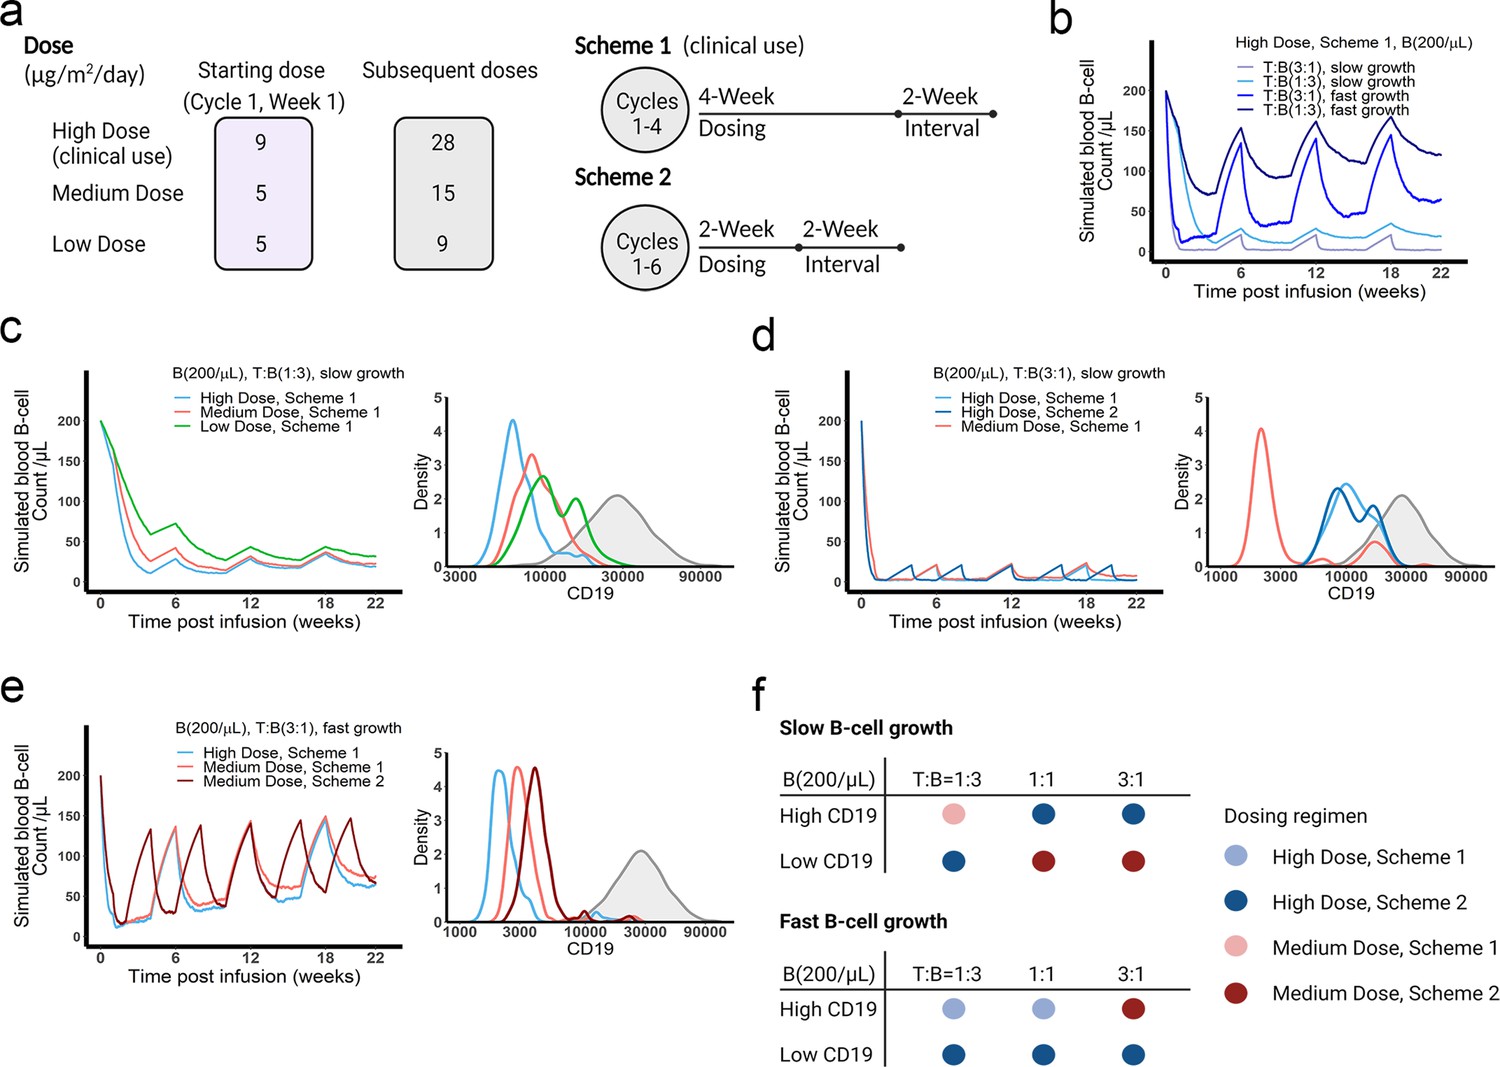
The dose and regimen of bispecific T cell engager (BiTE) strongly influenced tumor control and CD19 evolution.
(a) Three doses (high, medium, and low) and regimens (scheme 1 and 2) were evaluated in the simulations. Starting doses were applied in the first week of cycle 1 only. The high dose with scheme 1 is the clinically approved dose and regimen of blinatumomab for the treatment of B cell acute lymphoblastic leukemia; (b) Simulated blood B cell profiles under different T:B ratios and B cell growth rates in 22-week treatment; (c–e) Different dose levels, and schemes were explored in respective conditions. Simulated blood B cell profiles and CD19 evolution were shown. Gray line and shaded regions represent baseline CD19 expression; (f) The favorable dosing regimen under each condition. The favorable dosing regimen was determined by comparing B cell killing efficacy, CD19 evolution, and total dose, in this order of priority, respectively. B (200 /μL), baseline B cell density in blood is assumed to be 200 /μL; High (b–e) and low CD19 expressions were the mean level of CD19 expression per B cell and set as 3 × 10⁴ and 1 × 10⁴, respectively; High growth and low growth of B cells were set to 0.071 /day and 0.0071 /day; T cell density change is not included in this proof-of-concept simulations.
Appendix 1—scheme 1
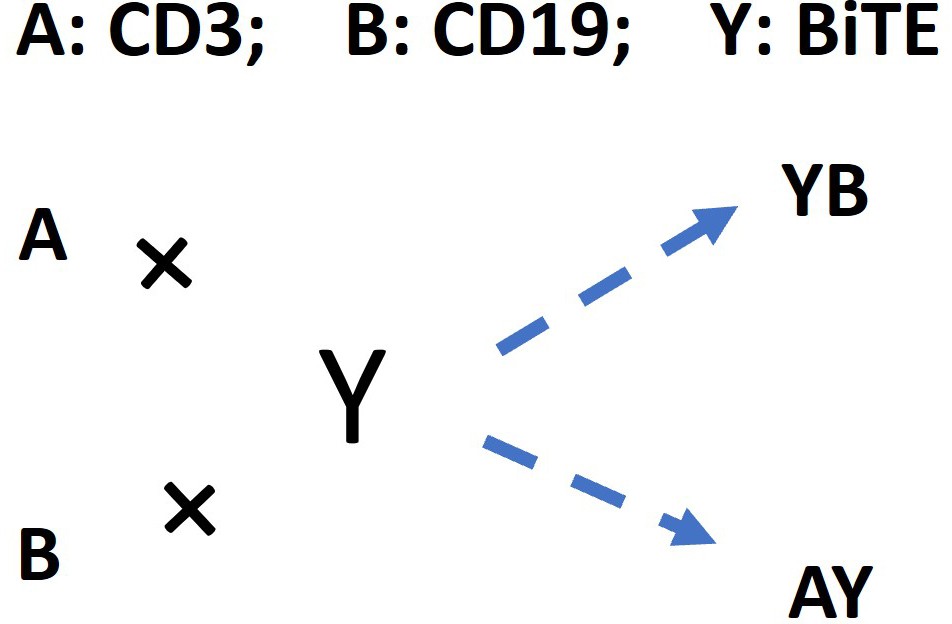
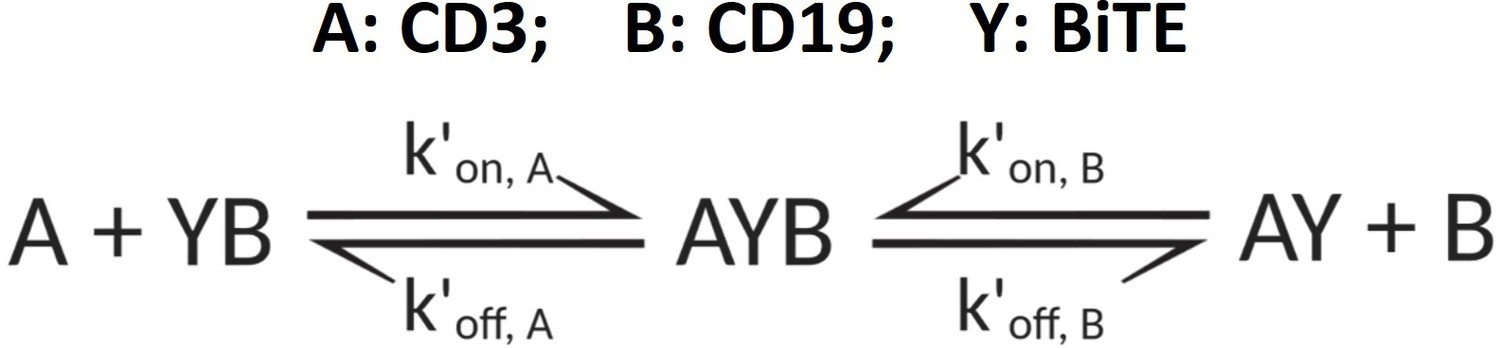
The schema for antibody-antigen binding to form the binary complex.
Appendix 1—figure 1
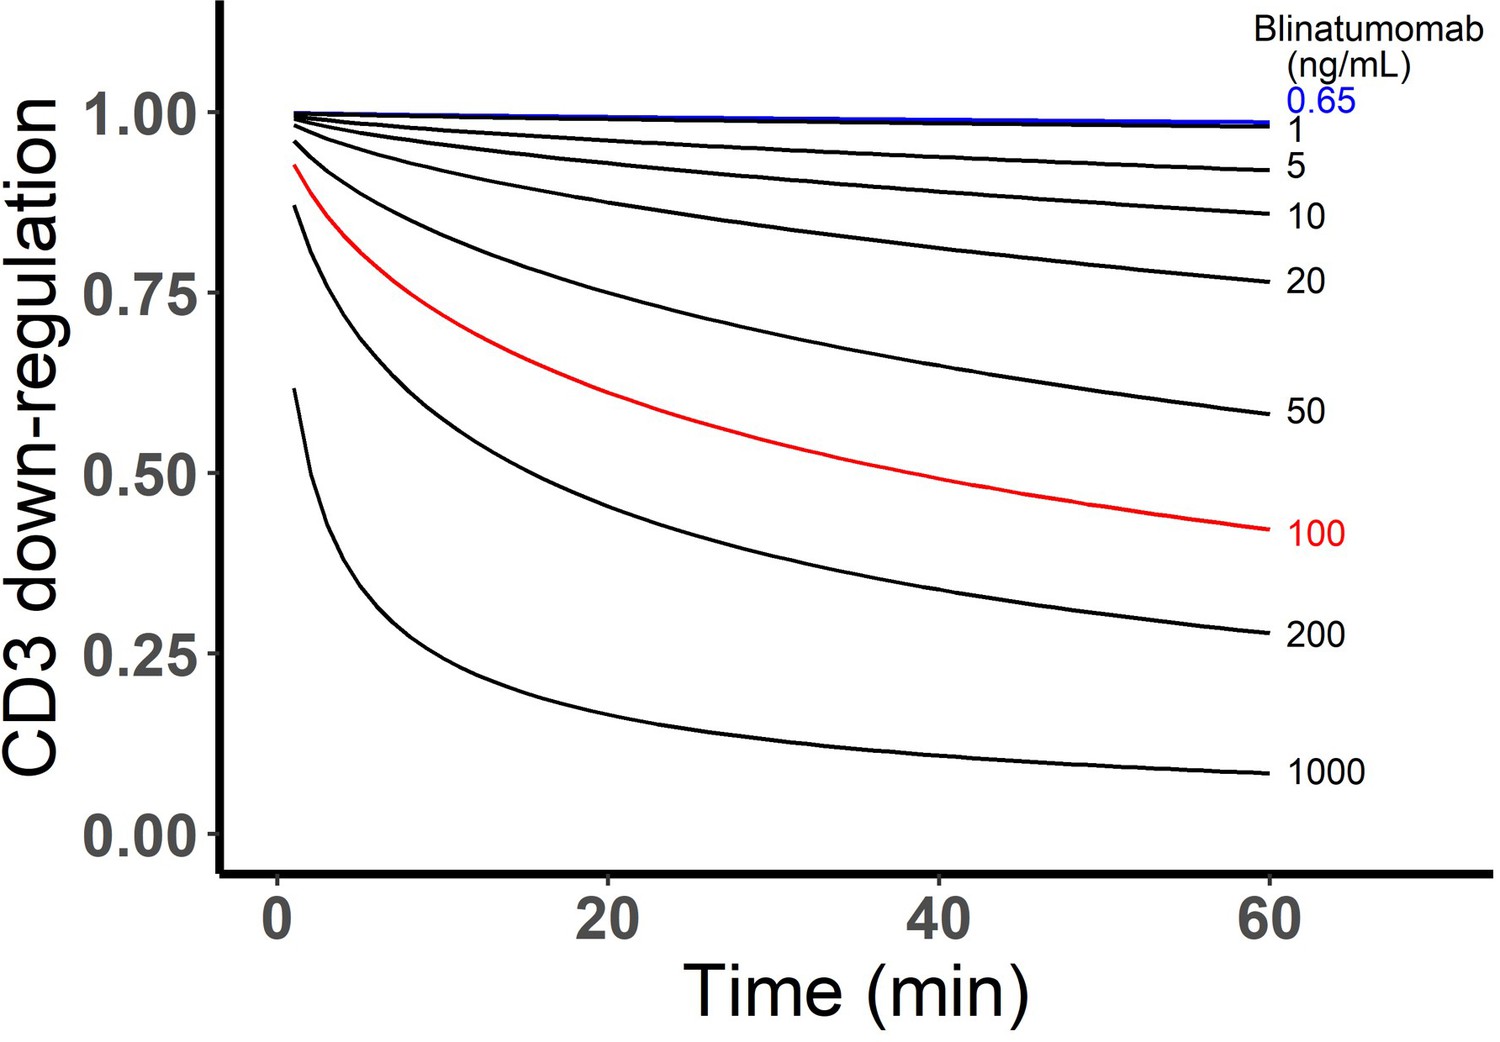
Simulated CD3 down-regulation over time at different blinatumomab concentrations.
Initial setup: 2×10⁶ total cells/mL, CD3 expression (L), CD19 expression (M), E:T ratio=1.
Appendix 1—scheme 2
Spatial factor when a typical immunological synapses (IS) (ET) encounters an additional free target cell or effector cell.
Appendix 1—figure 2
Graphical presentation of ternary complex (CD3-BiTE-CD19, bond) formation during cell-cell adhesion.
The bond is formed by binding between a binary complex and a free antigen (a), rather than two binary complexes (b) or two free antigens (c). Three steps of 2-D binding on membrane (d): diffusion, rotation, and molecular binding.
Appendix 1—scheme 3
The formation of ternary complex (AYB, bond).
Appendix 1—scheme 4
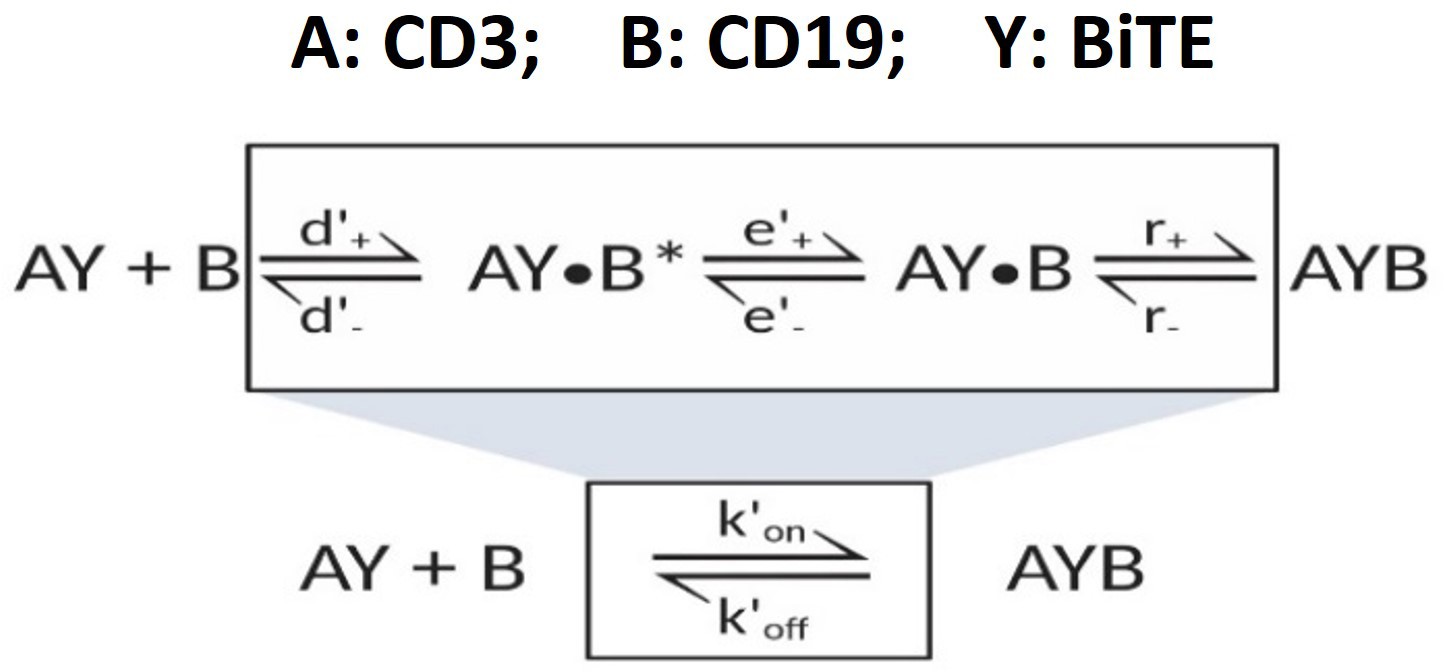
‘Single-step model’ for 2-D binding on cell membrane.
Appendix 1—figure 3
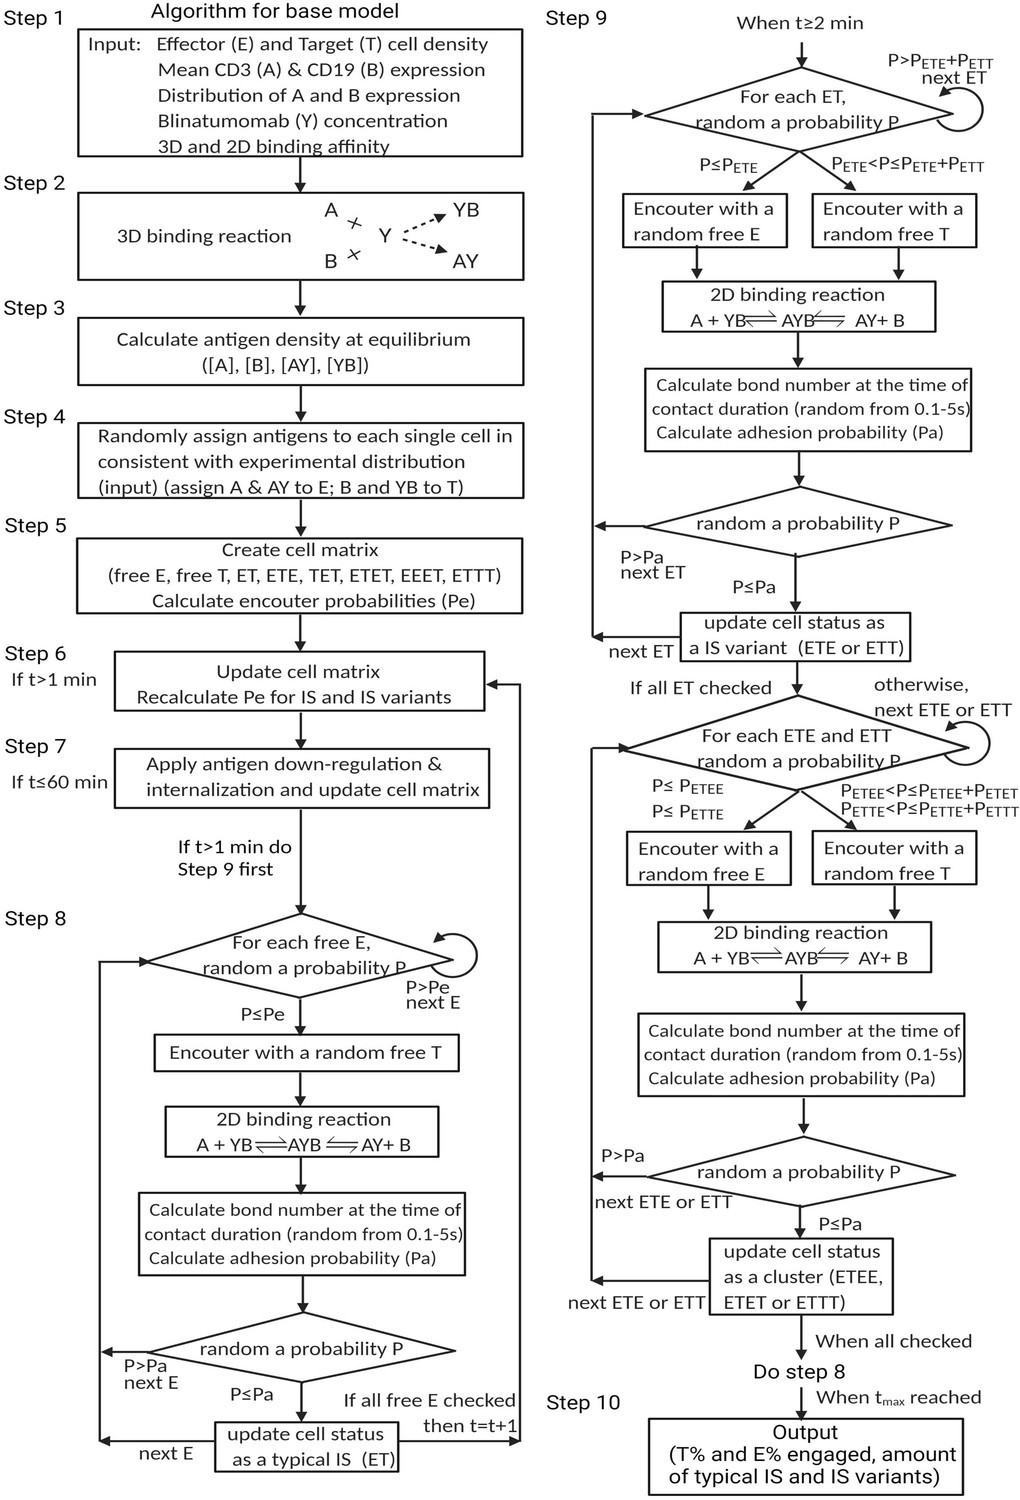
Algorithm for the base model.
Author response image 1
Additional files
-
Supplementary file 1
A summary of model parameters and clinical trial information.
(a) Model parameters for the base model. (b) Patient-specific parameters for the in vivo model. (c) Clinical trial information in our simulation.
- https://cdn.elifesciences.org/articles/83659/elife-83659-supp1-v1.docx
-
MDAR checklist
- https://cdn.elifesciences.org/articles/83659/elife-83659-mdarchecklist1-v1.docx
Download links
A two-part list of links to download the article, or parts of the article, in various formats.
Downloads (link to download the article as PDF)
Open citations (links to open the citations from this article in various online reference manager services)
Cite this article (links to download the citations from this article in formats compatible with various reference manager tools)
Population dynamics of immunological synapse formation induced by bispecific T cell engagers predict clinical pharmacodynamics and treatment resistance
eLife 12:e83659.
https://doi.org/10.7554/eLife.83659


