History information emerges in the cortex during learning
- Department of Medical Neurobiology, Faculty of Medicine, The Institute for Medical Research Israel-Canada (IMRIC), The Hebrew University of Jerusalem, Israel
- Brain Research Institute, University of Zurich, Switzerland
- Neuroscience Center Zurich, Switzerland
Figures
Figure 1 with 3 supplements
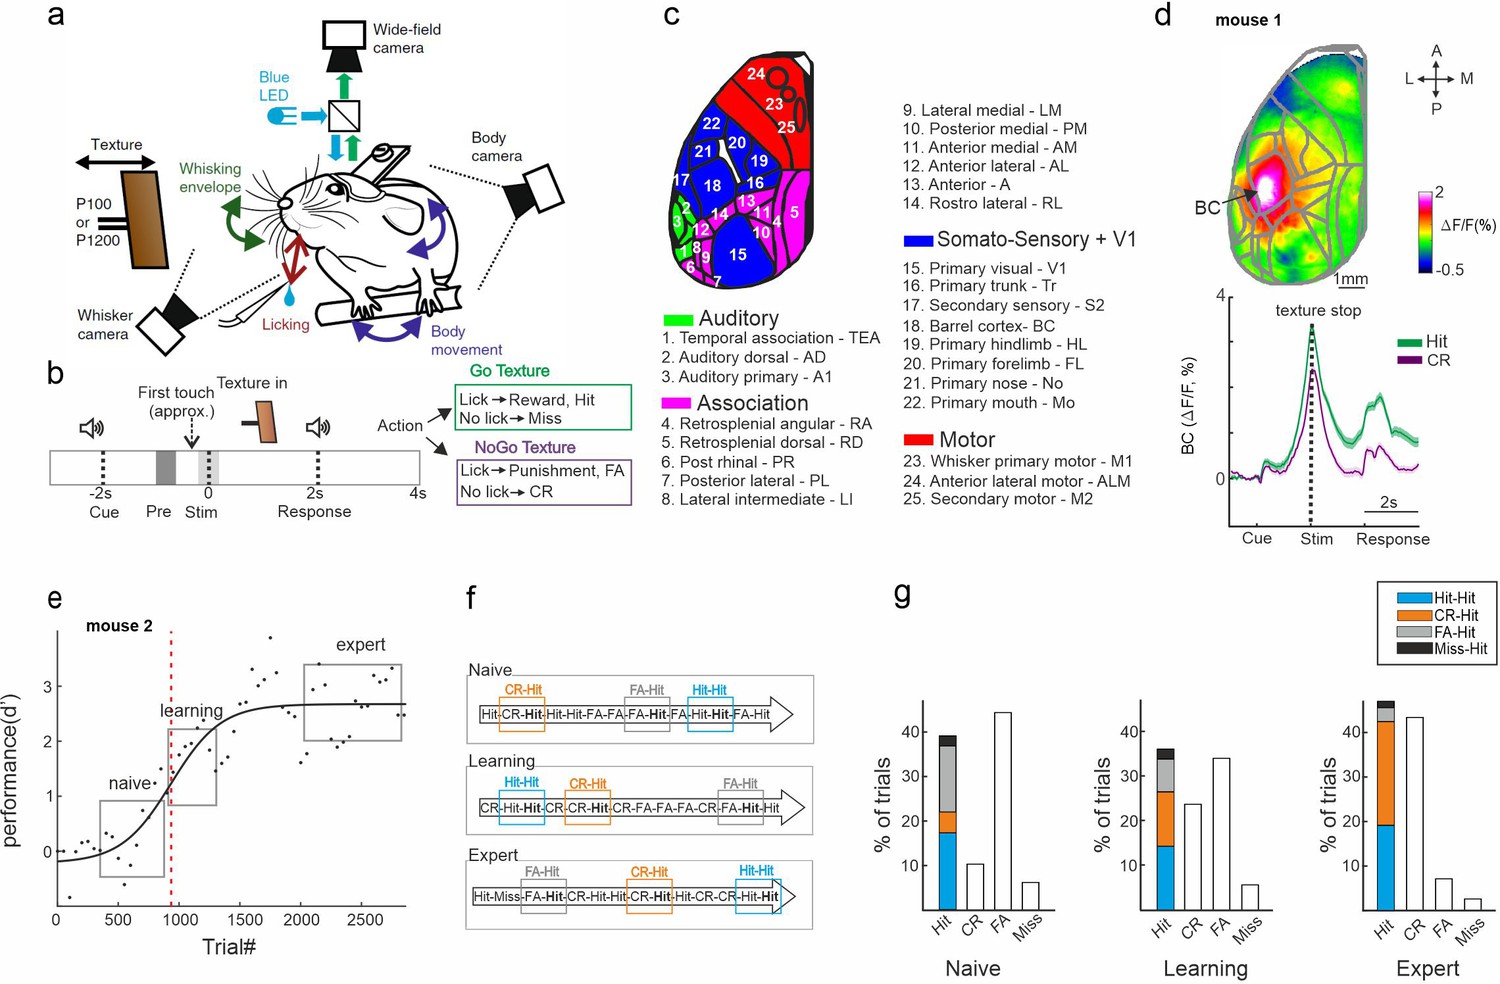
Trial types based on history.
(a) Behavioral setup for head-fixed texture discrimination with simultaneous wide-field calcium imaging and video monitoring of whisker motion and body movement. (b) Trial structure and possible trial outcomes. pre and stim periods are marked in gray and light gray colors, respectively. (c) Twenty-five cortical areas used in this study grouped into auditory areas (green), association areas (pink), somatosensory + V1 areas (blue), and motor areas (red). (d) Top: Example mean activation map (averaged during the stim period) for the Hit condition. BC – barrel cortex. Color denotes normalized fluorescence. Bottom: Time course of activity in BC for Hit (green) and correct rejection (CR; purple). Error bars are mean ± standard error of the mean (SEM) across trials (n = 376 and 333 for Hit and CR, respectively). (e) Example of a learning curve (d′ as a function of trial number) of one mouse, fitted with a sigmoid function (solid black line). Red dashed vertical line indicates the learning threshold. gray rectangles mark the naive, learning, and expert phases. (f) Schematic diagram of the different trial types for a Hit trial preceded by a different trial (i.e., history): Hit-Hit (blue), CR-Hit (orange), and FA-Hit (gray). (g) Probability of the different trial types along with the distribution of history for the Hit trial during the naïve, learning, and expert phases (averaged across seven mice).
Figure 1—figure supplement 1

Learning curves of all seven mice.
Performance (d′) for all mice across the entire learning profile (50-trial bins), fitted with a sigmoid function. The inflection point of the sigmoid fit is defined as the learning threshold, and indicated by open circle for each mouse.
Figure 1—figure supplement 2
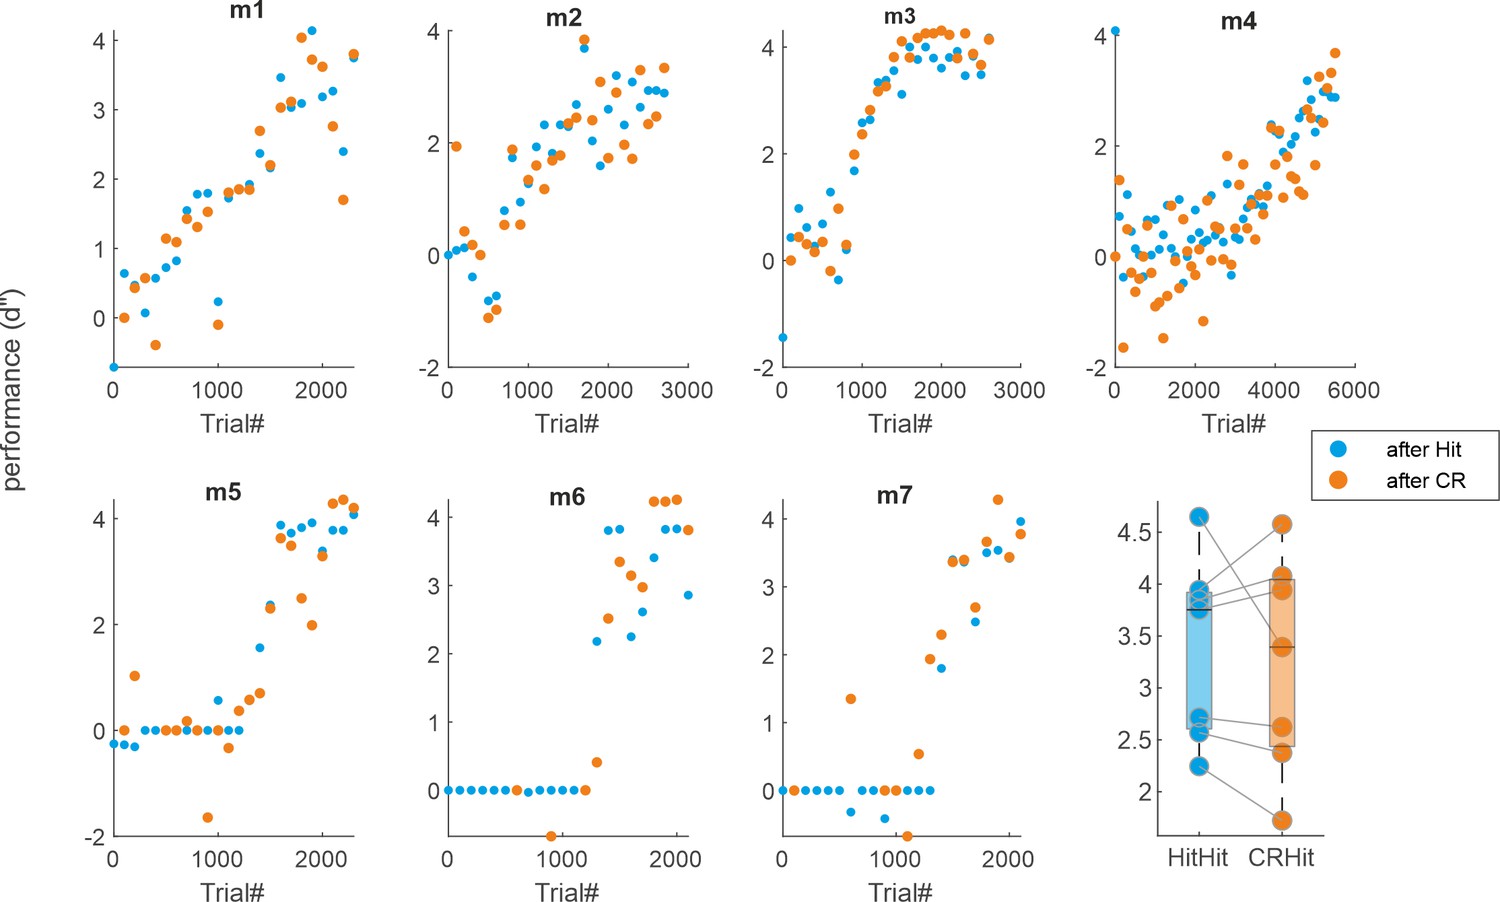
Individual learning curves based on trial history.
(a) Learning curves for each mouse (d′ as a function of trials) calculated separately based on the previous trial (either a Hit or correct rejection [CR]). (b) Average performance during the expert phase for either a previous Hit (blue) or CR (orange).
Figure 1—figure supplement 3
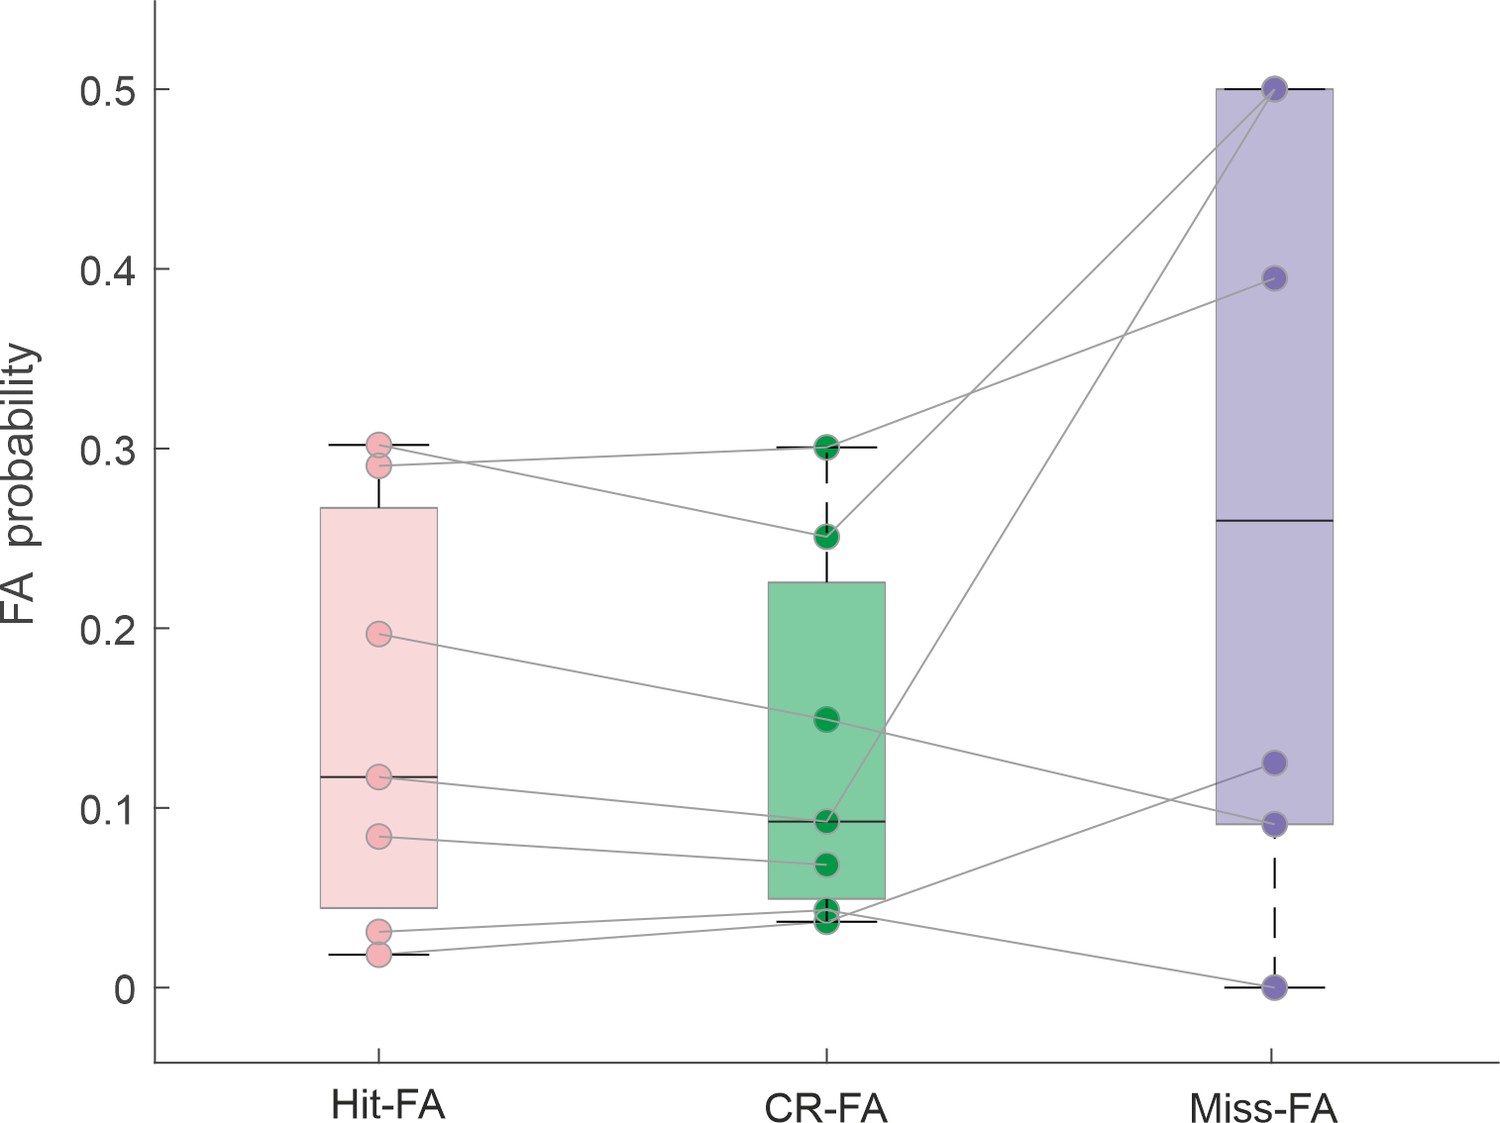
Probability of a false alarm (FA) based on a different preceding trial type: Hit (pink), correct rejection (CR; green), or Miss (purple).
Each point depicts one mouse. There is no significant difference between the different pairs (p > 0.05; Wilcoxon signed-rank test).
Figure 2 with 7 supplements
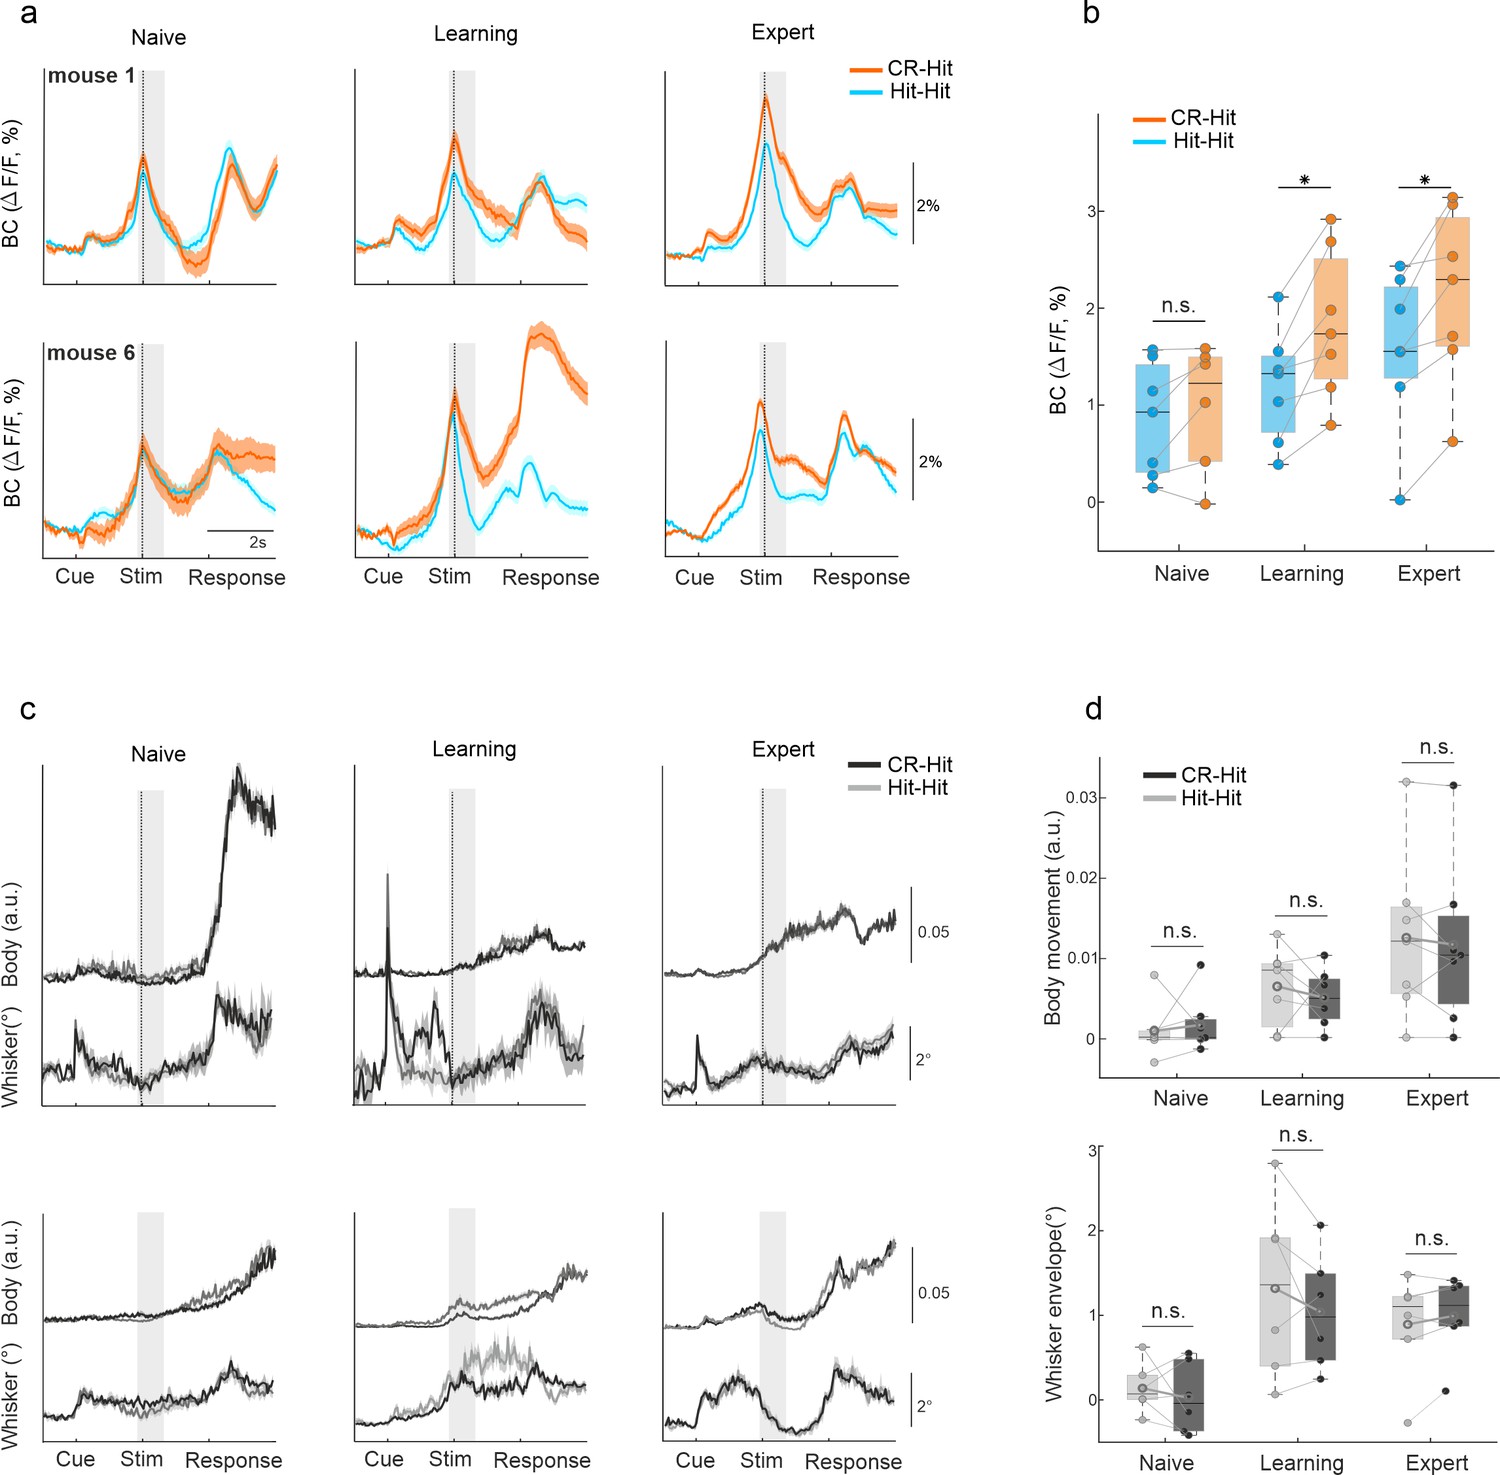
History information in barrel cortex (BC).
(a) Example of average BC response of Hit-Hit (blue) and CR-Hit (orange) from two mice (upper and lower rows) in the naive, learning, and expert phases. Shaded bar depicts the stim period. Error bars are mean ± standard error of the mean (SEM) across trials (mouse 1: n = 86/66, 90/70, and 166/173 Hit-Hit/CR-Hit for naive, learning, and expert phases, respectively; mouse 6: n = 94/80, 86/121, and 99/135). (b) Grand average of BC activity during the stim period (−0.2:0.6 ms) for the naive, learning, and expert phases. Error bars are mean ± SEM across mice (n = 7). (c) Same as (a) but for body and whisker movements in the Hit-Hit (light gray) and CR-Hit (dark gray) trials. (d) Same as (b) but for body (top) and whisker (bottom) movements. *p < 0.05; n.s. – not significant; Wilcoxon signed-rank test.
Figure 2—figure supplement 1
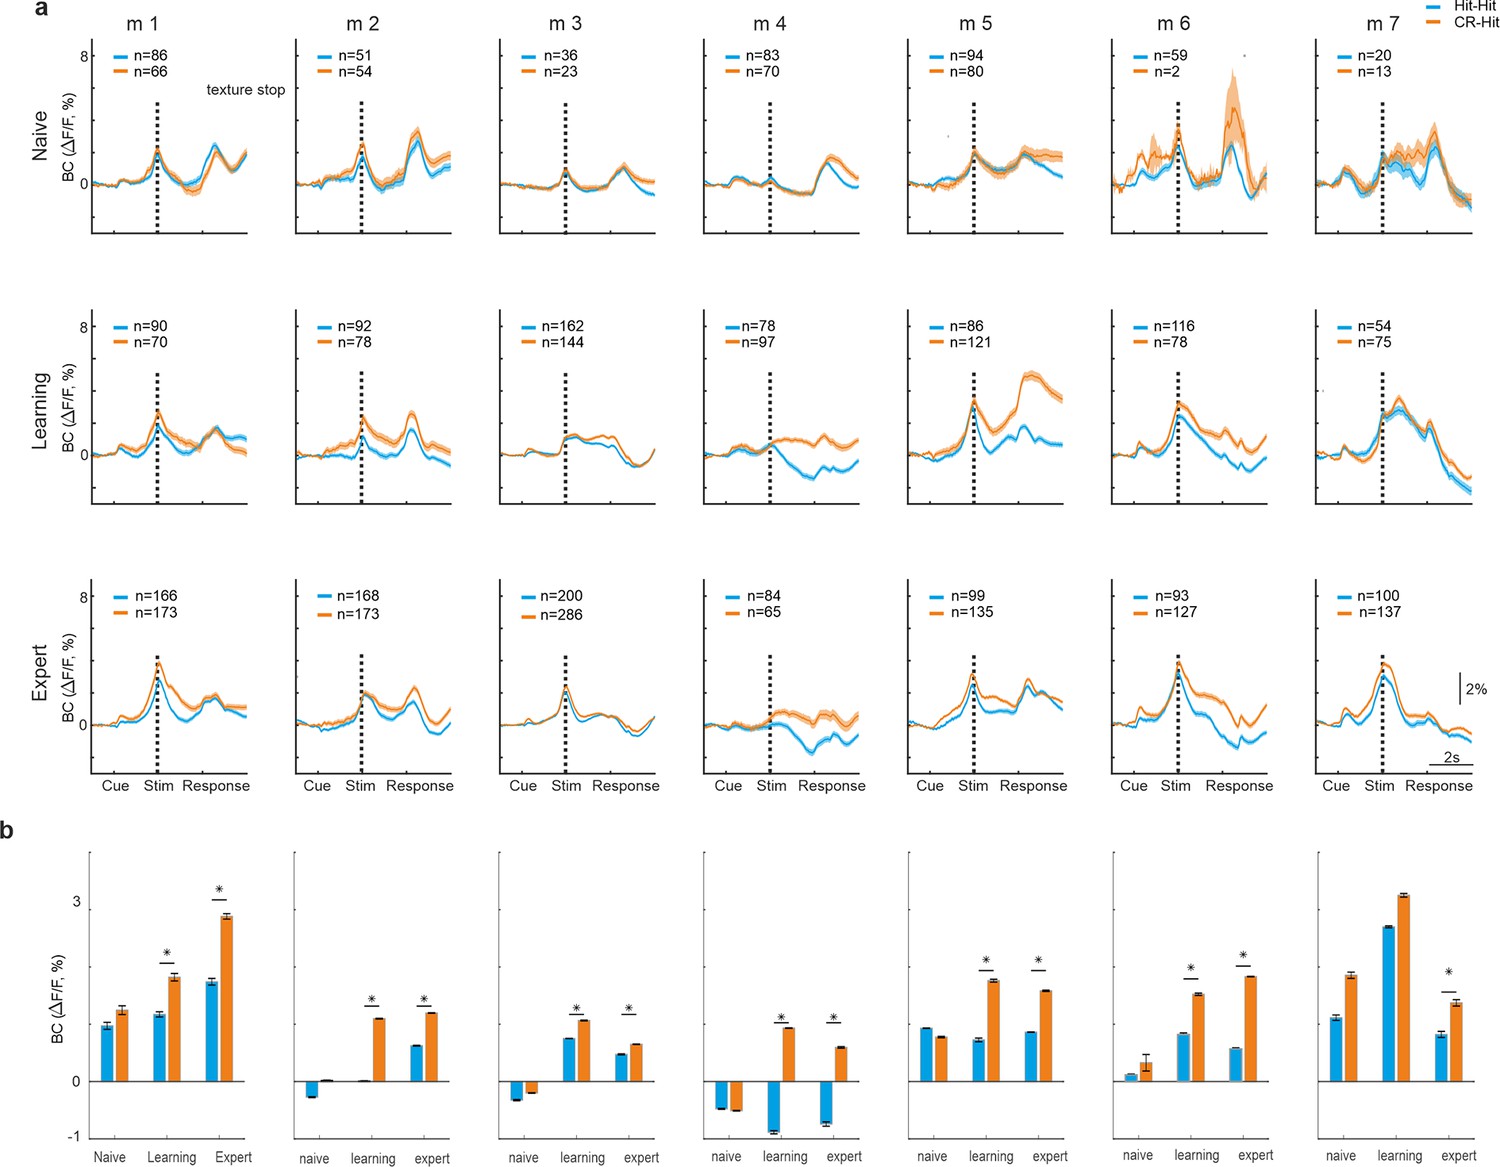
History information in barrel cortex (BC) for each mouse separately.
(a) Average BC response of Hit-Hit (blue) and CR-Hit (orange) for each of the seven mice (similar to Figure 2a) in the naive (top row), learning (middle row), and expert (bottom row) phases. Shaded bar depicts the stim period. Error bars are mean ± standard error of the mean (SEM) across trials (trial numbers indicated in each inset). (b) Average activity in each mouse for the CR-Hit (orange) and Hit-Hit (blue) conditions within the stim period (−0.2 to −0.8 s with exception for m2 = 0.75–1, m3 = 0.8–1.55, m4 = 0.55–1.1). *p < 0.05; n.s. – not significant. Mann–Whitney U-test.
Figure 2—figure supplement 2
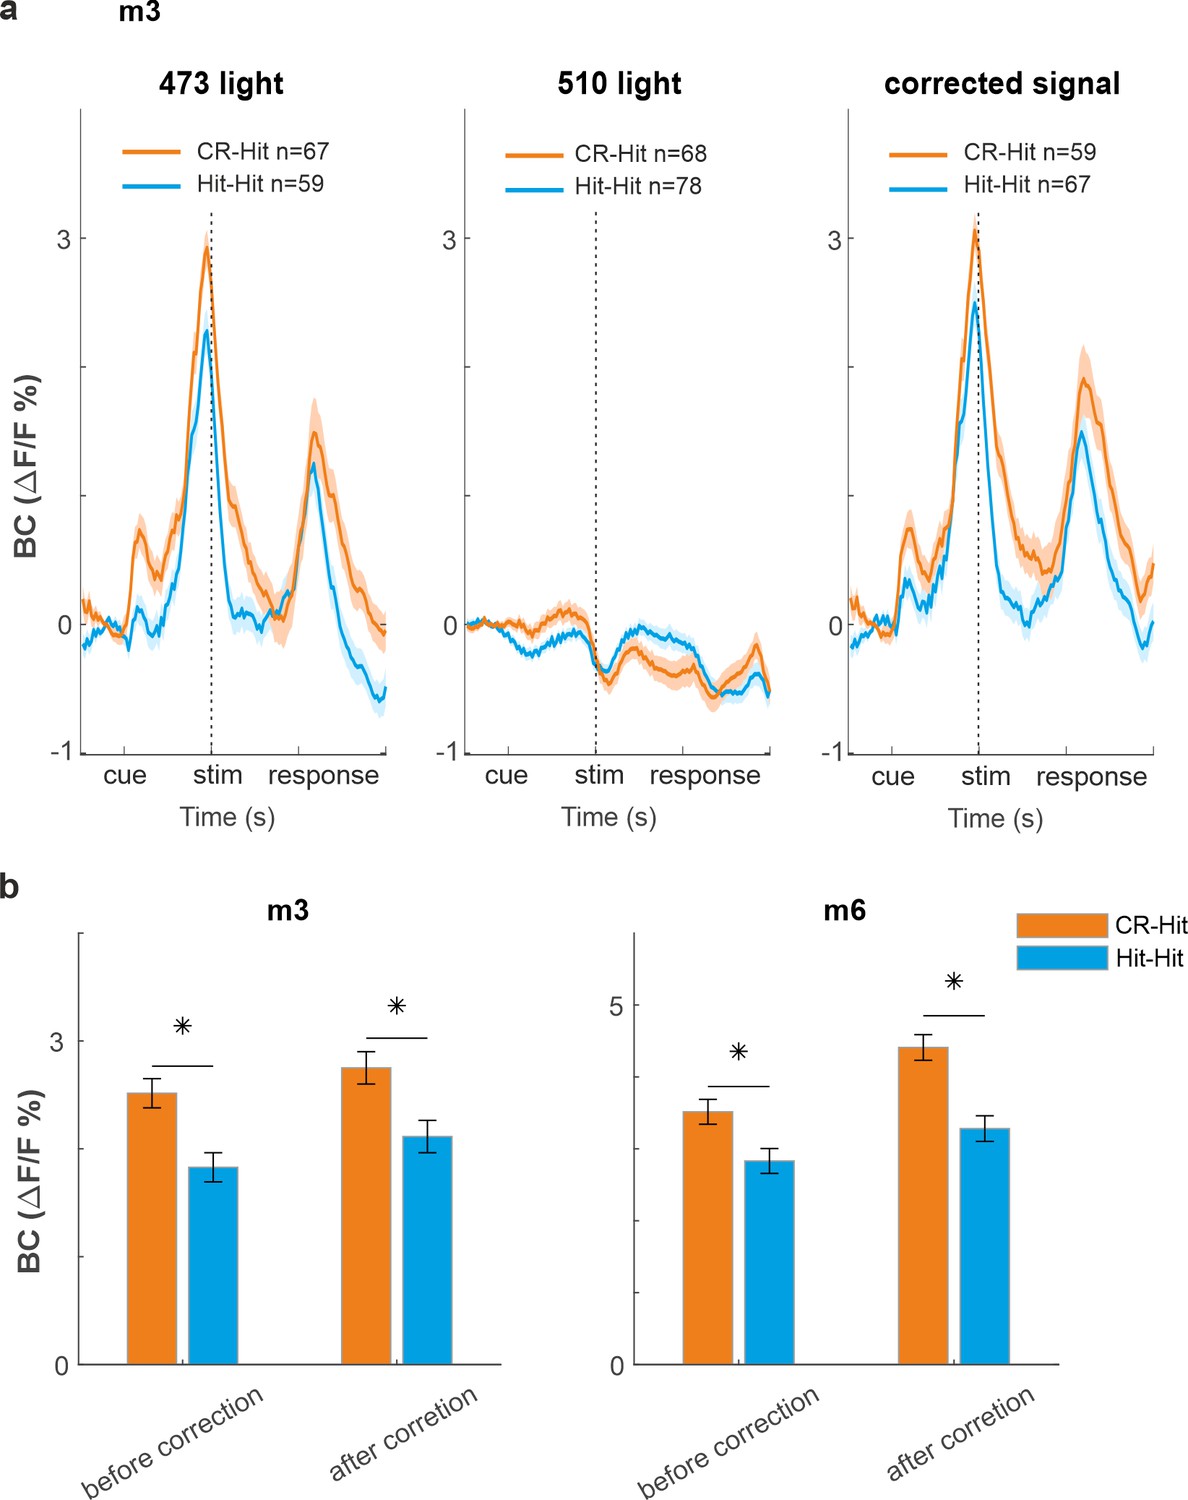
Correction for hemodynamic contamination.
(a) Response in barrel cortex (BC) during expert performance (m3) for Hit-Hit (blue) and CR-Hit (orange) during 473 nm excitation (left), 510 nm (middle), and corrected for hemodynamics (right; 473 signal minus 510 signal). The corrected signal maintains the results of the uncorrected signal, that is, higher response for CR-Hit compared to Hit-Hit. (b) Hit-Hit (blue) and CR-Hit (orange) average response in BC during the stim period (−0.2 to 0.2 s) before and after hemodynamic correction presented separately for two different mice. Error bars are standard error of the mean (SEM) over trials. Mann–Whitney U-test. *p<0.05.
Figure 2—figure supplement 3
Correction for hemodynamic signal maintains history information.
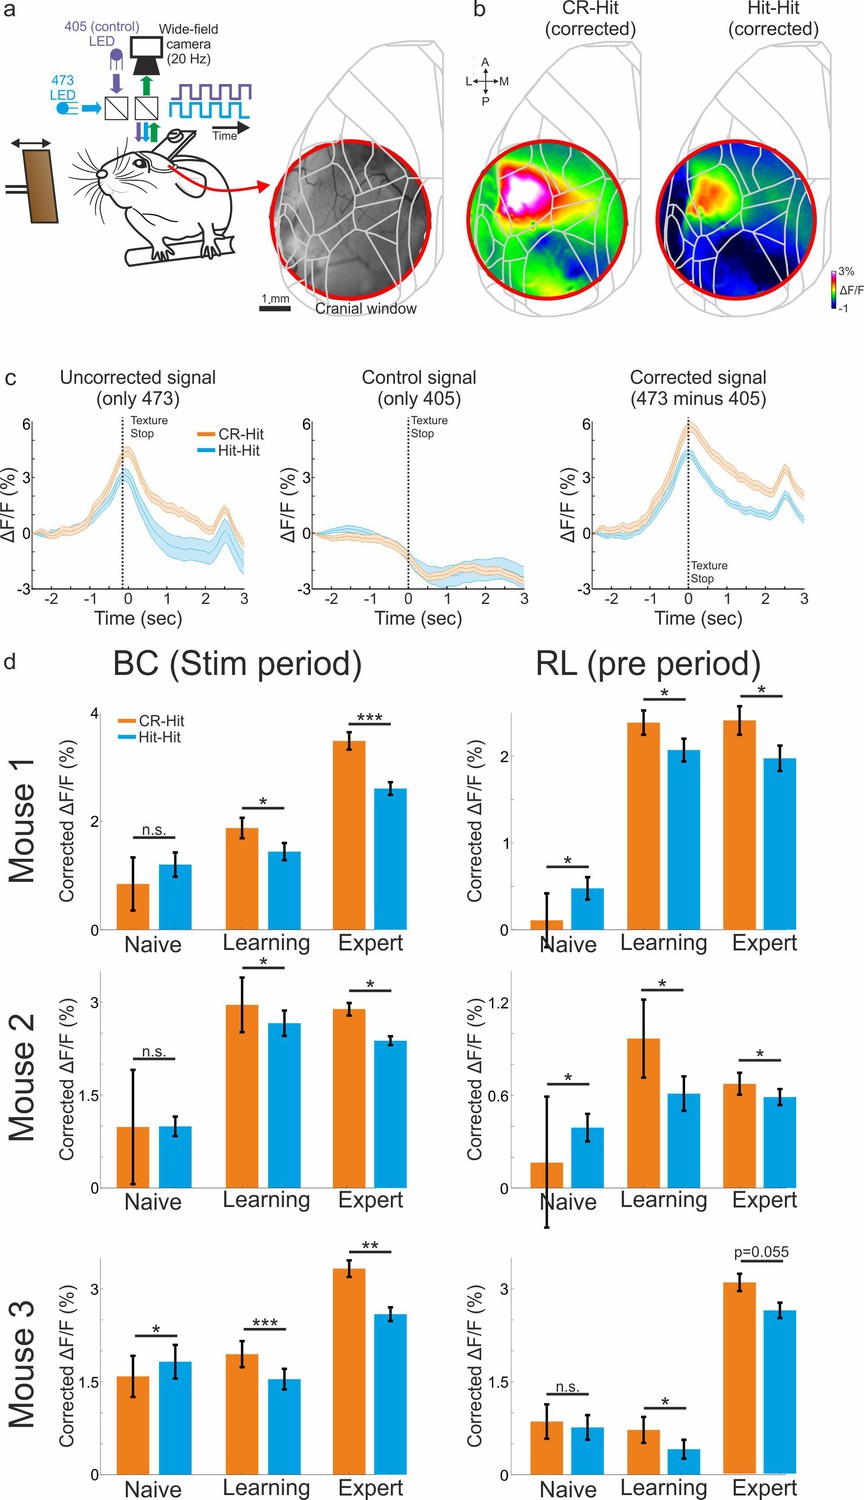
(a) We trained three additional mice while using an imaging protocol of interleaved 473 nm (blue) and 405 nm (violet, used as a control light for non-calcium dynamics). In these mice, we used a cranial window of 5 mm that covers large parts of the posterior cortex (right). (b) Example activity maps corrected for hemodynamic responses (473 minus 405 signals) averaged during the stim period for the CR-Hit (left) and Hit-Hit (right) conditions. (c) Responses for the CR-Hit (orange) and Hit-Hit (blue) in barrel cortex (BC) for the 473 nm, 405 nm and corrected signal (473 minus 405; Expert mouse). Error bars depict standard error of the mean (SEM) across trials (n = 75 and 91 trials for CR-Hit and Hit-Hit conditions). (d) Grand average responses for the CR-Hit and Hit-Hit conditions in BC during the stim period and rostrolateral (RL) during the pre period in the naive, learning, and expert phases. Each mouse is presented separately. Error bars depict SEM across trials (at least 10 trials for each condition). Mann–Whitney U-test. *p < 0.05, **p < 0.01, ***p < 0.001, n.s. – not significant.
Figure 2—figure supplement 4
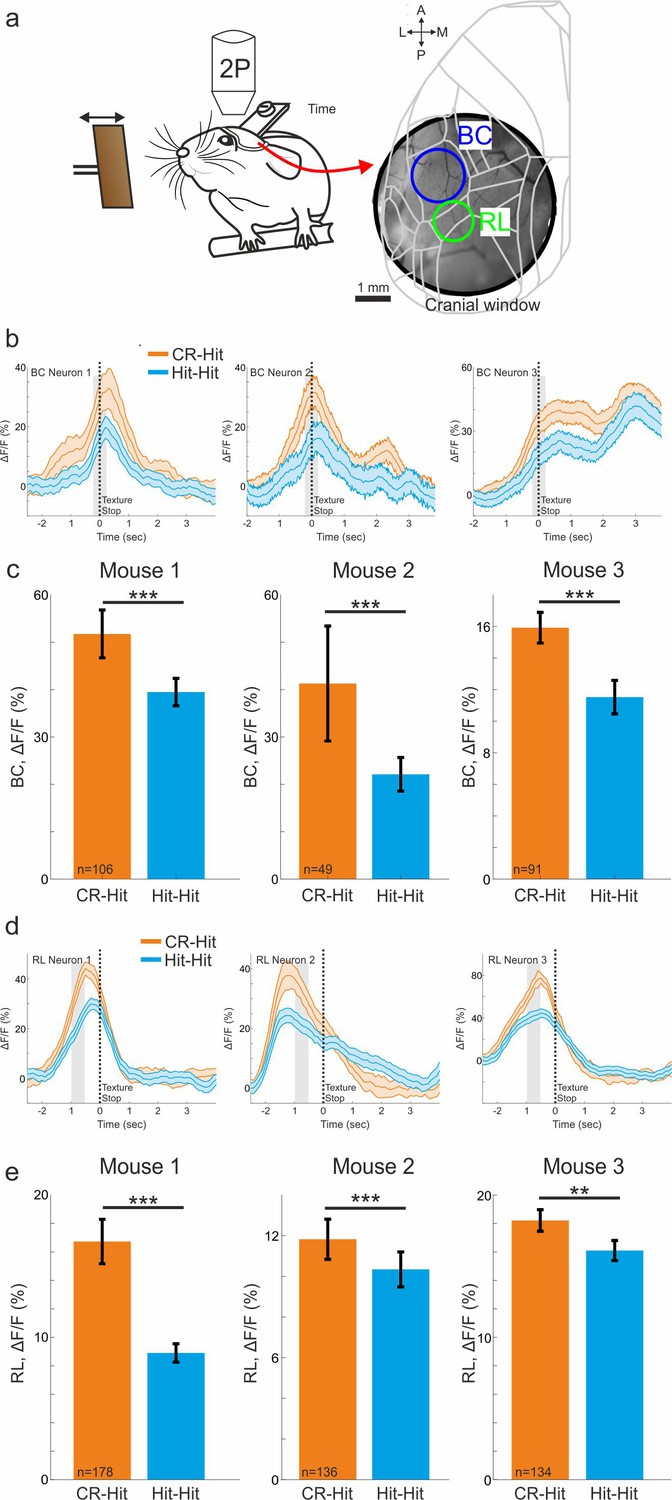
Two-photon single neurons encode trial history similar to the population signals.
(a) Three mice with a cranial window were imaged in barrel cortex (BC) and rostrolateral (RL) using a two-photon microscope. Mice performed the task during expert phase. (b) Mean response of example single neurons in BC for Hit-Hit (blue) and CR-Hit (orange) conditions. (c) Average response during the stim period for the three mice separately for Hit-Hit (blue) and CR-Hit (orange) conditions. Error bars depict standard error of the mean (SEM) across cells (number of cells shown under each bar). The results from single cells, that are not affected from hemodynamic signal, are similar to the wide-field signal. (d, e) Same as a, b but for RL during the pre period. Wilcoxon Signed-rank test. *p < 0.05, **p < 0.01, ***p < 0.001, n.s. – not significant.
Figure 2—figure supplement 5
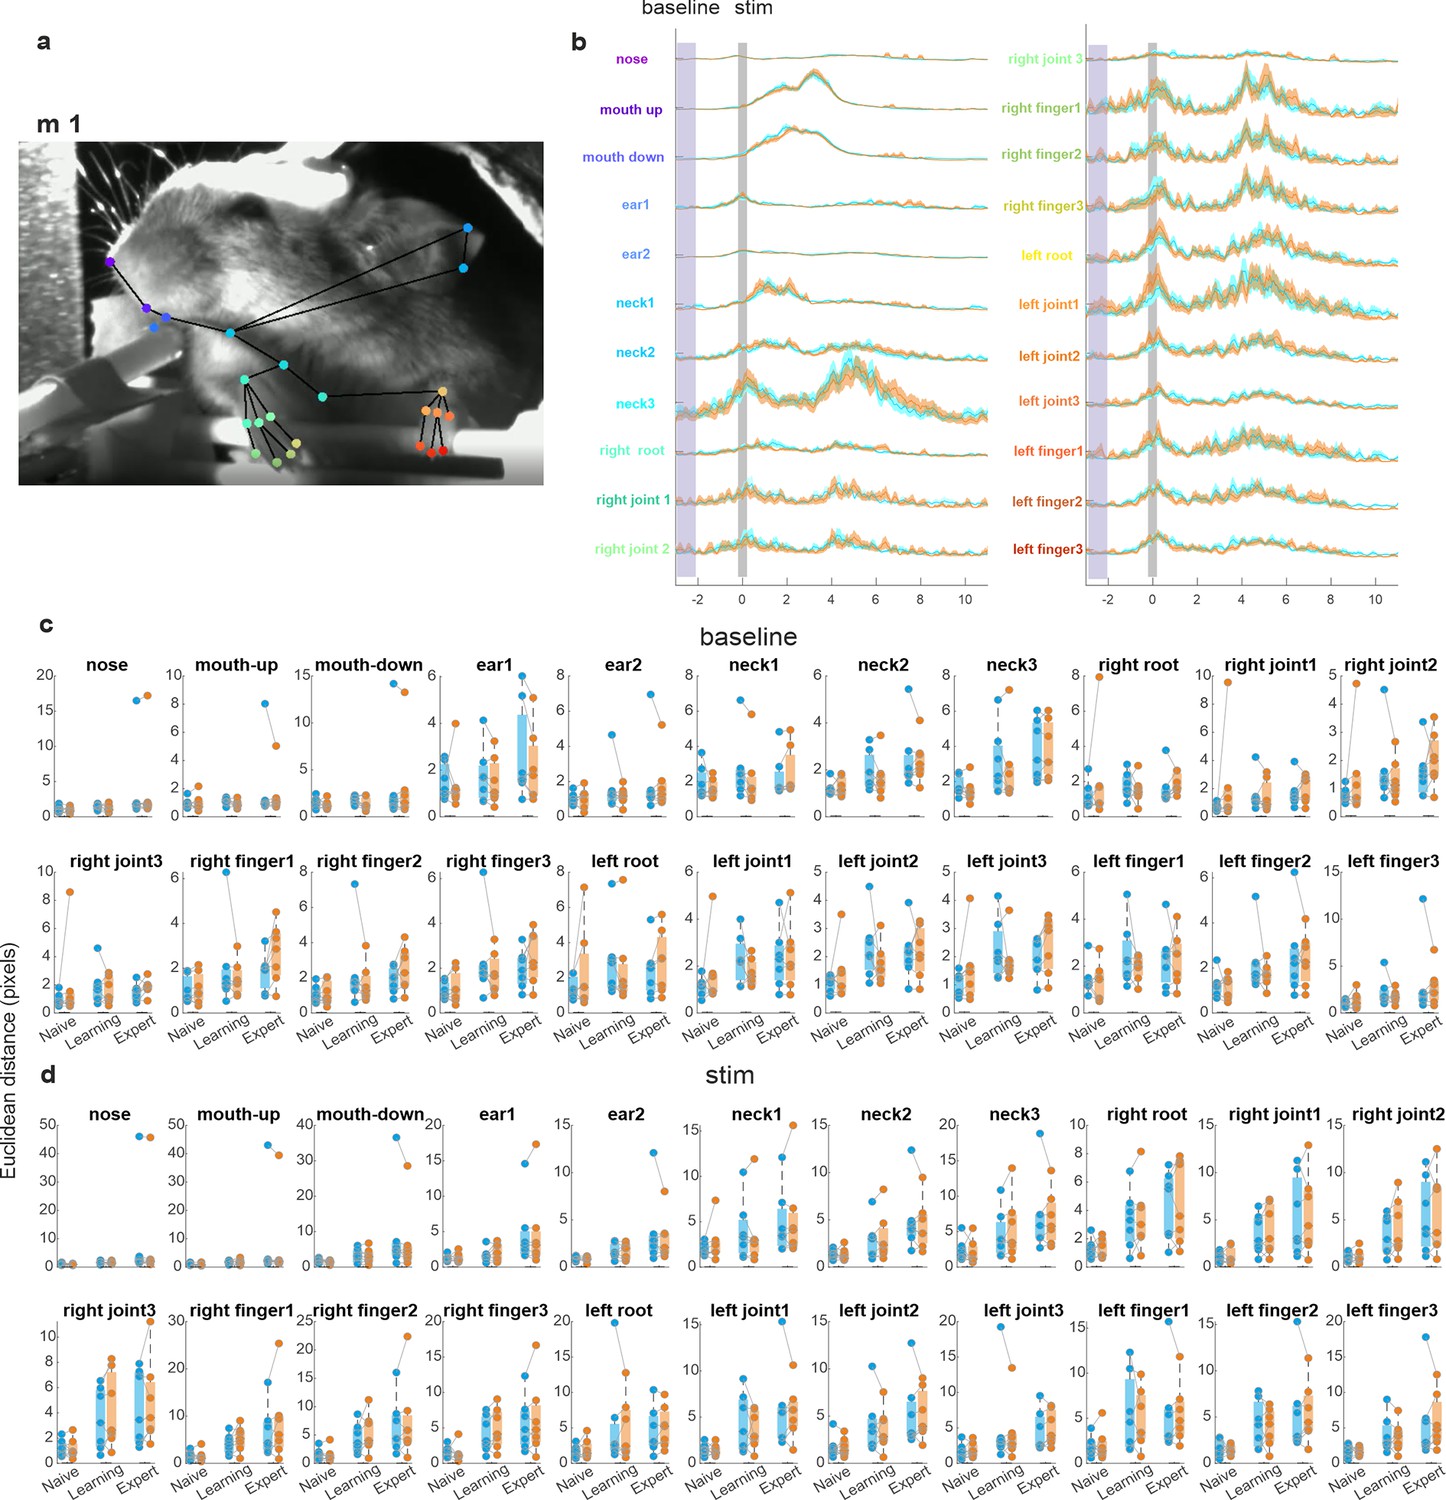
Decomposing body movements in Hit-Hit and CR-Hit conditions.
(a) A snapshot of the body camera and 22 tracking point along the mouse body. (b) Time course in an example mouse for each tracking point during CR-Hit (orange) and Hit-Hit (blue) conditions. Shaded areas depict standard error of the mean (SEM) across trials (n = 170 and 159 for CR-Hit and Hit-Hit conditions, respectively). Shaded vertical areas mark the stim period and baseline periods. (c) Average Euclidian distance (frame-to-frame) during the stim period for each tracking point in the CR-Hit (orange) and Hit-Hit (blue) conditions in the naive, learning, and expert phases. Each point depicts a mouse (n = 7). (d) Same as in c but for the baseline period. There was no significant difference between CR-Hit (orange) and Hit-Hit (blue) conditions for each tracking point in each phase. p > 0.05 Wilcoxon signed-rank phase. *p<0.05.
Figure 2—figure supplement 6
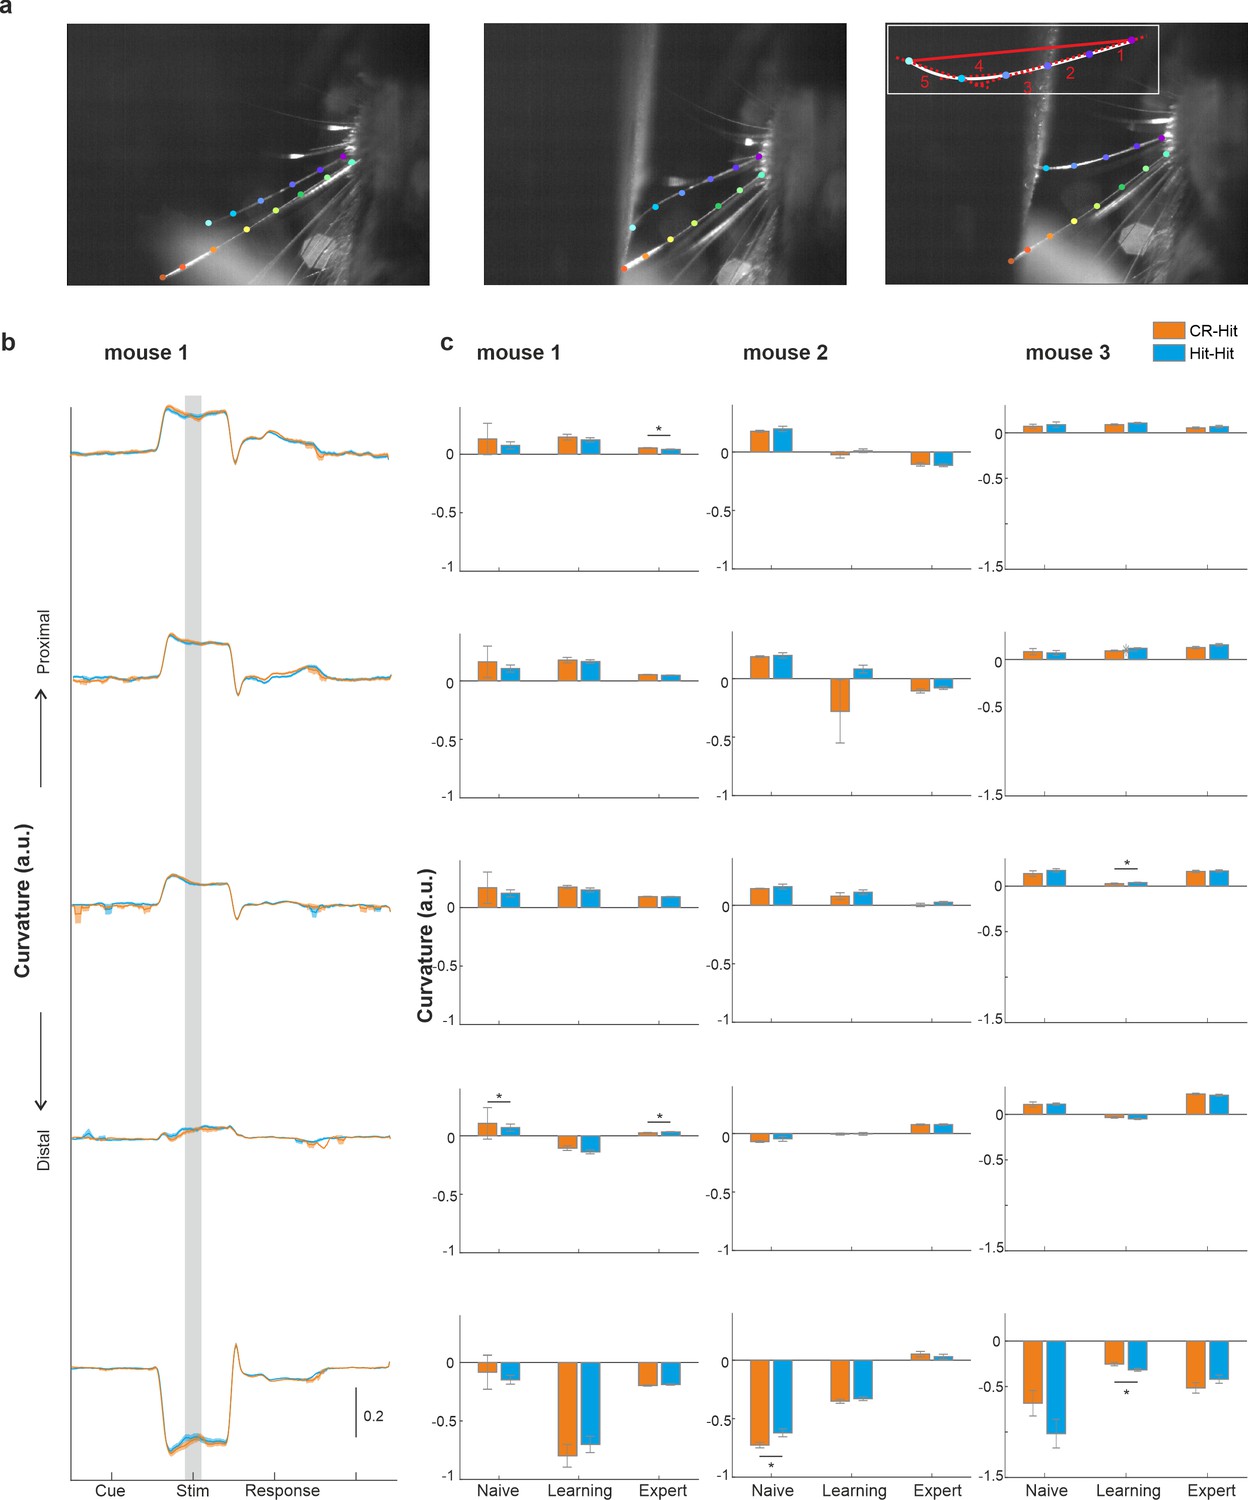
Single whisker parameters do not differ between CR-Hit and Hit-Hit.
(a) Example video frames of the whisker camera (sampled at 250 Hz in three mice). Single whiskers were tracked using DeepLabCut. We focused on the whisker which displayed the most contact with the texture. The curvature was defined for each two adjacent tracking points as the local slope divided by the general slope between the proximal and distal tracking point. (b) Curvature for each two adjacent points as a function of time (example expert mouse) for CR-Hit (orange) and Hit-Hit (blue) conditions. Shaded area depicts the stim period. (c) Average curvature during the stim period for CR-Hit (orange) and Hit-Hit (blue) conditions during naive, learning, and expert phases. Three mice shown separately. Error bars depict standard error of the mean (SEM) across trials. In general, we found no consistent difference in curvature between CR-Hit (orange) and Hit-Hit (blue) conditions. *p < 0.05; n.s. – not significant; Mann–Whitney U-test.
Figure 2—figure supplement 7

Activity in barrel cortex (BC) for other trial pairs.
Grand average of BC activity of different trial pairs in the learning phase during the stim period (−0.2:0.6 ms). Error bars are mean ± standard error of the mean (SEM) across mice (n = 7). *p < 0.05; n.s. – not significant; Wilcoxon signed-rank test.
Figure 3
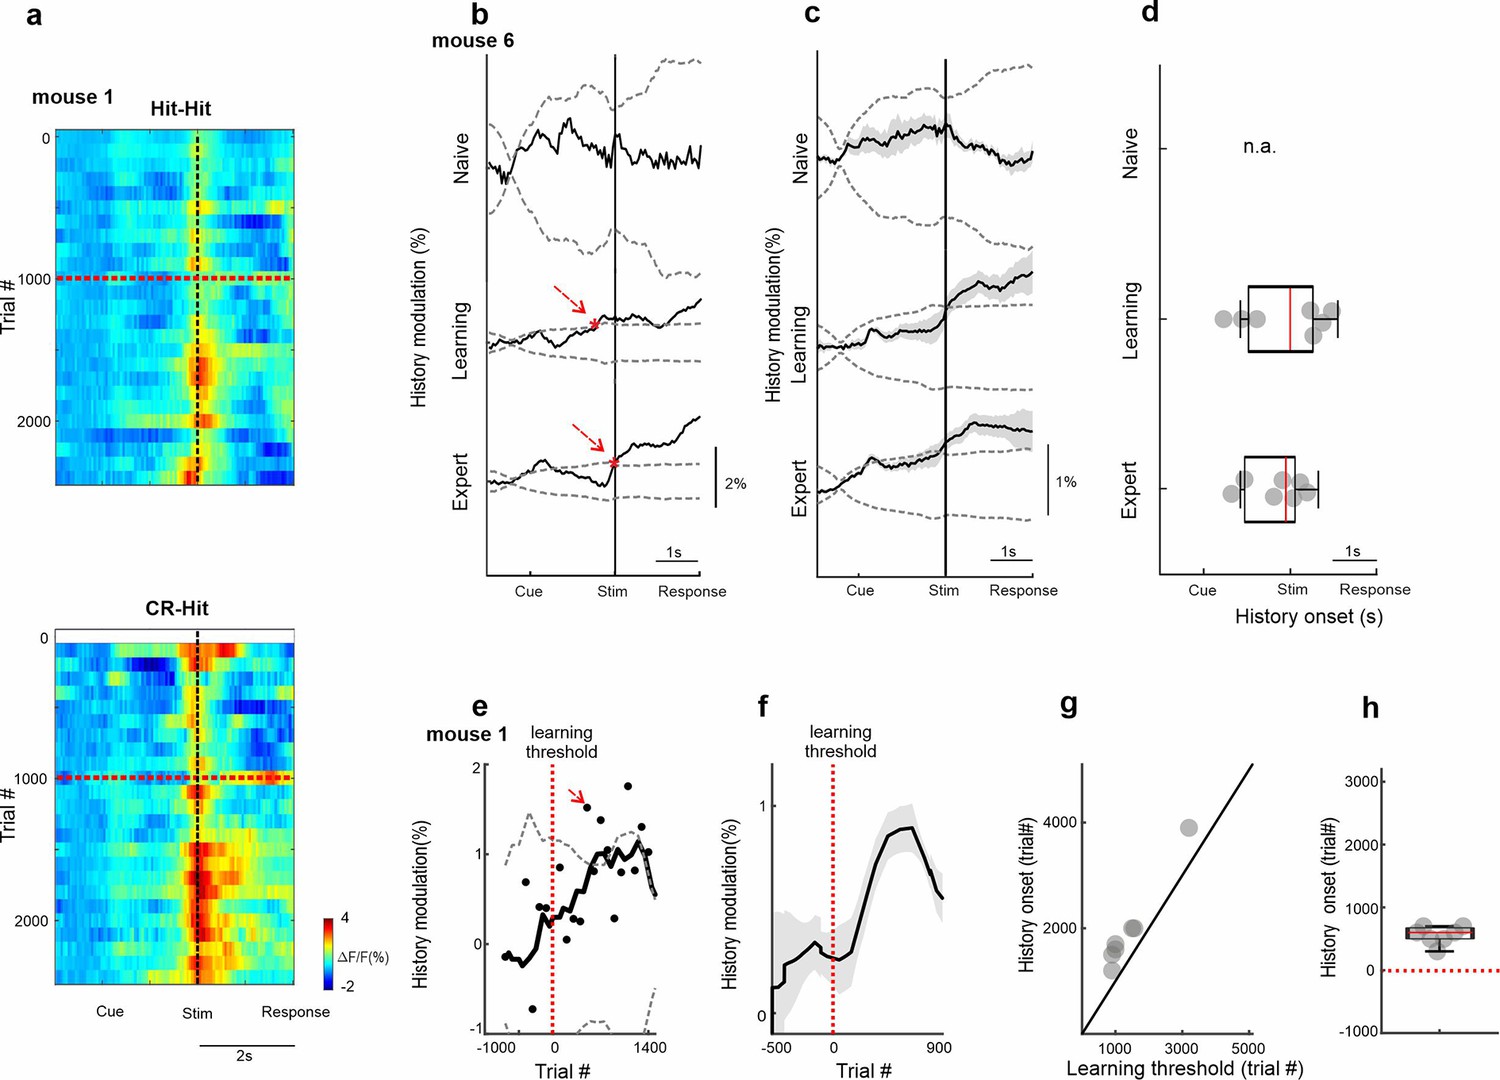
Temporal dynamics of history information in barrel cortex (BC).
(a) 2D plot of BC responses for Hit-Hit (top) and CR-Hit (bottom; trial structure on x-axis; trial number across learning in bins of 100 trials) on the y-axis. Red horizontal dashed line indicates learning threshold. Black dashed vertical line indicates the time of texture stop. (b) Example from one mouse of the history modulation (activity in CR-Hit minus activity in Hit-Hit) in BC along the trial structure in the naive, learning, and expert phases. Dashed gray line is the mean ± 2 standard deviation (SD) of the trial-shuffled data (n = 1000 iterations). The first-time frame crossing the shuffle data is defined as the onset and is marked in red. (c) Mean history modulation in BC along trial time. Error bars depict mean ± standard error of the mean (SEM) across mice (n = 7). (d) Median onset of history modulation. Error bars depict median ± SEM across mice (n = 7). (e) Example from one mouse of the history modulation along learning dimension. Dashed gray line is the mean ± 2 SD of the trial-shuffled data (n = 1000 iterations). The first-time frame crossing the shuffle data is defined as the onset for learning and is marked in red. The vertical red dashed line (trial 0) marks the learning threshold. (f) Mean history modulation in BC along the learning profile aligned to the learning threshold of each mouse (time 0). Error bars depict mean ± SEM across mice (n = 7). (g) Onset of the history modulation for learning as a function of the learning threshold. Each point is one mouse (n = 7). (h) Median onset of history modulation relative to the learning threshold. Error bars depict median ± SEM across mice (n = 7).
Figure 4 with 1 supplement
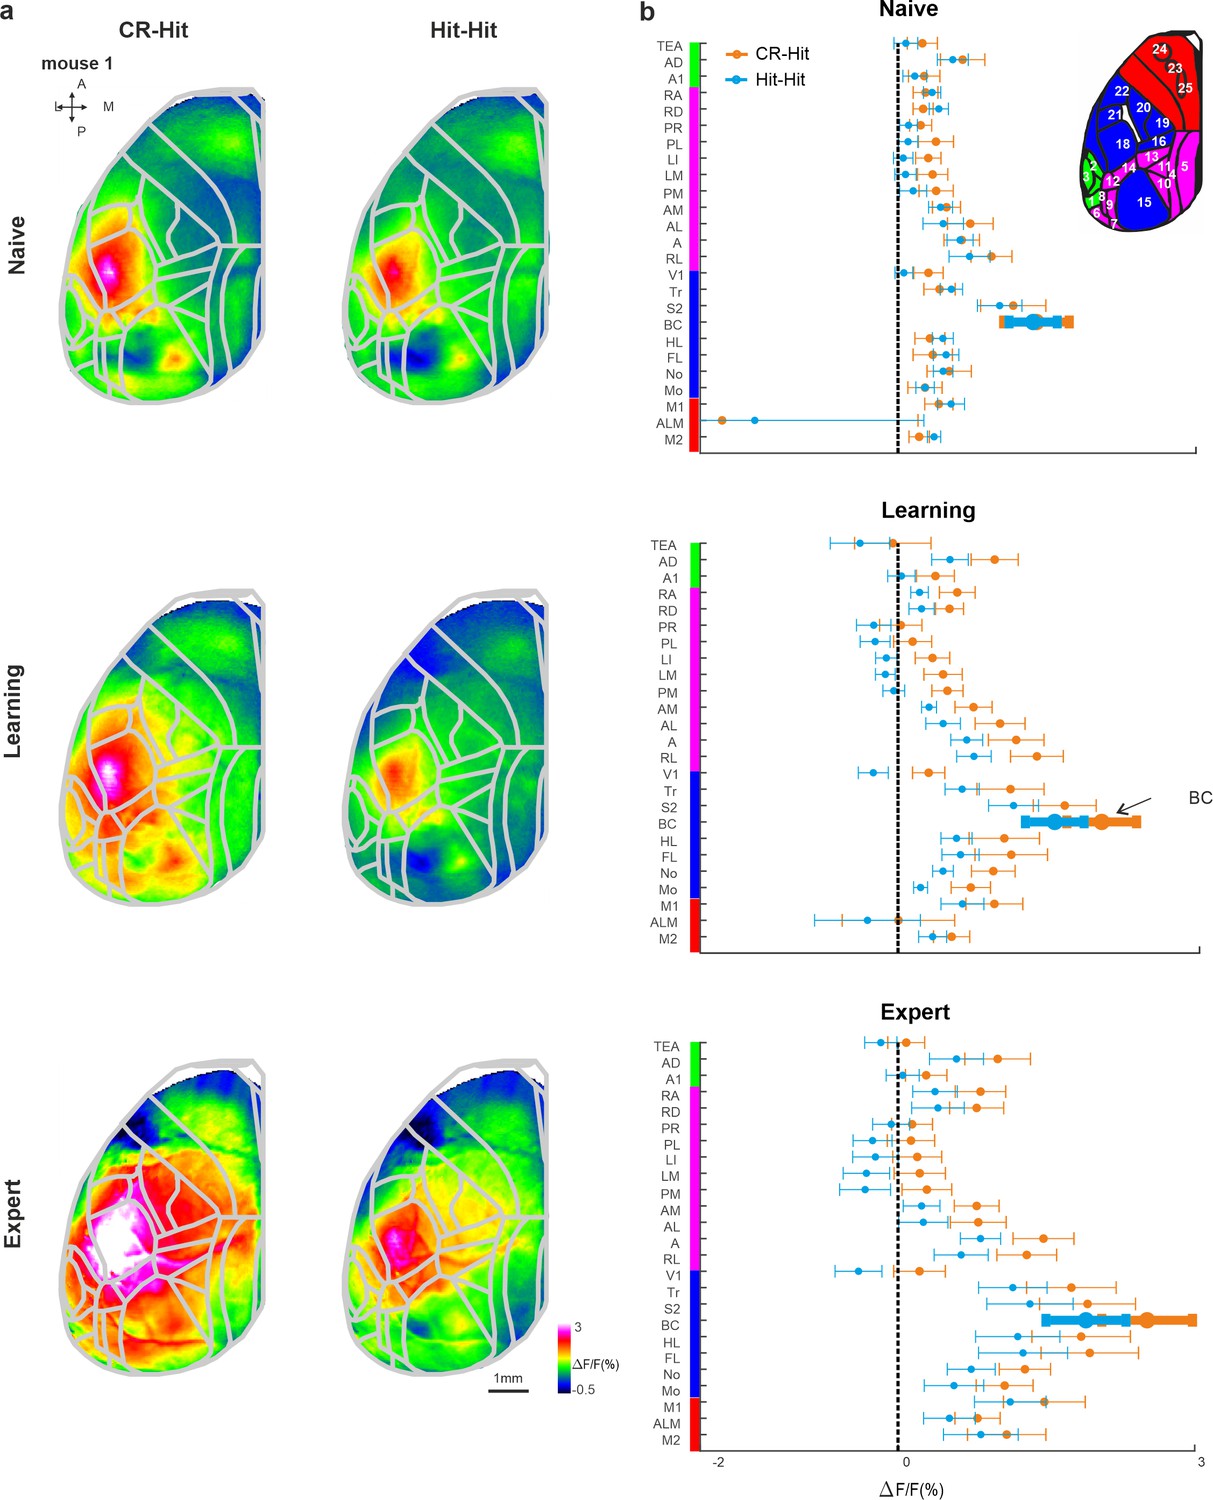
Cortex-wide history modulation during the stim period.
(a) Mean activity maps averaged within the stim period (−0.2 to 0 s relative to texture stop) of CR-Hit (left) Hit-Hit (right) during the naive (top), learning (middle), and expert (bottom) phases. Color bar denotes normalized fluorescence (∆F/F). 2D top-view atlas is superimposed in gray. (b) Grand average neuronal activity during the stim period (−0.2:0.2 s) for Hit-Hit (blue) and CR-Hit (orange) in all 25 areas for the naive (top), learning (middle), and expert (bottom) phases. Error bars depict mean ± standard error of the mean (SEM) across mice (n = 7).
Figure 4—figure supplement 1
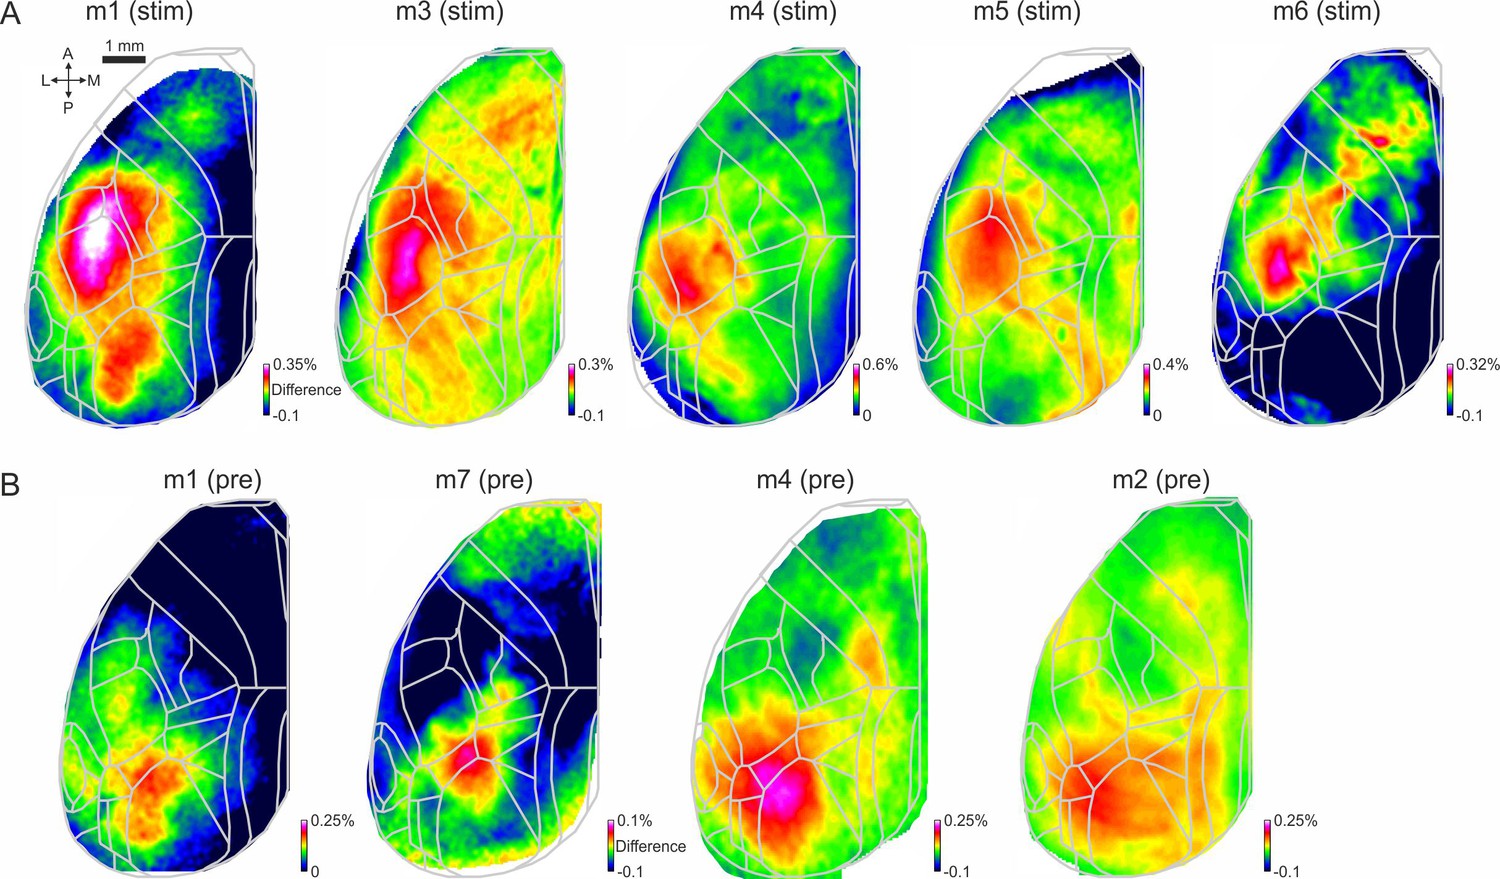
Activity difference map during stim and pre periods.
(a) Example activity difference maps (activity in CR-Hit minus activity in Hit-Hit conditions) averaged within the stim period for five example expert mice. Color denotes difference in ΔF/F. (b) Same as in A but during the pre period.
Figure 5 with 1 supplement
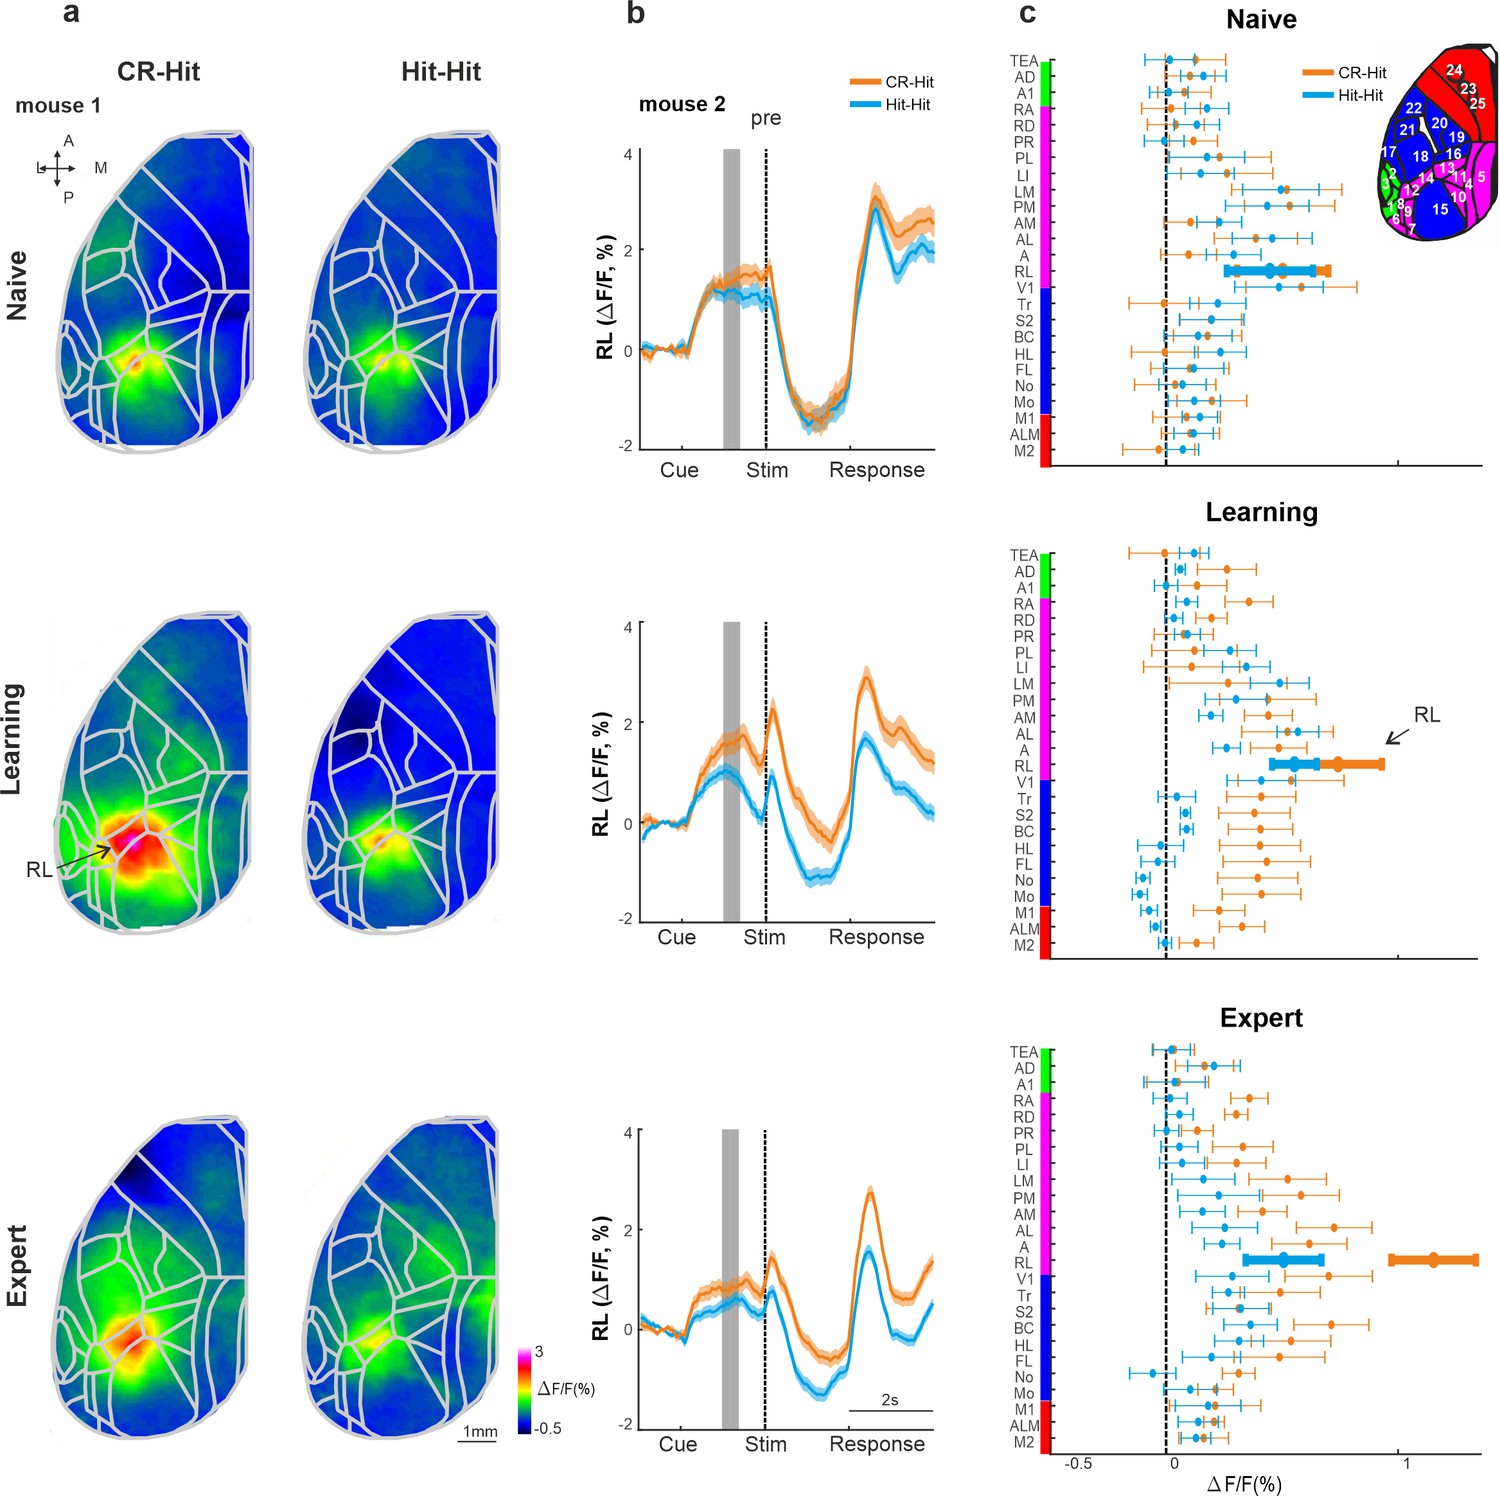
History information in rostrolateral (RL) before stimulus presentation.
(a) Mean activity maps averaged within the pre period (−1 to −0.8 s relative to texture stop) of CR-Hit (left) Hit-Hit (right) during the naive (top), learning (middle), and expert (bottom) phases. Color bar denotes normalized fluorescence (∆F/F). 2D top-view atlas is superimposed in gray. (b) Example from one mouse of average RL response of Hit-Hit (blue) and CR-Hit (orange) in the naive (top), learning (middle), and expert (bottom) phases. Shaded gray bar depicts the pre period (−1 to −0.6). Error bars are mean ± standard error of the mean (SEM) across trials (n = 51/54, 92/78, and 168/173 Hit-Hit/CR-Hit for naive, learning, and expert phases, respectively). (c) Grand average neuronal activity during the pre period (−1 to −0.6) for Hit-Hit (blue) and CR-Hit (orange) in all 25 areas for the naive (top), learning (middle), and expert (bottom) phases. Error bars depict mean ± SEM across mice (n = 7).
Figure 5—figure supplement 1

Activity in rostrolateral (RL) during the pre period.
Grand average of RL activity for Hit-Hit (blue) and CR-Hit (orange) during the pre period (−1 to −0.6 ms) for the naive, learning and expert phases. Error bars are mean ± standard error of the mean (SEM) across mice (n = 7). *p < 0.05; n.s. – not significant; Wilcoxon signed-rank test.
Figure 6
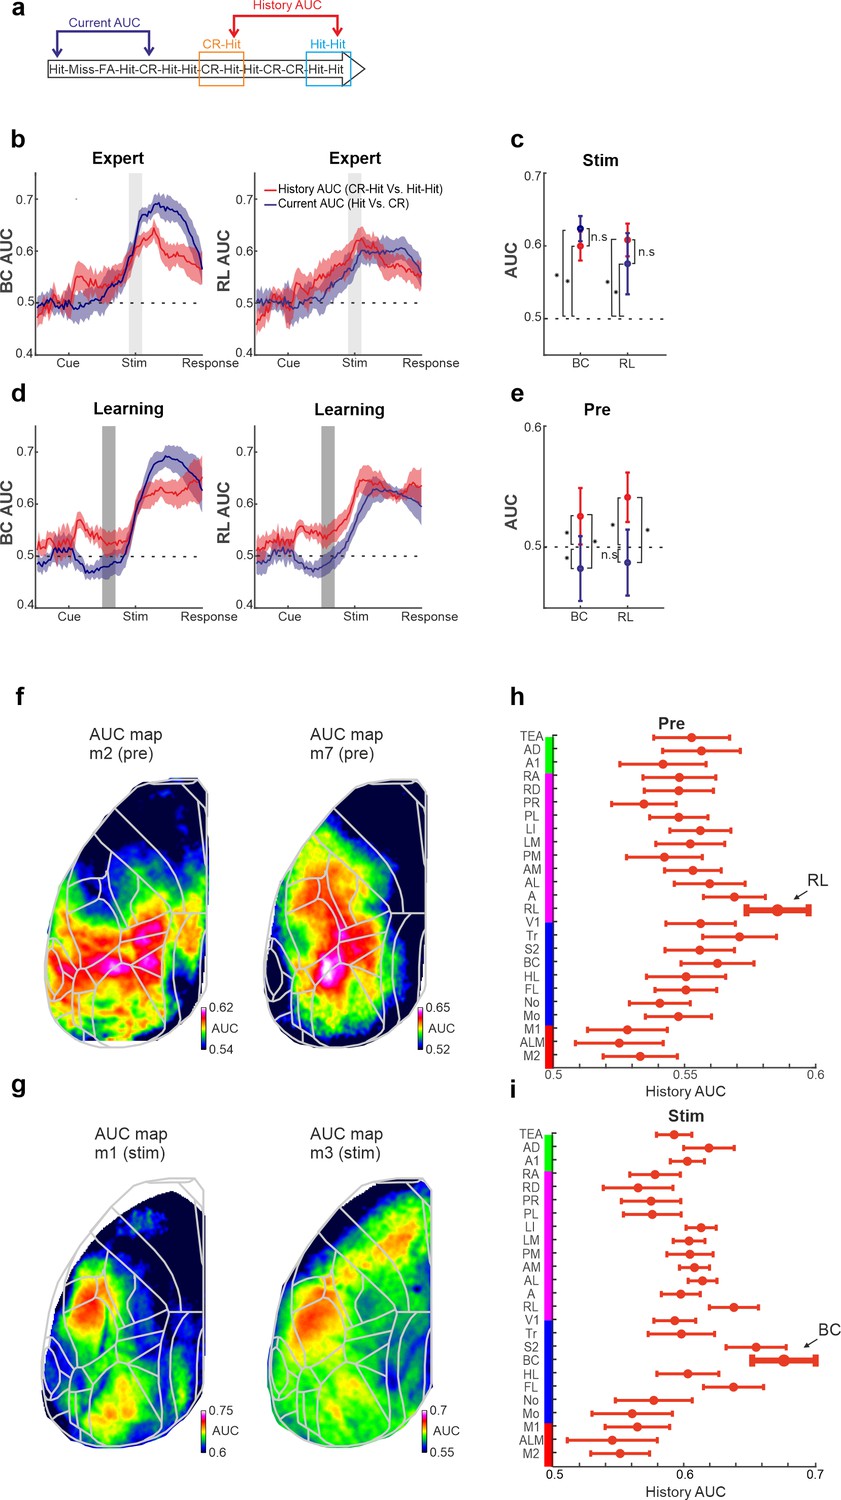
History and current information are equally discriminative at the single trial level.
(a) Schematic diagram for the two types of area under the curve (AUC) measures (derived from a receiver operating characteristics [ROC] analysis): history AUC between the Hit responses for Hit-Hit and CR-Hit trial types. Current AUC between Hit and CR trial types regardless of their history. (b) Grand average of the history (red) and current (blue) AUC measures in barrel cortex (BC; left) and rostrolateral (RL; right) along the trial structure during the expert phase. Error bars depict mean ± standard error of the mean (SEM) across mice (n = 7 ). Values significantly differ from chance (0.5) in history AUC (p < 0.05, two-tailed t-test, for both BC and RL). (c) Grand average of history and current AUC measures during the stim period in the expert phase. Error bars as in a. (d) Same as in a but for the learning phase. Error bars as in a, values significantly differ from chance (0.5) for history AUC (p < 0.05, two-tailed t-test, for both BC and RL), but not for the current AUC in RL. (e) Same as in c, but for the pre period during the learning phase. *p < 0.05; n.s. – not significant; Wilcoxon signed-rank test. (f) History AUC map examples within the pre period. Each pixel in the map depicts the history AUC value, that is, the classifier accuracy between Hit-Hit and CR-Hit conditions. (g) Same as in f but average within the stim period. (h) History AUC values during the pre period for all the 25 cortical areas. Error bars depict number of mice (seven mice). (i) Same as in h, but for the stim period.
Additional files
-
MDAR checklist
- https://cdn.elifesciences.org/articles/83702/elife-83702-mdarchecklist1-v1.pdf
-
Source code 1
Behavioral GoNoGo program.
- https://cdn.elifesciences.org/articles/83702/elife-83702-code1-v1.zip
Download links
A two-part list of links to download the article, or parts of the article, in various formats.
Downloads (link to download the article as PDF)
Open citations (links to open the citations from this article in various online reference manager services)
Cite this article (links to download the citations from this article in formats compatible with various reference manager tools)
History information emerges in the cortex during learning
eLife 12:e83702.
https://doi.org/10.7554/eLife.83702


