Identification of a conserved S2 epitope present on spike proteins from all highly pathogenic coronaviruses
- Department of Molecular Biosciences, The University of Texas at Austin, United States
- Department of Chemical Engineering, The University of Texas at Austin, United States
- Department of Chemistry and Biochemistry, The University of Texas at Dallas, United States
- Division of Chemical Biology and Medicinal Chemistry, The University of Texas at Austin, United States
- Texas Biomedical Research Institute, United States
- Laboratory of Veterinary Zoonosis, College of Veterinary Medicine, Chonnam National University, Republic of Korea
- Department of Molecular and Cell Biology, University of California, Berkeley, United States
- Biophysics Graduate Program, University of California, Berkeley, United States
- Retired, United States
- Department of Chemistry, University of California, Berkeley, United States
- LaMontagne Center for Infectious Diseases, The University of Texas at Austin, United States
Figures
Figure 1 with 6 supplements
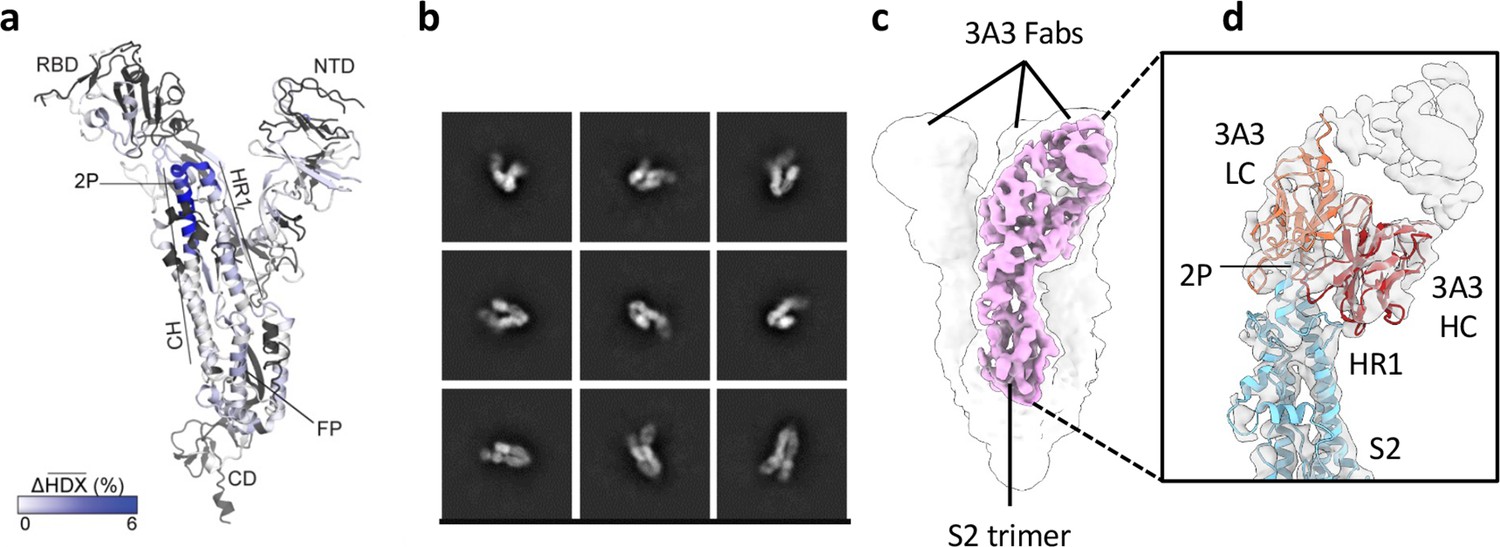
The hinge epitope spans the HR1/CH helices at the S2 apex.
(a) Monomeric SARS-2 2P spike (PDBID: 6VSB chain B) colored according to the HDX difference in deuterium fractional uptake between SARS-2 HexaPro spike alone and with 3A3 IgG at 102 s exchange. Residues lacking coverage are indicated in black. The figure was prepared using DynamX per residue output without statistics and PyMOL. (b) Cryo-EM 2D class averages of the SARS-2 S2 subunit bound to the 3A3 Fab. (c) Cryo-EM 3D reconstruction of the S2–3A3 Fab complex showing each S2 protomer binding one 3A3 Fab molecule. The pink 3D volume was generated from a focused refinement of one S2 protomer and 3A3 Fab. (d) A structure of the S2 subunit and a predicted structure of the 3A3 Fab shown as ribbons and fit into the cryo-EM map. The 3A3 Fab light (LC, orange) and heavy (HC, red) chains sandwich the apex of the spike S2 hinge (cyan).
-
Figure 1—source data 1
HDX summary table for spike peptides.
- https://cdn.elifesciences.org/articles/83710/elife-83710-fig1-data1-v3.zip
Figure 1—figure supplement 1
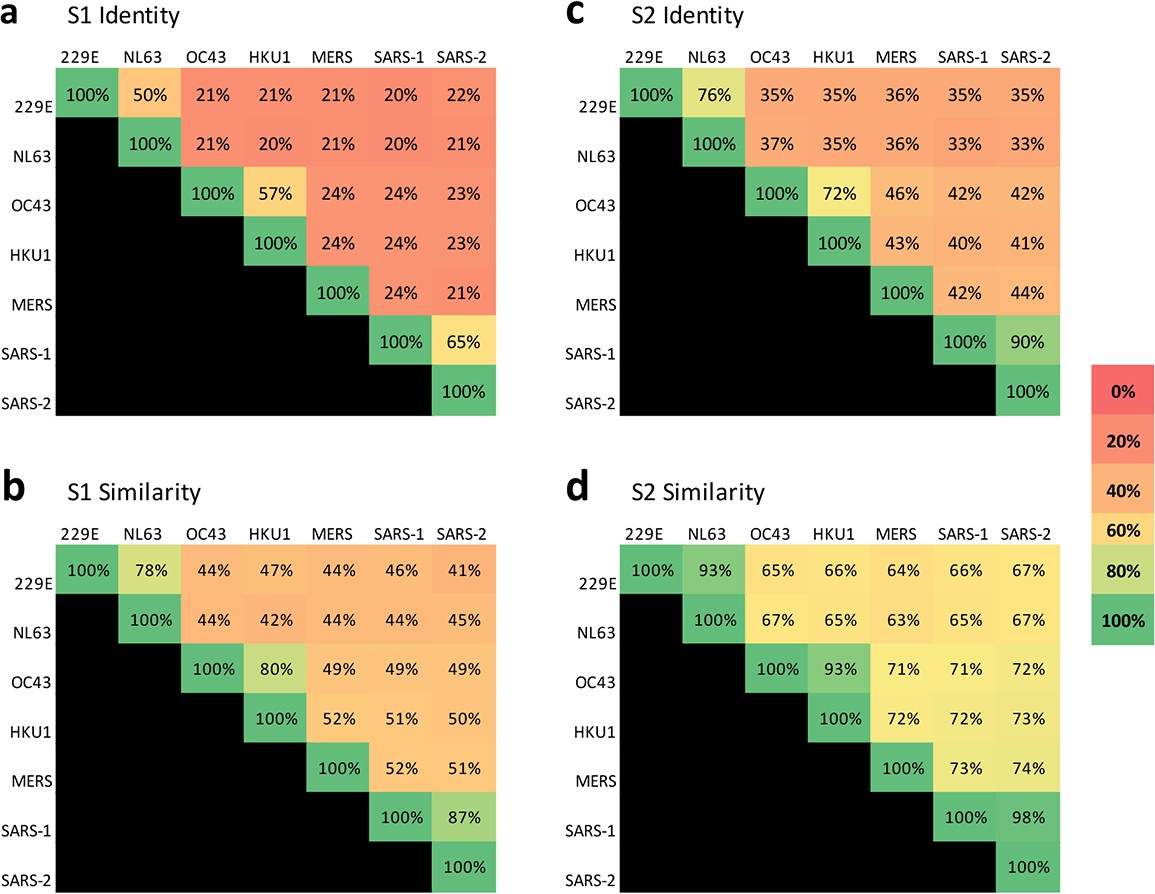
Sequence conservation is higher in the S2 domain than the S1 domain across coronaviruses that infect humans.
Percent sequence identity and similarity between the spike (a and c, respectively) S1 subunits and (b and d, respectively) S2 subunits of the seven coronaviruses known to infect humans were analyzed using LALIGN/PLALIGN local alignment. The default values of the gap penalties of open = –12 and gap = –2 were used for S2 alignments but reduced to open = –10 and gap = –1 to allow for variable domain lengths in S1. GenBank protein sequence identification numbers (protein_id) used in these alignments were: NP_073551.1 for 229E, AFD64754.1 for NL63, BBA20979.1 for OC43, BBA20986.1 for HKU1, YP_009047204.1 for MERS, AYV99817.1 for SARS-1–1, and YP_009724390.1 for SARS-2.
Figure 1—figure supplement 2
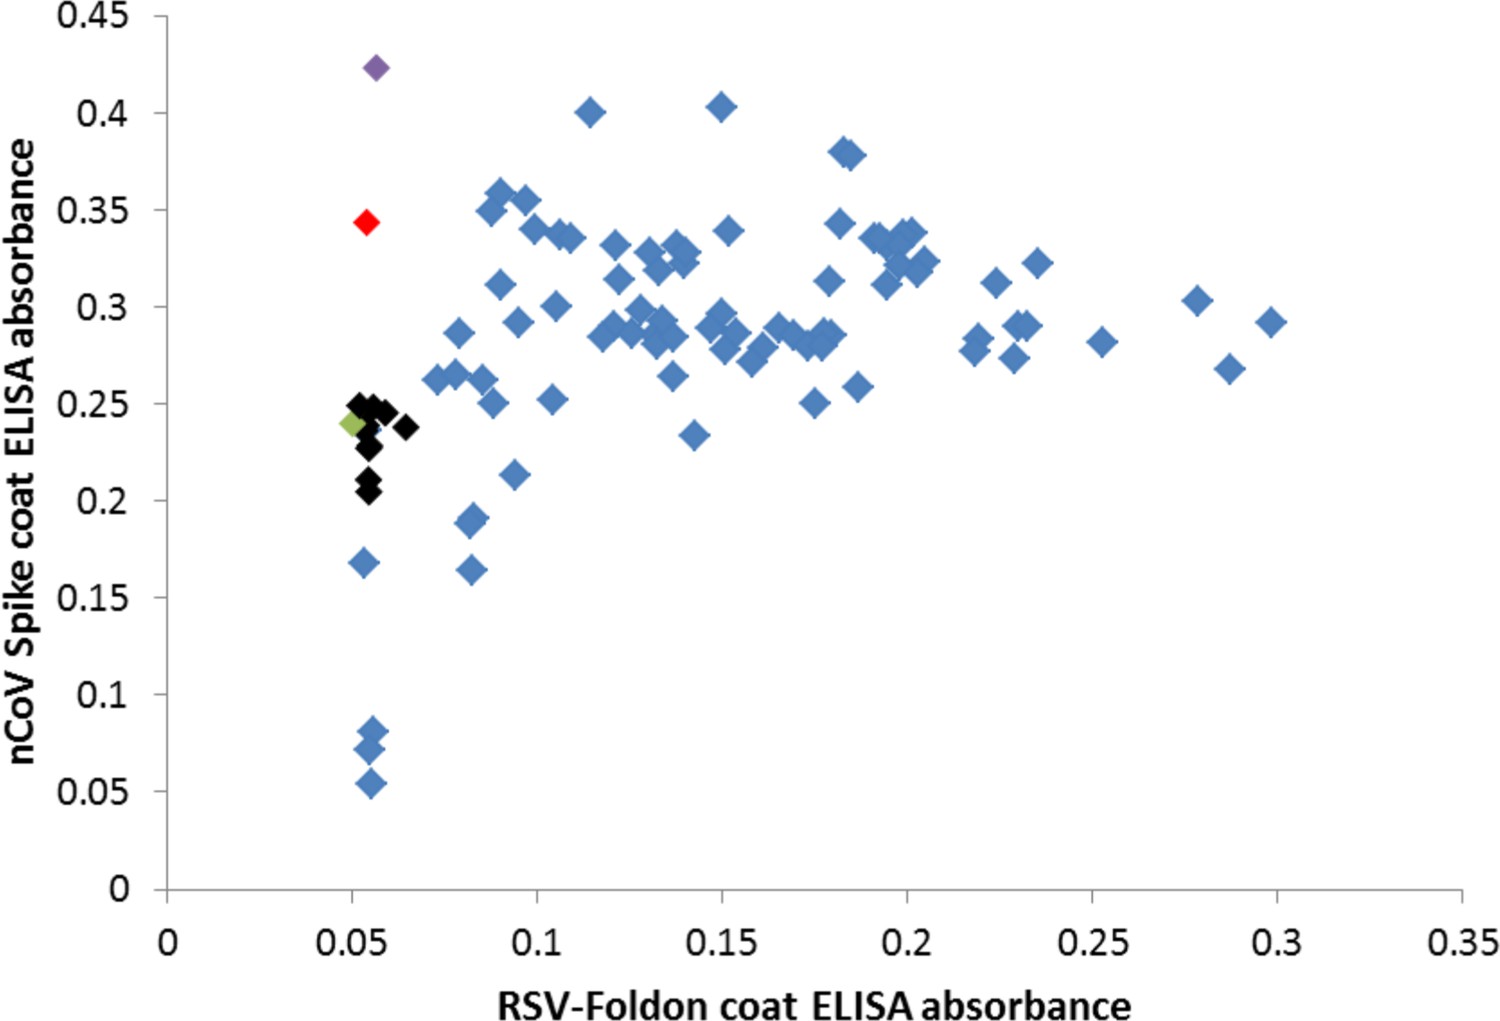
Many cross-reactive scFv-phage target the foldon domain.
Most monoclonal phage tested by ELISA on SARS-2 spike or the unrelated RSV F foldon-coated plates had cross-reactive binding, indicating targeting of the shared foldon domain. After round 4 of panning, these data show 3A3 in black, a close relative of 3A3 (two amino acid changes) in green, two other unique antibodies in red and purple, and foldon binders with closely related CDRH3 sequences in blue.
Figure 1—figure supplement 3
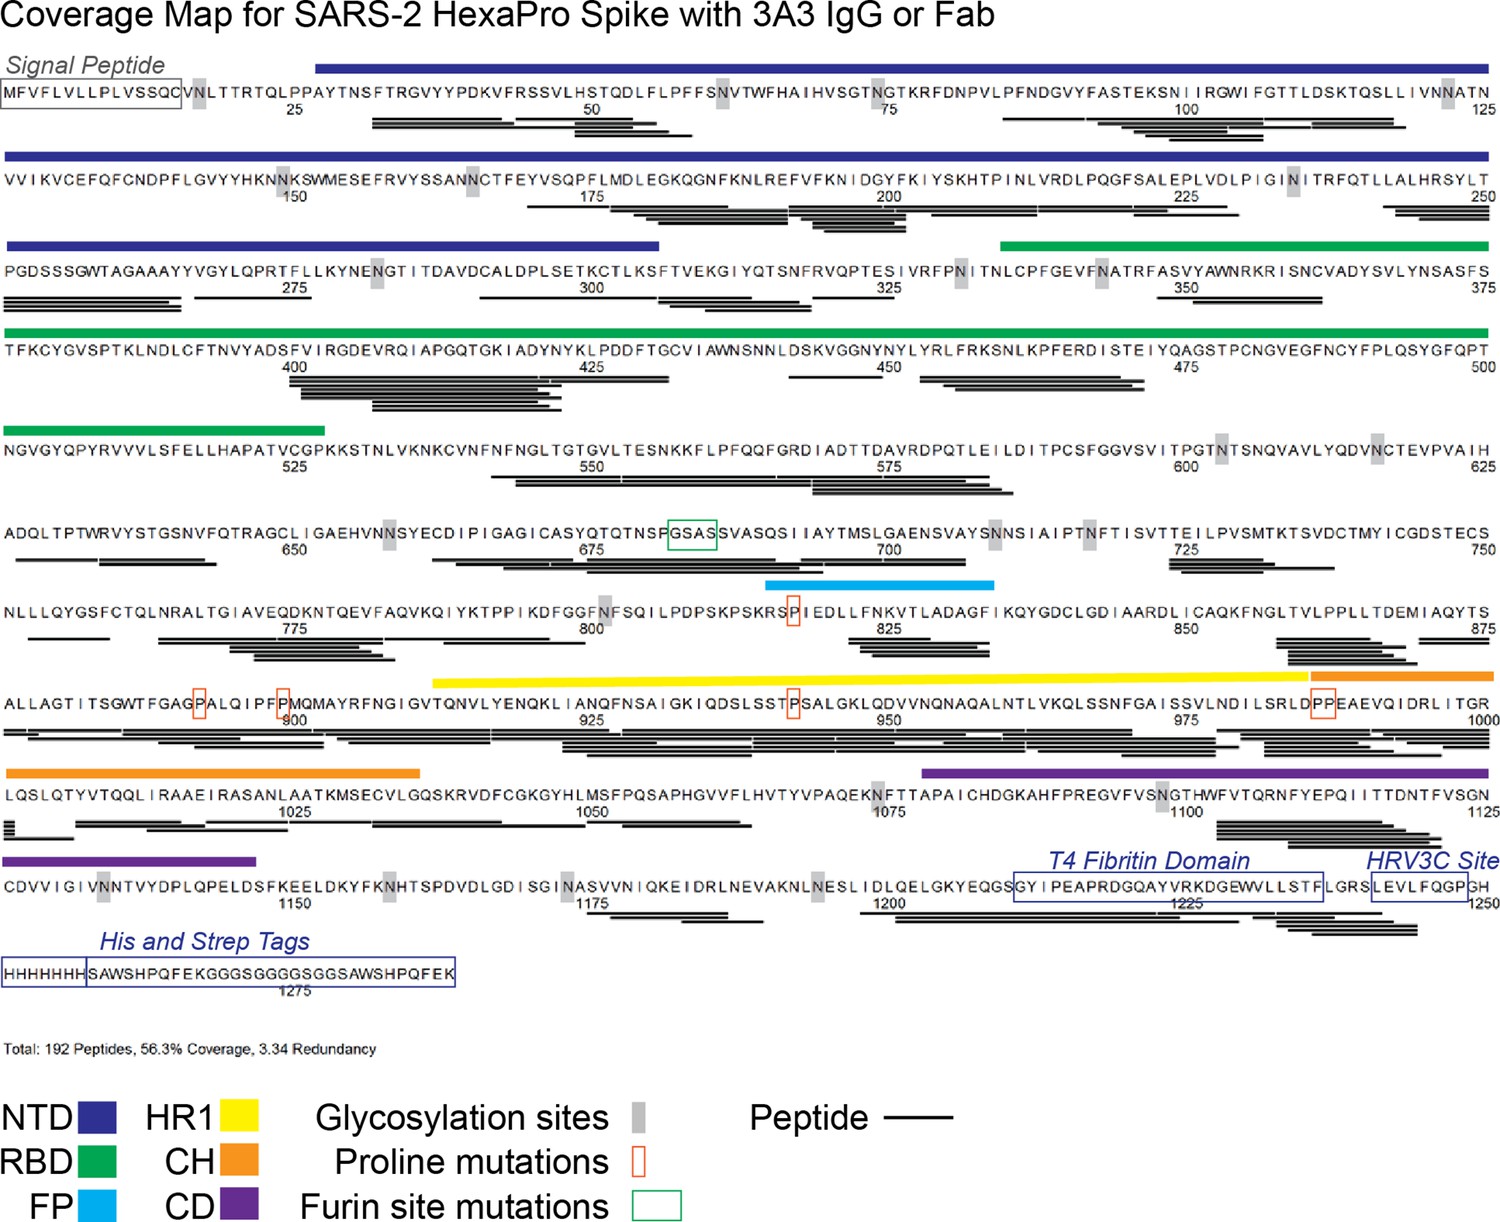
Peptides monitored through all timepoints of deuteration for SARS-2 HexaPro spike alone and with 3A3 IgG or Fab.
A total of 192 peptides were monitored, covering 56.3% of the SARS-2 HexaPro spike sequence and averaging 3.34 redundancy per amino acid. All peptides were manually checked. SARS-2 spike features are indicated on the sequence, including glycosylation sites. Glycosylation was not included in the peptide search, so no peptides are recovered surrounding these sites.
Figure 1—figure supplement 4
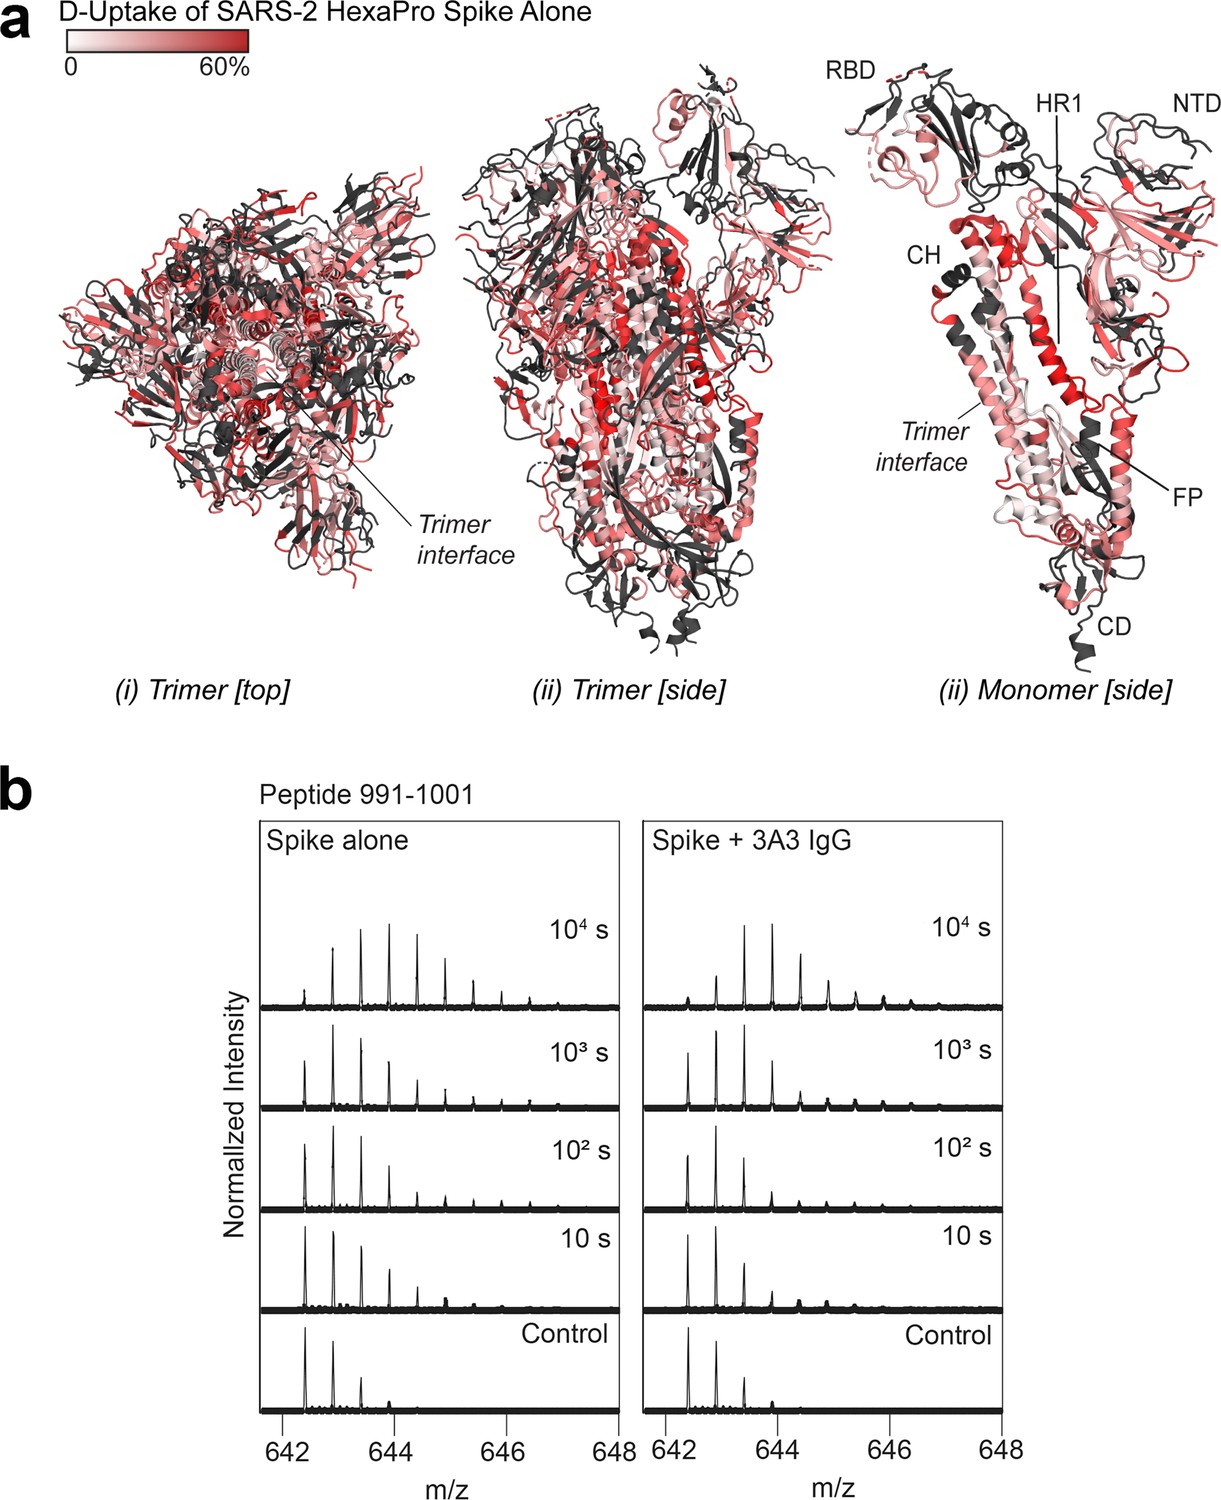
Deuterium uptake of SARS-2 HexaPro spike alone suggests the trimer is maintained under HDX conditions.
(a) Trimeric (i and ii) and monomeric (iii) SARS-2 2P spike (PDB: 6VSB) colored according to fractional deuterium uptake of the SARS-2 HexaPro spike alone after 103 s of exchange. The figure was prepared using DynamX per residue output and PyMOL. Residues lacking coverage are indicated in black. Structural features are labeled, including the central trimer interface that shows relatively low deuterium incorporation. (b) Spectra from a spike peptide spanning residues 991–1001, within the 3A3 epitope. The spectra show the width of isotopic distributions in the deuterated samples suggestive of conformational heterogeneity.
Figure 1—figure supplement 5
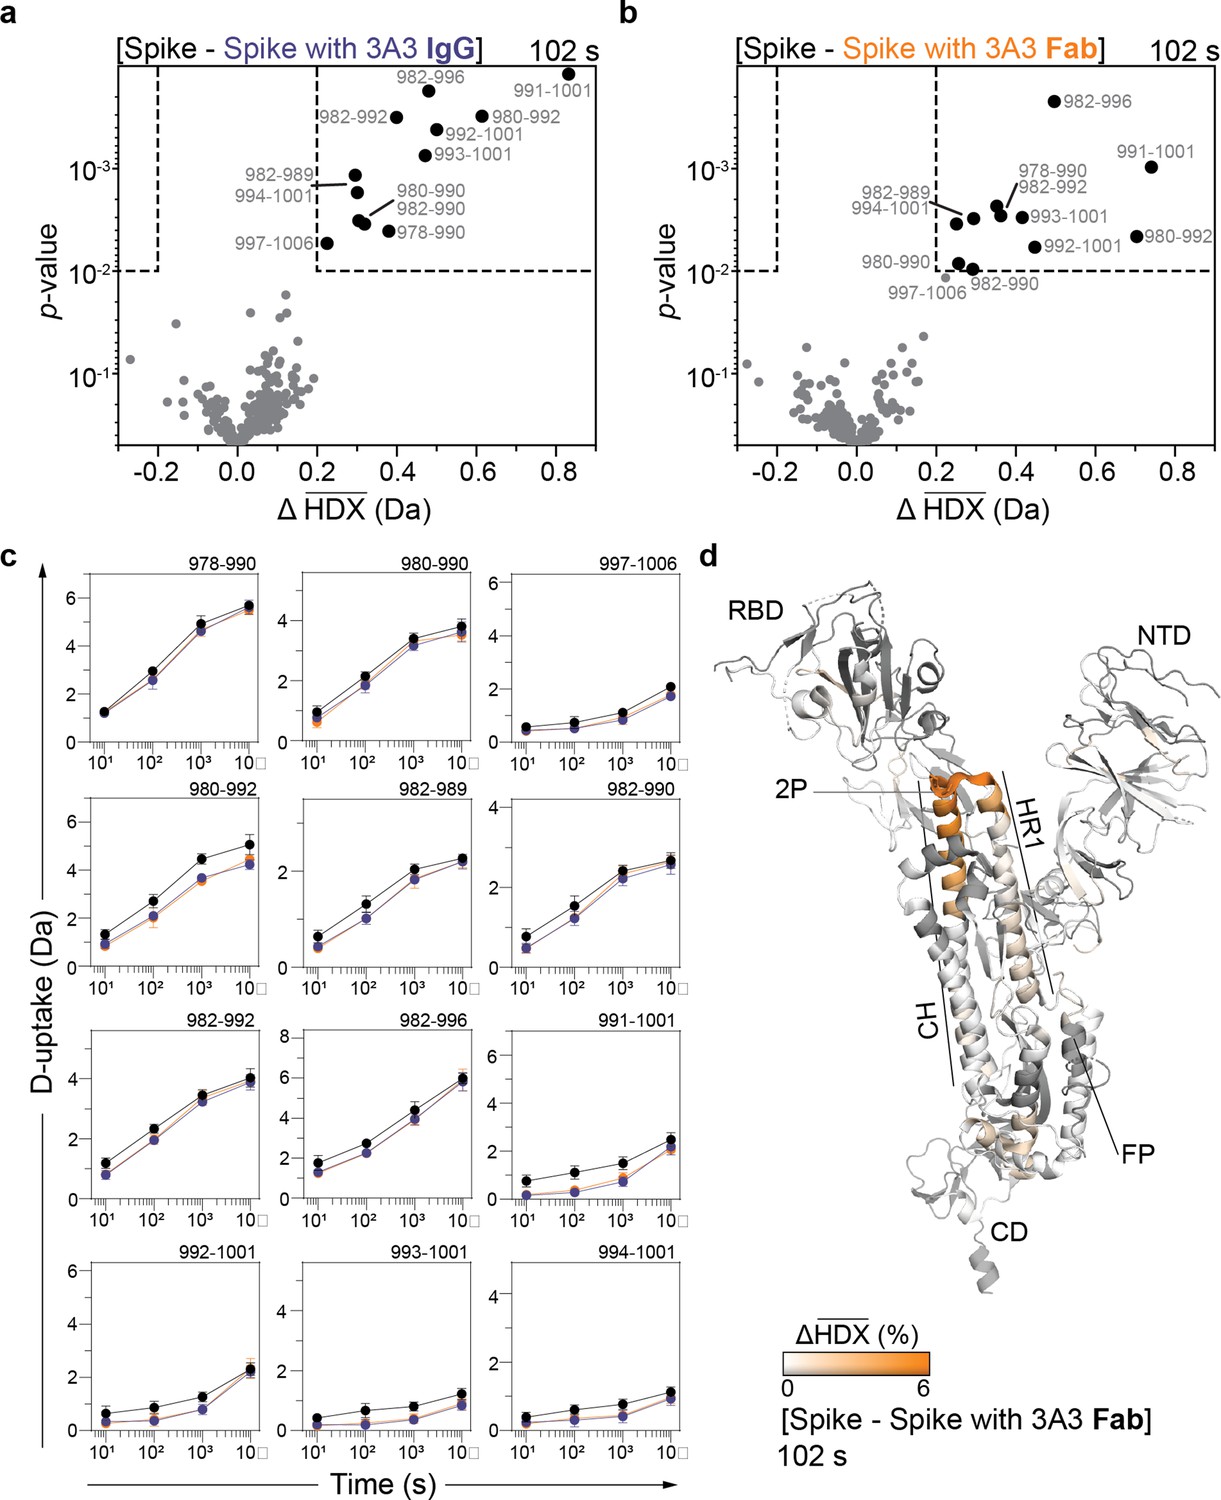
HDX identified the apex of the S2 domain as the 3A3 epitope.
Volcano plots showing changes in deuterium uptake in SARS-2 HexaPro spike peptides upon addition of (a) 3A3 IgG or (b) Fab after 102 s exchange. Significance cutoffs are an average change in deuterium uptake greater than 0.2 Da and a p-value less than 10–2 in a Welch’s t-test (hatched box). Black dots indicate peptides with a significant decrease in deuterium uptake and their residue boundaries are labeled. (c) Uptake plots for these peptides are shown. Traces are SARS-2 HexaPro spike alone (black), with 3A3 IgG (blue), and with 3A3 Fab (orange). Error bars are ± 2σ from three or four technical replicates and sometimes too small to be visible. The y-axis is 70% of max deuterium uptake assuming the N-terminal residue undergoes complete back-exchange. Data have not been corrected for back-exchange. (d) The difference in deuterium fractional uptake between SARS-2 HexaPro spike alone and with 3A3 Fab at 102 s exchange is projected onto monomeric SARS-2 2P spike (PDB: 6VSB chain B). Image was prepared using DynamX per residue output without statistics and PyMOL. Residues lacking coverage are indicated in black. Structural features are labeled, including the 2P mutations at residues 986 and 987 (shown as sticks).
Figure 1—figure supplement 6
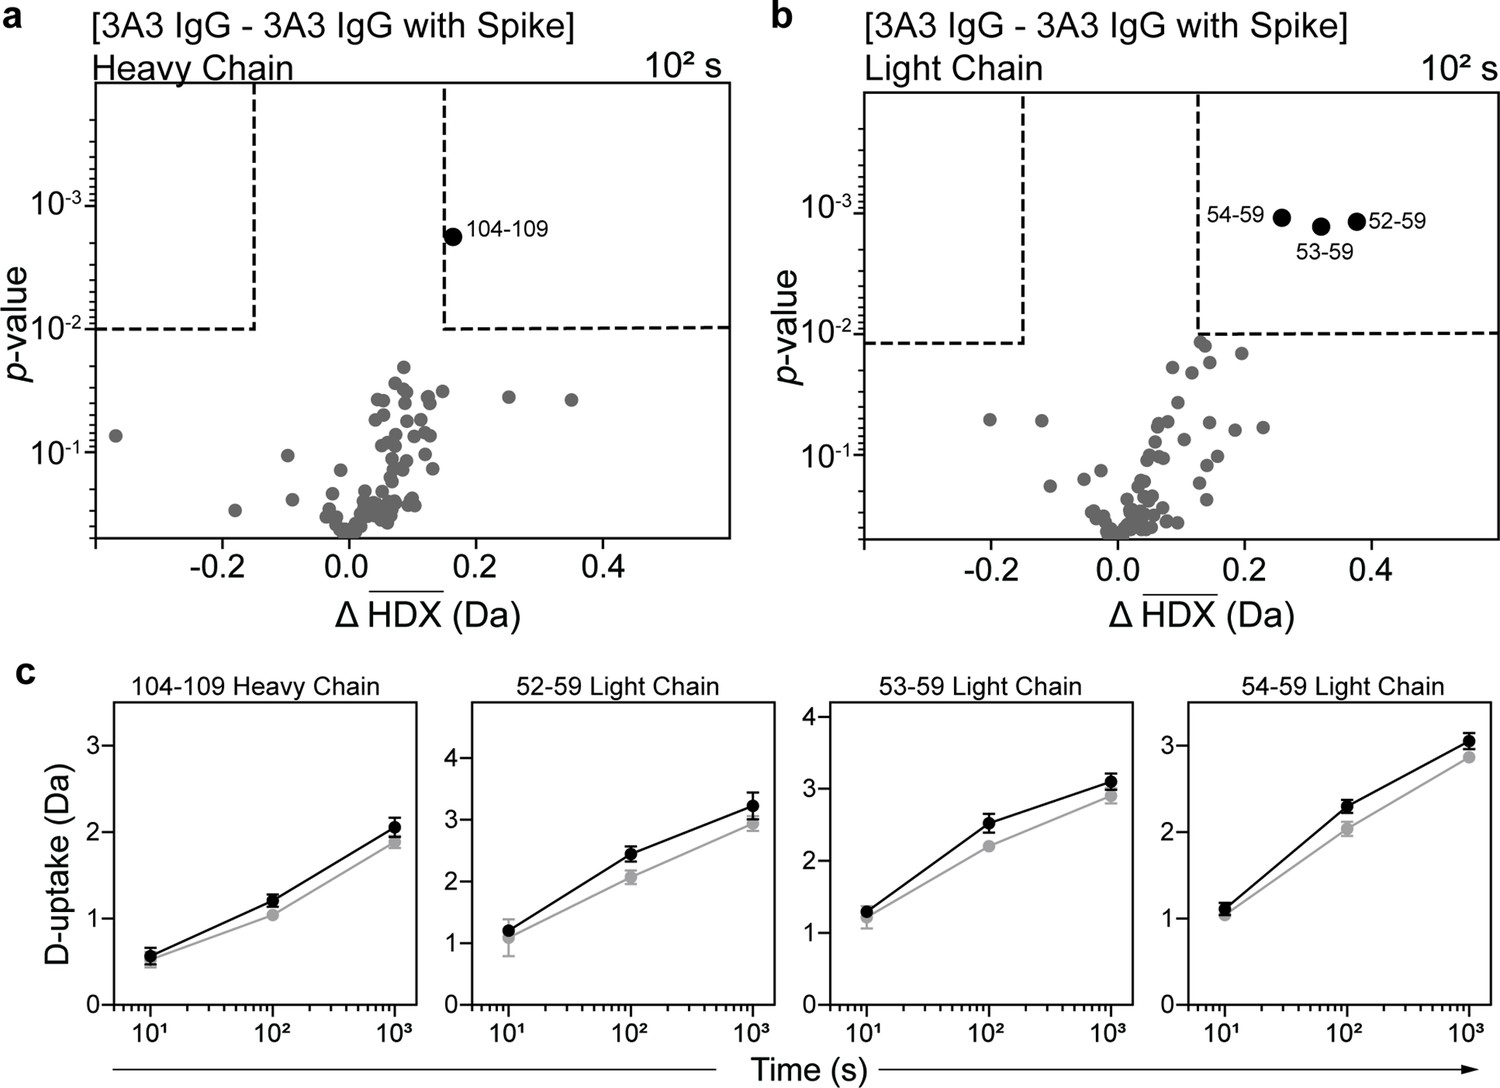
HDX identified the spike-binding paratope in 3A3 IgG.
Volcano plots showing changes in deuterium uptake in 3A3 IgG (a) heavy chain and (b) light chain upon addition of SARS-2 HexaPro spike after 102 s exchange. Significance cutoffs are an average change in deuterium uptake greater than 0.2 Da and a p-value less than 10–2 in a Welch’s t-test (hatched box). Black dots indicate peptides with a significant decrease in deuterium uptake and their residue boundaries are labeled. (c) Uptake plots for these peptides are shown. Traces are 3A3 IgG alone (black) and with SARS-2 HexaPro spike (gray). Error bars are ± 2σ from three or four technical replicates and sometimes too small to be visible. The y-axis is 70% of max deuterium uptake assuming the N-terminal residue undergoes complete back-exchange. Data have not been corrected for back-exchange.
Figure 2 with 1 supplement
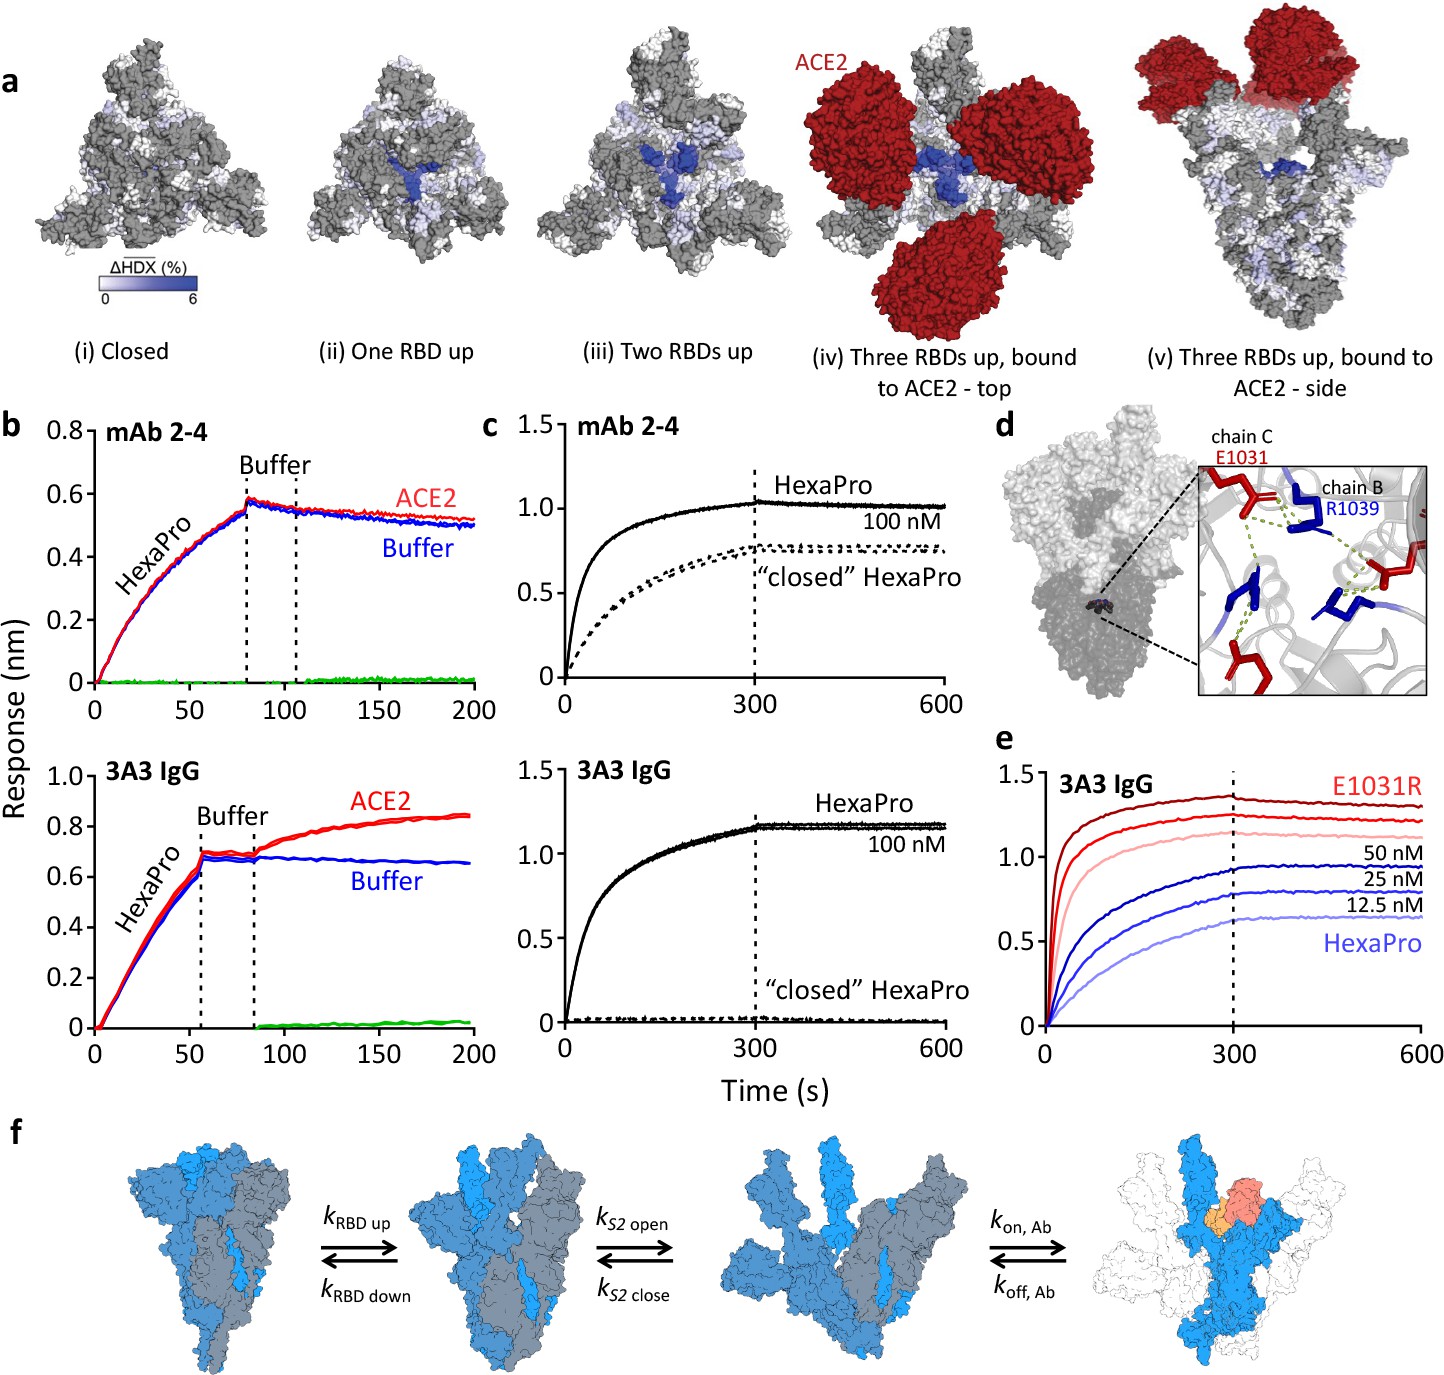
The hinge epitope is accessible only in an RBD-up and S2-open spike conformation.
(a) Trimeric SARS-2 spike in various conformations colored according to difference in deuterium fractional uptake between SARS-2 HexaPro spike alone and with 3A3 IgG. The hinge epitope within S2 is colored dark blue in structures of wild-type SARS-2 spike in the (i) three RBDs down or closed conformation (PDB: 6XR8) and in structures of stabilized spike with (ii) one RBD up (PDB: 6VSB), (iii) two RBDs up (PDB: 7A93), or (iv) three RBDs up while bound to ACE2 (red) in top-view and (v) sideview (PDB: 7A98). Residues lacking coverage in the HDX experiment are indicated in gray. (b) Antibody 3A3 (bottom) or control mAb 2–4 (top) were coupled to anti-Fab BLI sensors and allowed to capture HexaPro or nothing (buffer, green line), then dipped into buffer (baseline), and finally dipped into ACE2-Fc (ACE2, red) or nothing (buffer, blue). (c) BLI binding of immobilized control mAb 2–4 (top) or antibody 3A3 (bottom) to 100 nM HexaPro (solid) or HexaPro locked into the ‘closed’ conformation (dashed). Vertical dashed lines indicate start of dissociation phase. (d) The network of hydrogen bonds formed by residues E1031 and R1039 across protomers deep in the S2 core is shown on intact HexaPro spike and in detail in a top view (PDB: 6XKL). (e) Antibody 3A3 was coupled to anti-Fc BLI sensors and allowed to bind HexaPro or E1031R HexaPro (E1031R) spike protein. All BLI data are representative of biological duplicates. Each experiment was repeated in technical duplicate except e, which was tested once at each concentration to allow all data to be collected simultaneously for direct comparison. (f) Model of the kinetic changes required for antibody binding to the hinge epitope, including conversion of the RBDs into the up position and some degree of opening of the S2 domain in addition to typical antibody association and dissociation kinetics (generated using PDB 6XV8 and 7A98).
-
Figure 2—source data 1
BLI sensorgram data.
- https://cdn.elifesciences.org/articles/83710/elife-83710-fig2-data1-v3.xlsx
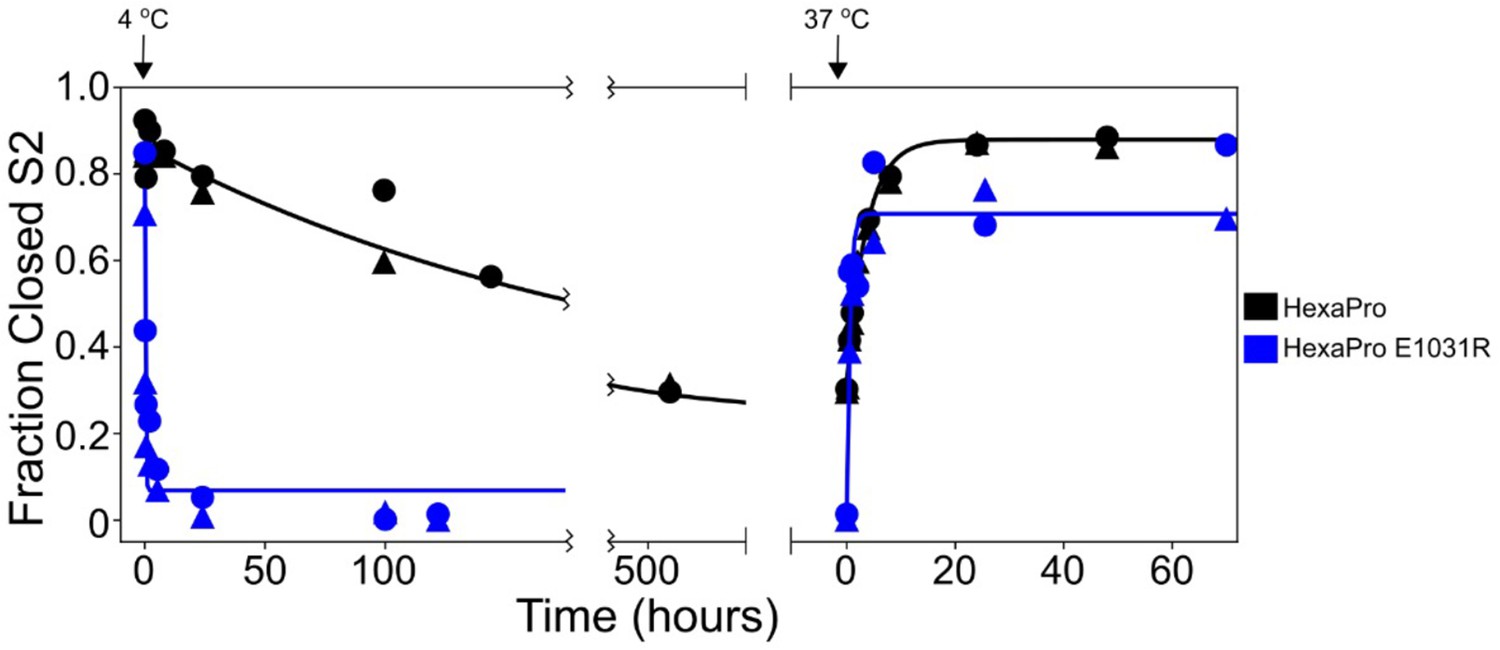
Figure 2—figure supplement 1
HexaPro E1031R variant exposes the hinge epitope.
The kinetics of interconversion between the closed-S2 and open-S2 states of HexaPro and HexaPro E1031R were evaluated by HDX as previously described (Costello et al., 2022). The spike proteins were incubated at 37°C for 24 hr, then incubated at 4°C, assayed for detecting the S2-open state over time, then transferred to 37°C and assayed again. The fraction closed-S2 was estimated by exposing a sample of the incubation reaction to a 1 min pulse of deuterium and quenching the labeling reaction with low pH and temperature. After LC-MS and peptide identification, the bimodal mass envelopes for all timepoints for one peptide were globally fit to a sum of two Gaussians, keeping the center and width of each Gaussian constant across all incubation time points. After fitting, the area under the lower molecular weight Gaussian was integrated to determine the fraction of closed-S2. For HexaPro, the half-life of conversion from closed to open (37°C → 4°C) was 143.5 hr and the half-life of conversion from open to closed (4°C → 37°C) was 2.5 hr. These conversions for HexaPro E1031R occur with half-lives decreased by >700-fold (0.2 hr) and >6-fold (0.4 hr), respectively.
Figure 3 with 4 supplements
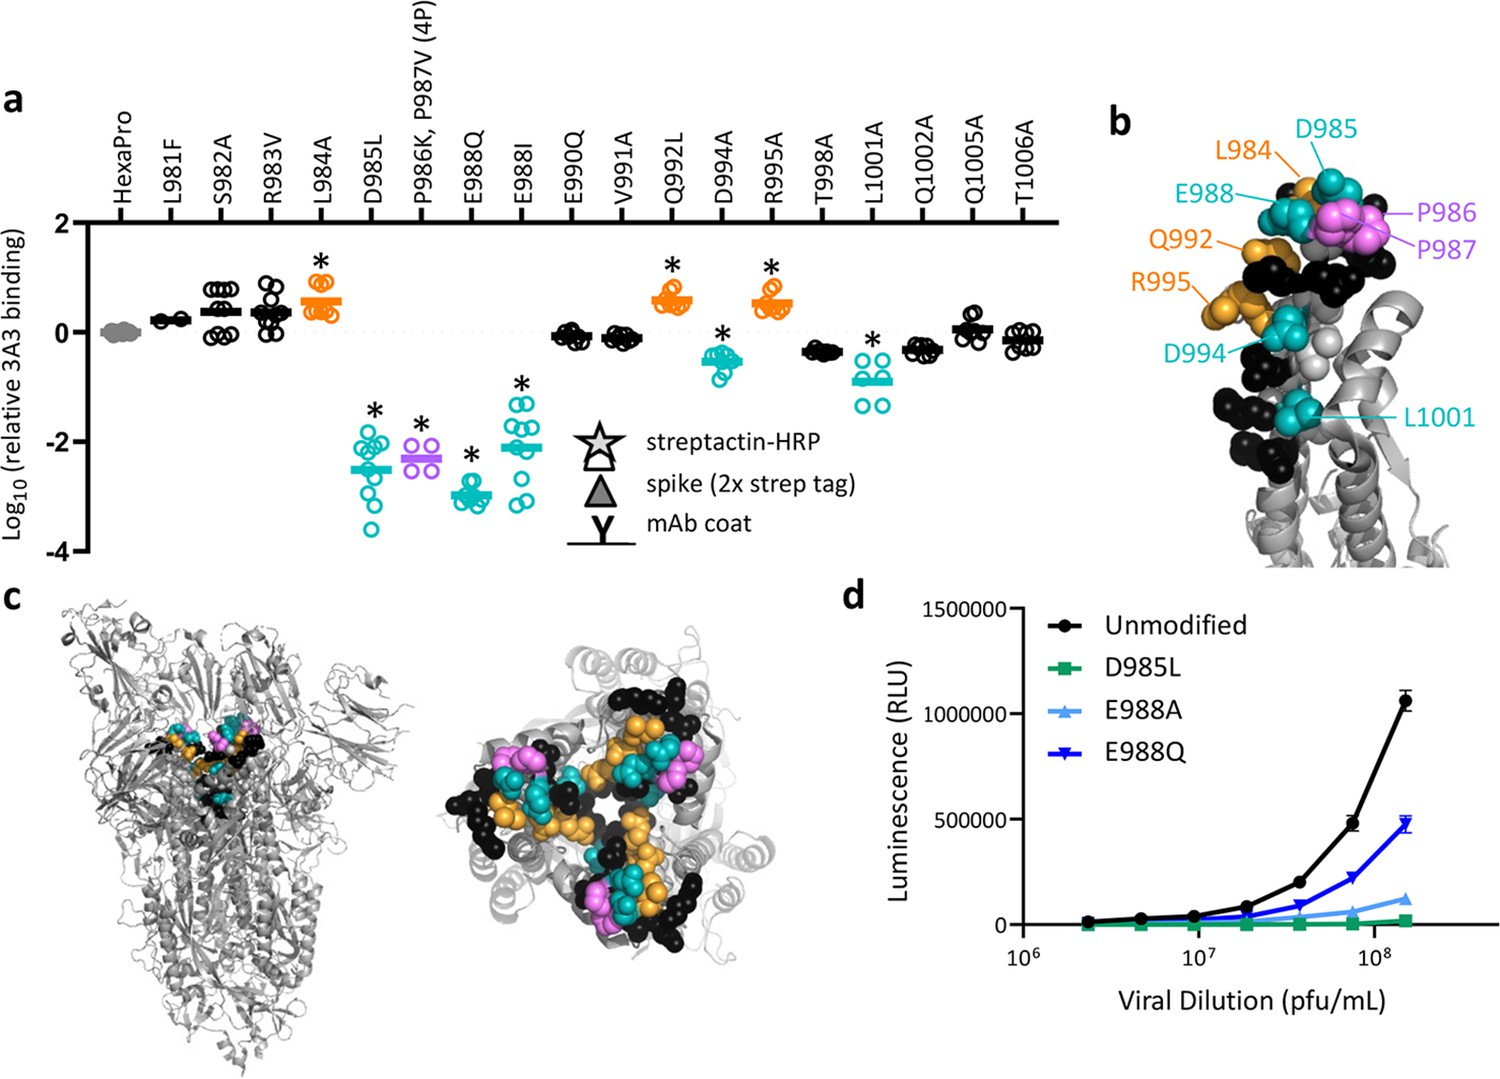
SARS-2 spike residues 985–988 are recognized by 3A3 and impair spike function upon substitution.
(a) Residues important for 3A3 binding were identified by single residue changes in HexaPro that increased or decreased binding to 3A3 relative to HexaPro. Each variant was tested with duplicate technical replicates in 2–6 independent ELISA assays. Significance relative to unaltered HexaPro was determined by ANOVA with post-hoc Tukey–Kramer test with α = 0.01; data meeting this criterion indicated by *. (b) Location of the residue changes altering binding to 3A3 shown in the HexaPro spike (6XKL) monomer and in (c) intact spike (side view) and the S2 domain (top-down view). All epitope residues (980–1006) are shown in space-fill, with residues colored according to their effect on 3A3 binding: improved binding (orange), reduced binding (teal), no effect (black), and those not altered (gray). The 2P stabilizing mutations within the hinge epitope are displayed in purple. (d) The infectivity of lentivirus pseudotyped with unmodified D614G SARS-2 spike or variants with D985L (green), E988A (light blue), and E988Q (dark blue) substitutions was compared by luciferase activity. Data shown are the mean luminescence with standard deviation of three technical replicates.
-
Figure 3—source data 1
ELISA binding data and relative luminescence data for pseudovirus infection assays.
- https://cdn.elifesciences.org/articles/83710/elife-83710-fig3-data1-v3.xlsx
Figure 3—figure supplement 1
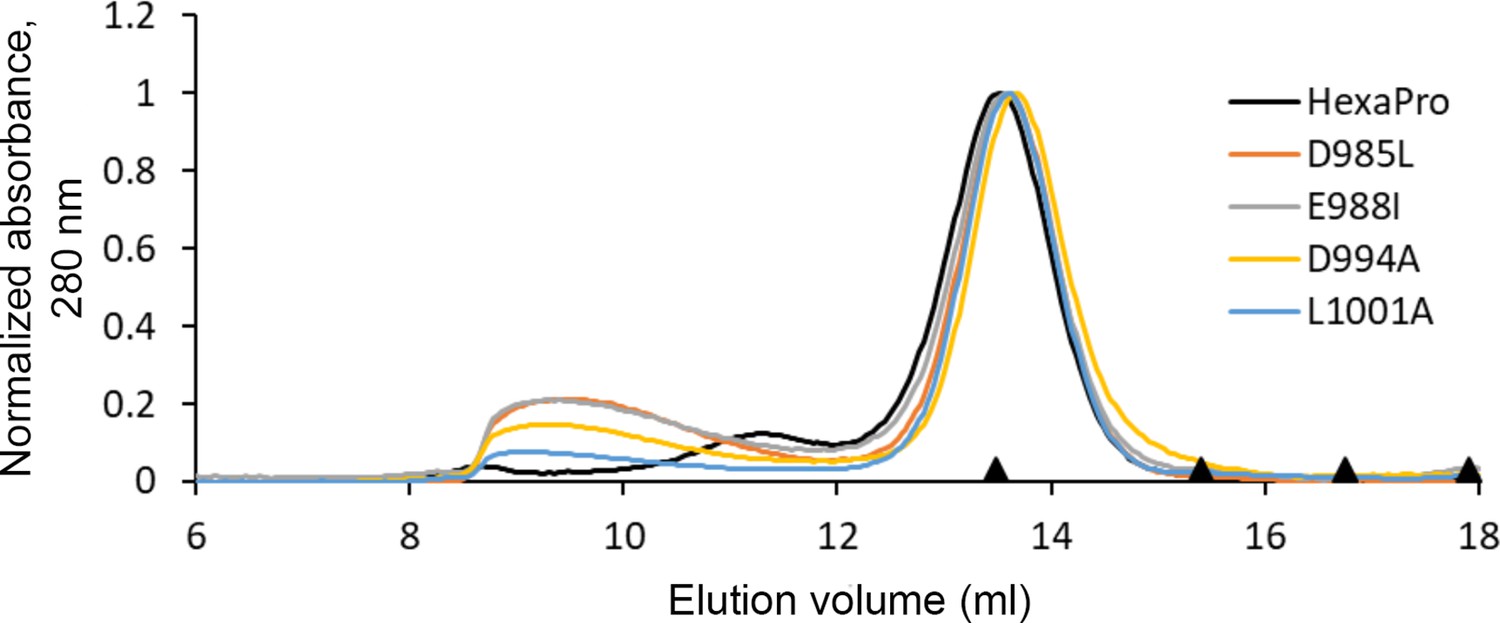
HexaPro variants with reduced 3A3 binding retain trimer SEC profile.
The single-point mutants of HexaPro, D985L, E988I, D994A, and L1001A, had reduced binding to 3A3 relative to HexaPro (Figure 3a), but retained the overall size of unmodified HexaPro by SEC with elution of the main peak at ~13.75 mL on a Superose 6 Increase 30/100 column, indicating the spike was intact. Molecular weight markers (black triangles) on the x-axis are peak elution volumes from the following standards in order from left to right: thyroglobulin (669 kDa, 13.49 mL), ferritin (440 kDa, 15.40 mL), β-amylase (200 kDa, 16.75 mL), and aldolase (158 kDa, 17.91 mL).
Figure 3—figure supplement 2
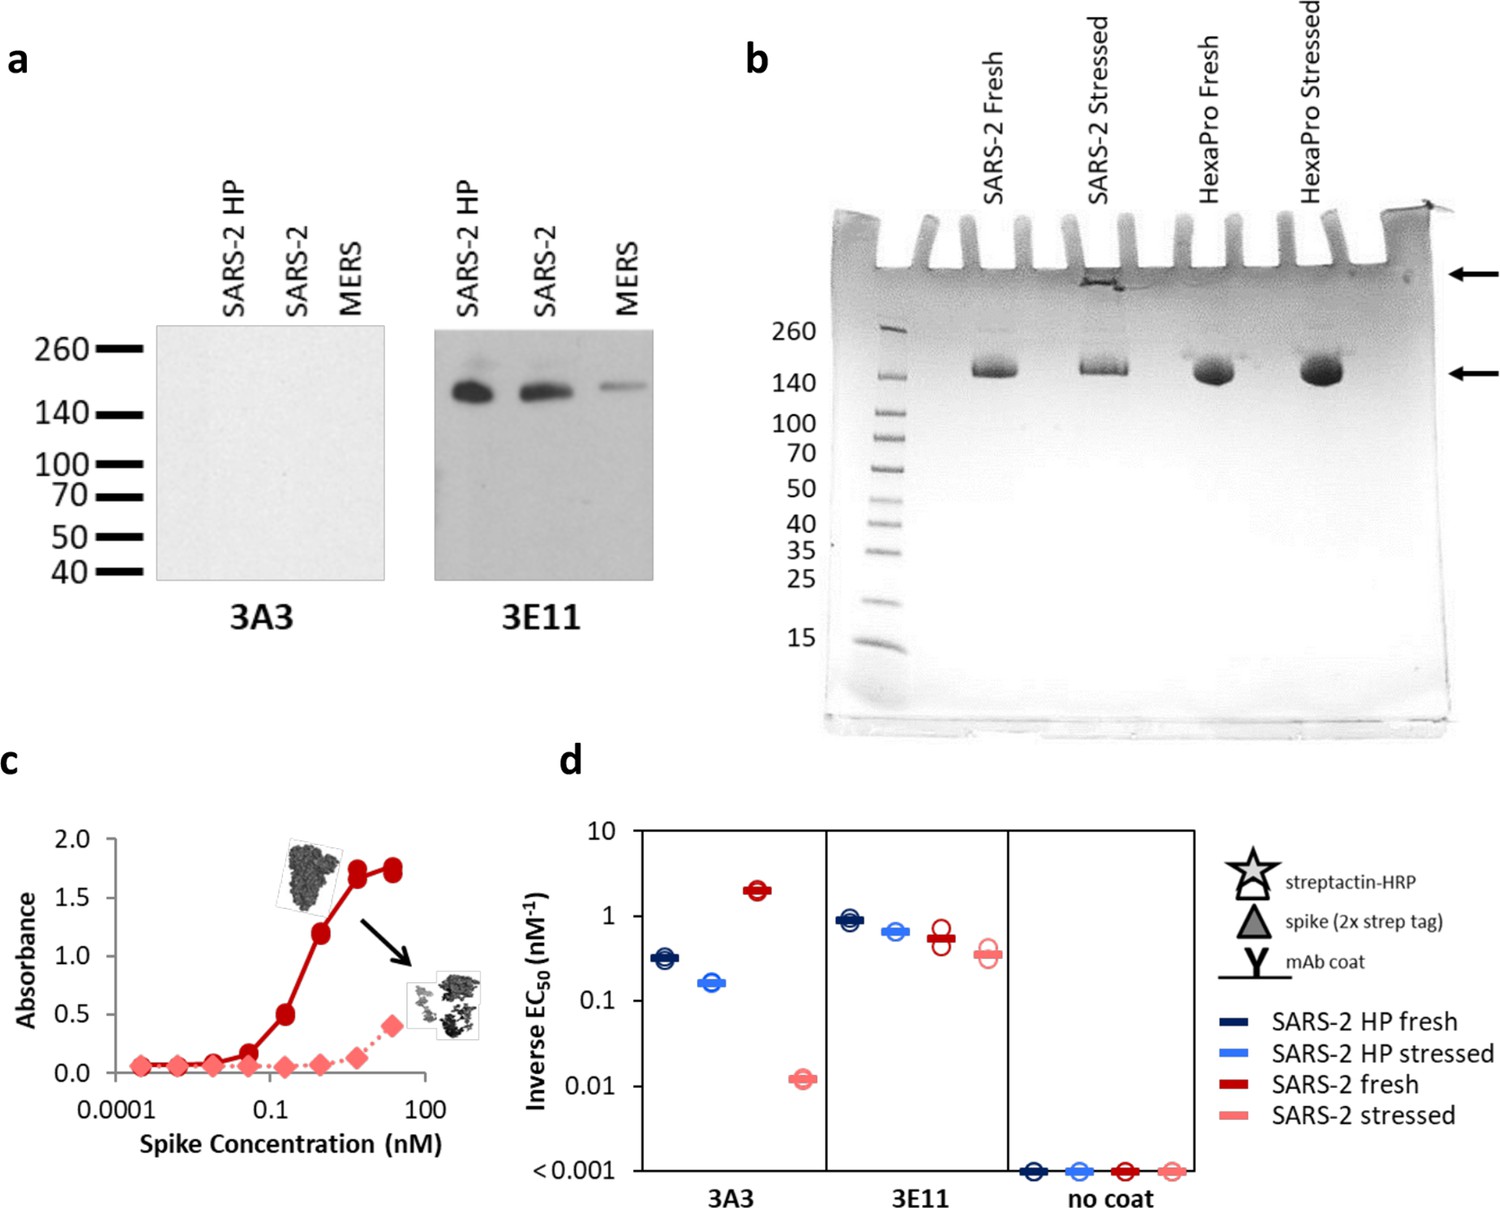
The hinge epitope is nonlinear and inaccessible in aggregated or misfolded protein.
(a) 3E11 binds reduced, denatured SARS-2 HP, SARS-2, and MERS spike proteins by Western blot, but 3A3 does not. The ladder molecular weight is labeled in kDa on the left side. (b) SDS-PAGE analysis of fresh and stressed SARS-2 and SARS-2 HexaPro spikes shows a substantial aggregation of the stressed SARS-2 spike. For each spike, 8 μg of protein was analyzed by SDS-PAGE under nonreducing conditions. Reduced band intensity of stressed SARS-2 spike (bottom arrow) and appearance of a band just under the loading wells (top arrow) indicates aggregation products not apparent in the other samples. Densitometry analysis (ImageJ) of these bands indicates that the stressed SARS-2 spike’s main peak is diminished by ~20% relative to the fresh SARS-2 spike intensity. Ladder molecular weights in kDa are indicated to the left of the gel image. Binding of 3A3 Fab to HexaPro S2 measured (c) ELISA capture of fresh (red circles) or stressed (pink diamonds) SARS-2 spike on 3A3 coated plates. (d) Antibodies coated on ELISA plates captured fresh (dark blue or red) or stressed (pink or light blue) SARS-2 HP (blue) or SARS-2 (red) spike proteins. Duplicate dilutions of spike over ~5 log in concentration were used to calculate EC50 values. For dilution series in which no binding was observed, EC50 was assumed to be >1000 nM. Open symbols are replicate data and filled rectangles are average data.
Figure 3—figure supplement 3
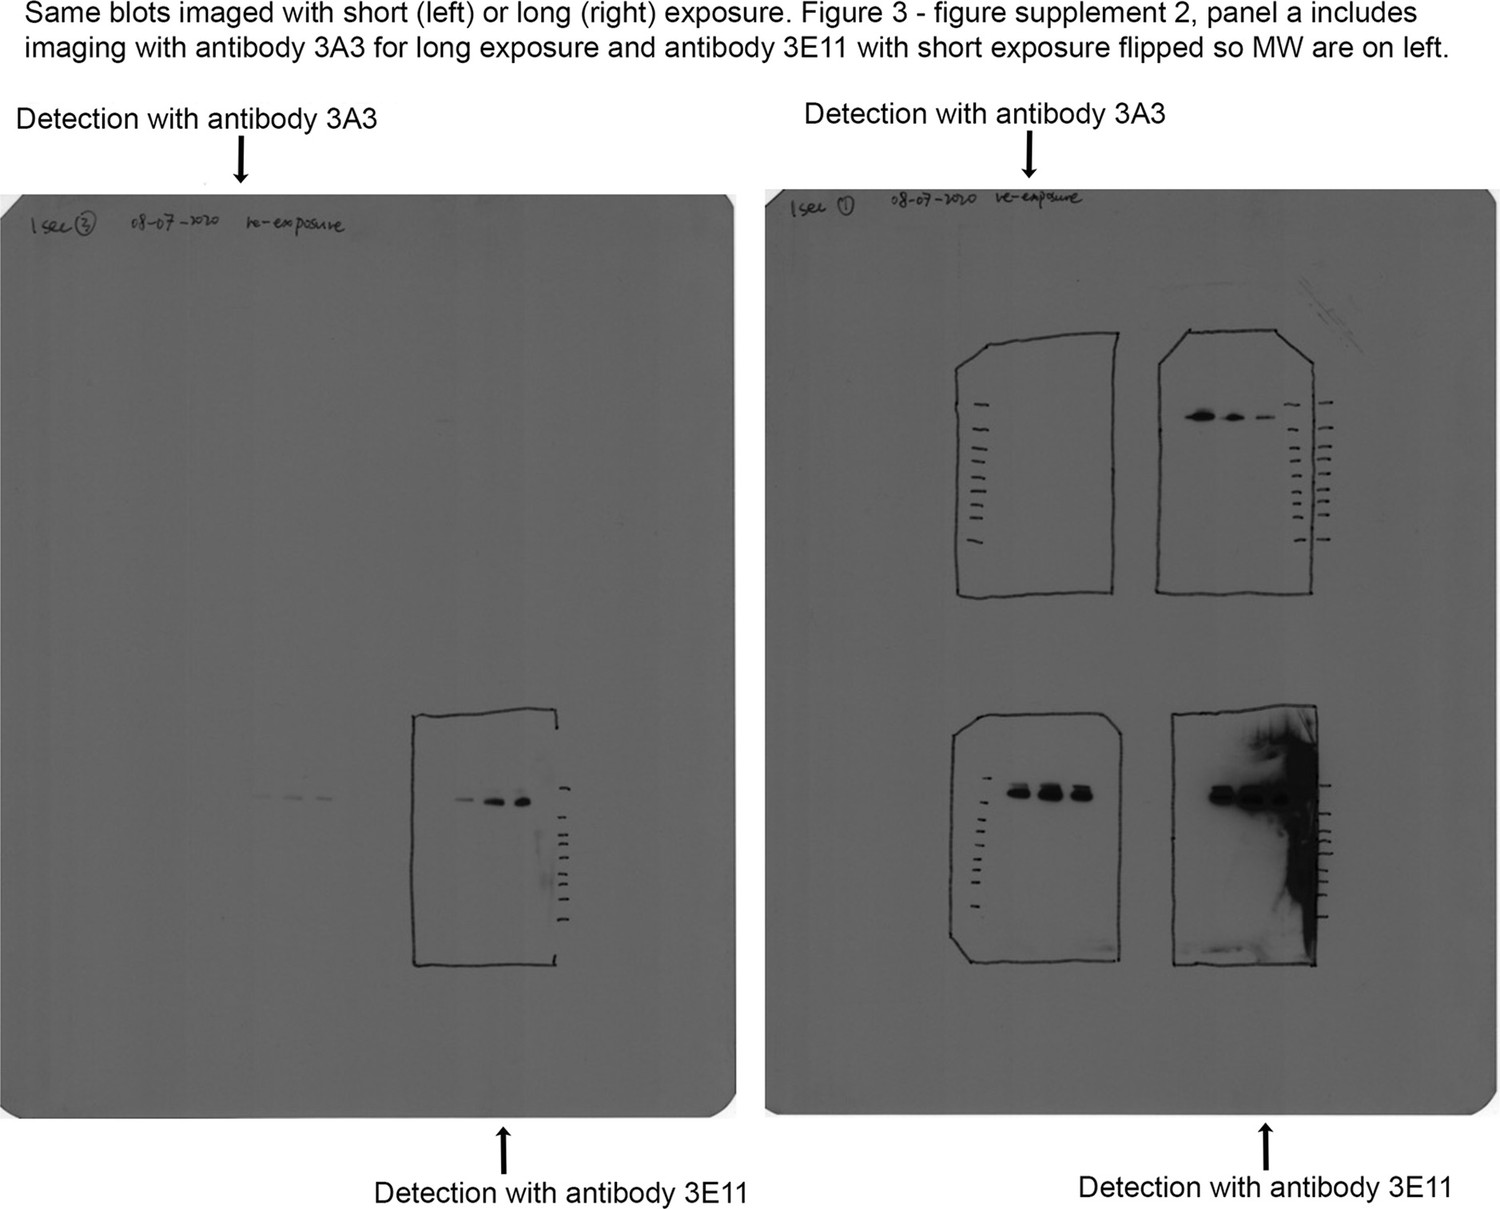
Original blot images for Figure 3—figure supplement 2a.
Figure 3—figure supplement 4
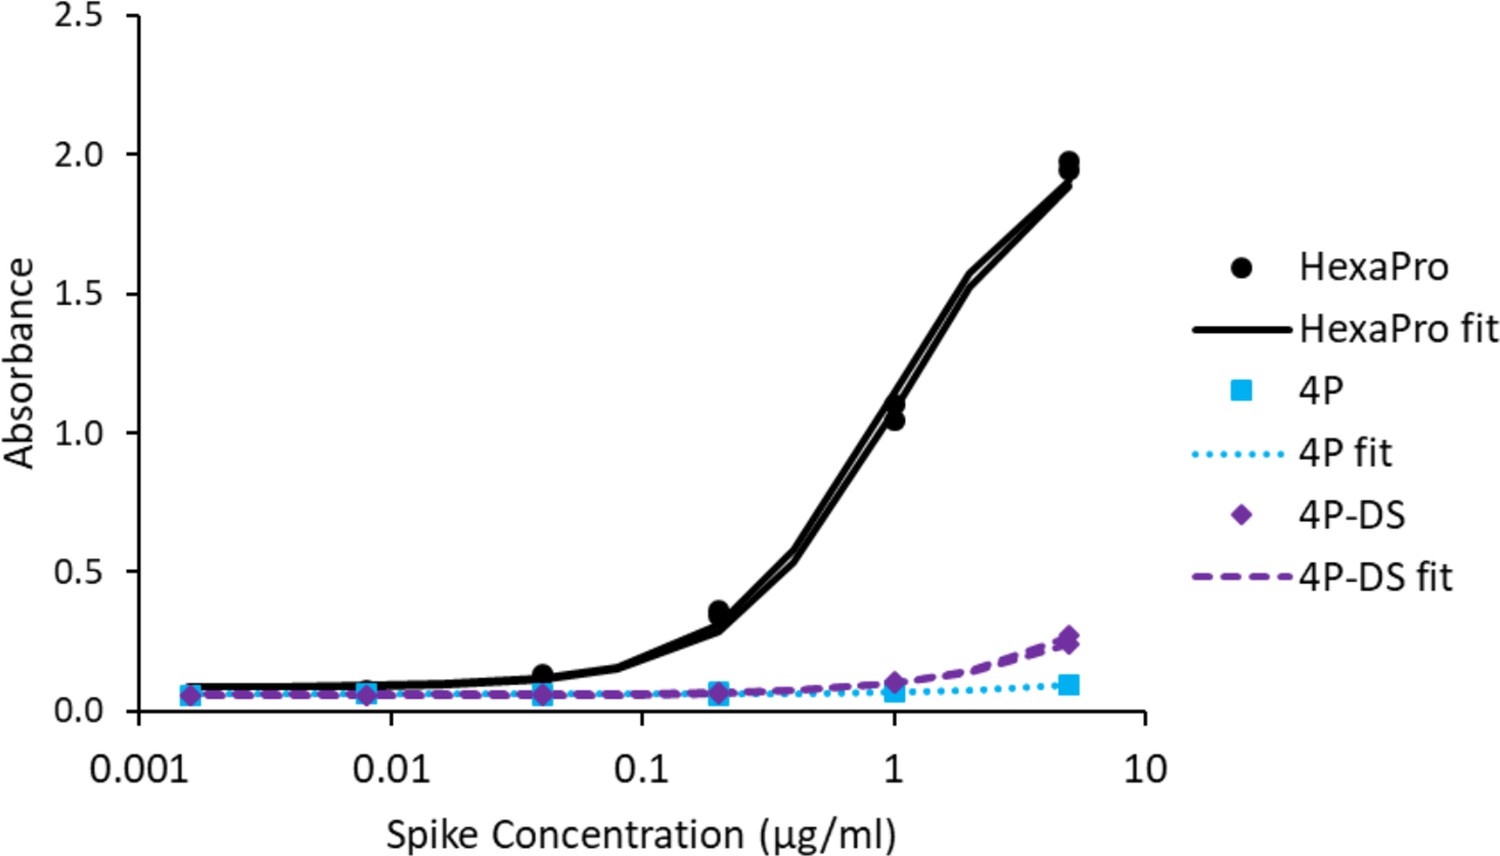
Adding a disulfide bond slightly improves 3A3 binding by ELISA to spike with P986 and P987 reverted to the native sequence.
Antibody 3A3 was coated on high binding plates and allowed to bind dilutions of SARS-2 HexaPro spike, 4P spike (HexaPro with P986K and P987V reversions), or 4P-DS spike (4P with an additional stabilizing disulfide). For detection, streptactin-HRP was allowed to bind the twin strep tag sequence at the C-terminus of any captured spike proteins.
Figure 4 with 4 supplements

The hinge epitope is conserved across β-coronaviruses and variably accessible in authentic spike.
The hinge epitope recognized by 3A3 (SARS-2 amino acids 980–1006) is highly conserved across the spike (a) sequences and (b) structures of β-coronaviruses known to infect humans, including Alpha, Omicron BA.1, and other variants of concern (VOC; Beta, Gamma, Delta, Epsilon, Omicron BA.2 through BA.5). In (a), identical residues are indicated by a dot and similar residues are highlighted in gray. Residues conserved across all listed β-coronaviruses are in bold. Residues that lost binding to 3A3 when altered as shown in Figure 3 are in teal highlight and those whose disruption improved binding are orange. The location of the two proline mutations introduced to 2P variants are shown below the alignment. In (b), the structure of each epitope is displayed as follows: SARS-2 (6VSB) – red, SARS-1 (6CRV, RMSD = 0.8 Å) – magenta, MERS (5X5C, RMSD = 3.1 Å) – blue, HKU1 (5I08, RMSD = 0.5 Å) – teal, OC43 (6OHW, RMSD = 0.6 Å) – green. (c) Binding of full-length antibody 3A3 (black circles) and RAY53 (blue diamonds) to ancestral SARS-2, SARS-2 HexaPro (SARS-2 HP), SARS-2 4P, SARS-2 4P-DS, SARS-2 HexaPro Delta (SARS-2 HP Delta), SARS-2 HexaPro Omicron BA.1 (SARS-2 HP Omicron BA.1), MERS, SARS-1, HKU1, or milk (no coat) proteins by ELISA. Data are representative of duplicate biological replicates, each with duplicate technical replicates. The data midpoint is indicated with a bar. (d) Plasmids encoding full-length unstabilized spike proteins from SARS-2, SARS-2 Omicron BA.1, MERS, or SARS-1 were transiently transfected to Expi293 cells. The spike (blue or magenta histograms) or mock (grey histograms) transfected cells were stained with 100 nM RAY53 (top panels) or 10 nM control antibody S309 (bottom panels), followed by goat-anti-human Fc-PE secondary antibody, and flow cytometry scanning of 10,000 cells. The data shown are representative of triplicate experiments, with each condition repeated in technical duplicate. (e) Expi293 cells were transiently transfected with plasmids encoding SARS-2 spike and EGFP or EGFP only, then incubated with 3A3 (black circles) or RAY53 (blue diamonds) antibody (~1–300 nM) and anti-human Fc-PE before flow cytometric determination of the geometric mean fluorescence intensity (GMFI) in the PE channel for all green fluorescent cells. The GMFI of cells transfected with EGFP only was subtracted from the GMFI of cells expressing spike at each concentration, and the data fit to a three-parameter logistic curve to determine the effective Kd (Kd,eff) for antibody binding. The data shown are representative of triplicate experiments; ND, not detected.
-
Figure 4—source data 1
ELISA data and flow cytometry mean fluorescence intensity data.
- https://cdn.elifesciences.org/articles/83710/elife-83710-fig4-data1-v3.xlsx
Figure 4—figure supplement 1
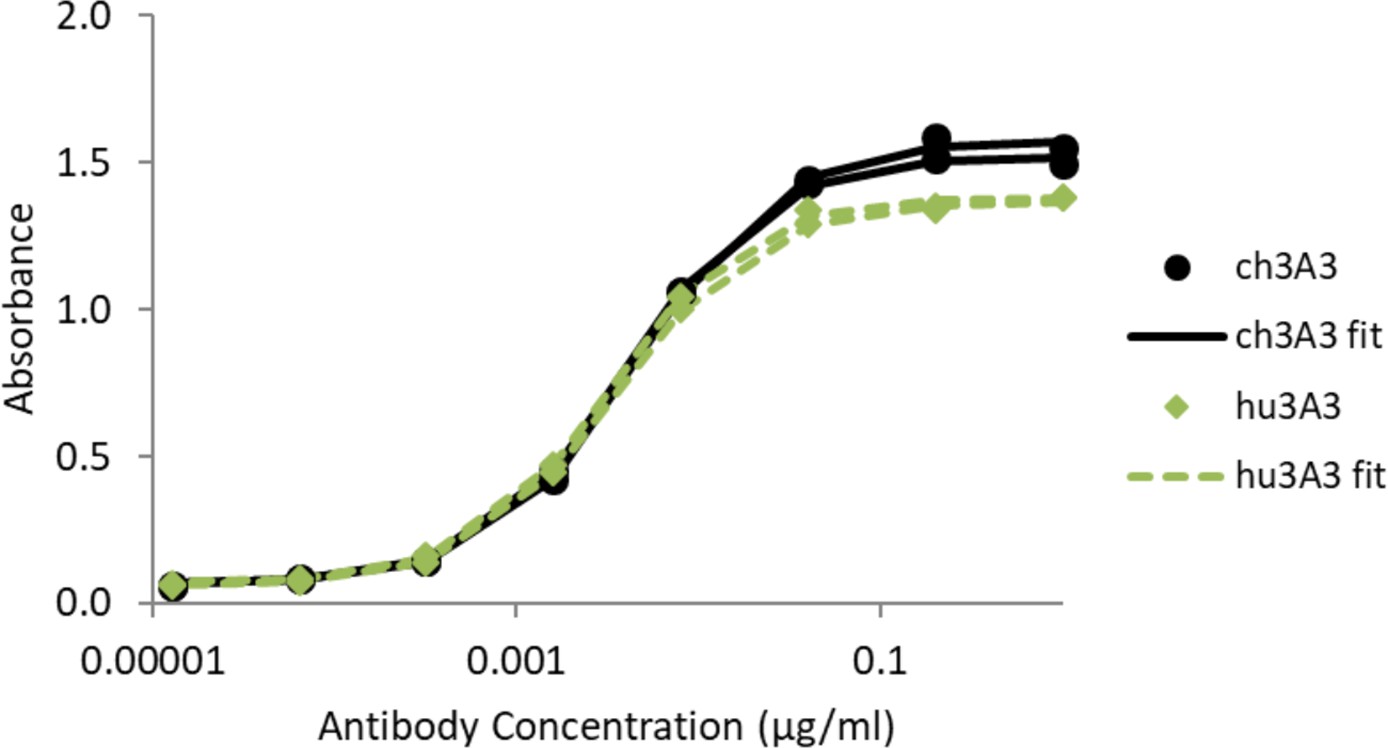
Antibody hu3A3 binds SARS-2 HexaPro similarly to 3A3 by ELISA.
SARS-2 HexaPro spike was coated on high binding plates and allowed to bind dilutions of 3A3 or hu3A3 purified antibody, then anti-human Fc-HRP for detection.
Figure 4—figure supplement 2
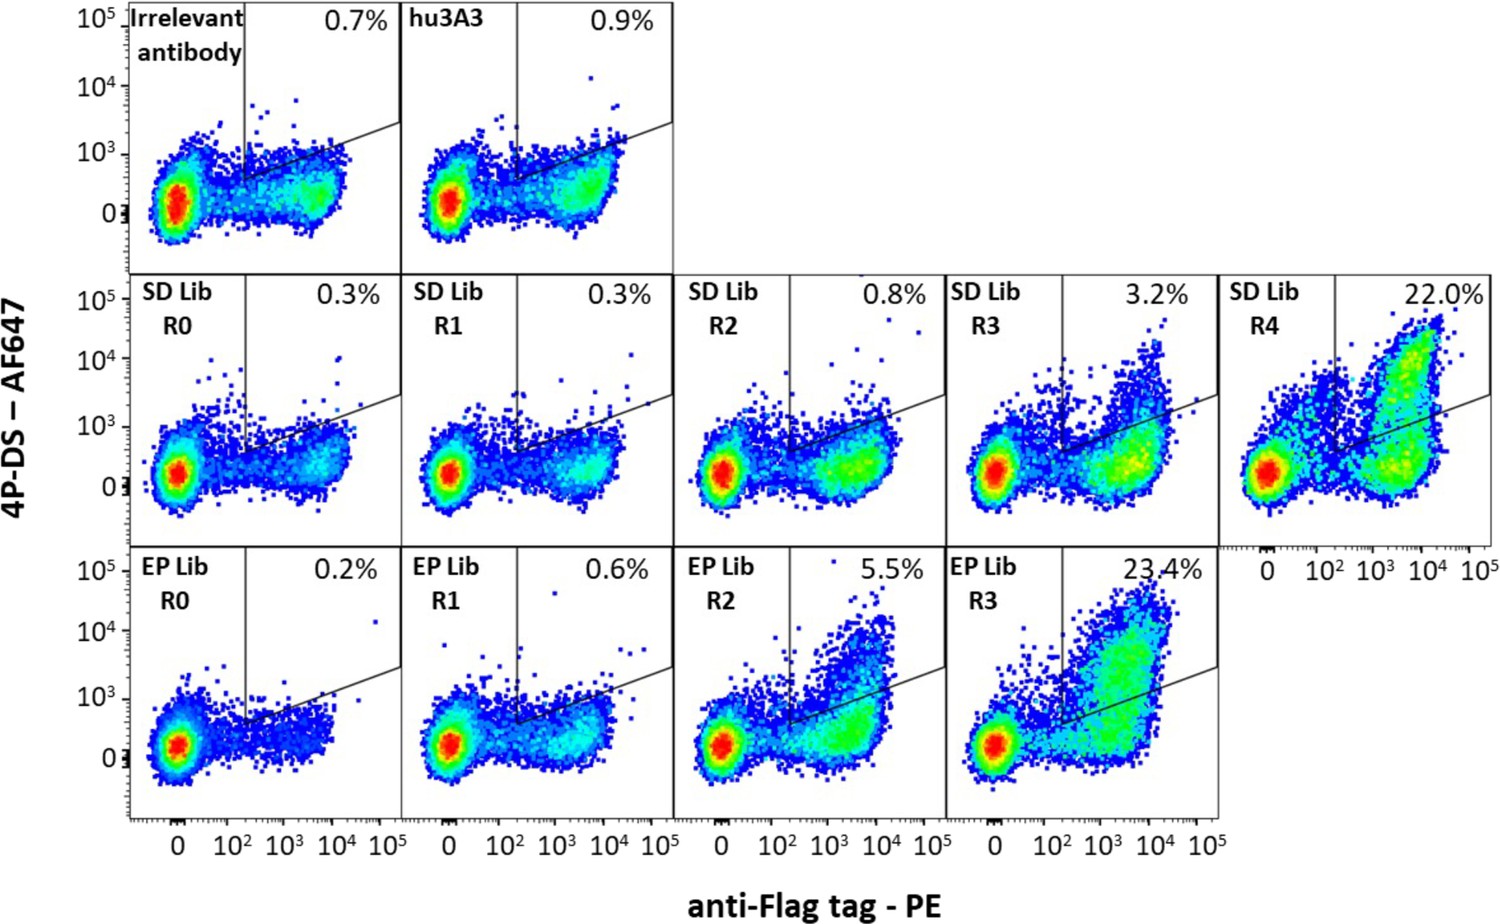
Antibody hu3A3 yeast display libraries were enriched for binding to 4P-DS.
Yeast surface display of irrelevant Fab or the hu3A3 Fab resulted in minimal binding to AF647 conjugated 4P-DS spike by flow cytometry. Site-directed (SD) or error-prone (EP) strategies to introduce diversity into the variable regions of hu3A3 Fab resulted in two libraries shown unsorted (R0), and after one (R1), two (R2), three (R3), or four (R4) rounds of selection. The 4P-DS-binding population was enriched by >70-fold during sorting of each library.
Figure 4—figure supplement 3
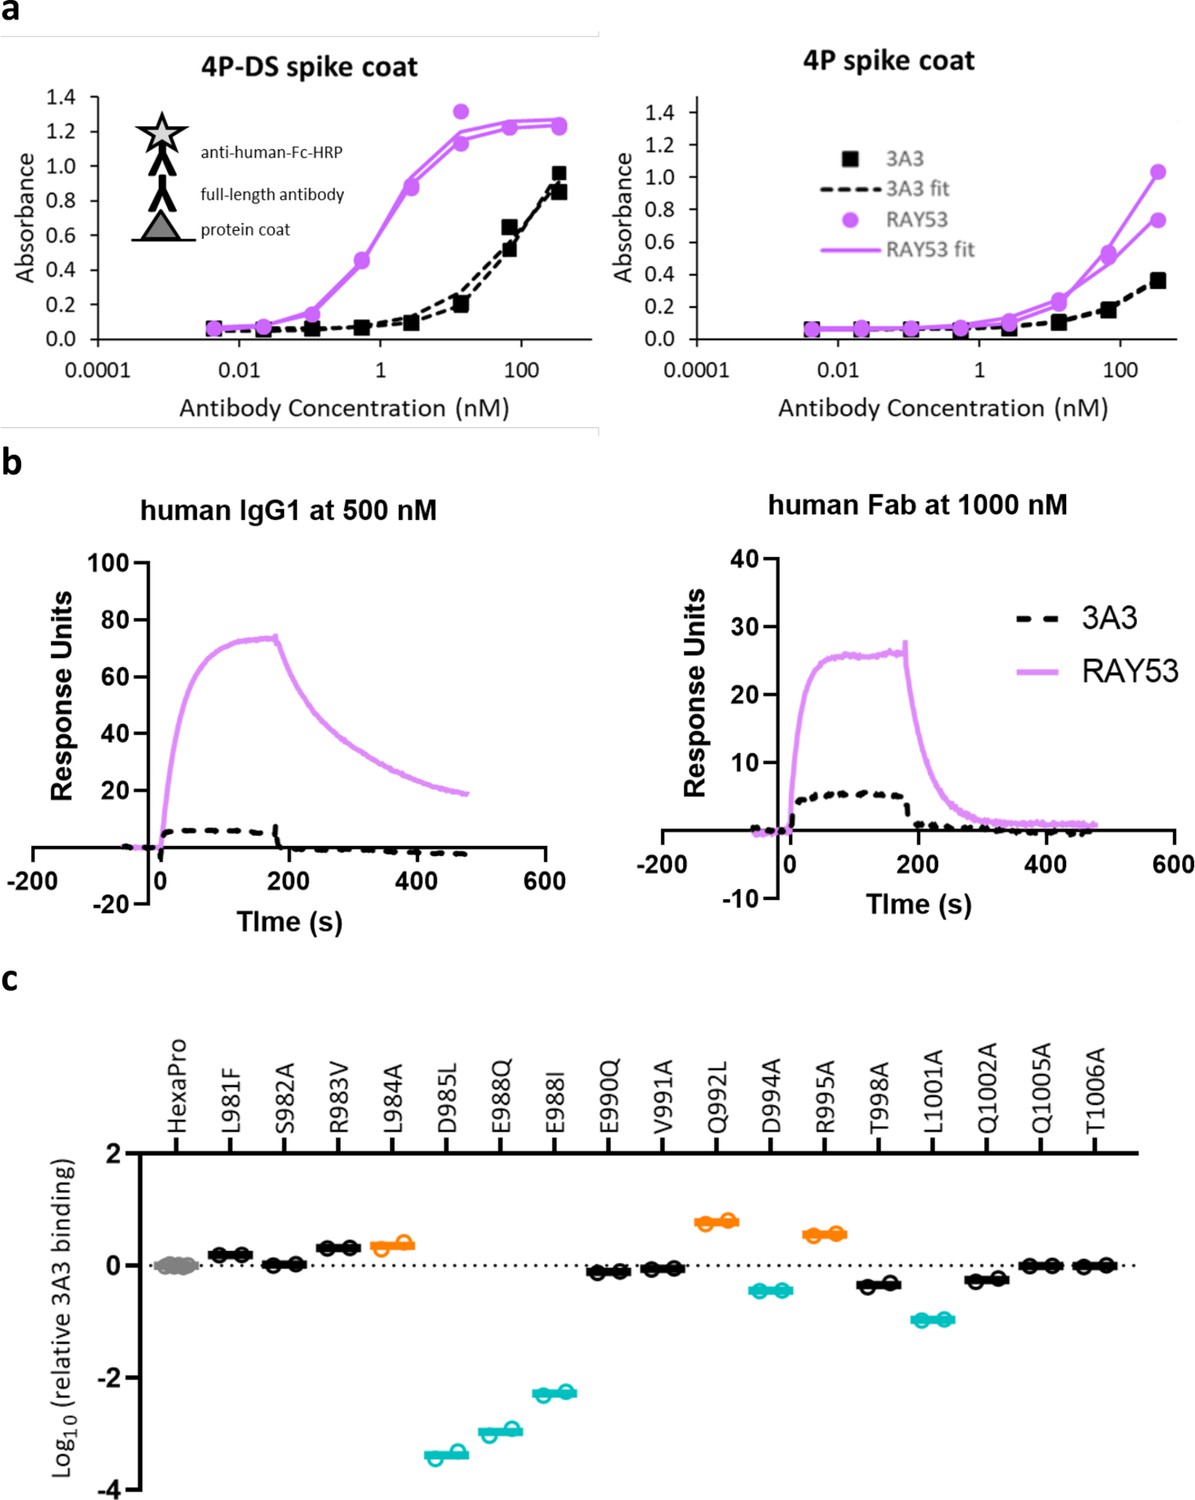
Antibody RAY53 retains epitope specificity while exhibiting higher affinity than 3A3 for SARS-2 HexaPro spike with reverted 2P changes.
(a) ELISA data with spike 4P-DS or 4P coated on high binding plates, followed by the addition antibody 3A3 or RAY53 in a 1:5 dilution series and detection with anti-human Fc-HRP secondary antibody. (b) Raw SPR curves showing binding of immobilized 4P-DS to 3A3 or RAY53 as full-length human IgG1 at 500 nM or human Fab at 1000 nM. These curves are representative of duplicate data. (c) The same substitutions used for fine epitope mapping of 3A3 were analyzed for ELISA binding to RAY53 as described in Figure 3a.
Figure 4—figure supplement 4
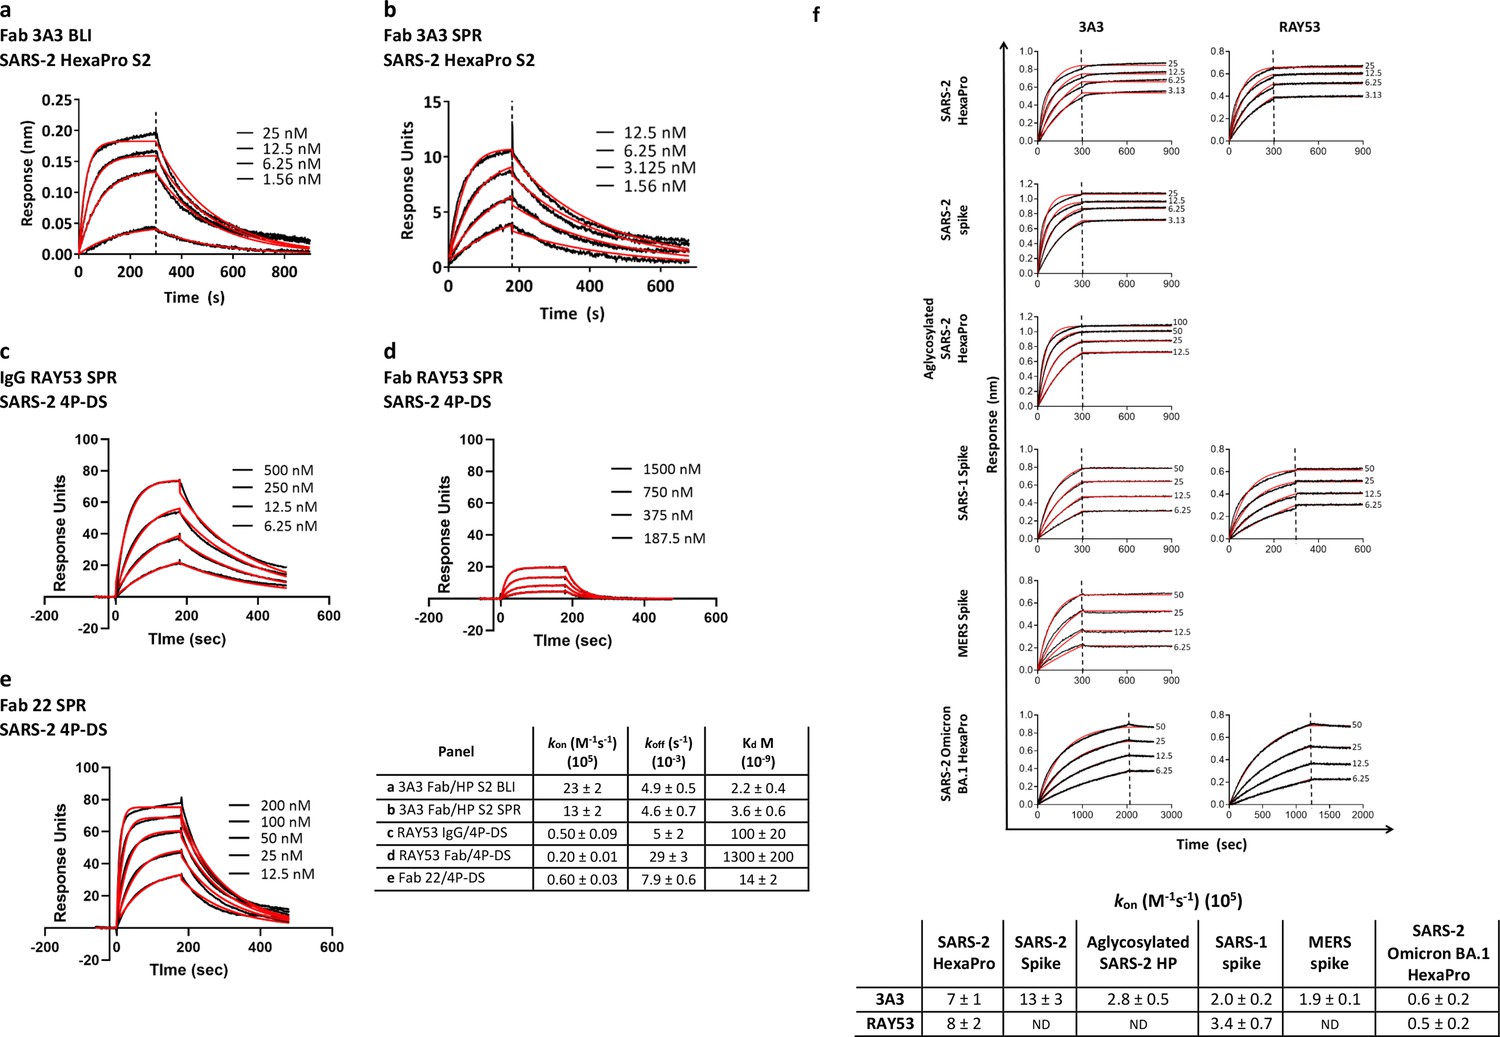
Antibodies 3A3 and RAY53 have low-to-mid nanomolar affinities for stabilized SARS-2 spike variants.
Binding of 3A3 Fab to HexaPro S2 was measured by (a) BLI with the HexaPro S2 trimer immobilized on the biosensor and (b) SPR with Fab immobilized on the chip. SPR was also used to evaluate binding of SARS-2 4P-DS to immobilized (c) IgG RAY53, (d) Fab RAY53 or (e) control IgG22. For BLI, Kd values were obtained using a 1:1 global fit model using the Octet instrument software. The SPR data were double-reference subtracted and fit to a 1:1 binding model using BIAevaluation software. (f) Binding of 3A3 and RAY53 IgG to additional spike variants was compared by incubating full-length IgGs immobilized on anti-Fc BLI sensors with serially diluted spike variants for an association step followed by a dissociation step in buffer only. Since the off-rates determined for this 3:1 spike protomer:antibody binding arm format using kinetic-based Kd were extremely slow due to rebinding (~10–12 s–1) and differential epitope accessibility is expected to influence the observed on-rate (Figure 2f), on-rates (kon) were compared. Vertical lines indicate the start of the dissociation phase; data shown in solid lines with fits (1:1 association then dissociation fit using GraphPad Prism software) shown in red lines.
Figure 5 with 1 supplement
Targeting the hinge epitope recruits Fc effector functions.
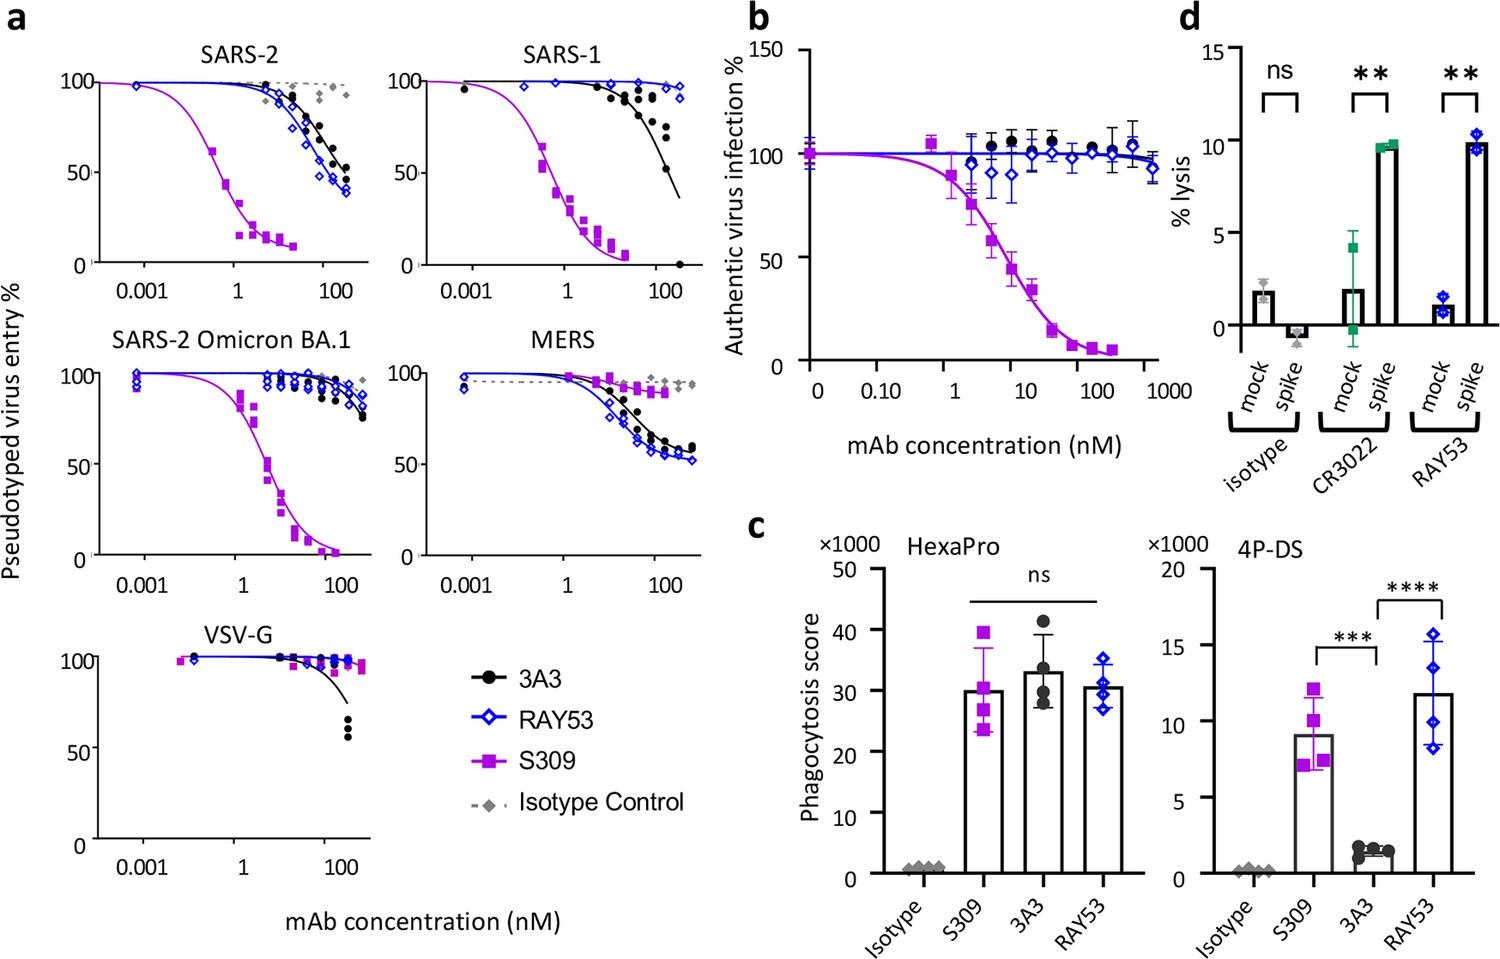
(a) Neutralization was evaluated by pre-incubating antibody with pseudotyped HIV particles that were then added to HEK 293T cells stably expressing ACE2 (SARS-1 and SARS-2 pseudoviruses) or DPP4 (MERS pseudovirus), with viral entry detected by luciferase luminescence. The entry efficiency of pseudoviruses without any treatment was considered 100%. (b) Neutralization of authentic SARS-2 wild-type virus was assessed by incubating viral particles with antibody before adding to Vero HF cells. Viral infection was assessed by ELISPOT 24 hr after infection by immunostaining with the anti-SARS-2 nucleocapsid antibody 1C7C7. (c) ADCP was performed by co-incubating undifferentiated THP-1 cells, antibodies and pHrodo-Green/APC-polystyrene beads coated with HexaPro or 4P-DS. The phagocytosis score was calculated as the percent of positive APC/FITC cells multiplied by the GMFI for APC. Data were collected from two separate experiments with the average and standard deviation shown. (d) ADCC was assessed by incubating NK-92 V/V cells, HEK-293T cells transfected to express either wild-type SARS-2 spike (spike) or nothing (mock) and antibody. For each panel, data shown are representative of three biological replicates. Duplicate technical replicates with the midpoint of each condition are shown.
-
Figure 5—source data 1
Data reporting antibody effect on infection with pseudovirus, authentic virus, phagocytosis score, and cellular lysis.
- https://cdn.elifesciences.org/articles/83710/elife-83710-fig5-data1-v3.xlsx
Figure 5—figure supplement 1
Antibody 3A3 inhibits cellular fusion induced by the interaction of SARS-2 spike with human ACE2.
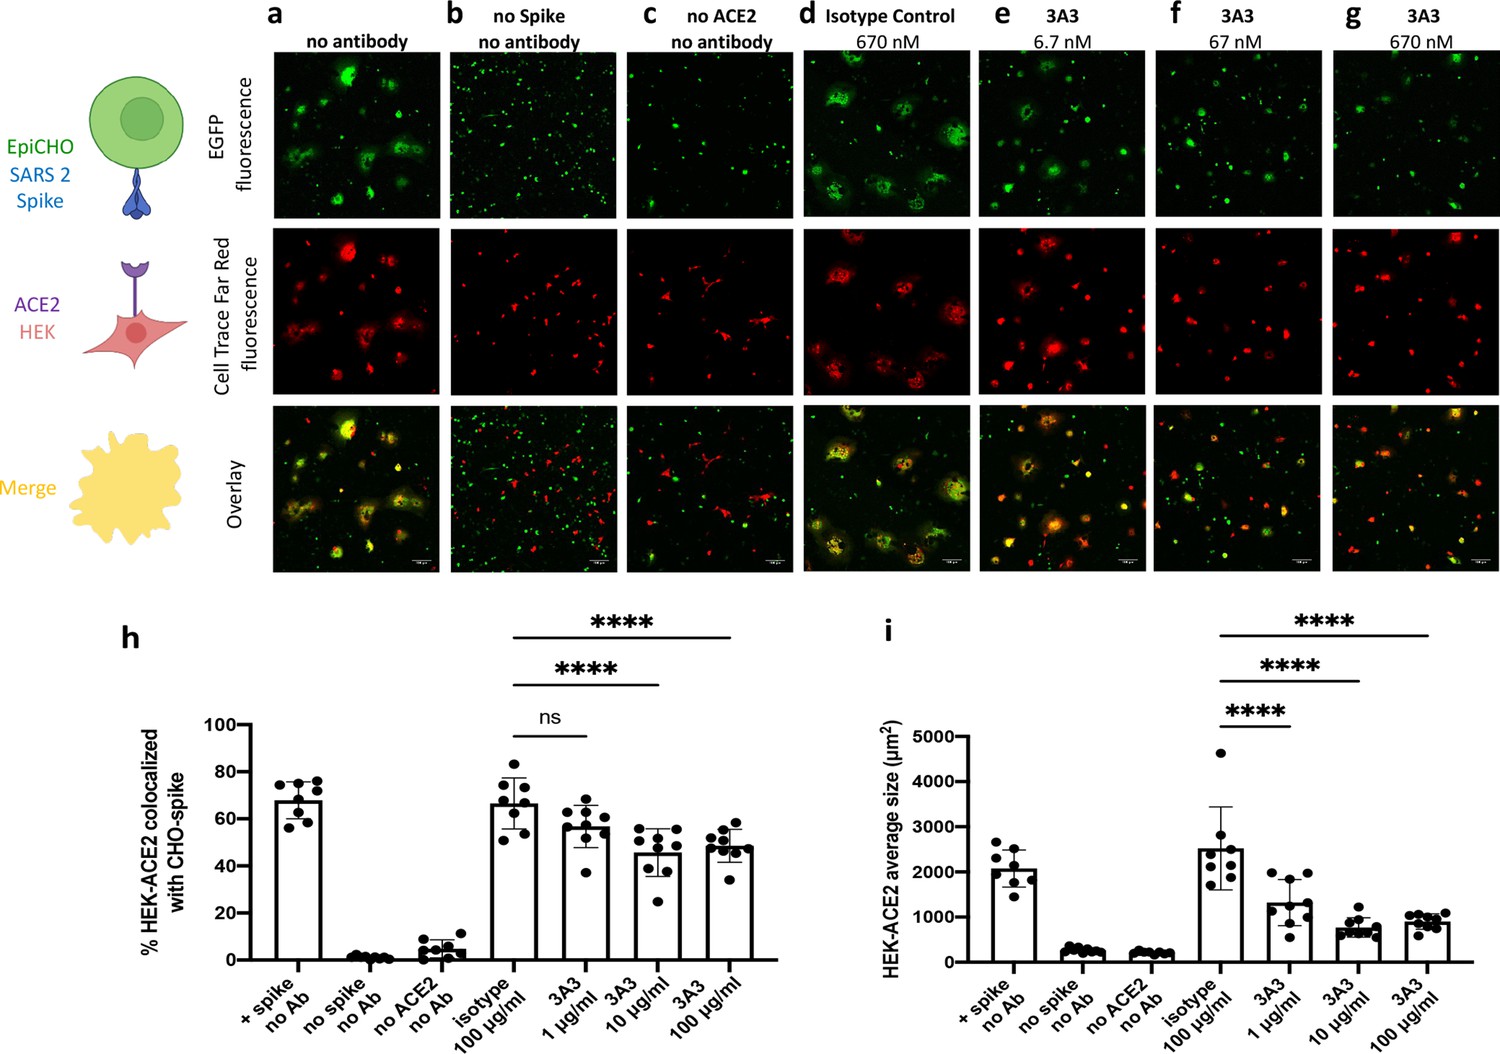
(a) HEK 293 cells stably expressing human ACE2 were stained with Cell Trace Far Red and incubated with a CHO-based cell line transiently expressing authentic SARS-2 spike and EGFP. The cultures were imaged after 24 hr of incubation for EGFP (green) or Cell Trace Far Red (red) and the level of colocalization (yellow) was evaluated. (b) CHO cells not expressing SARS-2 spike and (c) HEK 293 cells not expressing ACE2 exhibited minimal fusion. (d) When the cultures were preincubated with an irrelevant isotype control antibody, extensive fusion and syncytia formation equivalent to no antibody was apparent. Incubation at (e) 6.7, (f) 67, and (g) 670 nM 3A3 reduced fusion in a dose-dependent manner with significance reached at 67 nM. Scale bar, 100 μm. (h) The percentage of HEK-ACE2 pixels (red) colocalizing with spike expressing CHO pixels (green) was analyzed with the JACoP plugin for ImageJ. (i) The same images were analyzed for the average cell size of fused HEK-ACE2 with ImageJ as a second statistical method to test the cell fusion level. Shown are the mean and standard deviation of at least 160 cells per condition from 8 to 9 independent images. The statistical analysis of average cell sizes under different conditions were performed with ANOVA followed by Tukey’s HSD test. Results shown are representative of four independent experiments; ****p<0.0001.
Tables
Key resources table
| Reagent type (species) or resource | Designation | Source or reference | Identifiers | Additional information |
|---|---|---|---|---|
| Antibody | Anti-NP 1C7C7 | Thomas Moran (The Icahn School of Medicine at Mount Sinai) | N/A | |
| Antibody | Anti-spike CR3022 | Constructed based on ter Meulen et al., 2006. | N/A | |
| Antibody | Anti-spike mAb 2–4 | Constructed based on Liu et al., 2020 . | N/A | |
| Antibody | Anti-spike S309 | Constructed based on Pinto et al., 2020. | N/A | |
| Antibody | Anti-StrepTagII Fab (clone C23.21) | Constructed based on patent WO2015067768A1 (Institut Pasteur) | N/A | |
| Antibody | Antibody variants: 3A3, hu3A3, RAY53, 3E11 | This study | N/A | Sequences can be found in Supplementary file 4. |
| Antibody | Goat anti human κ HRP | SouthernBiotech | Cat# 2060-05 | |
| Antibody | Goat anti human IgG Fc-AF647 | Jackson ImmunoResearch | Cat# 109-605-008 | |
| Antibody | Goat anti mouse Ig HRP | SouthernBiotech | Cat# 1010-05 | |
| Antibody | Goat anti-human IgG Fc-HRP (polyclonal) | SouthernBiotech | Cat# 2047-05 | |
| Antibody | Human Fab2 anti-strep-tag (clone C23.21) | Jason McLellan Lab | N/A | |
| Antibody | Mouse anti c-myc, clone 9E10 | BioXCell | Cat #MA1-980 | |
| Antibody | Mouse anti FLAG (M2) HRP | Sigma-Aldrich | Cat# A8592 | |
| Antibody | Mouse anti FLAG (M2) PE | BioLegend/Prozyme | Cat# 637309/ #PJ315 | |
| Antibody | Mouse anti-M13 pVIII-HRP, clone RL-pH1 | Santa Cruz Biotech | Cat# sc53004 | |
| Cell line (Cricetulus griseus) | CHO-T | Acyte BioTech | N/A | |
| Cell line (C. griseus) | CHOK-1 | ATCC | Cat# CCL-61 | |
| Cell line (C. griseus) | ExpiCHO | Thermo Fisher Scientific | Cat# A29133 | |
| Cell line (Homo sapiens) | Expi293 | Thermo Fisher Scientific | Cat# A41249 | |
| Cell line (H. sapiens) | Freestyle HEK293-F | Thermo Fisher Scientific | Cat# R79007 | |
| Cell line (H. sapiens) | HEK-293T-hACE2 | BEI Resources | Cat# NR-52511 | |
| Cell line (H. sapiens) | HEK293T | ATCC | Cat# CRL-3216 | |
| Cell line (H. sapiens) | NK-92 V158 | ATCC | Cat# PTA-8836 | |
| Cell line (H. sapiens) | THP-1 | ATCC | Cat# TIB-202 | |
| Cell line (H. sapiens) | Vero HL | Piepenbrink et al., 2022 | N/A | |
| Chemical compound, drug | Biotin | Sigma-Aldrich | Cat# B4501-10G | |
| Chemical compound, drug | Calcein AM | BD Pharmingen | Cat# 564061 | |
| Chemical compound, drug | Flash Red 1μ Beads | Bangs Laboratories | Cat# FSFR004 | |
| Chemical compound, drug | pHrodo iFL Green STP Ester | Thermo Fisher Scientific | Cat# P36013 | |
| Chemical compound, drug | TMB Substrate | Thermo Fisher Scientific | Cat# 34021 | |
| Commercial assay or kit | Alexa Fluor 647 Protein Labelling Kit | Fisher Scientific | Cat# A20173 | |
| Commercial assay or kit | ExpiFectamine 293 Transfection Kit | Thermo Fisher Scientific | Cat# A14524 | |
| Commercial assay or kit | ExpiFectamine CHO Transfection Kit | Thermo Fisher Scientific | Cat# A29129 | |
| Commercial assay or kit | HiTrap Protein A columns | Cytiva | Cat# 17-5498-54P | |
| Commercial assay or kit | IMAC Sepharose 6 Fast Flow resin | Cytiva | Cat# 17092107 | |
| Commercial assay or kit | Lipofectamine 2000 | Thermo Fisher Scientific | Cat# 11668019 | |
| Commercial assay or kit | Mycostrip test | Invivogen | Cat# rep-mys-10 | |
| Commercial assay or kit | Octet Anti-Human Fab-CH1 2nd Generation (FAB2G) Biosensors | Forte Bio | Cat# 18-5125 | |
| Commercial assay or kit | Octet Streptavidin (SA) Biosensor | Forte Bio | Cat# 18-5019 | |
| Commercial assay or kit | Protein Thermal Shift Dye Kit | Thermo Fisher Scientific | Cat# 4461146 | |
| Commercial assay or kit | Series S Sensor Chip CM5 | Cytiva | Cat# BR100530 | |
| Commercial assay or kit | Strep-Tactin XT Superflow high capacity cartridge | IBA | Cat# 2-4026-001 | |
| Commercial assay or kit | Superdex 200 Increase 10/300GL | Cytiva | Cat# 28-9909-44 | |
| Organisms (Mus musculus) | Balb/c mice | Charles River | Cat# 028 | |
| Other | HBS EP+buffer | Cytiva | Cat# BR100669 | |
| Peptide, recombinant protein | Avidin | Sigma-Aldrich | Cat# A9275-25MG | |
| Peptide, recombinant protein | Streptavidin AF647 | Jackson ImmunoResearch | Cat# 016600084 | |
| Peptide, recombinant protein | Streptavidin PE | BioLegend | Cat# 405204 | |
| Recombinant DNA reagent | AbVec hIgG1 | Smith et al., 2009 | N/A | |
| Recombinant DNA reagent | AbVec hIgKappa | Smith et al., 2009 | N/A | |
| Recombinant DNA reagent | HDM-IDTSpike-fixK | BEI Resources | Cat# NR-52514 | |
| Recombinant DNA reagent | M13KO7 helper phage (virus) | NEB | N0315S | |
| Recombinant DNA reagent | pcDNA3.1(-)- Wuhan-Hu-1 Spike | Walls et al., 2020 BEI Resources | Cat# NR-52420 | |
| Recombinant DNA reagent | pCMV-VSV-G | Cell Biolabs | Cat# RV-110 | |
| Recombinant DNA reagent | pCTCon-Fab | Wang et al., 2018 | N/A | |
| Recombinant DNA reagent | pHAGE-CMV-Luc2-IRS-ZsGreen-W | BEI Resources | Cat# NR-52516 | |
| Recombinant DNA reagent | pHAGE2-EF1aInt-ACE2-WT | BEI Resources | Cat# NR-52512 | |
| Recombinant DNA reagent | pLEX307-DPP4-G418 | Addgene | Cat# 158453 | |
| Recombinant DNA reagent | pMoPac24 | Hayhurst et al., 2003 | N/A | |
| Sequence-based reagent | Primers for cloning mouse variable regions | Krebber et al., 1997 | N/A | |
| Software, algorithm | Astra Software V6.1.2 | Wyatt Technology | RRID:SCR_016255 | |
| Software, algorithm | Biacore X100 Evaluation Software V2.0.1 | GE Healthcare | N/A | |
| Software, algorithm | cisTEM | Grant et al., 2018 | RRID:SCR_016502 | |
| Software, algorithm | cryoSPARC | Punjani et al., 2017 | RRID:SCR_016501 | |
| Software, algorithm | DynamX v3.0 | Waters | Part# 720005145en | |
| Software, algorithm | Excel 1808 | Microsoft | N/A | |
| Software, algorithm | Fiji | Schindelin et al., 2012 | RRID:SCR_002285 | |
| Software, algorithm | FlowJo 10.7.1 | BD Biosciences | RRID:SCR_008520 | |
| Software, algorithm | GraphPad Prism, v9.2.0 | Motulsky and Brown, 2006 | RRID:SCR_002285 | |
| Software, algorithm | HD-eXplosion v 1.2 | Naifu Zhang and Sheena D’Arcy (The University of Texas at Dallas) | N/A | |
| Software, algorithm | Image J v1.53e | NIH | RRID:SCR_003070 | |
| Software, algorithm | Octet Data Analysis Software V11.1 | Forte Bio | N/A | |
| Software, algorithm | ViiA 7 Software | Thermo Fisher Scientific | N/A | |
| Strain, strain background (Escherichia coli) | DH5α electrocompetent cells | NEB | Cat# C2987H | |
| Strain, strain background (E. coli) | XL1-Blue | Agilent | Cat# 200228 | |
| Strain, strain background (Saccharomyces cerevisiae) | AYW101 | Wentz and Shusta, 2007 | N/A | |
| Strain, strain background (S. cerevisiae) | EBY100 yeast | ATCC | Cat# MYA-4941 |
Additional files
-
Supplementary file 1
HDX summary table for antibody peptides.
- https://cdn.elifesciences.org/articles/83710/elife-83710-supp1-v3.zip
-
Supplementary file 2
Complete HDX data for spike and antibody peptides.
- https://cdn.elifesciences.org/articles/83710/elife-83710-supp2-v3.xlsx
-
Supplementary file 3
Width of isotopic distributions for example spike peptides.
Peptides were selected from regions identified as having bimodal distributions in Costello et al. We had no coverage in residues 626–636 and 1146–1166. Peak width (PW) in Da was calculated in triplicate for each peptide in the non-deuterated sample (ND Control) and at each time point of exchange. The SD is reported. The change in peak width (ΔPW) was calculated by subtracting the PW of the control from the PW of the sample. Bimodality was assessed by taking the maximum peak width for a particular peptide (ΔPWmax) and assessing if it was greater than 2 Da. Peak width was calculated using a method similar to Weis et al., 2006. Peptides were centroided with the Apex3D algorithm using DynamX (Waters). Following manual curation, ion stick data were transferred into Excel as two columns of data, m/z values and intensities, and the maximum peak in the isotopic envelope was determined. The list was then searched in descending m/z order to identify the two lowest m/z peaks that straddled 20% of the maximum peak intensity. The m/z value at an envelope intensity of 20% of the maximum intensity was determined using linear interpolation between these two peaks. This process was repeated with a search in ascending m/z order. The relative peak width was determined by multiplying by z (the charge state). For peptide spectra without peaks straddling 20% of the maximum peak intensity on one side of the maximum, typical for lower m/z peaks for peptides exhibiting low deuteration, the farthest isotopic centroid peak on that side was used as the m/z limit for calculating peak width while the other m/z limit was determined using the previously described method.
- https://cdn.elifesciences.org/articles/83710/elife-83710-supp3-v3.docx
-
Supplementary file 4
Antibody variable region sequences.
- https://cdn.elifesciences.org/articles/83710/elife-83710-supp4-v3.docx
-
MDAR checklist
- https://cdn.elifesciences.org/articles/83710/elife-83710-mdarchecklist1-v3.pdf
Download links
A two-part list of links to download the article, or parts of the article, in various formats.
Downloads (link to download the article as PDF)
Open citations (links to open the citations from this article in various online reference manager services)
Cite this article (links to download the citations from this article in formats compatible with various reference manager tools)
Identification of a conserved S2 epitope present on spike proteins from all highly pathogenic coronaviruses
eLife 12:e83710.
https://doi.org/10.7554/eLife.83710


