Selective loss of CD107a TIGIT+ memory HIV-1-specific CD8+ T cells in PLWH over a decade of ART
- IrsiCaixa AIDS Research Institute, Spain
- Universitat Autònoma de Barcelona, Cerdanyola del Vallès, Spain
- Pathology Department, Case Western Reserve University, United States
- Lluita contra la SIDA Foundation, Hospital Universitari Germans Trias i Pujol, Spain
- Infectious Diseases Department, Hospital Universitari Germans Trias i Pujol, Spain
- Germans Trias i Pujol Research Institute (IGTP), Spain
- Faculty of Medicine, University of Vic - Central University of Catalonia (UVic-UCC), Spain
- CIBER Enfermedades Infecciosas (CIBERINFEC), Instituto de Salud Carlos III, Spain
Figures
Figure 1 with 2 supplements
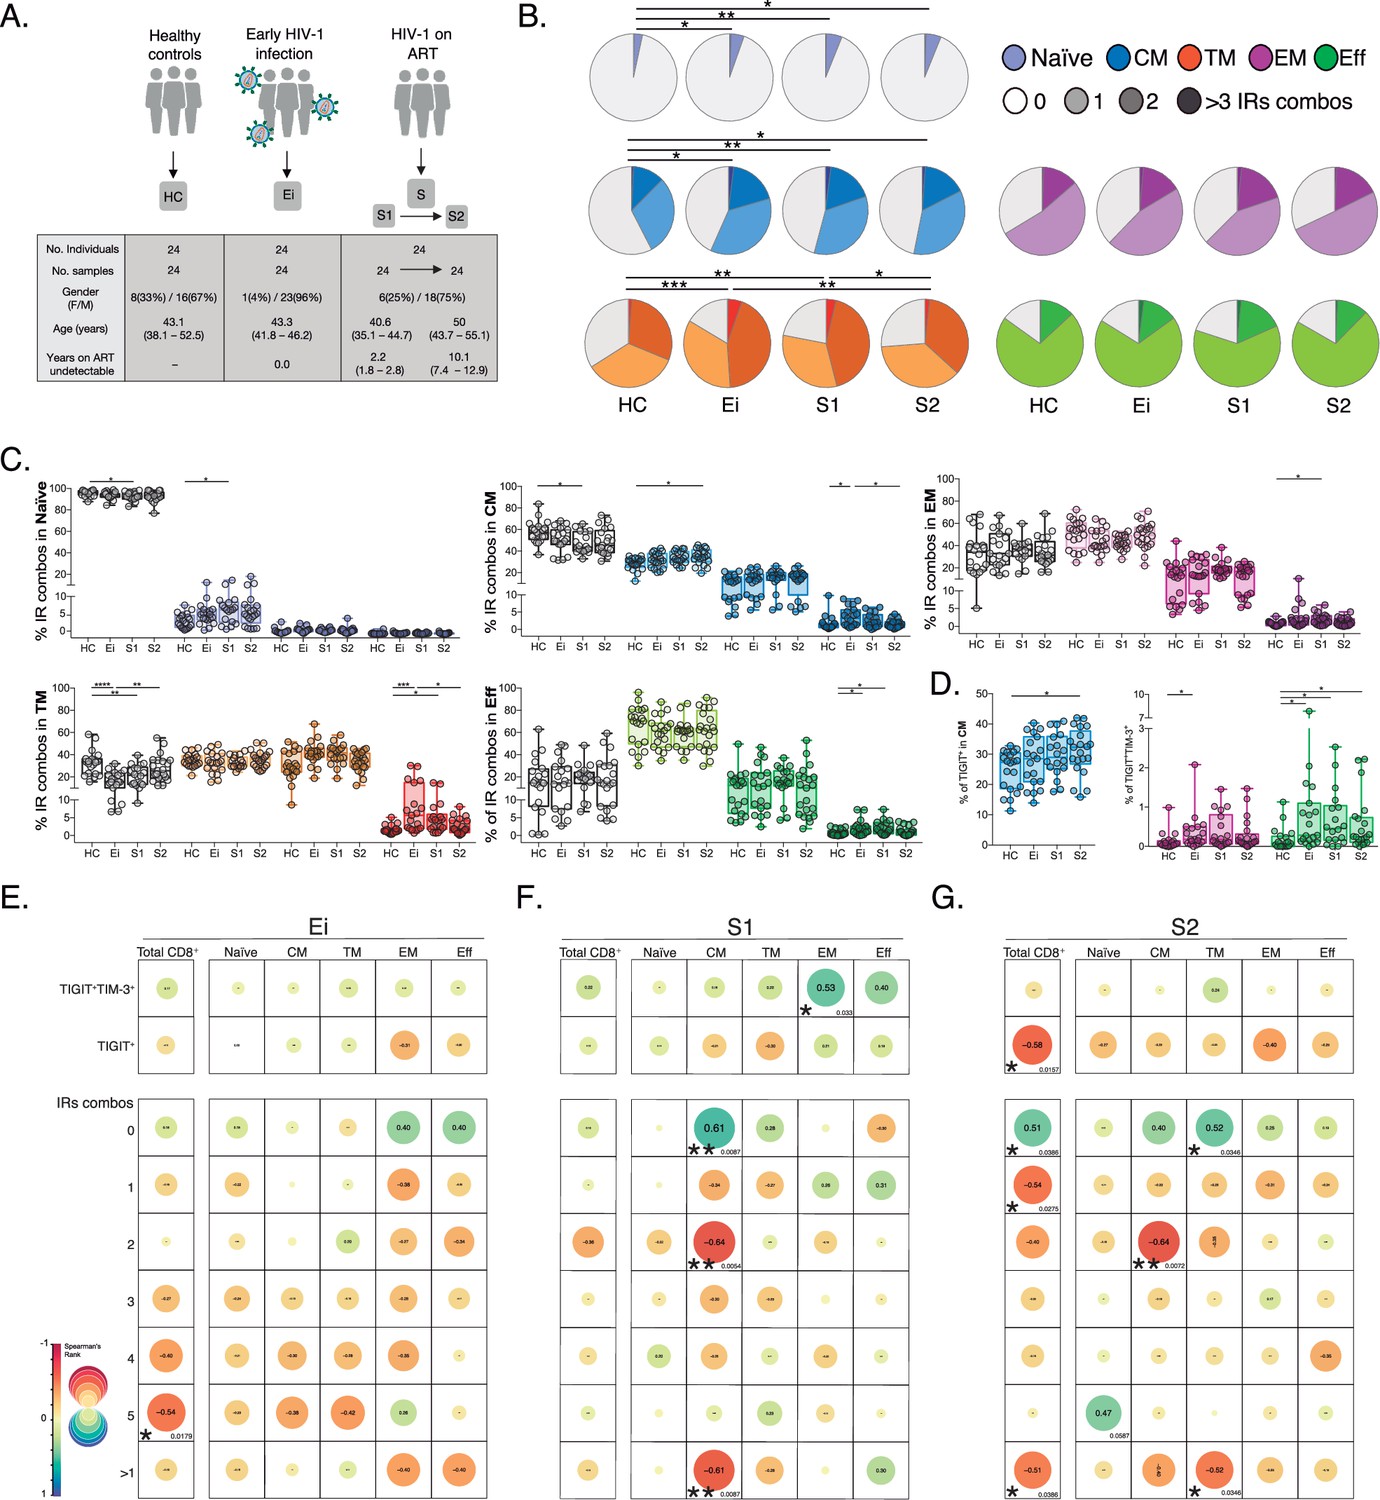
Patterns of IRs co-expression and correlations with CD4+ T-cell counts in PLWH.
(A) Overview of study design and study groups, healthy controls (HC), PLWH in early HIV-1 infection (Ei), and PLWH on fully suppressive ART (S) in S1 and S2 time points. (B) The expression of IRs summarized in the pie chart is none, one, two, or more than three IRs expressed in CD8+ T-cell subsets. For statistical analysis, we used permutation tests using SPICE software. (C) Scatter plots showing the median and interquartile ranges of IR combinations in CD8+ T- cell subsets. (D) Scatter plots of the frequencies of single TIGIT+ expression in CM and TIGIT+TIM-3+ expression in EM and effector EFF CD8+ T cells. (E–G) Correlations between CD4+ T-cell counts as a function of TIGIT+, TIGIT+TIM-3+, and combinations of IRs from total CD8+ T-cells and subsets in Ei (E), S1 (F), and S2 (G). The data in B to D represent the mean of two technical replicates. We used the Mann-Whitney U test for intergroup comparison (HC, Ei, S1, and S2) and the signed-rank test for intragroup comparison (S1 and S2). Holm’s method was used to adjust statistical tests for multiple comparisons. All possible correlations of the 32 Boolean IRs combinations are not shown. p-values: *<0.05, **<0.005 and ***<0.0005. Sample sizes in A: HC (24), Ei (24), S1(24), S2 (24). Sample sizes in B–G: HC (20), Ei (21), S1(18), S2 (21).
-
Figure 1—source data 1
Epidemiological and clinical data of study groups; healthy controls (HC), PLWH in early infection (Ei), and PLWH on fully suppressive ART (S) in S1 and S2 time points.
- https://cdn.elifesciences.org/articles/83737/elife-83737-fig1-data1-v1.xlsx
-
Figure 1—source data 2
Frequencies of IRs expression shown in pie charts as 0 to >3 IRs expressed in CD8+ T-cell subsets and study groups.
- https://cdn.elifesciences.org/articles/83737/elife-83737-fig1-data2-v1.xlsx
-
Figure 1—source data 3
Frequencies of the 32 possible combinations of expressions for TIGIT, PD-1, LAG-3, TIM-3, and CD39 in CD8+ T-cell subsets per study group.
- https://cdn.elifesciences.org/articles/83737/elife-83737-fig1-data3-v1.xlsx
-
Figure 1—source data 4
Frequencies of IRs expression in total and CD8+ T-cell subsets per study group.
- https://cdn.elifesciences.org/articles/83737/elife-83737-fig1-data4-v1.xlsx
-
Figure 1—source data 5
Correlations between CD4+ T-cell counts and TIGIT+, TIGIT+TIM-3+, and combinations of IRs in total and CD8+ T-cell subsets per study group.
- https://cdn.elifesciences.org/articles/83737/elife-83737-fig1-data5-v1.xlsx
Figure 1—figure supplement 1
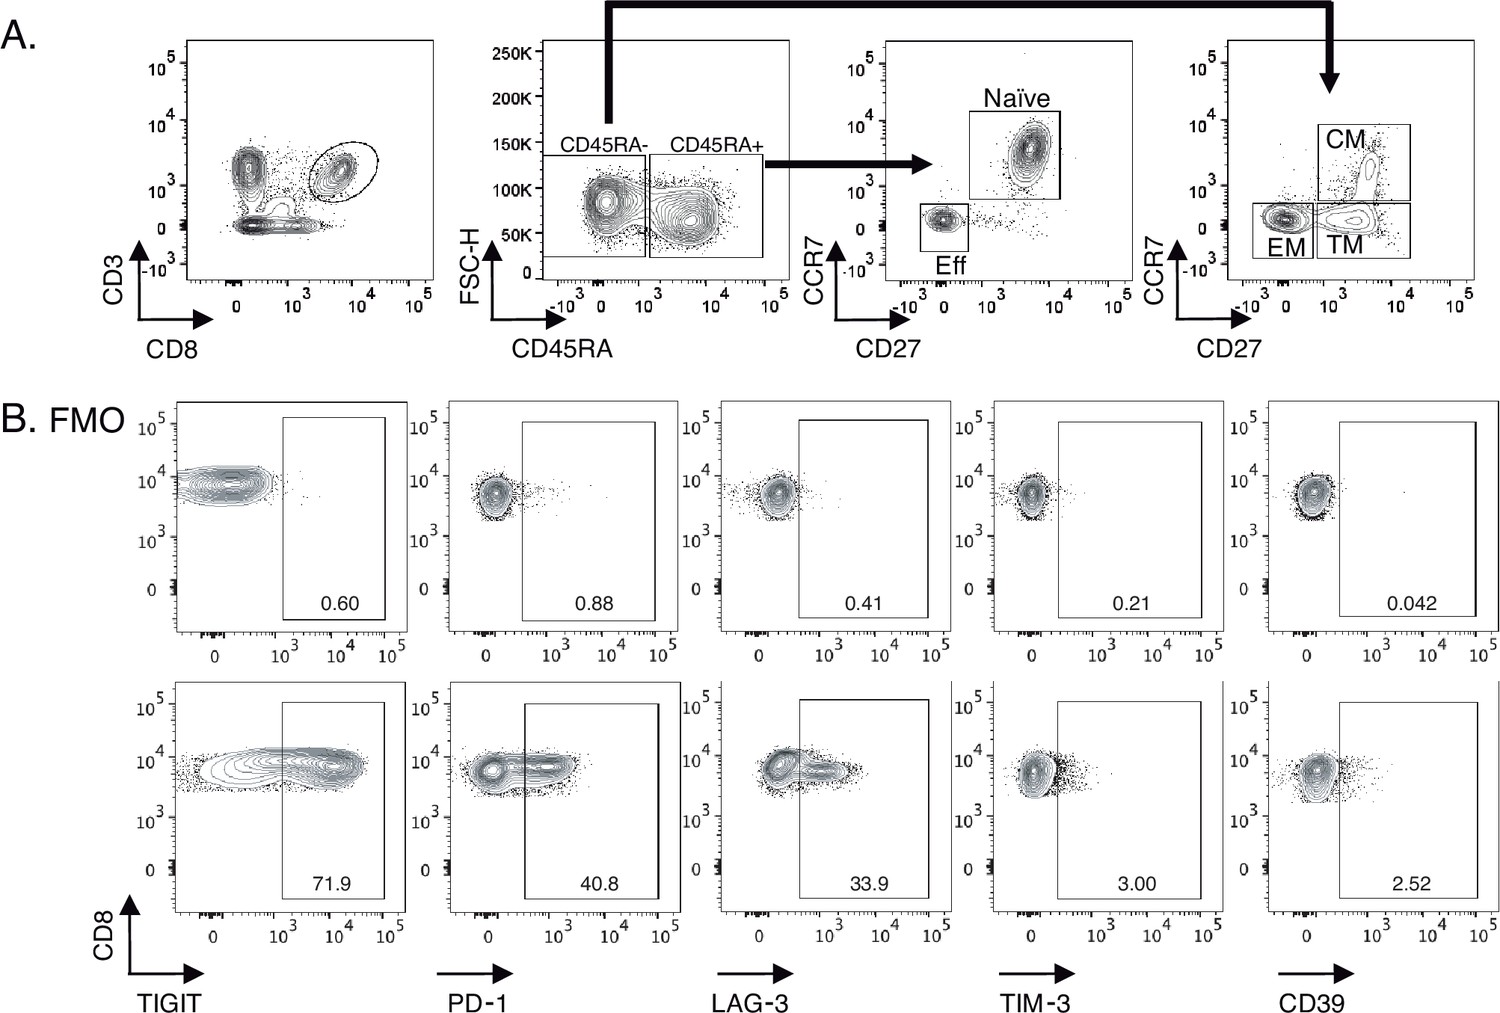
Gating strategy for identifying total CD8+ T-cell subsets and IRs expression levels.
(A) Zebra dot plots showing the gating strategy used for the identification of total CD8+ and cellular using lineage markers (CD45RA, CCR7, and CD27) subsets as follow; naive (CD45RA+ CCR7+ CD27+), Eff (CD45RA+ CCR7- CD27-), CM (CD45RA- CCR7+ CD27+), TM (CD45RA- CCR7- CD27+), and EM (CD45RA-, CCR7-, and CD27-). (B) Zebra dot plots of FMO and IRs staining demonstrating TIGIT, PD-1, LAG-3, TIM-3, and CD39 expression in cryopreserved PBMCs. Sample sizes: HC (20), Ei (21), S1(18), S2 (21).
Figure 1—figure supplement 2
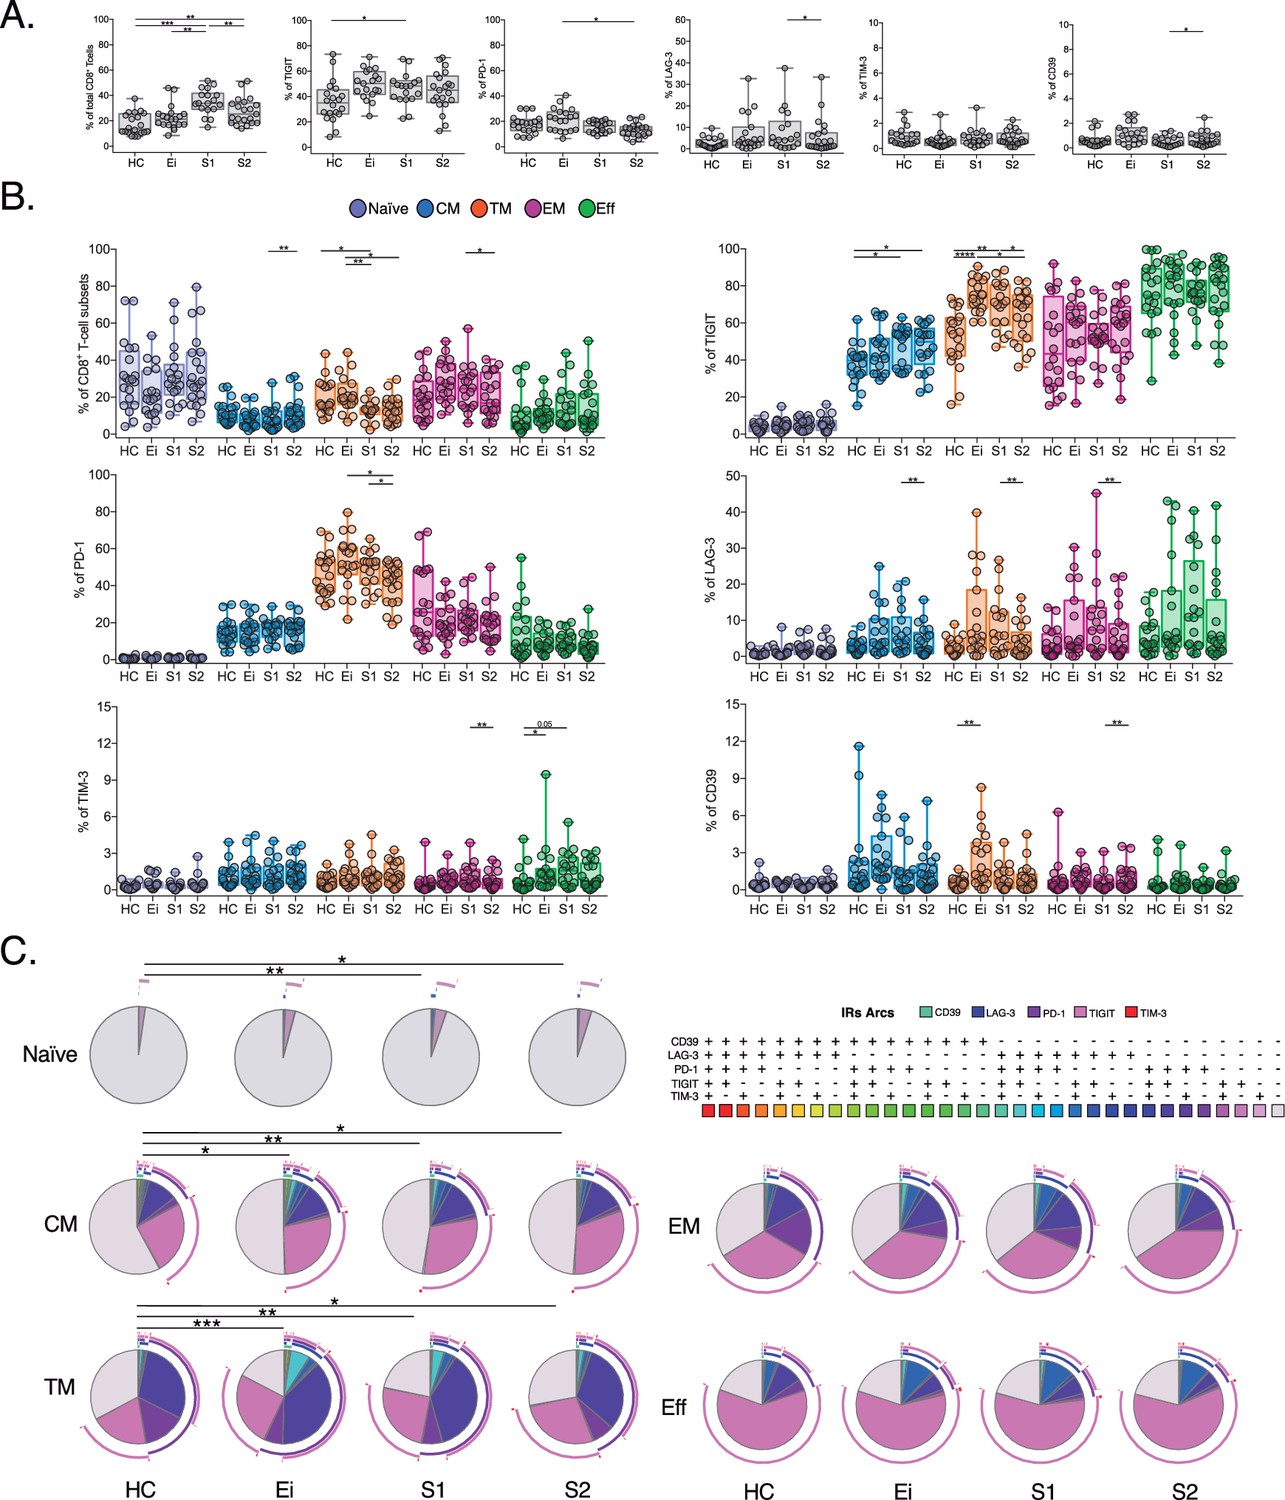
Expression profile of IRs in total and CD8+ T-cell subsets across study groups.
(A) Frequency of CD8+ T-cells and IRs expression in total CD8+ T cells across study groups (HC, Ei, S1 and S2) (B) Frequency of IRs expression in CD8+ T-cell subsets. Scatter plots represent median and interquartile ranges. (C) Co-expression profile of IRs across CD8+ T-cell subset. Pie charts represent the frequency for the 32 possible combinations for TIGIT, PD-1, LAG-3, TIM-3, and CD39 expression. The pie charts represent the frequency of expression according to the color code, and the arcs indicate the frequency of each IR. We used permutation tests of SPICE software for statistical analysis of IRs co-expression data. We used the Mann-Whitney U test for intergroup analyses and the signed-rank test for intragroup analyses. Holm’s method was used to adjust statistical tests for multiple comparisons. p-values: *<0.05, **<0.005, ***<0.0005, ****<0.00001. Sample sizes: HC (20), Ei (21), S1(18), S2 (21).
Figure 2
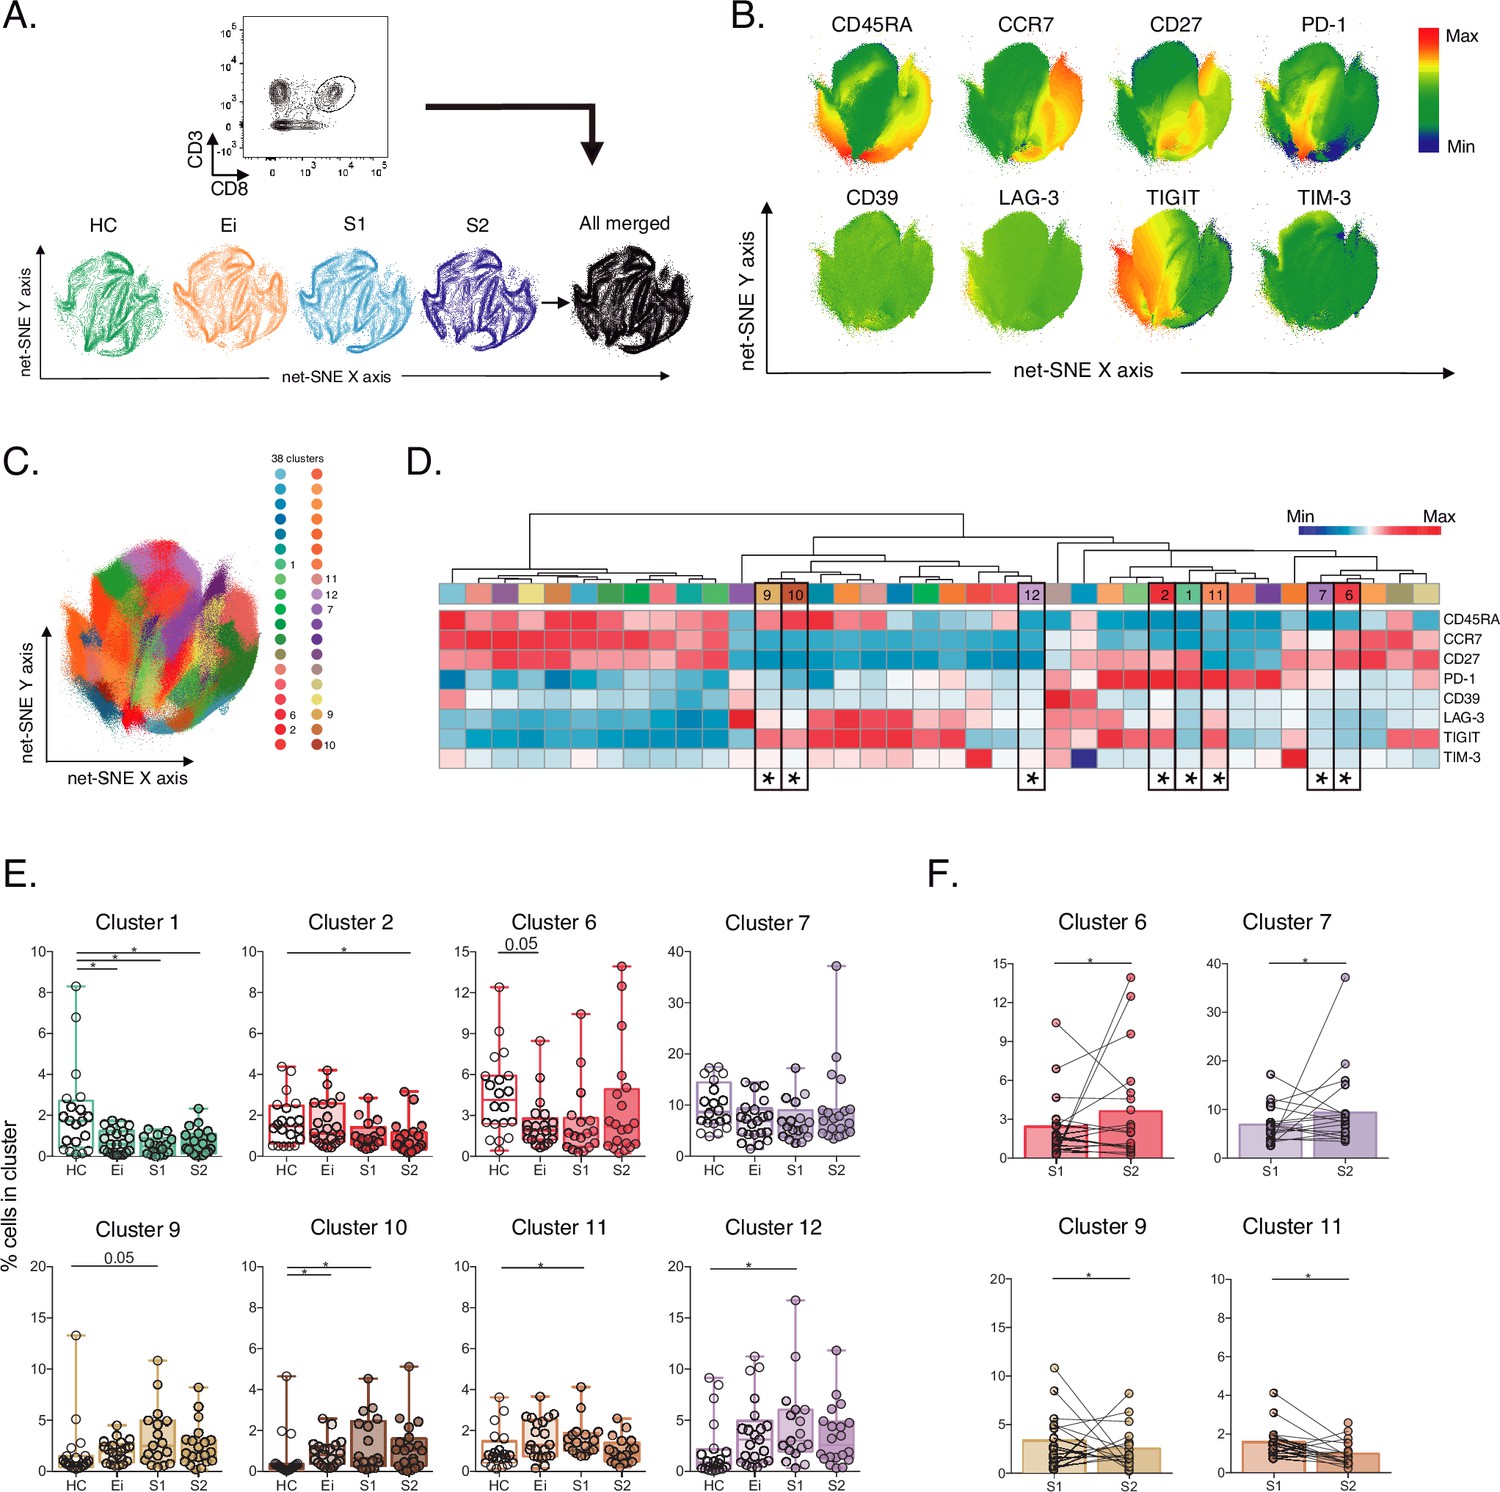
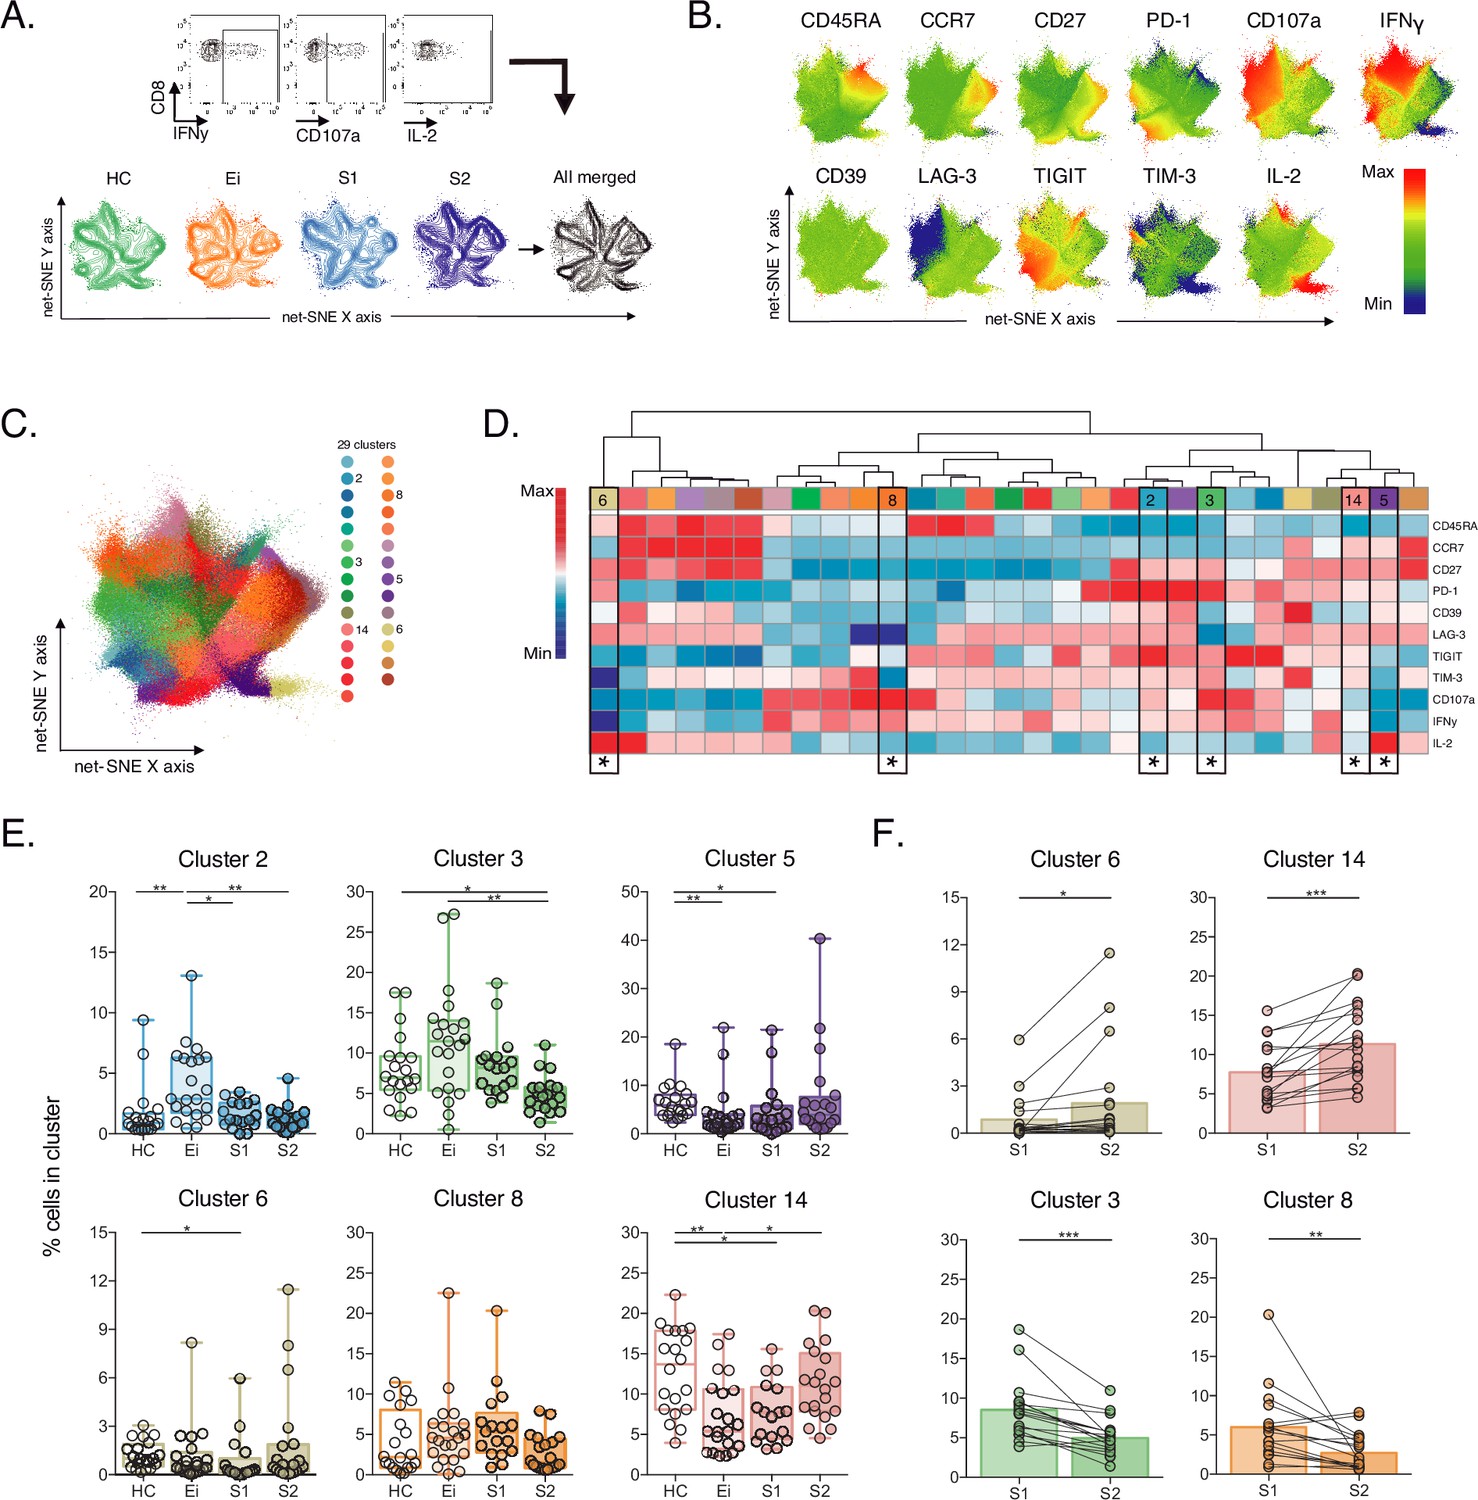
Unsupervised net-SNE analyses of total CD8+ T-cells.
(A) Gating strategy for selecting total CD8+ T-cells (top), net-SNE plots of HC, Ei, S1, S2 and all merge groups. (B) Representative net-SNE visualization of surface markers. The colour gradient displays the relative marker expression. (C) Unsupervised KNN algorithm of 38 clusters colored according to the legend. Only clusters with statistical differences are represented in the legend. (D) Heatmap of the median biexponential-transformed marker expression normalized to a –3–3 range of respective markers. Asterisks represent the clusters with statistical differences. (E–F) Scatter plots of intergroup (HC, Ei, S1 and S2) and intragroup (S1 and S2) cluster comparisons. Data represent the median and interquartile ranges of cluster cell frequency. We used the Mann-Whitney U test for intergroup analyses and the signed-rank test for intragroup analyses. Holm’s method was used to adjust statistical tests for multiple comparisons. p-values: *<0.05, **<0.005 and ***<0.0005. Sample sizes for A–F: HC (20), Ei (21), S1(18), S2 (21).
-
Figure 2—source data 1
Unsupervised net-SNE analyses of total CD8+ T-cells.
- https://cdn.elifesciences.org/articles/83737/elife-83737-fig2-data1-v1.xlsx
-
Figure 2—source data 2
Cluster cell frequencies from net-SNE analyses in total CD8+ T-cells per study group.
- https://cdn.elifesciences.org/articles/83737/elife-83737-fig2-data2-v1.xlsx
Figure 3 with 1 supplement
Unsupervised net-SNE analyses of SEB-activated CD8+ T-cells.
(A) Gating representation of CD107a, IFNγ and IL-2 expression in HIV-1-specific CD8+ T-cells (top), net-SNE plots of HC, Ei, S1, S2 and merge groups of SEB-activated CD8+ T-cells (bottom). (B) Representative net-SNE visualization of IR expression, lineage, and functional markers. The color gradient displays relative marker expression. (C) Unsupervised KNN algorithm for 29 polyclonal clusters color-coded according to the legend. Clusters with statistical differences between groups are represented in the legend. (D) Heatmap of the median biexponential-transformed marker expression normalized to a –3–3 range of respective markers. Asterisks represent the clusters with intergroup statistical differences. (E–F) Scatter plots of intergroup (HC, Ei, S1 and S2) and intragroup (S1 and S2) cluster comparisons. Data represent the median and interquartile ranges of cluster cell frequency. We used the Mann-Whitney U test for intergroup analyses and the signed-rank test for intragroup analyses. Holm’s method was used to adjust statistical tests for multiple comparisons. p-values: *<0.05, **<0.005, ***<0.0005. Sample sizes: HC (20), Ei (21), S1(18), S2 (21).
-
Figure 3—source data 1
Unsupervised net-SNE analyses of SEB-activated CD8+ T-cells.
- https://cdn.elifesciences.org/articles/83737/elife-83737-fig3-data1-v1.xlsx
-
Figure 3—source data 2
Cluster cell frequencies from net-SNE analyses of SEB-activated CD8+ T-cells per study group.
- https://cdn.elifesciences.org/articles/83737/elife-83737-fig3-data2-v1.xlsx
-
Figure 3—source data 3
Supervised analyses of CD107a, IFNγ and IL-2 frequencies of SEB-activated CD8+ T-cells per study groups.
- https://cdn.elifesciences.org/articles/83737/elife-83737-fig3-data3-v1.xlsx
Figure 3—figure supplement 1
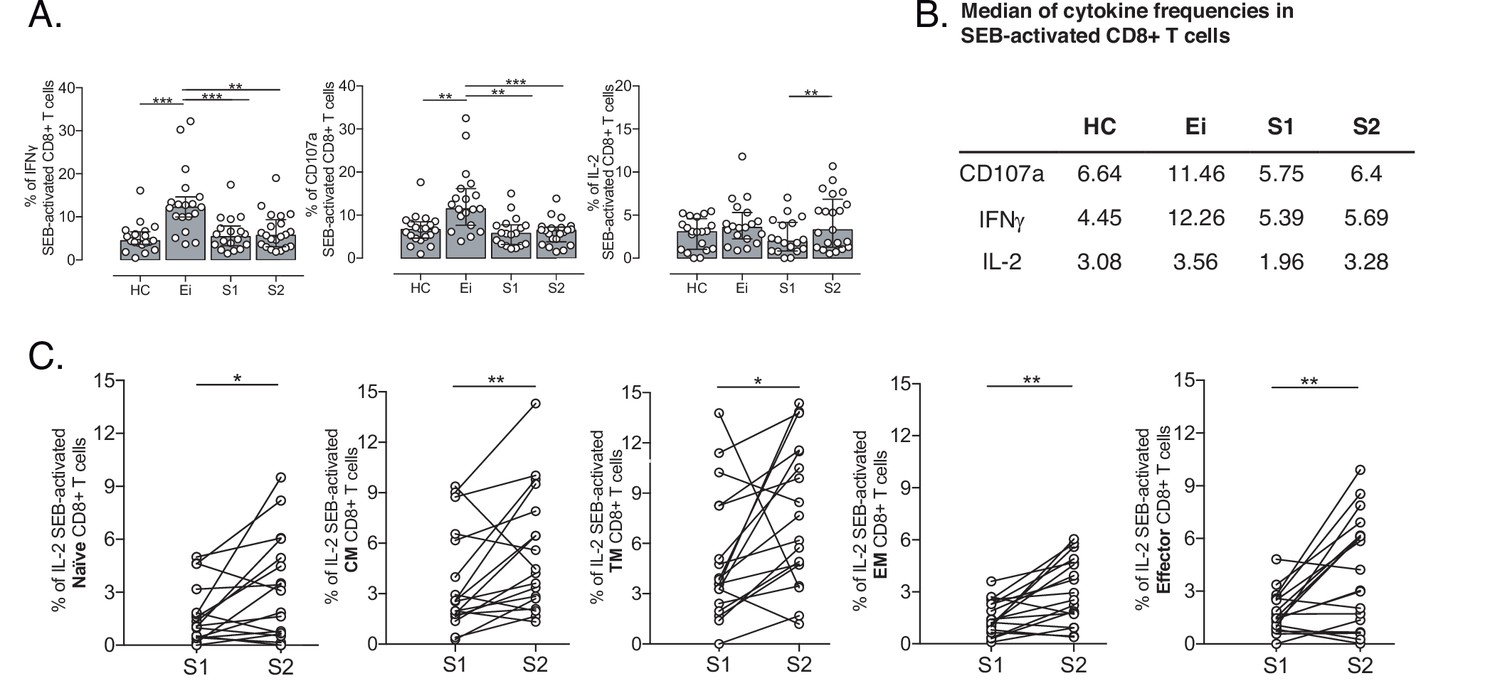
Supervised analyses of SEB-activated CD8+ T-cells.
(A) The total frequency of CD107a, IFNγ and IL-2 SEB-activated CD8+ T-cells in HC, Ei, S1, and S2. Data represent median and interquartile ranges. (B) Table of median frequencies of CD107a, IFNγ and IL-2 SEB-activated CD8+ T-cells. (C) Frequency of IL-2 SEB-activated CD8+ T-cell subsets in S1 and S2. We used the Mann-Whitney U test for independent median intergroup comparison and the signed-rank test for paired median changes between S1 and S2. The Holm’s method was used to adjust statistical tests for multiple comparisons. p-values: *<0.05, **<0.005, ***<0.0005. Sample sizes: HC (20), Ei (21), S1(18), S2 (21).
Figure 4 with 1 supplement
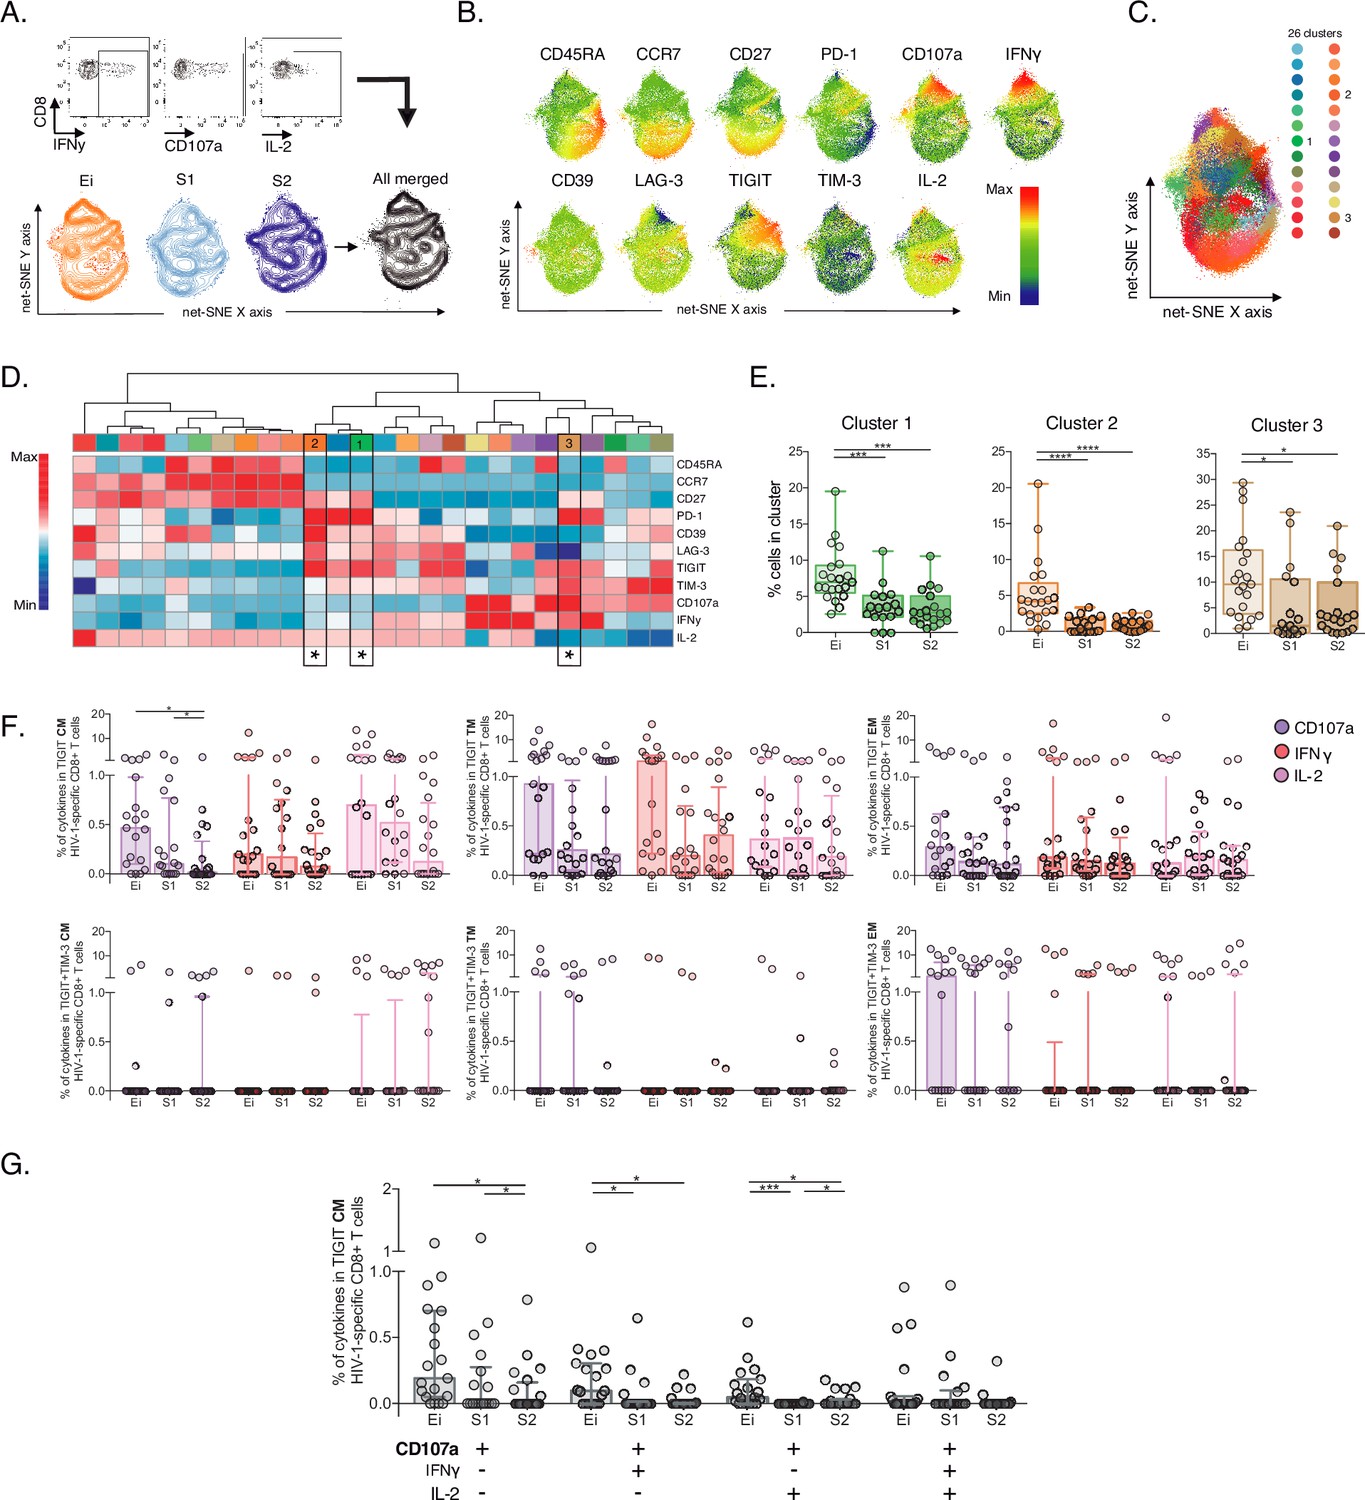
Unsupervised and supervised analyses of HIV-1-specific CD8+ T-cells.
(A) Gating representation of CD107a, IFNγ, and IL-2 expression in HIV-1-specific CD8+ T-cells (top), net-SNE plots of Ei, S1, S2 and merge groups for HIV-1-specific CD8+ T-cells (bottom). (B) Representative net-SNE plots for surface and functional markers. The color gradient displays relative marker expression. (C) Unsupervised KNN algorithm for 26 HIV-1-specific clusters color-coded according to the legend. Only clusters with statistical differences are represented in the legend. (D) Heatmap of the median biexponential-transformed marker expression normalized to a –3–3 range of respective markers. Asterisks represent the clusters with intergroup statistical differences. (E) Scatter plots of intergroup (Ei, S1 and S2) cluster comparisons with significant statistical differences. Data represent the median and interquartile ranges of cluster cell frequency. (F) CD107a, IFNγ, and IL-2 frequency of expression in TIGIT+ (upper panel) and TIGIT +TIM-3+ (bottom panel) HIV-1-specific memory CD8+ T-cell subsets. Scatter plots represent the median and interquartile ranges. (G) Polyfunctional analyses of CD107a, IFNγ, and IL-2 expression in CM TIGIT HIV-1-specific CD8+ T-cells. Scatter plots represent median and interquartile ranges. We used the Mann-Whitney U test for intergroup analyses and the signed-rank test for intragroup analyses. Holm’s method was used to adjust statistical tests for multiple comparisons. p-values: *<0.05, ***<0.0005, and ****<0.0001. Sample sizes: Ei (21), S1(18), S2 (21).
-
Figure 4—source data 1
Unsupervised net-SNE analyses of HIV-1-specific CD8+ T-cells.
- https://cdn.elifesciences.org/articles/83737/elife-83737-fig4-data1-v1.xlsx
-
Figure 4—source data 2
Cluster cell frequencies from net-SNE analyses of HIV-1-specific CD8+ Tcells per Ei and S (S1–S2) study groups.
- https://cdn.elifesciences.org/articles/83737/elife-83737-fig4-data2-v1.xlsx
-
Figure 4—source data 3
Supervised analyses of CD107a, IFNγ and IL-2 frequencies of HIV-1-specific CD8+ T-cells in Ei and S (S1–S2) study groups.
- https://cdn.elifesciences.org/articles/83737/elife-83737-fig4-data3-v1.xlsx
-
Figure 4—source data 4
Frequencies of CD107a, IFNγ, and IL-2 expression in TIGIT+ and TIGIT+ TIM-3+HIV-1-specific memory CD8+ T-cell subsets in Ei and S (S1–S2) study groups.
- https://cdn.elifesciences.org/articles/83737/elife-83737-fig4-data4-v1.xlsx
Figure 4—figure supplement 1

Supervised analyses of HIV-1-specific CD8+ T-cell responses.
(A) Frequency of CD107a, IFNγ and IL-2 HIV-1-specific CD8+ T-cells in Ei, S1 and S2. Data represent median and interquartile ranges. (B) Table of median frequencies of CD107a, IFNγ and IL-2 HIV-1-specific CD8+ T-cells. We used the Mann-Whitney U test for intergroup analyses and the signed-rank test for intragroup analyses. Holm’s method was used to adjust statistical tests for multiple comparisons. Sample sizes: HC (20), Ei (21), S1(18), S2 (21).
Figure 5
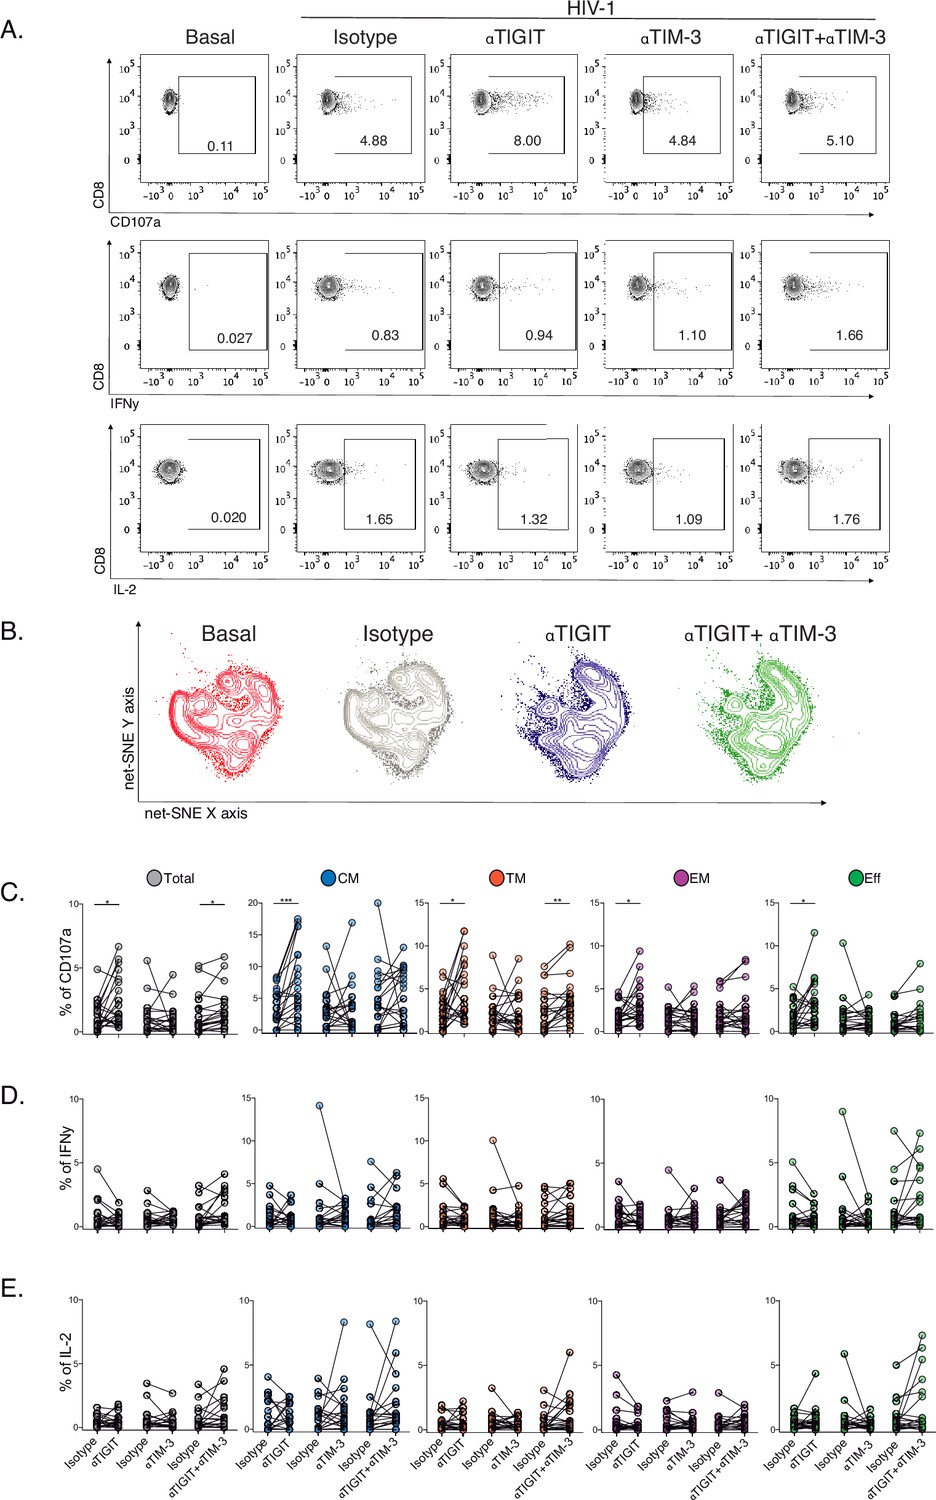
Effect of TIGIT, TIM-3, and TIGIT +TIM-3 mAb blockade in HIV-1-specific CD8+ T-cell responses in PLWH on ART.
(A) Representative flow cytometry plots gated on CD8+ T-cells, in the absence of HIV-1 Gag stimulation (basal condition) and presence of HIV-1 Gag stimulation with isotype control, αTIGIT, αTIM-3, and αTIGIT+αTIM-3 antibodies for CD107a, IFNγ and IL-2 expression. (B) Representative net-SNE plots for HIV-1-specific CD8+ T-cells from PLWH concatenated and merged according to the condition. (C–E) Frequency of CD107a, IFNγ, and IL-2 expression in total and HIV-1-specific CD8+ T-cell subsets for the various conditions tested. The Wilcoxon matched-pairs signed ranked test calculated statistical differences. The data represent the mean of two technical replicates. p-values:=0.05, *<0.05, **<0.005 and ***<0.0005. Sample sizes: S1(10), S2 (10).
-
Figure 5—source data 1
Unsupervised net-SNE analyses for HIV-1-specific CD8+ T-cells in PLWH on ART.
- https://cdn.elifesciences.org/articles/83737/elife-83737-fig5-data1-v1.xlsx
-
Figure 5—source data 2
Frequencies of CD107a, IFNγ, and IL-2 expression in total and subsets of HIV-1-specific CD8+ T-cells in PLWH on ART.
- https://cdn.elifesciences.org/articles/83737/elife-83737-fig5-data2-v1.xlsx
Author response image 1

Graphs represent paired comparisons of the frequency of live cells in PBMC samples in short-term ICB studies.
A. Graphs indicate the percentage of live cells in HIV-1 condition (Gag peptide pool) compared to HIV-1 + IgG2 isotype, HIV-1 + IgG1 isotype and HIV-1 + IgG2a+IgG1. B. Graphs indicate the % of live cells in HIV-1 compared to HIV-1 + aTIGIT, HIV-1 + aTIM-3 and HIV-1 + aTIGIT+ aTIM-3.
Additional files
-
Supplementary file 1
The epidemiological and clinical characteristics of the study groups.
- https://cdn.elifesciences.org/articles/83737/elife-83737-supp1-v1.docx
-
MDAR checklist
- https://cdn.elifesciences.org/articles/83737/elife-83737-mdarchecklist1-v1.pdf
Download links
A two-part list of links to download the article, or parts of the article, in various formats.
Downloads (link to download the article as PDF)
Open citations (links to open the citations from this article in various online reference manager services)
Cite this article (links to download the citations from this article in formats compatible with various reference manager tools)
Selective loss of CD107a TIGIT+ memory HIV-1-specific CD8+ T cells in PLWH over a decade of ART
eLife 12:e83737.
https://doi.org/10.7554/eLife.83737


