Fin whale song evolution in the North Atlantic
- Institute of Marine Sciences - OKEANOS & Institute of Marine Research - IMAR, University of the Azores, Portugal
- Cooperative Institute for Marine Ecosystem and Resources Studies, Oregon State University, United States
- Centre for Research into Ecological and Environmental Modelling, University of St Andrews, United Kingdom
- Centro de Estatística e Aplicações, Departamento de Biologia, Faculdade de Ciências, Universidade de Lisboa, Portugal
- NOAA Pacific Marine Environmental Laboratory, Hatfield Marine Science Center, United States
- CNRS - UBO - UBS - Ifremer, IUEM - Lab. Geo-Ocean, France
- Marine and Freshwater Research Centre (MFRC), Atlantic Technological University, Ireland
- Instituto Dom Luiz (IDL), Universidade de Lisboa, Portugal
- Institute of Marine Sciences, ICM‐CSIC, Spain
- Institute for the Study of Anthropic Impacts and Sustainability in the Marine Environment of the National Research Council of Italy (CNR-IAS), Italy
- Akvaplan-niva, Norway
- University of Iceland Research Centre in Húsavík, Iceland
Figures
Figure 1
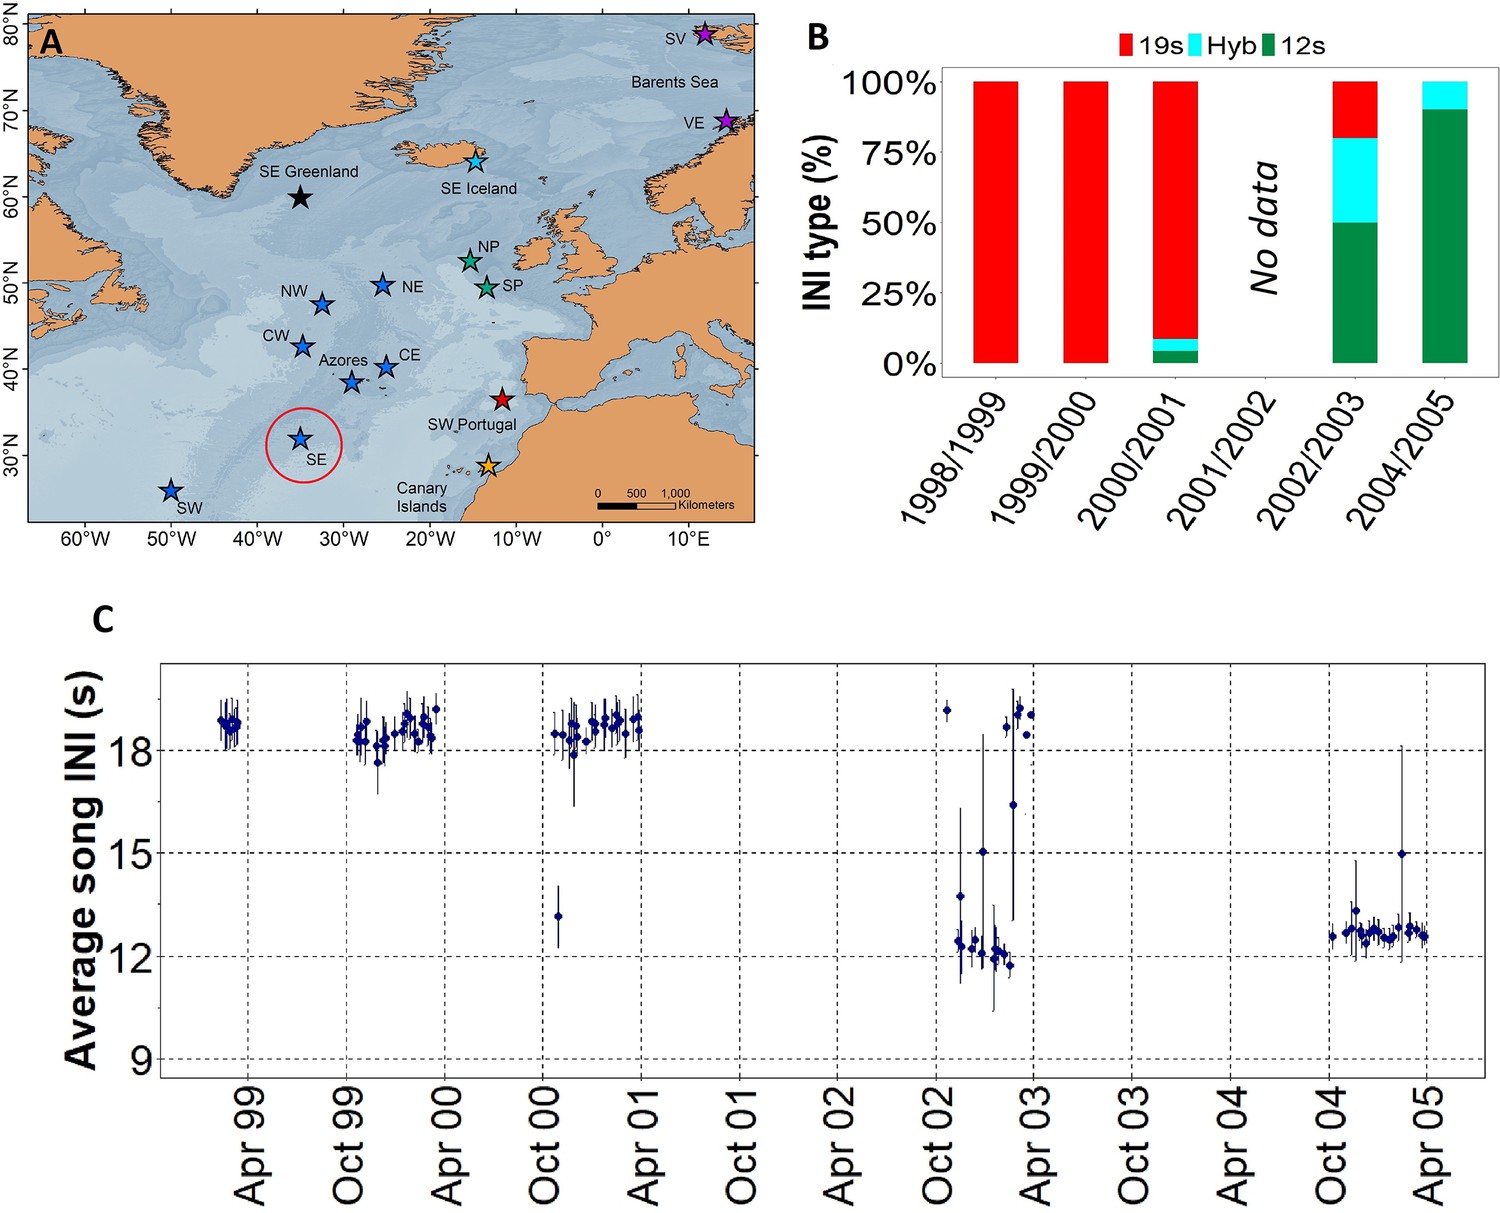
Transition in song INIs in the Oceanic Northeast Atlantic region.
(A) Map showing the SE location (red circle) of the Oceanic Northeast Atlantic region. (B) Percentage of songs with each inter-note interval (INI) type (19 s, hybrid (hyb), 12 s) in this location during the song INI shift in 1999 – 2005. (C) INIs from 1999 to 2005 for this same location. Points represent mean values per song and error bars are standard deviations.
Figure 2
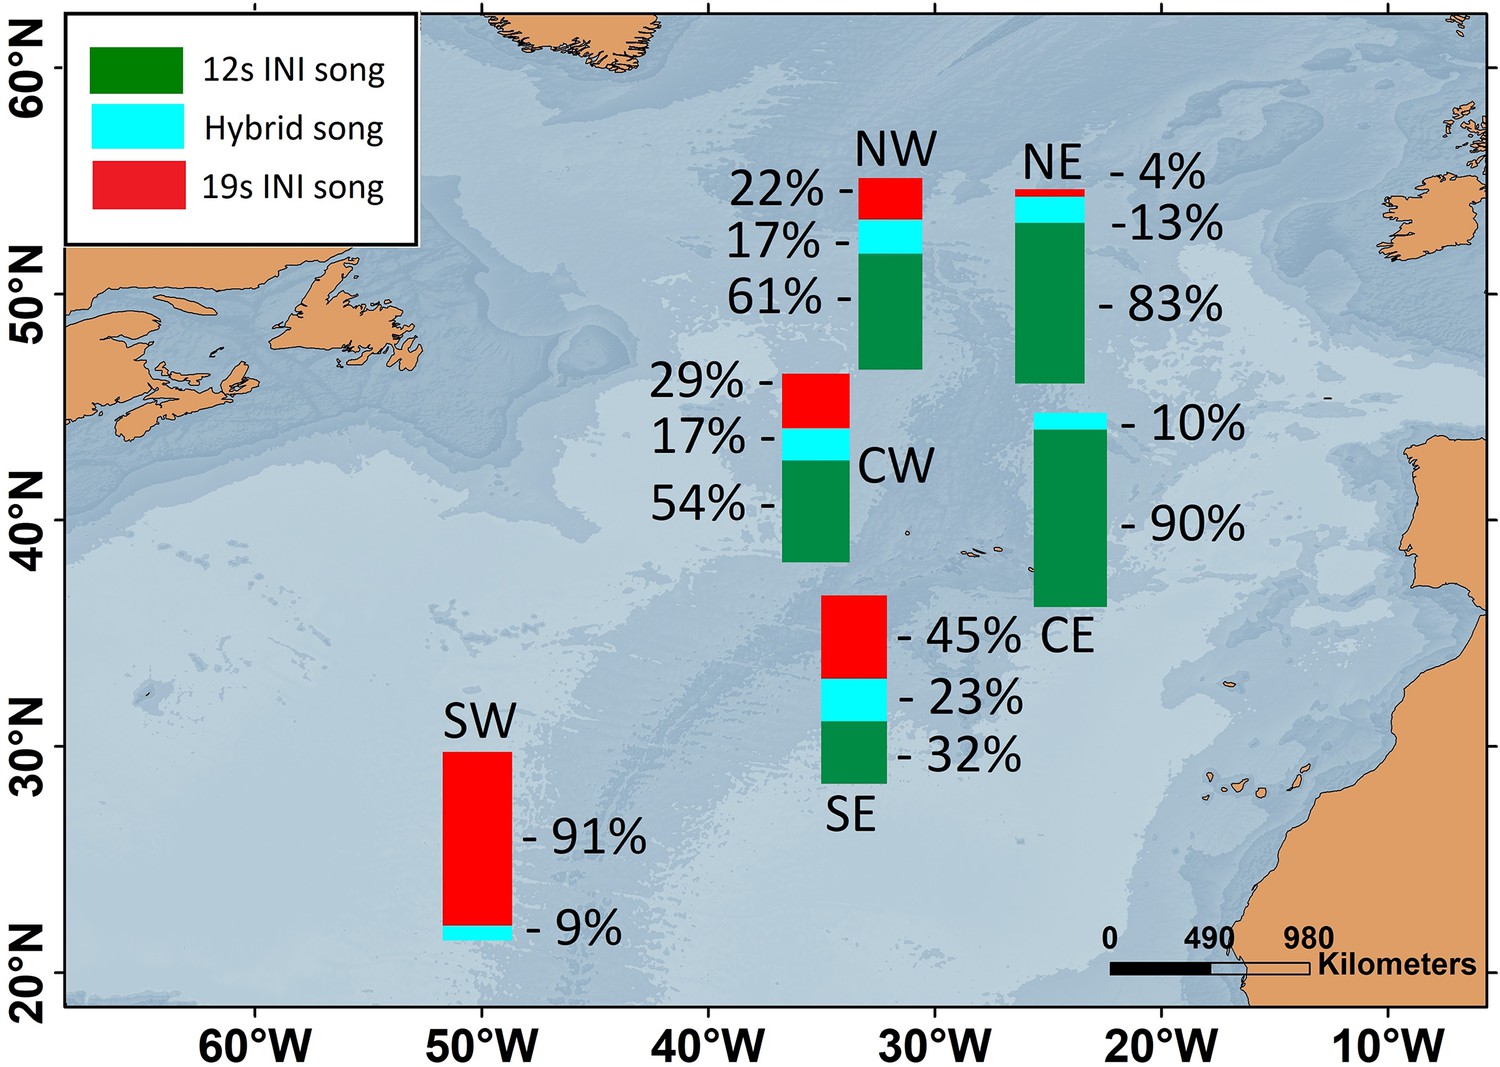
Map showing the percentages of fin whale songs with each inter-note interval (INI) type for six locations within the Oceanic Northeast Atlantic region during the 2002/2003 singing season.
Figure 3 with 2 supplements
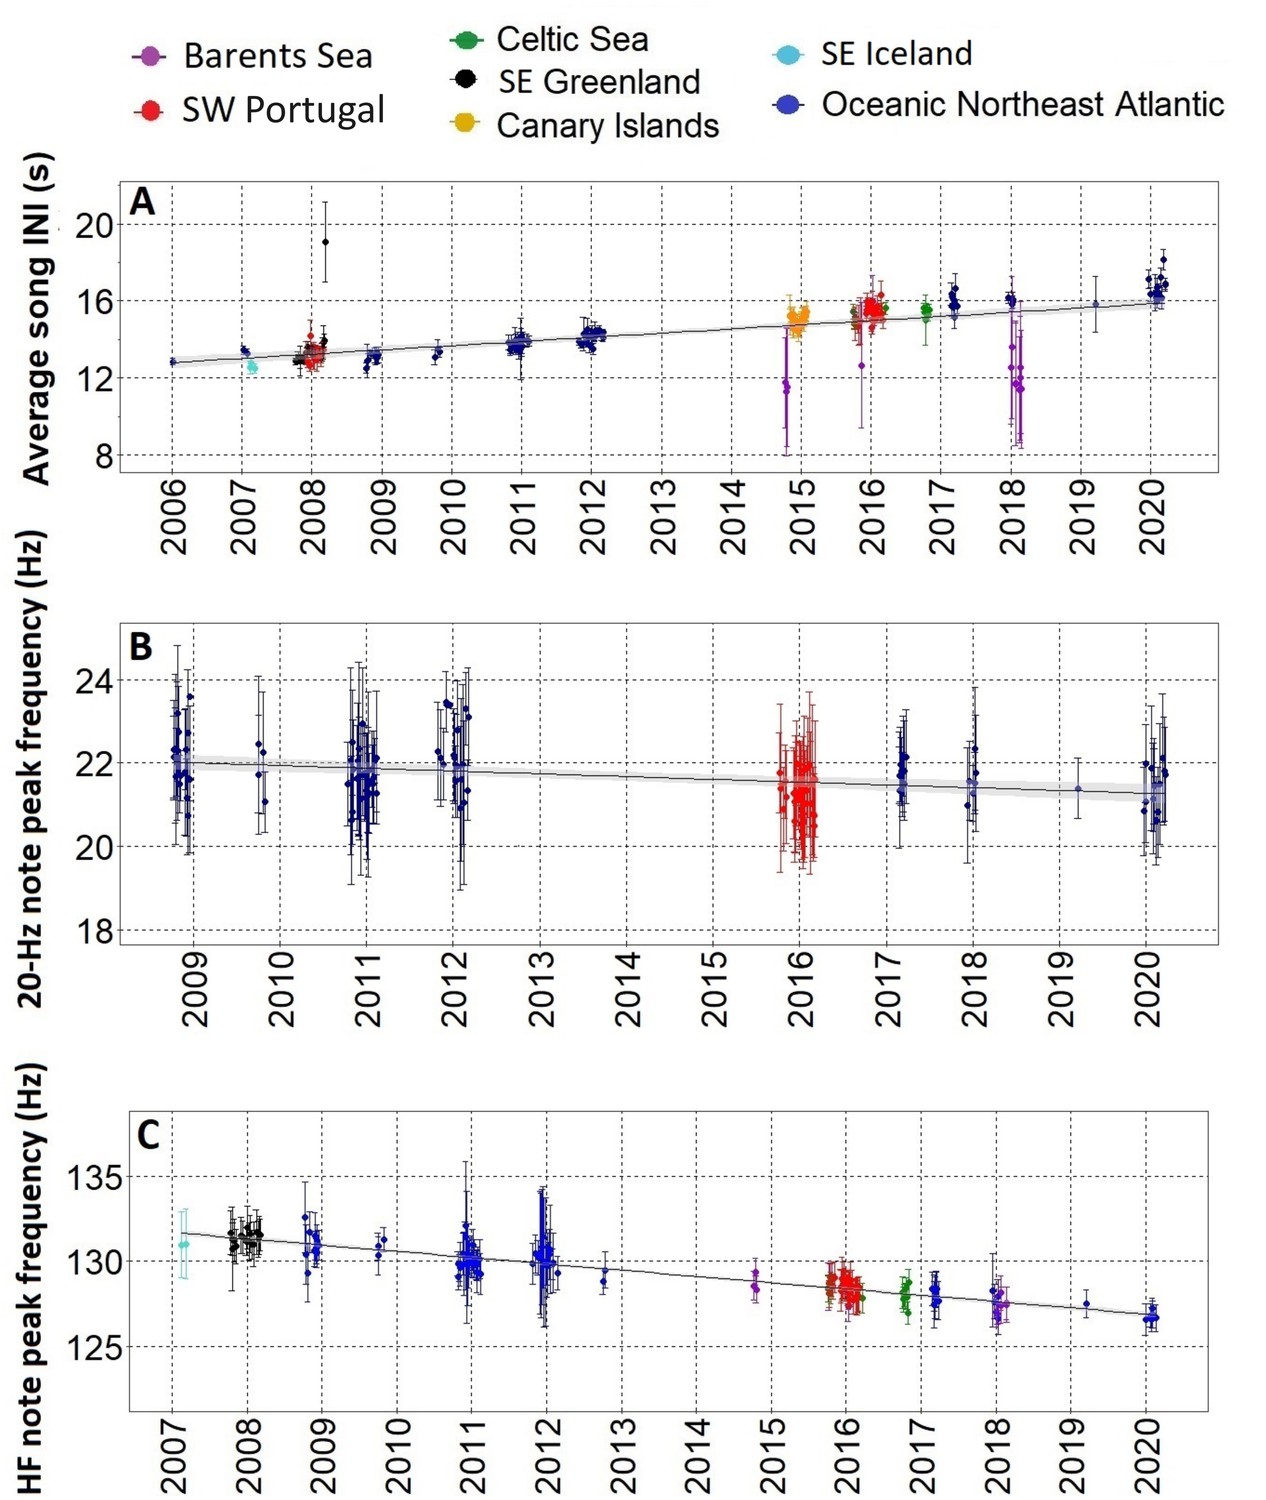
Gradual changes in song INIs and notes frequencies.
(A) Inter-note intervals (INIs) from 2006 to 2020 for all regions sampled. INIs increased at a mean rate of 0.21 s/yr. (B) Peak frequencies of the 20 Hz note for SW Portugal (2015/2016) and Azores locations (Oceanic Northeast Atlantic region) sampled with Ecologic Acoustic Recorders (Lammers et al., 2008) (2008–2020); these changed at a mean rate of –0.06 Hz/yr. (C) Peak frequencies of the High Frequency (HF) note for all regions sampled; these changed at a mean rate of –0.36 Hz/yr. Points represent average values per song, error bars are standard deviations and black lines represent the fitted linear regression model with confidence intervals in shadowed grey.
Figure 3—figure supplement 1

Linear model validation plots for fin whale song inter-note intervals (INIs) (A), 20 Hz note peak frequencies (B) and HF note peak frequencies (C).
Figure 3—figure supplement 2

Peak frequencies of the 20 Hz note for the regions sampled and equipment used: ARs (circle), and OBS (triangle).
EARs were used in recordings from the Oceanic Northeast Atlantic region from 2008 to 2020 and from the SW Portugal in 2015/2016. Points represent averaged peak frequencies per song and error bars are standard deviations.
Figure 4
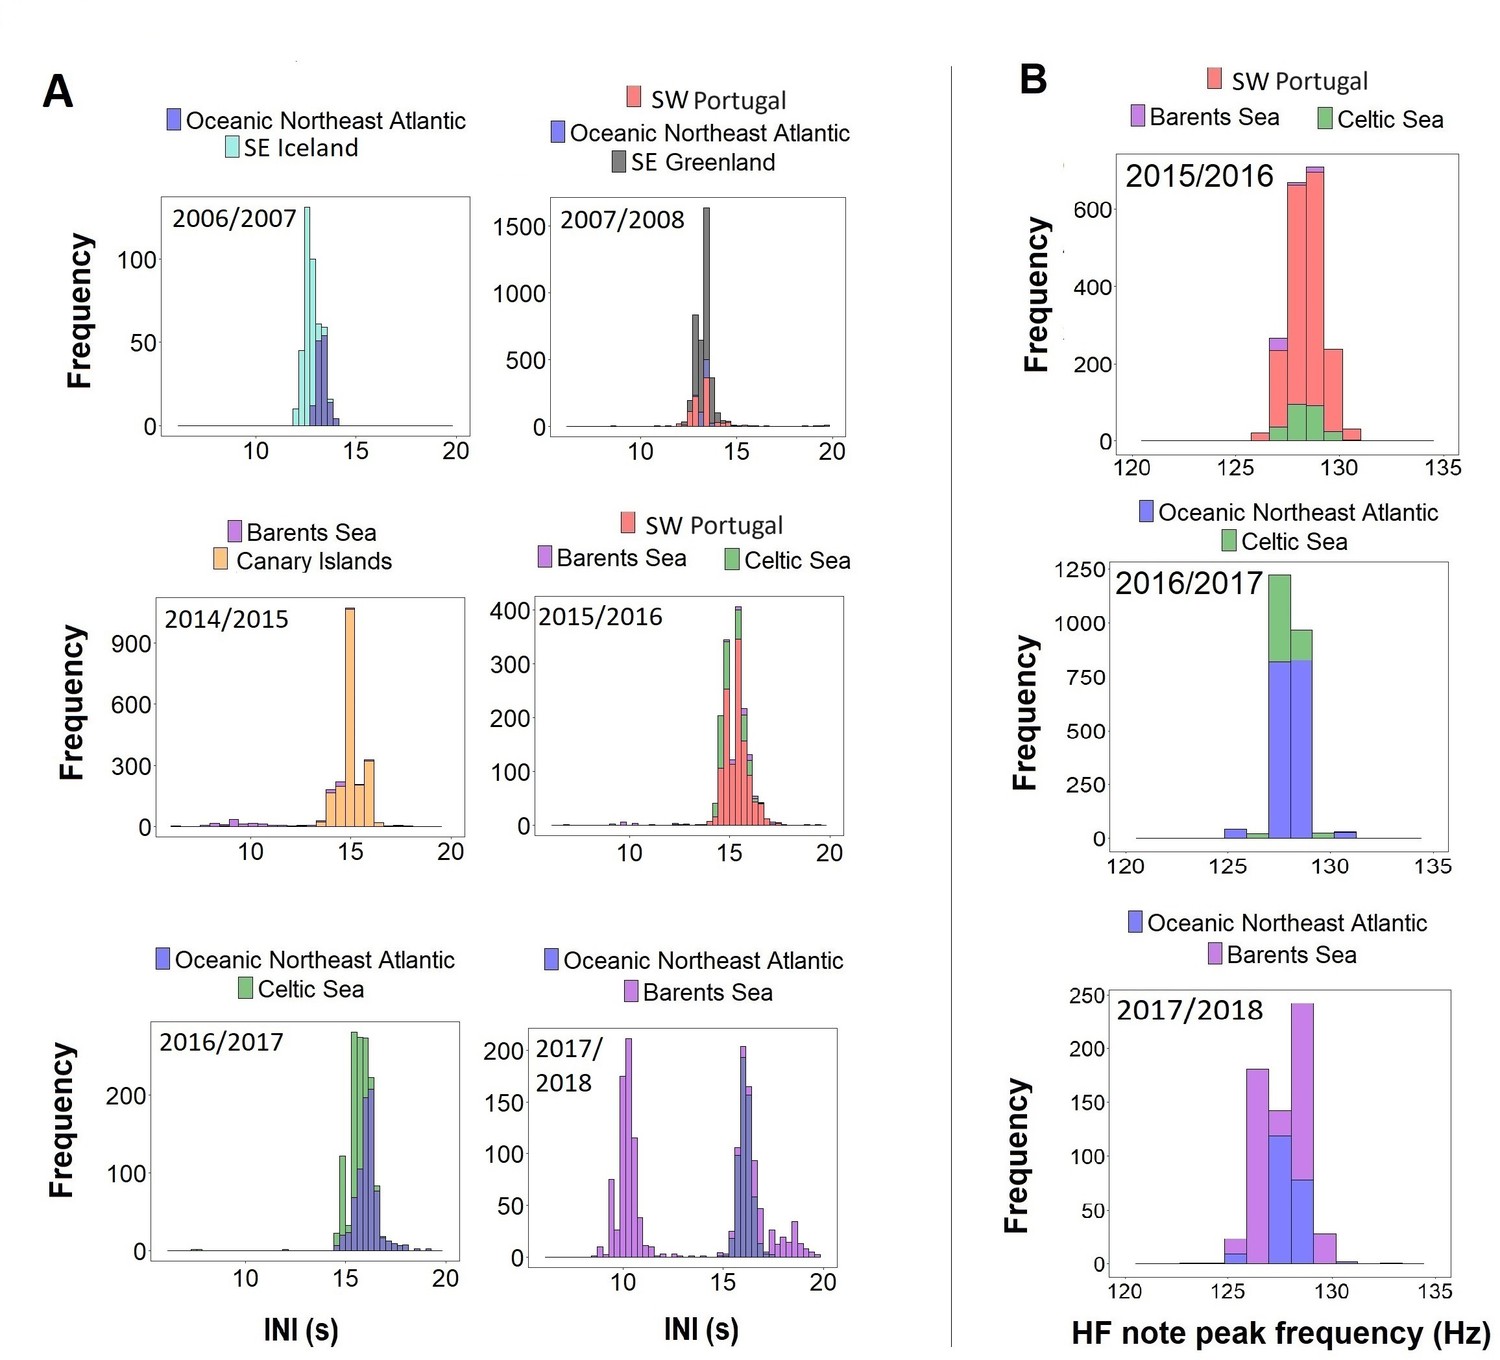
Histograms of (A) inter-note intervals (INIs) and (B) higher frequency (HF) note peak frequencies by singing season (Oct-Mar) from regions with concurrent data.
Figure 5 with 1 supplement
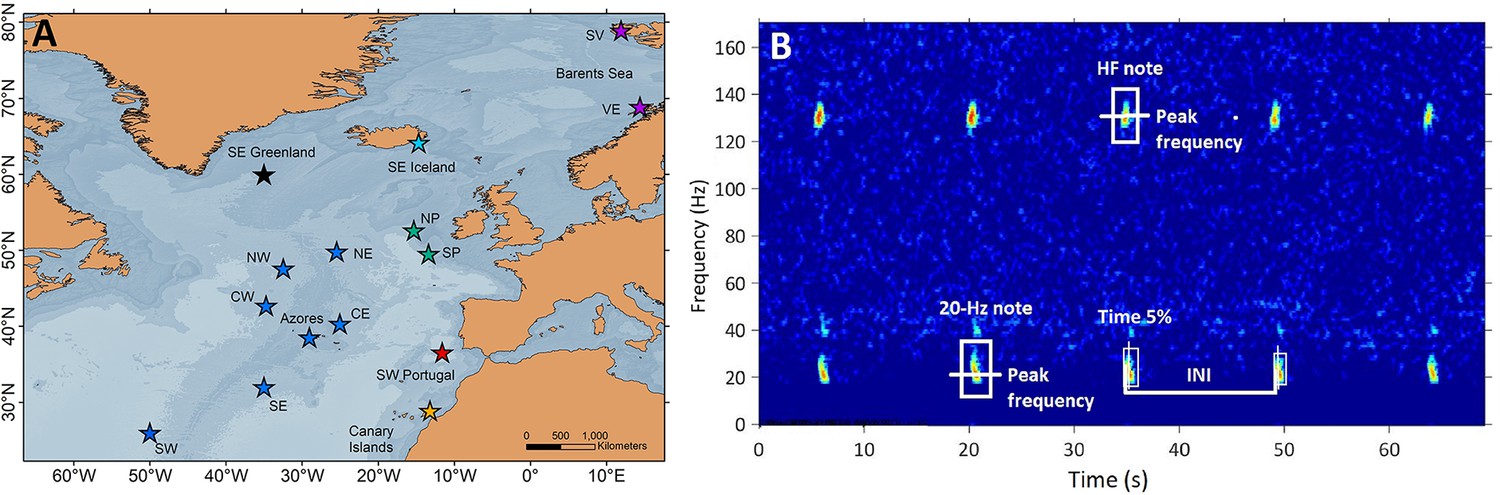
Sampling locations and fin whale song spectrogram.
(A) Locations (stars) of acoustic recordings grouped in regions (colours in stars): SE Greenland (black), SE Iceland (turquoise), Celtic Sea (NP: North Porcupine and SP: South Porcupine; green), Oceanic Northeast Atlantic (NW, NE, CW, CE, Azores, SW and SE; blue), SW Portugal (red), Canary Islands (yellow) and Barents Sea (SV: Svalbard and VE: Vesterålen; purple). (B) Spectrogram (FFT sample duration 0.5 s, Hann window, 50% overlap) of a fin whale song showing the acoustic parameters analysed in this study (INIs and peak frequencies of the 20 Hz and HF note).
Figure 5—figure supplement 1

Sampling effort for the inter-note intervals (INIs) (left) and high frequency (HF) note (right) analysis for each location and singing season (between October and March).
Tables
Table 1
Sampling information and effort.
For each location within each region this table shows: sampled period, duty cycle, sampling rate (Samp. rate), total number of recording hours (Rec. hours), number of measured inter-note intervals (INIs) (Num. INIs), contribution to total number of INIs measured (Contr. INIs), number of measured high frequency (HF) note peak frequencies (Num. HF note) and percent contribution to total number of measured HF note peak frequencies (Contr. HF note).
| Region | Location | Sampled period | Duty cycle(%) | Samp. rate (Hz) | Rec.hours | Num.INIs | Contr. INIs(%) | Num.HF note | Contr. HF note (%) |
|---|---|---|---|---|---|---|---|---|---|
| SE Greenland | SE Greenland | 01/10/2007 - 14/03/2008 | Cont. | 2000 | 4392 | 2841 | 7.1 | 2040 | 22.2 |
| SE Iceland | SE Iceland | 04/01/2007 - 31/03/2007 | Cont. | 4000 | 2088 | 291 | 0.7 | 169 | 1.9 |
| Celtic Sea | North Porcupine | 01/10/2015 - 03/11/2016 | 10 | 2000 | 520.8 | 286 | 0.7 | 215 | 2.3 |
| South Porcupine | 01/10/2015 - 03/11/2016 | 10 | 2000 | 520.8 | 674 | 1.7 | 627 | 6.9 | |
| ONA | NE | 01/10/2002 - 31/03/2003 | Cont. | 250 | 4344 | 2650 | 6.7 | NA | NA |
| NW | 01/10/2002 - 31/03/2003 | Cont. | 250 | 4344 | 2754 | 7.1 | NA | NA | |
| CE | 01/10/2002 - 31/03/2003 | Cont. | 250 | 4344 | 2817 | 7.1 | NA | NA | |
| CW | 01/10/2002 - 31/03/2003 | Cont. | 250 | 4344 | 2930 | 7.3 | NA | NA | |
| Azores | 01 –31/01/2006; 01-31/01/2007;01-31/01/2008 | Cont. | 2000 | 2232 | 573 | 1.4 | NA | NA | |
| 01/10/2008 - 06/03/2011 | 10 | 2000 | 650.4 | 749 | 1.8 | 1335 | 14.5 | ||
| 15/10/2011 - 06/03/2012 | 43 | 2000 | 1497.6 | 1017 | 2.5 | 677 | 7.3 | ||
| 01/10/2012 - 18/10/2012 | 29 | 2000 | 122.4 | 12 | 0.0 | 216 | 2.3 | ||
| 23/02/2017 - 31/03/2020 | 25 | 2000 | 2136 | 2382 | 6 | 2036 | 22.1 | ||
| Total | 6638.4 | 4733 | 11.9 | 4264 | 46.4 | ||||
| SE | 08/02/1999 - 31/03/2005 | Cont. | 110 | 31704 | 12996 | 32.7 | NA | NA | |
| SW | 31/12/2002 - 31/03/2003 | Cont. | 110 | 2184 | 1517 | 3.8 | NA | NA | |
| SW Portugal | SW Portugal0 | 01/12/2007 - 29/02/2008 | Cont. | 100 | 2184 | 818 | 2.1 | NA | NA |
| 01/10/2015 - 31/03/2016 | 20 | 2000 | 878.4 | 1195 | 3.1 | 1294 | 14 | ||
| Canary Islands | Canary Islands | 01/11/2014 - 29/02/2015 | Cont. | 100 | 2160 | 1991 | 5.1 | NA | NA |
| Barents Sea | Svalbard | 02/10/2014 - 31/01/2016 | Cont. | 500 | 2882 | 260 | 0.6 | 165 | 1.8 |
| Vesterålen | 01/01/2018 - 28/02/2018 | Cont. | 400 | 1416 | 927 | 2.3 | 411 | 4.5 | |
| Total | 74944.4 | 39680 | 100 | 9185 | 100 |
Additional files
-
Supplementary file 1
Supplementary information on sampliing of fin whale songs and recording equipment.
(a) Table showing information of each song analysed in this study: date, time of the first (Time first note) and last note analysed (Time last note), duration and number of INIs measured (Num. INIs). (b). Position, recording equipment and approximate (Approx.) depth for each location sampled. (c). Description of fin whale song measurements made with Raven Pro 1.4 software (Charif et al., 2010). (d) The effect of recording equipment on fin whale song parameters When comparing data from multiple sensors an obvious question is whether the results might be dependent on the specific sensors considered. To investigate the influence of the acoustic recorder type, OBS or ARs, on the song parameters, we analysed the same song fragment, consisting of 209 notes, recorded by the hydrophone channel of an OBS and an AR, specifically an Ecological Acoustic Recorder (EAR) (Lammers et al., 2008). The two instruments were deployed at ~6 km from each other in the Azores region in spring of 2019. Measurements of INIs and 20 Hz peak frequencies of songs recorded by each instrument were compared using a non-parametric paired samples Wilcoxon Test. Differences in HF note peak frequencies could not be tested because of limitations in the sampling rate of the OBS. Results showed that median INIs measured from OBS (16.52) and EARs (16.42) were not significantly different (P-value = 0.47) but median peak frequencies of the 20 Hz note (median OBS = 23.4; EARs = 21.1) were (P-value <0.001). Thus, the use of different recorders did not affect INI measurements but influenced measurements of 20 Hz peak frequencies. The effect of the distance to the source in the analysed fin whale song parameters is included in this study, given that these two recorders were positioned at different distances to the singer. Peak frequencies of the 20 Hz note showed a great variability between equipment types (Fig. S3), which hindered the identification of soft trends (i.e., low changing rate). For this reason, only data from the EARs, the longest dataset (2008 – 2020), were used to study temporal variations of the peak frequencies of the 20 Hz note. All statistical analyses were performed using the software R (v. 4.0.2) (R Core team, 2020).
- https://cdn.elifesciences.org/articles/83750/elife-83750-supp1-v2.docx
-
MDAR checklist
- https://cdn.elifesciences.org/articles/83750/elife-83750-mdarchecklist1-v2.pdf
Download links
A two-part list of links to download the article, or parts of the article, in various formats.
Downloads (link to download the article as PDF)
Open citations (links to open the citations from this article in various online reference manager services)
Cite this article (links to download the citations from this article in formats compatible with various reference manager tools)
Fin whale song evolution in the North Atlantic
eLife 13:e83750.
https://doi.org/10.7554/eLife.83750


