Netrin-1 regulates the balance of synaptic glutamate signaling in the adult ventral tegmental area
- Department of Psychiatry and Behavioral Sciences, University of Washington, United States
- Molecular and Cellular Biology Program, University of Washington, United States
- Department of Pharmacology, University of Washington, United States
Figures
Figure 1

Netrin-1 is present in the adult ventral tegmental area (VTA) and expressed by both dopamine and GABA neurons.
3D display of Ntn1 (A) and Slc6a3 (B, dopamine marker) from the Allen Brain Atlas. (C–D) 20 X magnification images of in situ hybridization (RNAScope) for Ntn1 (green) and Slc32a1 (GABA marker; red, C) and Th (dopamine marker; red; D). Arrows indicate co-labeling of Ntn1 with Slc32a1 (C) or Th (D). Scale bar indicates 20 μm. (E–F) Quantification of cell type expression. Of the cells expressing Ntn1, 72.2% were dopaminergic (Th+) and 18.1% were GABAergic (Slc32a1+; E). (F) Of the total of Th+ identified cells, 64.5% co-expressed Ntn1 (35.6% did not express Ntn1), and 30.4% of Slc32a1 identified cells co-expressed Ntn1 (69.5% did not express Ntn1). (G) Immunohistochemistry confirms the presence of Ntn1 protein (red) in both Th+ (cyan) and non-dopamine cells (Th- cells, indicated by yellow arrows).
-
Figure 1—source data 1
Cell counts.
- https://cdn.elifesciences.org/articles/83760/elife-83760-fig1-data1-v1.xlsx
Figure 2
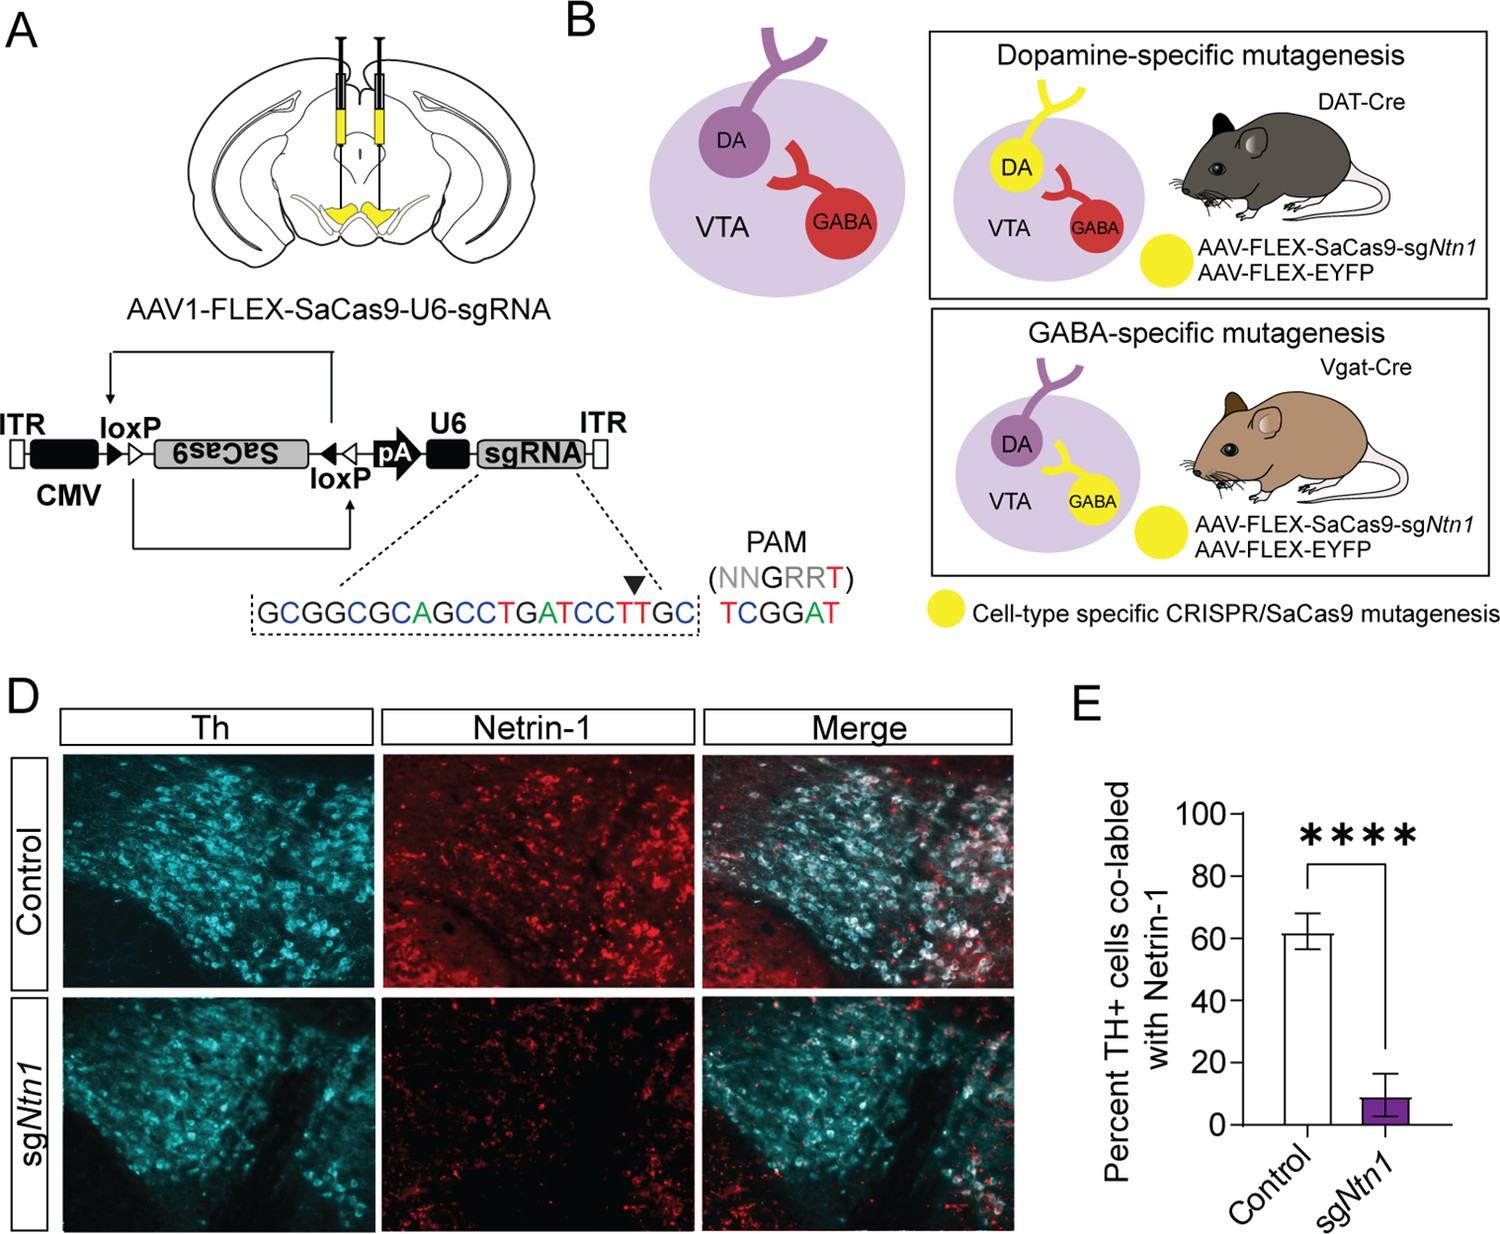
Virally delivered CRISPR-Cas9 complex targeting the Ntn1 locus results in a significant reduction in Ntn1 antibody staining.
(A–B) Schematics summarizing cell type-specific knockout procedure. (A) Adult mice were injected bilaterally into the VTA with AAV-FLEX-SaCas9-HA-sgNtn1 and AAV-FLEX-YFP. Control mice received an equivalent volume of -sgRosa26 and/or AAV-FLEX-YFP. SaCas9 is virally delivered into the genome in the inactive orientation and returned to the active orientation only in the presence of Cre recombinase, limiting Cas9 expression to target cells. (B) Schematic of the VTA (left) showing VTA GABA neurons project to and inhibit VTA dopamine neurons. By using transgenic Cre-driver mouse lines (right) viral delivery of SaCas9 results in gene disruption in specifically VTA dopamine neurons (DAT-Cre mice, top panel), or VTA GABA neurons (Vgat-Cre mice, bottom panel). (D) Example images for Th (cyan) and Ntn1 (red) immunostaining in the ventral tegmental area (VTA) of mice injected with control or sgNtn1 CRISPR virus. (E) Quantification of the percentage of Th + cells co-labled with Ntn1 (Students t-test; t=8.179, df = 10, 62.25 ± 5.796 vs 9.586 ± 2.807, ****p<0.0001).
-
Figure 2—source data 1
Cell counts.
- https://cdn.elifesciences.org/articles/83760/elife-83760-fig2-data1-v1.xlsx
Figure 3 with 3 supplements
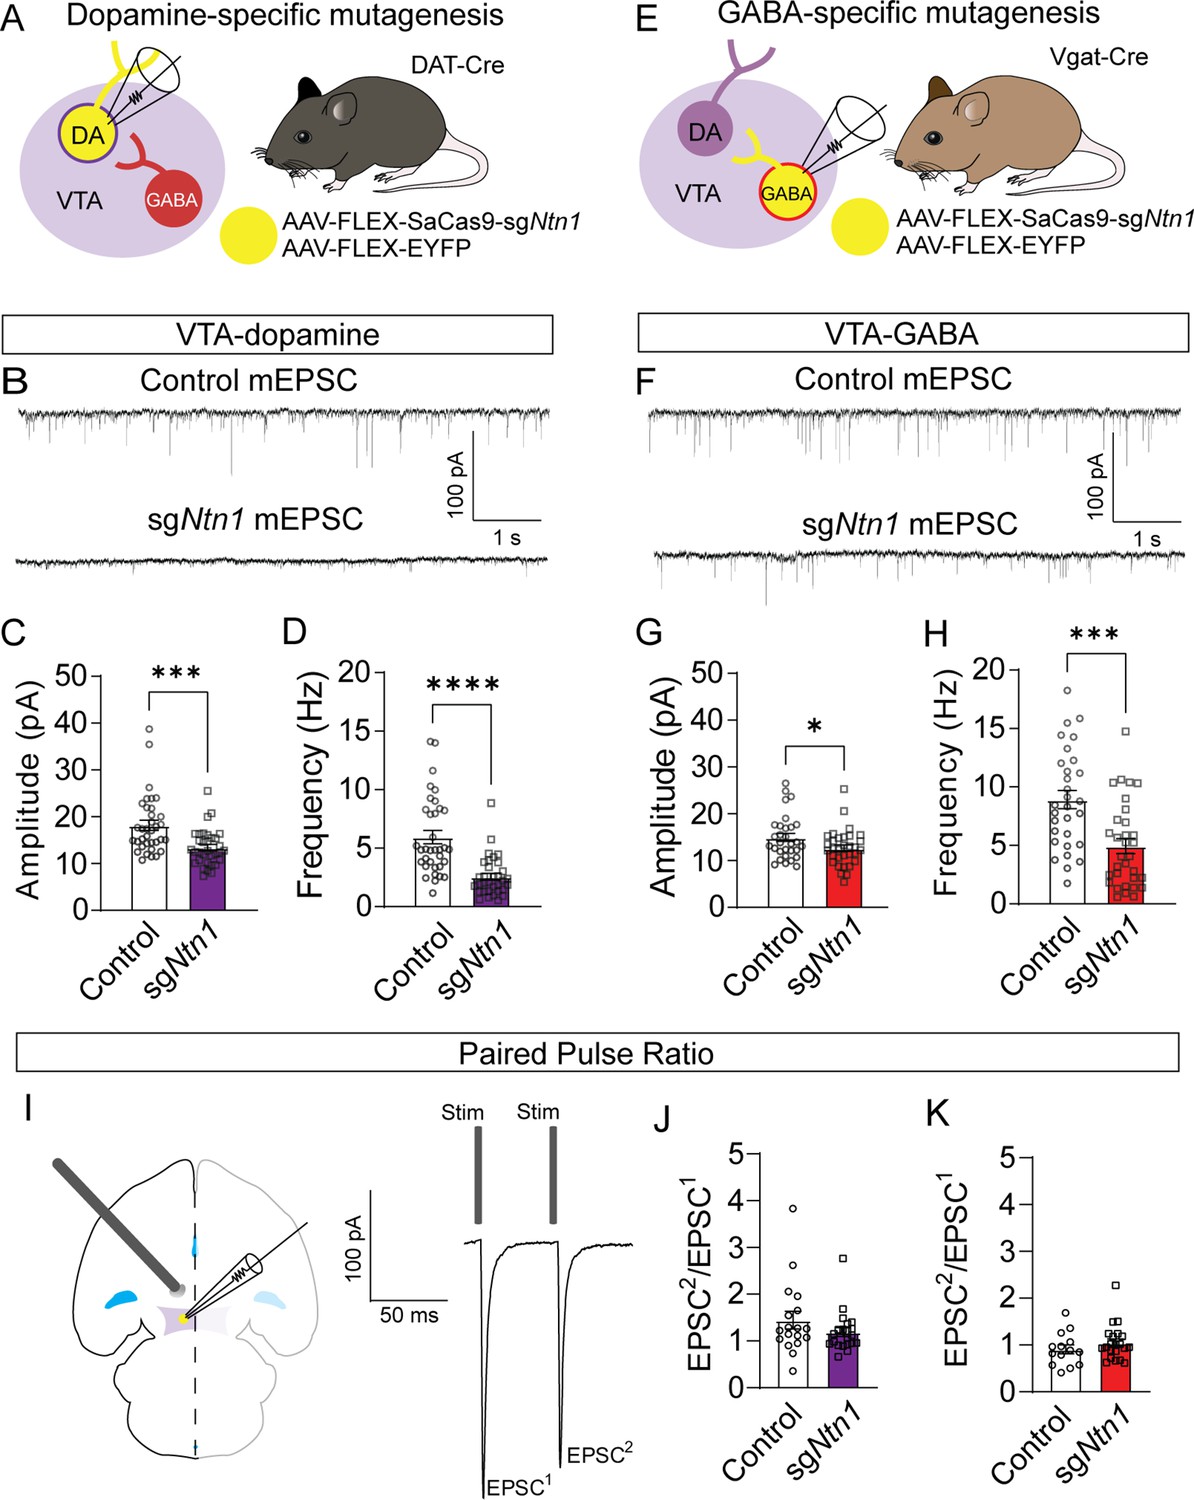
Loss of Ntn1 results in a significant reduction in excitatory postsynaptic current.
(A) Schematic of DAT-Cre dopamine specific Ntn1cKO. (B) Sample traces from control (top panel) and DAT Ntn1 cKO mice (bottom panel). (C–D) mEPSC amplitude (C) and frequency (D) measured from fluorescently identified dopamine neurons (n=35 controls, n=33 cKO, t=3.744, df = 66, ***p<0.001 and t=5.259, df = 66, ****p<0.0001). (E) Schematic of Vgat-Cre GABA specific Ntn1cKO. (F) Sample traces from control (top panel) and Vgat Ntn1 cKO mice (bottom panel). (G–H) mEPSC amplitude (G) and frequency (H) measured from fluorescently identified GABA neurons (n=30 controls, n=32 cKO, t=2.048, df = 60, *p<0.05, and t=3.966, df = 60, ***p<0.001). (I) Schematic of stimulating electrode placement in horizontal midbrain slice and example EPSCs. (J–K) Paired pulse ratio in dopamine (J, n=18 controls, n=21 cKO, t=1.271, df = 37, p>0.05), or GABA neurons (K, n=14 controls, n=21 cKO, t=1.105, df = 33, p>0.05).
-
Figure 3—source data 1
EPSCs and IPSCs from targeted cells.
- https://cdn.elifesciences.org/articles/83760/elife-83760-fig3-data1-v1.xlsx
-
Figure 3—source data 2
Additional EPSC and IPSC data from non-targeted cells.
- https://cdn.elifesciences.org/articles/83760/elife-83760-fig3-data2-v1.xlsx
Figure 3—figure supplement 1
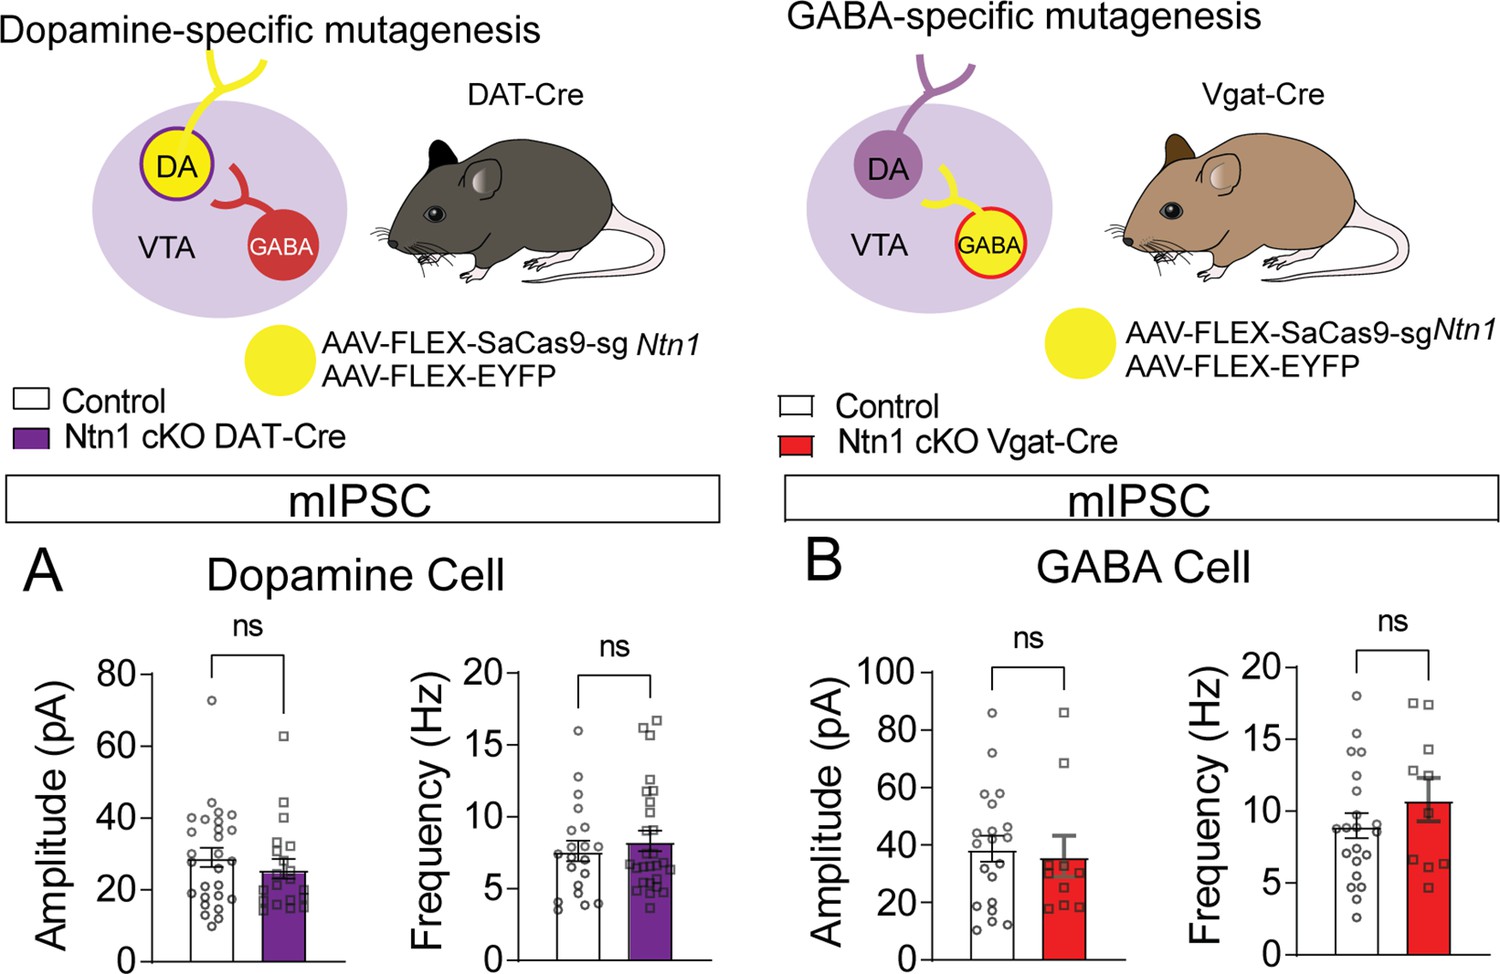
No significant differences in inhibitory synaptic connectivity associated with Ntn1 loss of function.
(A) mIPSC amplitude and frequency of DAT-Cre fluorescently identified dopamine neurons (n=20 controls, n=27 cKO, t=0.8283, df = 45 p>0.05 and t=0.6668, df = 45 p>0.05). (B) mIPSC amplitude and frequency of Vgat-Cre fluorescently identified GABA neurons (n=20 controls, n=10 cKO, t=0.3183, df = 28 and t=1.106, df = 29 p>0.05).
Figure 3—figure supplement 2
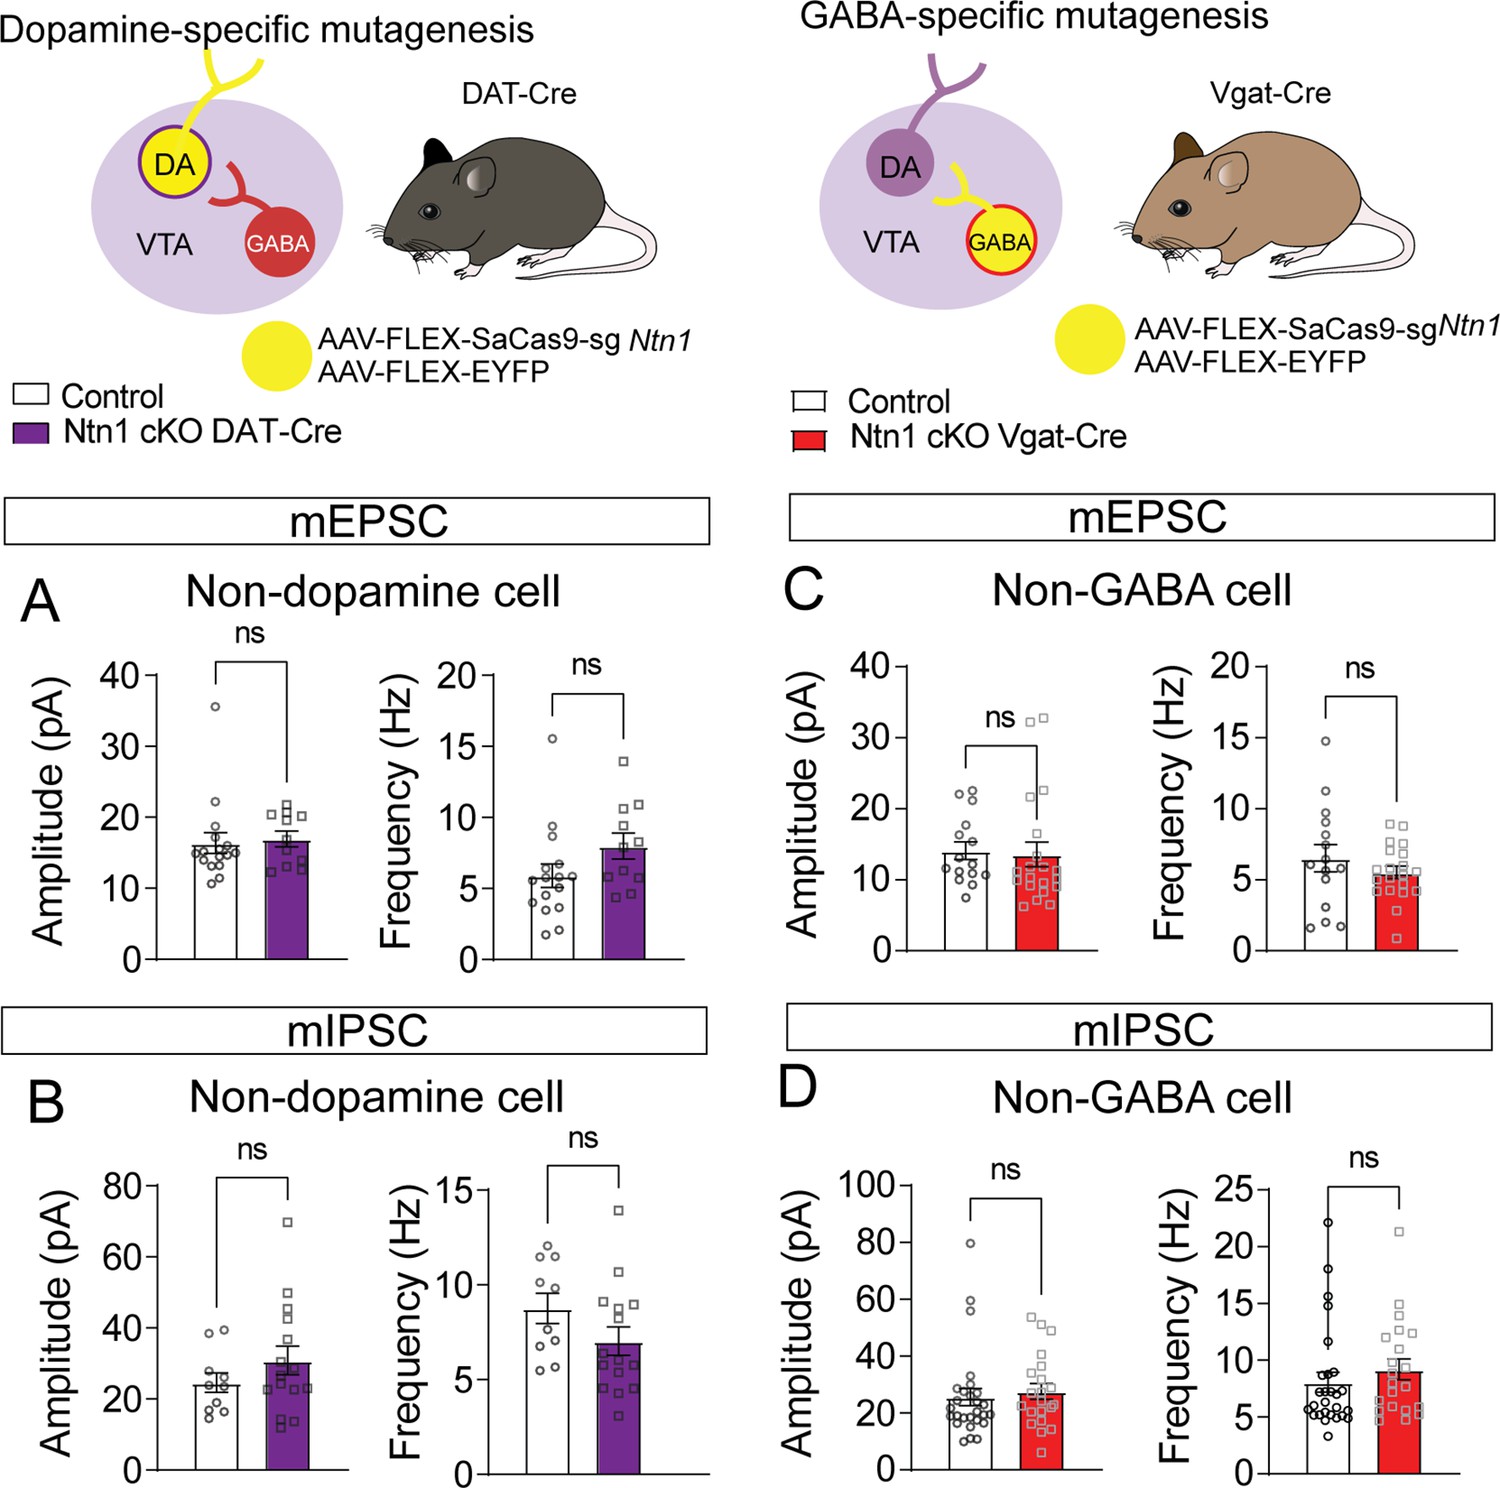
No significant differences in excitatory or inhibitory synaptic connectivity in non-targeted cell types.
(A) Miniature excitatory postsynaptic current (mEPSC) amplitude and frequency recorded from non-fluorescent cells in DAT-Cre mice (presumptively non-dopamine neurons) (n=16 controls, n=11 cKO, t=0.2985, df = 25, and t=1.678, df = 25 p>0.05). (B) Miniature inhibitory postsynaptic current (mIPSC) amplitude and frequency recorded from non-fluorescent cells in DAT-Cre mice (n=10 controls, n=15 cKO, t=1.134, df = 23 and t=1.546, df = 23 p>0.05). (C) mEPSC amplitude and frequency recorded from non-fluorescent cells in Vgat-Cre mice (presumptively non-GABA neurons) (n=18 controls, n=20 cKO, t=0.2333, df = 33 and t=1.028, df = 33 p>0.05). (D) mIPSC amplitude and frequency recorded non-fluorescent cells in Vgat-Cre mice (n=27 controls, n=21 cKO, t=0.4650, df = 46 and t=0.8771, df = 46 p>0.05).
Figure 3—figure supplement 3
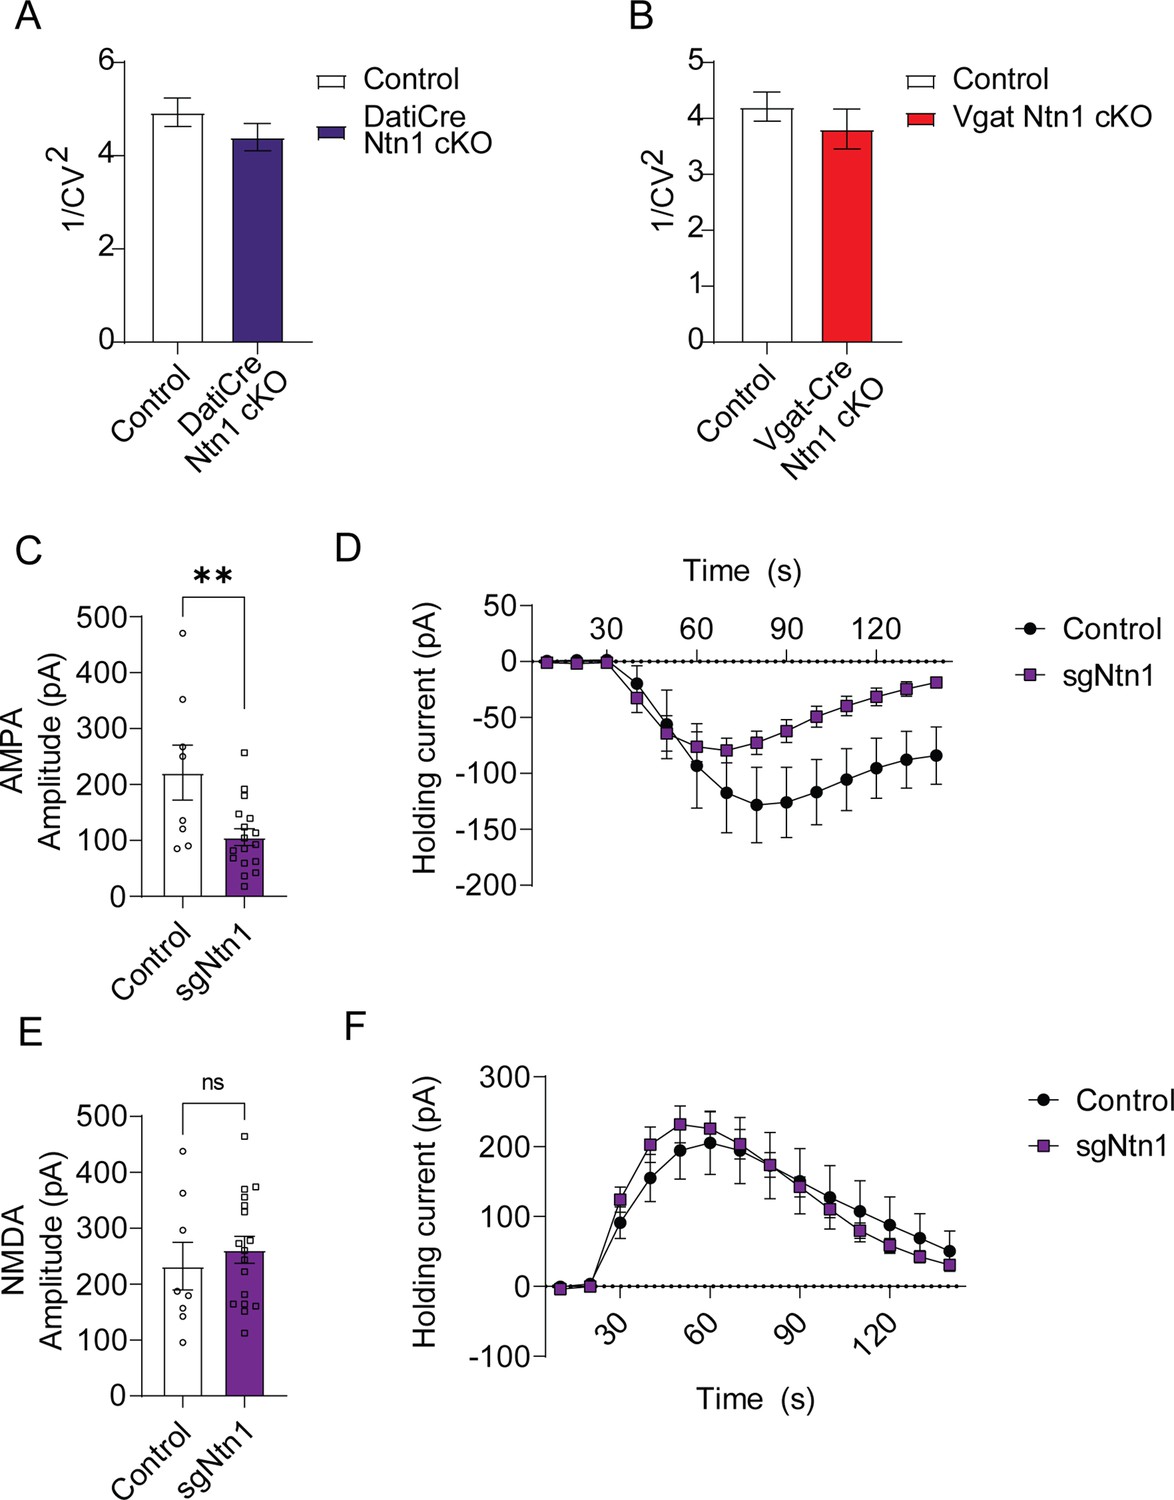
Loss of Netrin function results in significant decrease in AMPA response.
Analysis of 1/CV2 from miniature excitatory postsynaptic current (mEPSC) data in (A) DAT-Cre mice measured from fluorescently identified dopamine neurons (n=35 controls, n=33 cKO, t=1.252, df = 66. p>0.05) and (B) Vgat-Cre mice measured from fluorescently identified GABA neurons (n=30 controls, n=32 cKO, t=0.8932, df = 60, p>0.05). (C) Bath application of 1 uM AMPA peak amplitude holding current (n=8 controls, n=17 sgNtn1, t=2.906, df = 23, p=0.008) and (D) voltage-clamped (–60 mV) holding current following 30 s bath application of 1 uM AMPA in 10 s averaged increments. (E) 50 uM NMDA evoked peak holding current (t=0.6421, df = 23, p=0.5271) and (F) voltage-clamped (+40 mV) holding current following 30 s bath application of 50 uM NMDA in 10 s averaged increments.
Figure 4 with 1 supplement

Ntn1 cKO in DA neurons results in little behavioral alteration.
(A) Schematic summarizing cell type-specific knockout procedure. (B) Distance traveled in 15 min bins over the course of three nights and two days (n=21 control; n=15 cKO, Two-way ANOVA, Group F(1, 34)=1.169, p=0.2872, Time F(18.25, 620.6)=21.97 p<0.0001, Interaction F(251, 8534)=1.063 p=0.2380). (C) Earned reinforcers during three days of FR1 or FR5 operant conditioning (n=19 control; n=15, FR1; Group F(1, 96)=0.9761 p=0.3257, Time F(2, 96)=9.999 p=0.0001, Interaction F(2, 96)=0.006622 p=0.9934; FR5 Group F(1, 32)=0.6140, p=0.9808, Time F (2, 96)=2.786 p=0.0667, Interaction F(2, 96)=0.008669 p=0.9914). (D) Breakpoint (maximum presses per reinforcer) on a progressive ratio task (t=0.9434, df = 32, p=0.3525). (E) Lever presses per session during five days of extinction training (Group F(1, 32)=1.336, p=0.2562, Time F(4, 128)=87.55 p<0.0001, Interaction F(4, 128)=2.017 p=0.0959). (F) Acoustic startle response to varying intensity white noise stimuli (Group F(1, 31)=3.176 p=0.0845, Intensity F(1.737, 53.83)=37.74 p<0.0001, Interaction F(6, 186)=2.124 p=0.0525) (G) Percent inhibition of startle response following pre-pulse at indicated intensities (Group F(1, 96)=0.05032 p=0.8230, Intensity F(2, 96)=5.638 p=0.0048, Interaction F(2, 96)=0.2402 p=0.7870). (H) Time on edge or in center of an open field arena during a 10 min test session (Edge: t=2.897, df = 32, **p<0.01, Center: t=2.750, df = 32, **p<0.01).
-
Figure 4—source data 1
Behavioral data for Figure 4.
- https://cdn.elifesciences.org/articles/83760/elife-83760-fig4-data1-v1.xlsx
Figure 4—figure supplement 1
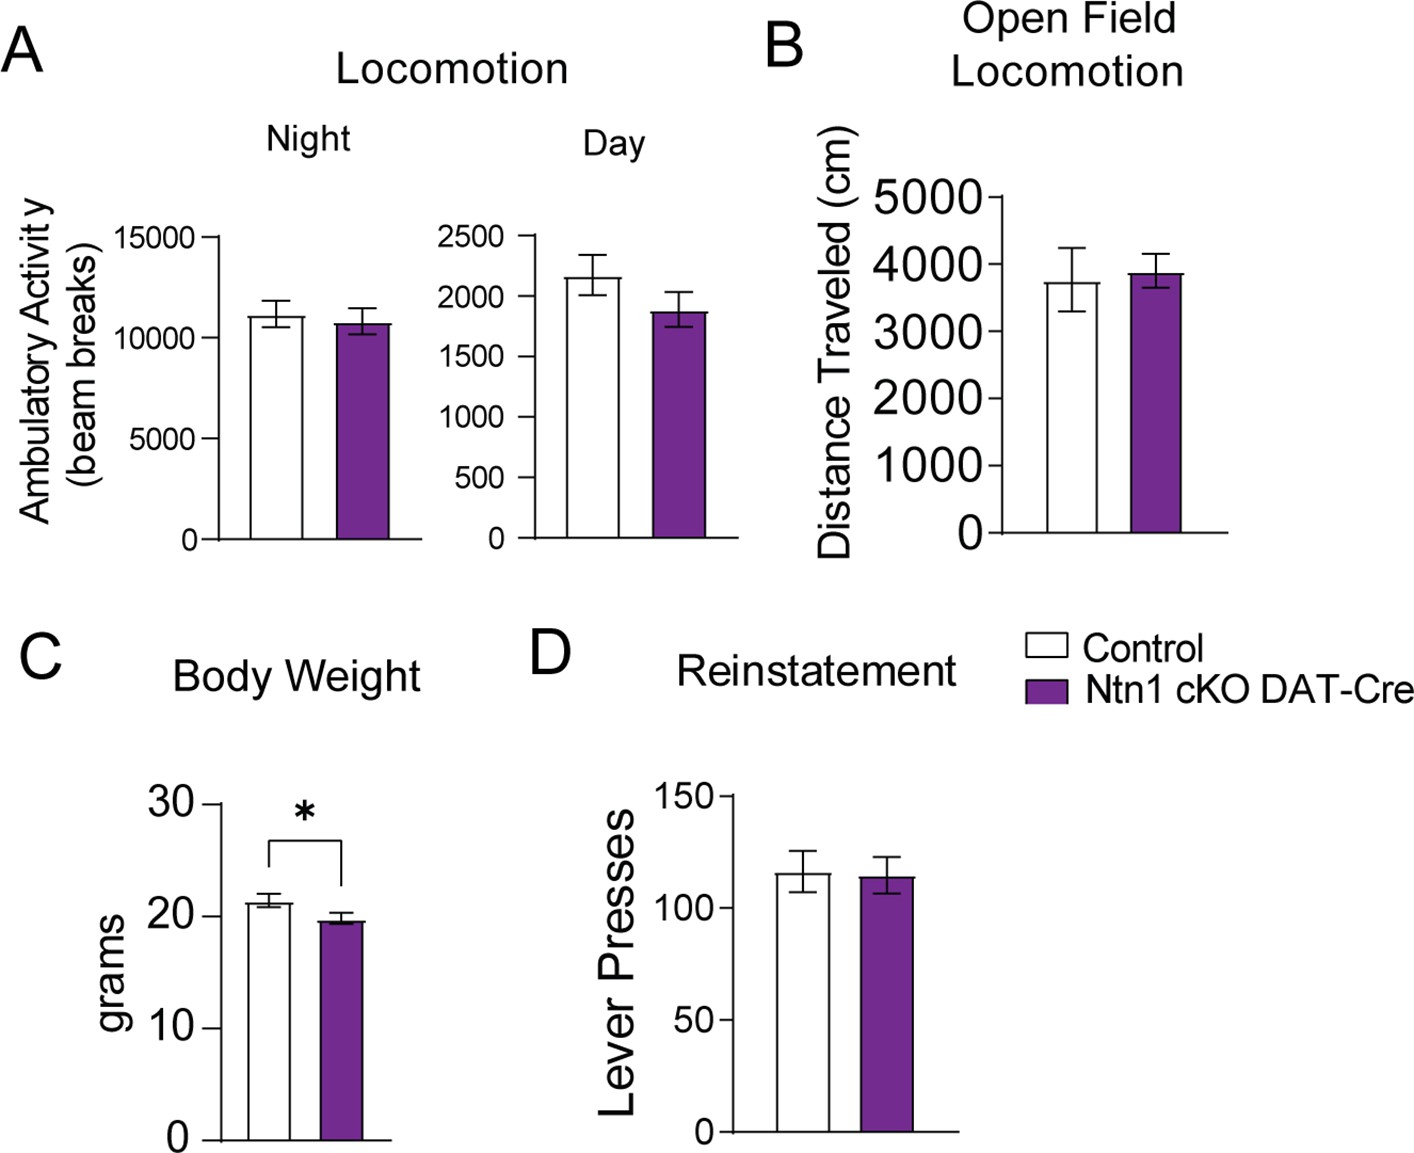
Additional behavioral analysis of Ntn1 cKO DAT-Cre mice.
(A) Average ambulatory activity (beam breaks) averaged across three nights and two days (n=21 control; n=18 cKO, Night: t=0.3938, df = 37, p=0.6960, Day: t=1.271, df = 37, p=0.2117). (B) Distance traveled during the open field task (t=0.2275, df = 32, p>0.05). (C) Initial mouse weight prior to instrumental conditioning (n=22 control, n=22 cKO, t=2.053, df = 42, *p<0.05) (D) FR1 reinstatement (t=0.1192, df = 32 p=0.9058).
-
Figure 4—figure supplement 1—source data 1
Behavioral data for Figure 4—figure supplement 1.
- https://cdn.elifesciences.org/articles/83760/elife-83760-fig4-figsupp1-data1-v1.xlsx
Figure 5 with 1 supplement

Ntn1 cKO in GABA ventral tegmental area (VTA) neurons resulted in significant behavioral alterations.
(A) Schematic summarizing cell type-specific knockout procedure. (B) Distance traveled in 15 min bins over the course of three nights and two days (n=26 controls, n=23 cKO, Two-way ANOVA Group F(1, 11797)=527.4, ****p<0.0001, Time F(250, 11797)=14.61 p<0.0001. Interaction F(250, 11797)=1.342, p=0.0003). (C) Earned reinforcers during three days of FR1 or FR5 operant conditioning (n=18 control; n=15 cKO; FR1: Group F(1, 31)=0.08647 p=0.7707, Time F(2, 62)=30.46 p<0.0001, Interaction F(2, 62)=3.186 p=0.0482; FR5: Group F(1, 31)=4.261, *p<0.05, Time F (1.992, 61.74)=0.3131 p=0.7314, Interaction F(2, 62)=1.448 p=0.2428). (D) Breakpoint (maximum presses per reinforcer) on a progressive ratio task (t=2.577, df = 31, *p<0.05). (E) Lever presses per session during five days of extinction training (Group F(1, 31)=10.23, **p<0.01, Time F(1.491, 46.23)=83.84 p<0.0001, Interaction F(4, 124)=3.546 p=0.0089). (F) Acoustic startle response to varying intensity white noise stimuli (Group F(1, 31)=7.891, **p<0.0085, Intensity F(1.790, 55.49)=24.94 p<0.0001, Interaction F(6, 186)=2.186, p=0.0462). (G) Percent inhibition of startle response following pre-pulse at indicated intensities (Group F(1, 93)=9.181, **p<0.01, Intensity F(2, 93)=5.101 p=0.0079, Interaction F(2, 93)=0.002227 p=0.9978). (H) Time on edge or in center of open field arena during a 10 min test session (edge: t=2.248, df = 31, *p<0.05, center t=1.366, df = 33, p>0.05).
-
Figure 5—source data 1
Behavioral data for Figure 5.
- https://cdn.elifesciences.org/articles/83760/elife-83760-fig5-data1-v1.xlsx
Figure 5—figure supplement 1
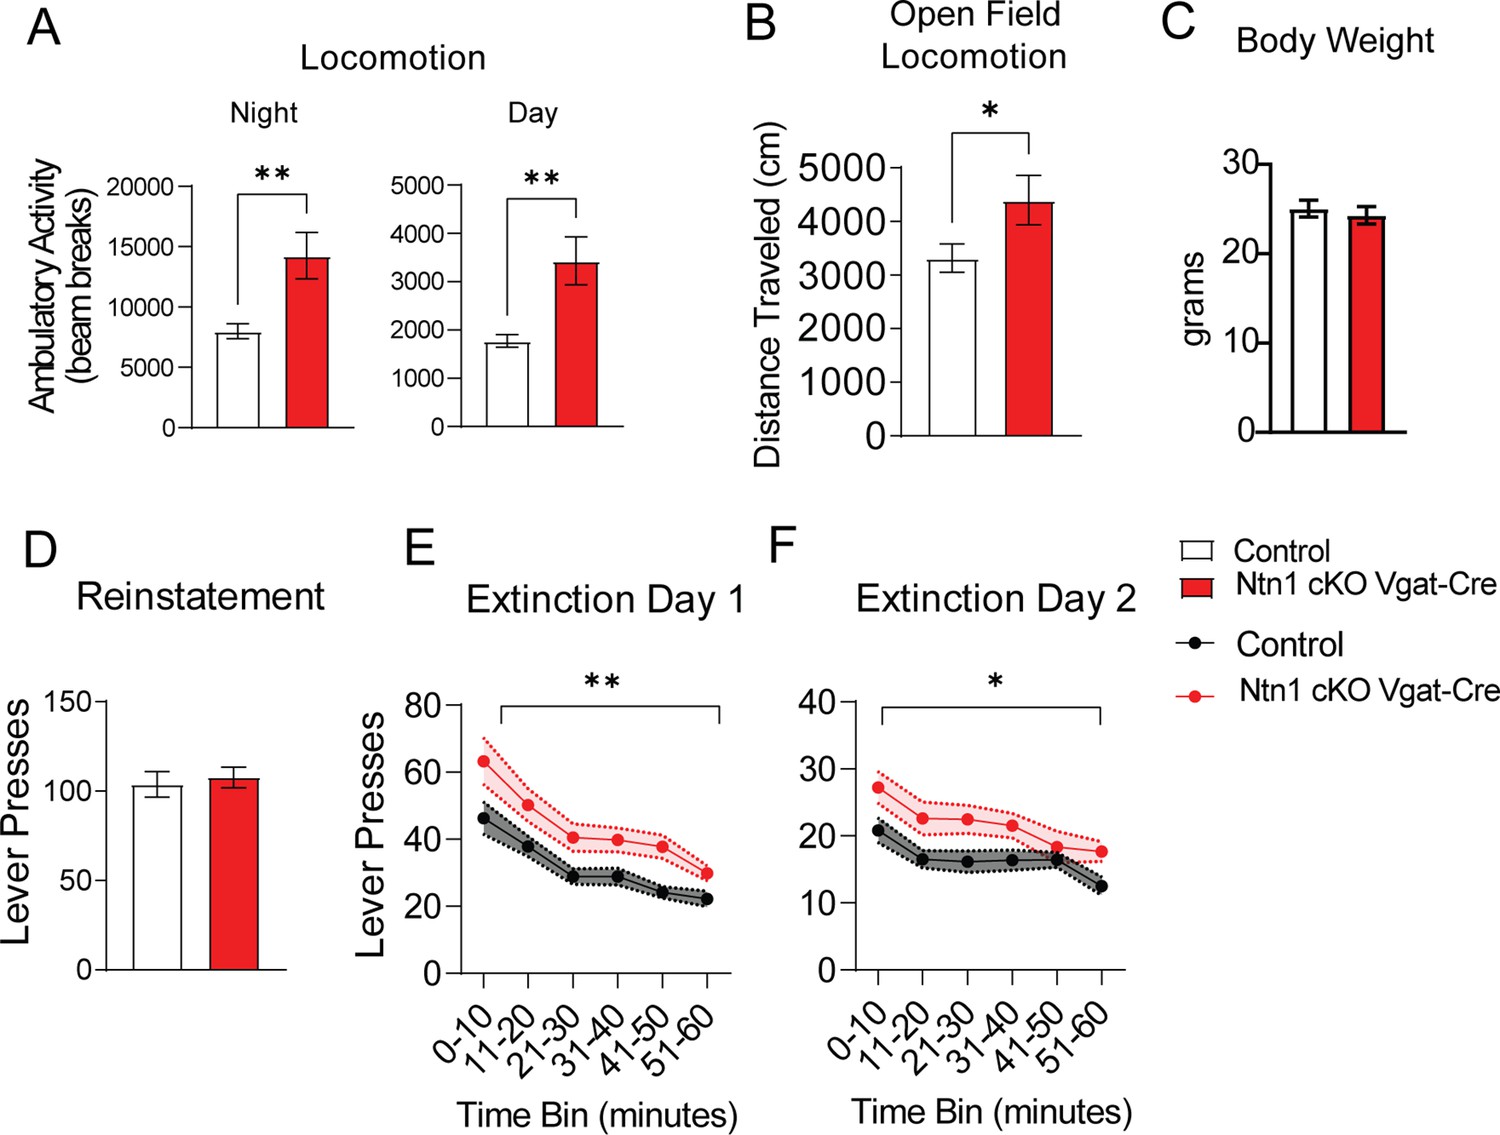
Additional behavioral analysis of Ntn1 cKO Vgat-Cre mice.
(A) Average ambulatory activity (beam breaks) averaged across three nights and two days (n=26 control; n=26 cKO, t=3.109, df = 50 **p=0.01 and t=3.227, df = 50 **p=0.01). (B) Distance traveled during open field test (t=2.064, df = 33, p<0.05*) (C) Initial mouse weight prior to instrumental conditioning (n=24 control, n=17 cKO, t=0.5342, df = 39 p>0,05). (D) FR1 reinstatement (t=0.4193, df = 31, p=0.6779). (E) Extinction Day 1 lever presses per 10 min time bins (Two-way ANOVA Group F(1, 31)=8.715 **p<0.01, Time F (1.961, 60.79)=35.65 p<0.0001, Interaction F(5, 155)=0.7968 p=0.5535). (F) Extinction Day 2 lever presses per 10 min time bins (Group F(1, 31)=6.932, *p<0.05, Time F(3.894, 120.7)=11.61 p<0.0001, Interaction F(5, 155)=0.9574 p=0.4459).
-
Figure 5—figure supplement 1—source data 1
Behavioral data for Figure 5—figure supplement 1.
- https://cdn.elifesciences.org/articles/83760/elife-83760-fig5-figsupp1-data1-v1.xlsx
Figure 6 with 1 supplement
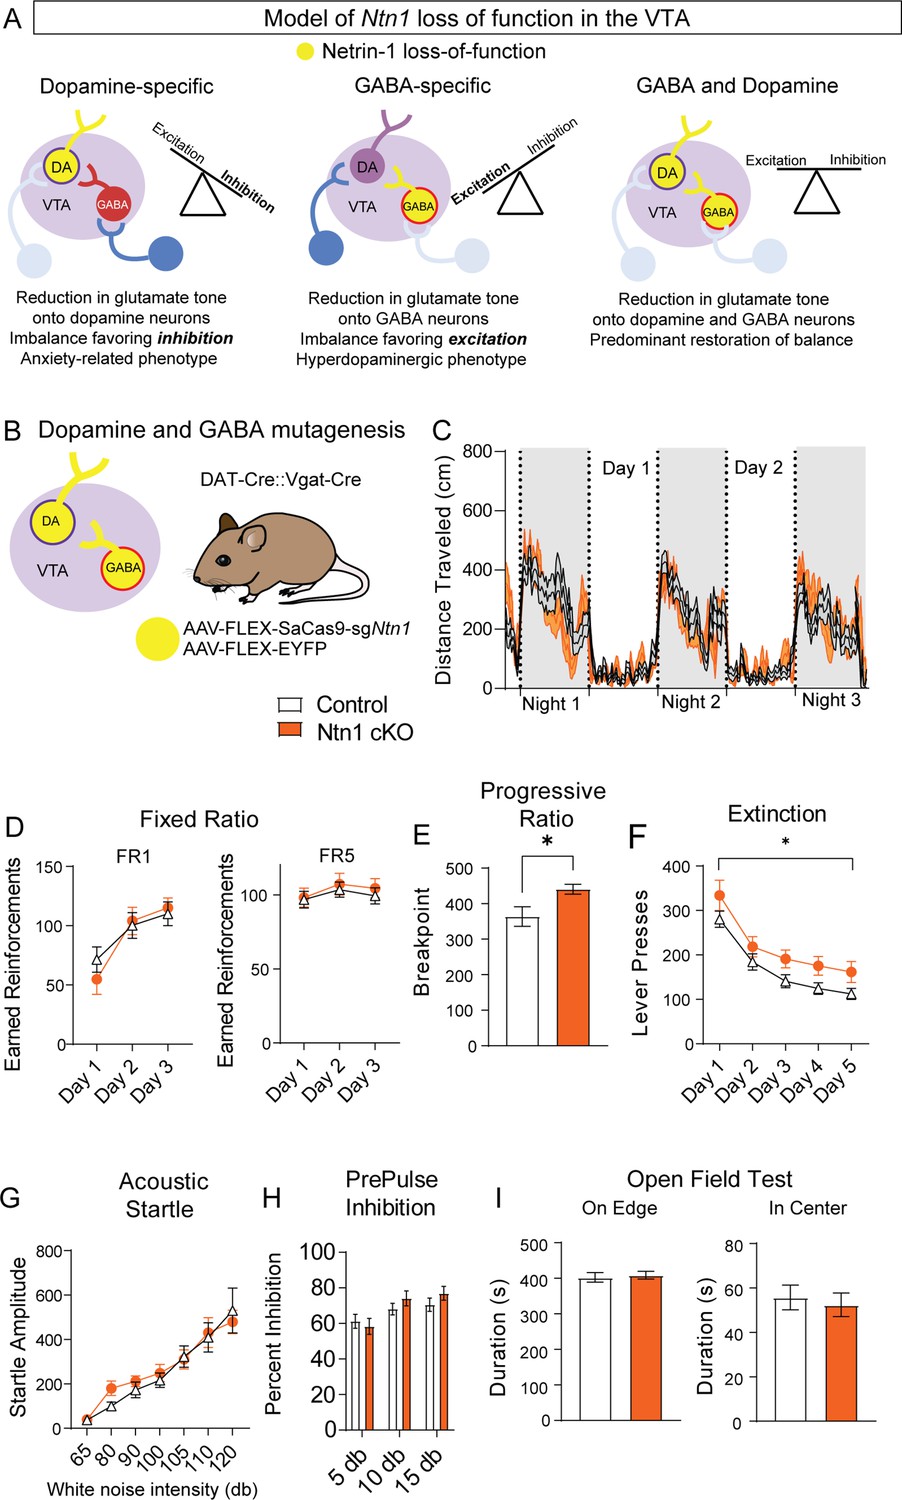
Ntn1 cKO in DATIRES::Vgat-Cre mice partially rescues behavioral phenotype.
(A) Model of Ntn1 loss of function in the ventral tegmental area (VTA) on excitatory and inhibitory balance. (B) Schematic of GABA and Dopamine Ntn1 cKO. (C) Distance traveled in 15 min bins over the course of three nights and two days (Two-Way ANOVA Group F(1, 45)=0.004273, p>0.05, Time F(17.16, 772.1)=23.36, p<0.0001, Interaction F (247, 11115)=1.492, p<0.0001). (D) Earned reinforcers during three days of FR1 or FR5 operant conditioning (n=21 controls, n=20 Ntn1 cKO, FR1: Group F(1, 40)=0.04247 p=0.8378, Time F(2, 80)=25.70 p<0.0001, Interaction F(2, 80)=1.402 p=0.2522; FR5: Group F(1, 40)=0.2244 p=0.6383, Time F(1.499, 59.95)=2.226 Pp0.1295, Interaction F(2, 80)=0.1385 p=0.8708) (E) Breakpoint (maximum presses per reinforcer) on a progressive ratio task (t=2.502, df = 39, *p<0.05) (F) Lever presses per session during five days of extinction training (Group F(1, 39)=6.990, *p=0.0117, Time F(2.381, 92.87)=42.95 p<0.0001, Interaction F(4, 156)=0.1470 p=0.9641). (G) Acoustic startle response to varying intensity white noise stimuli (Group F(1, 40)=0.1207 p=0.7301, Intensity F(1.775, 70.99)=36.77 p<0.0001, Interaction F(6, 240)=0.6127 p=0.7201). (G) Percent inhibition of startle response following pre-pulse at indicated intensities (Group F(1, 120)=0.9661 p=0.3276, Intensity F(2, 120)=7.067 p=0.0013, Interaction F(2, 120)=0.8861 p=0.4150). (H) Time on edge or in center of open field arena during a 10 min test session (edge: t=0.3584, df = 45 p>0,05, center: t=0.4233, df = 45, p>0.05).
-
Figure 6—source data 1
Behavioral data for Figure 6.
- https://cdn.elifesciences.org/articles/83760/elife-83760-fig6-data1-v1.xlsx
Figure 6—figure supplement 1
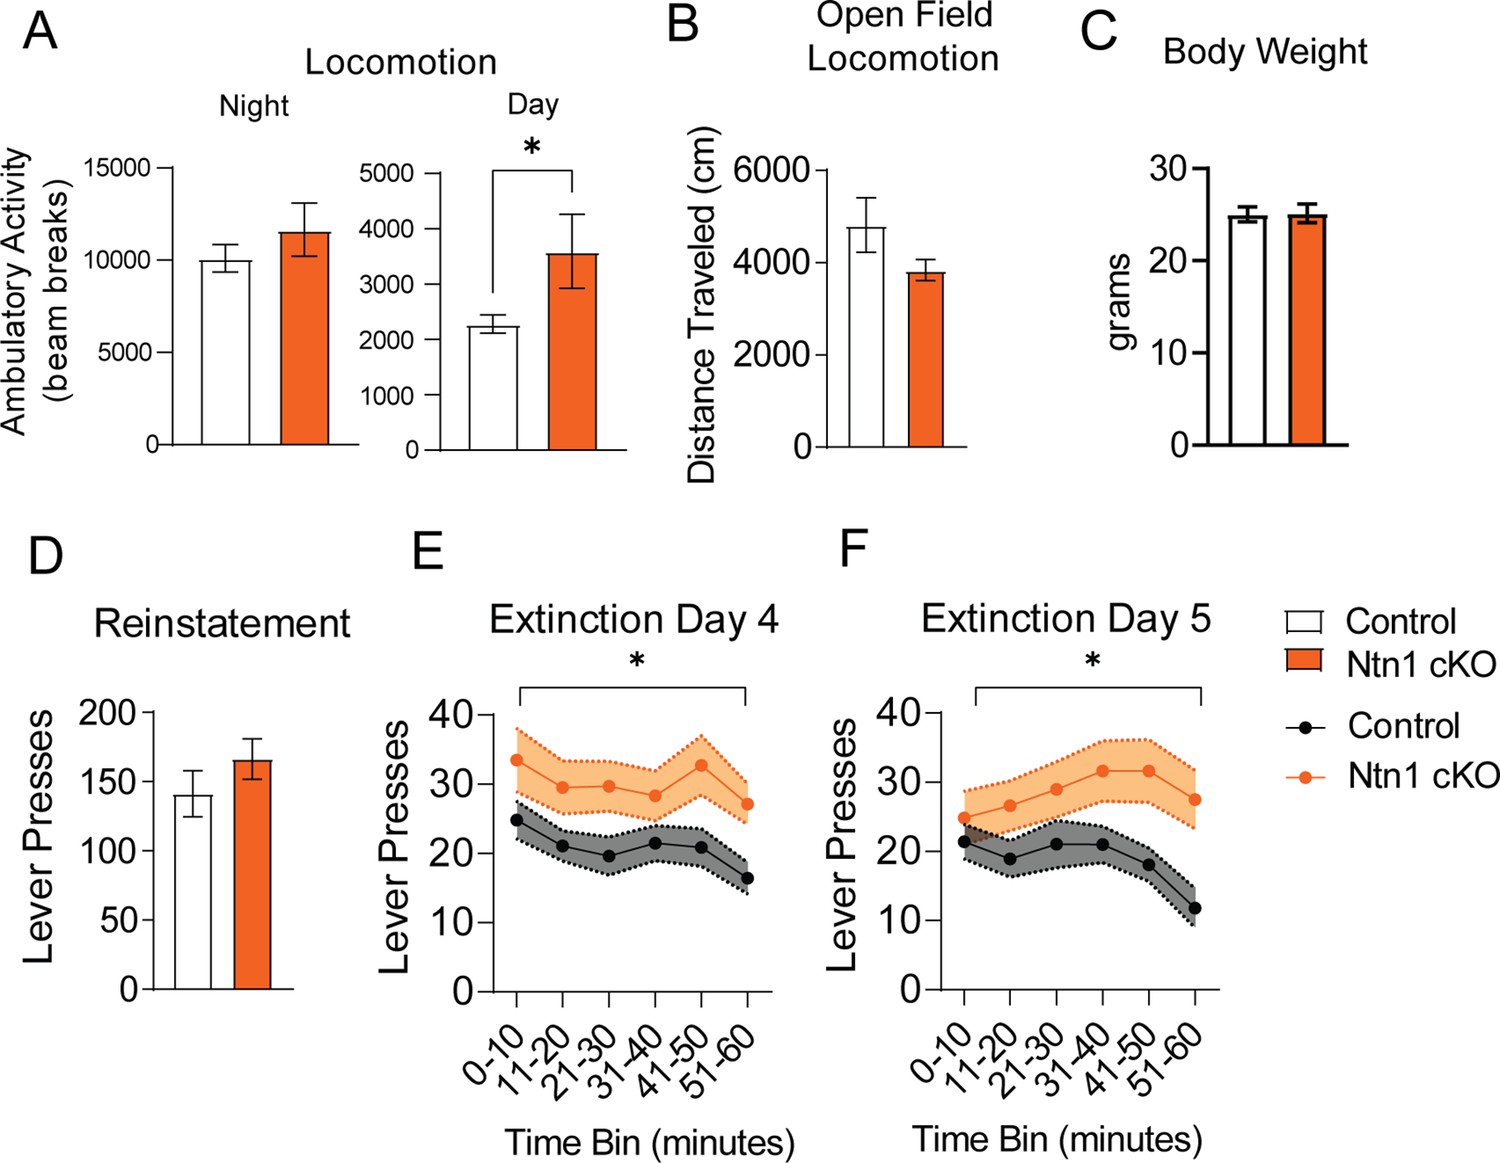
Average day and night locomotion in DAT-Cre::Vgat-Cre mice.
(A) Ambulatory activity (beam breaks) averaged across three nights and two days (n=26 controls n=21 cKO, Night: t=1.010, df = 45, p=0.3178 and Day: t=2.091, df = 45 *p<0.05). (B) Distance traveled during open field test (t=1.414, df = 45, p>0.05). (C) Initial mouse weight prior to instrumental conditioning (n=10 control, n=13 cKO, t=0.08465, df = 21 p>0.05). (D) FR1 reinstatement (t=1.127, df = 39 p>0.05) (E) Extinction Day 4 lever presses per 10 min time bins (Two-way ANOVA Group F (1, 39)=5.428 *p<0.0.5, Time F (3.691, 144.0)=4.539 p=0.0023, Interaction F (5, 195)=0.6146 9=0.6888) (F) Extinction Day 5 lever presses per 10 min time bins (Group F (1, 39)=5.232 *p<0.05, Time F F (3.524, 137.4)=3.115 p=0.0218, Interaction F (5, 195)=2.802 p=0.0181).
-
Figure 6—figure supplement 1—source data 1
Behavioral data for Figure 6—figure supplement 1.
- https://cdn.elifesciences.org/articles/83760/elife-83760-fig6-figsupp1-data1-v1.xlsx
Additional files
Download links
A two-part list of links to download the article, or parts of the article, in various formats.
Downloads (link to download the article as PDF)
Open citations (links to open the citations from this article in various online reference manager services)
Cite this article (links to download the citations from this article in formats compatible with various reference manager tools)
Netrin-1 regulates the balance of synaptic glutamate signaling in the adult ventral tegmental area
eLife 12:e83760.
https://doi.org/10.7554/eLife.83760


