Activity disruption causes degeneration of entorhinal neurons in a mouse model of Alzheimer’s circuit dysfunction
- Department of Neuroscience, Huffington Center on Aging, Baylor College of Medicine, United States
- Departments of Neurology, Neurosurgery, and Molecular and Cellular Biology, Huffington Center on Aging, Baylor College of Medicine, United States
Figures
Figure 1 with 2 supplements
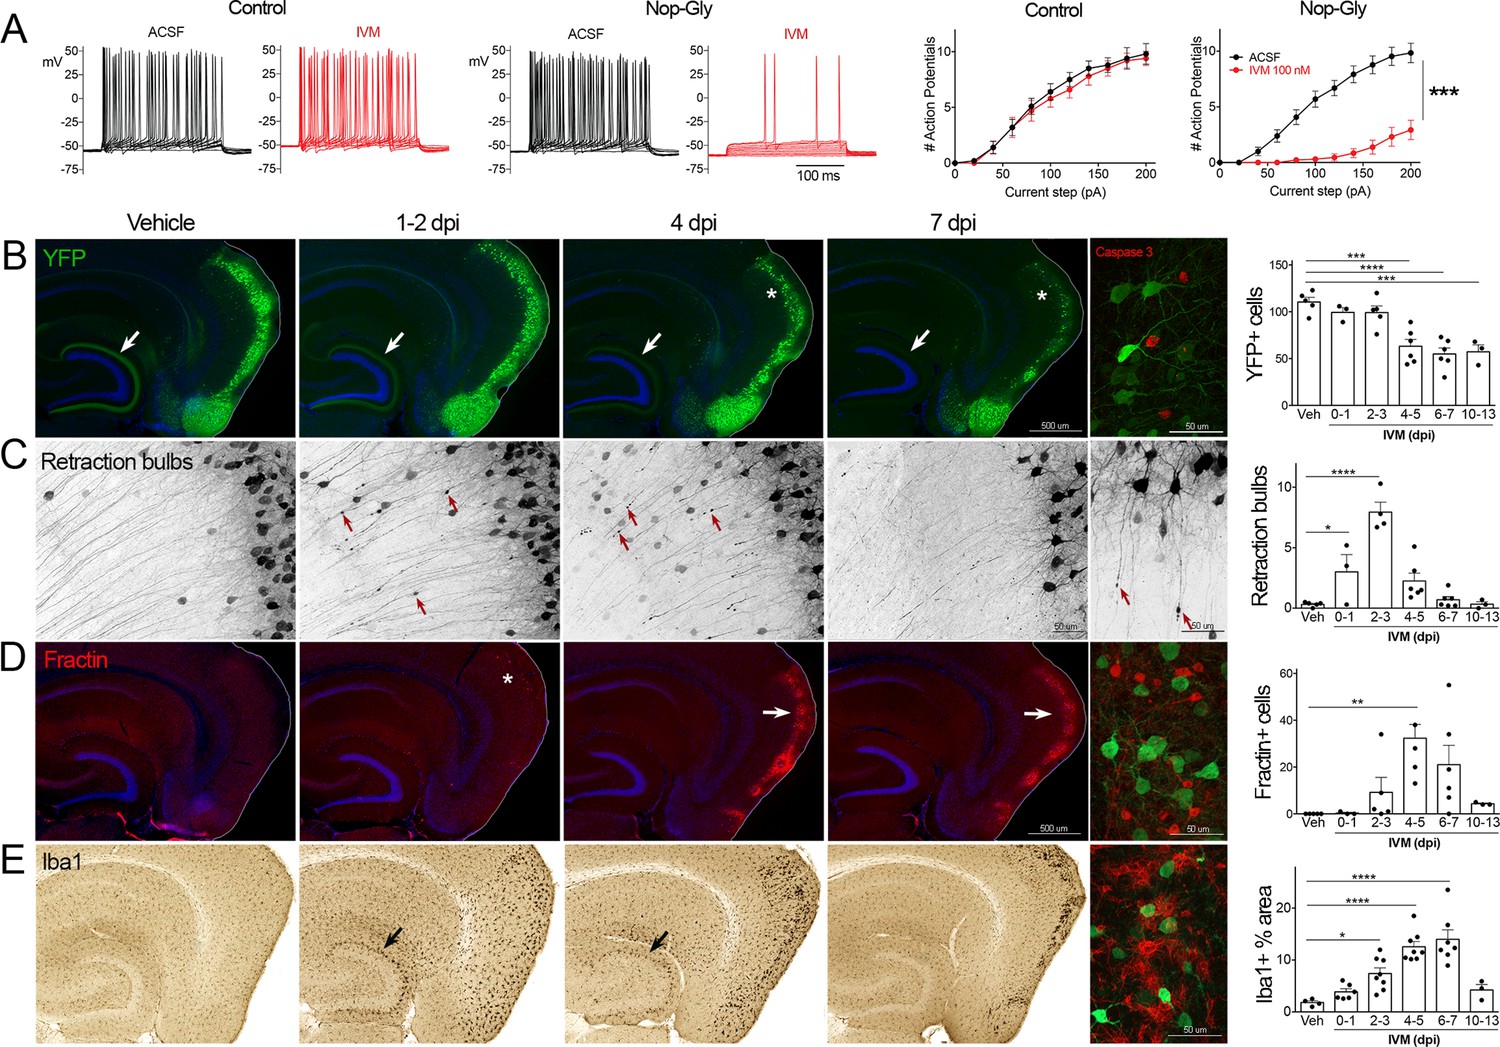
Transient electrical silencing with GlyCl causes cell death in entorhinal cortex (EC) neurons.
(A) Example traces from current-clamp recordings in brain slices from control and GlyCl-expressing mice, with and without 100 nM ivermectin (IVM). Graphs on right show the average number of action potentials elicited at each current step. Data expressed as mean ± SEM, two-way repeated-measures ANOVA (p-value for interaction of treatment × current). n = 10 cells from 10 slices (five mice, control WT or single transgenic); 13 cells from 13 slices (six mice, Nop-tTA; TRE-GlyCl-YFP bigenic). (B) YFP immunostaining reveals that silencing EC neurons lead to progressive loss of dentate innervation (white arrow) followed by loss of YFP-labeled neuronal cell bodies in the EC (asterisk). Final image shows the presence of active caspase-3 immunostaining (red) among YFP+ cell bodies (green) at 3 days after IVM injection (dpi). (C) High-magnification images in EC show retraction bulbs on YFP-labeled axons withdrawing from the dentate gyrus (DG) (red arrows). Final image shows single YFP-labeled axons terminating in retraction bulbs at 2 dpi. (D) Fractin immunostaining marks the emergence of damaged/dying neurons in EC. Final image shows fractin+ cells (red) among YFP+ cells at 7 dpi. (E) Iba1 immunostaining reveals early microglial activation upon denervation of the DG (black arrow) followed by pronounced reactivity in the superficial EC. Final image shows Iba1 (red) and YFP (green). Graphs show average values per section for each animal ± SEM. n = 4–5 (veh), 3–6 (0–1 dpi), 4–8 (2–3 dpi), 4–8 (4–5 dpi), 6–7 (6–7 dpi), and 3 (10–13 dpi). One-way ANOVA with Dunnett’s post hoc test, *p<0.05, **p<0.01, ***p<0.001, ****p<0.0001. Unnecessary cerebellar tissue, where present, was masked in Photoshop to match fields of view across panels. Associated with Figure 1—figure supplements 1 and 2.
-
Figure 1—source data 1
Numerical data for Figure 1.
- https://cdn.elifesciences.org/articles/83813/elife-83813-fig1-data1-v2.xlsx
Figure 1—figure supplement 1
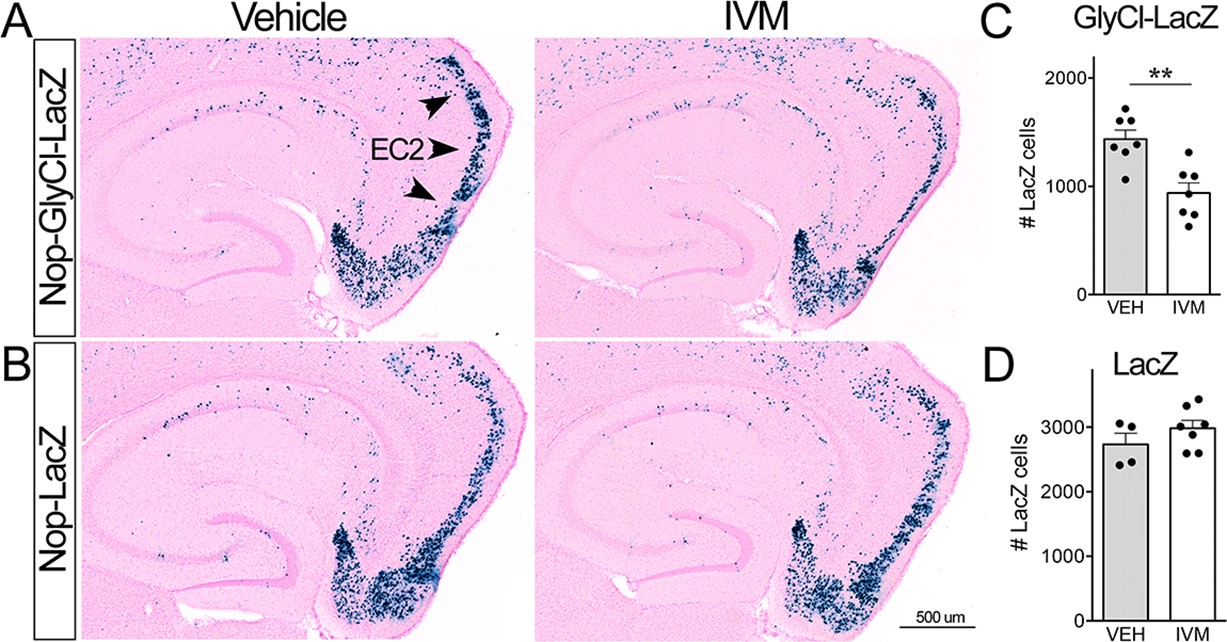
Ivermectin (IVM) does not trigger neuronal loss in the absence of GlyCl.
(A, B) Nuclear-localized lacZ was co-expressed under the Nop promoter to identify EC2 neurons independent of GlyCl co-expression. Animals expressing lacZ without GlyCl were used to test for cell death caused by IVM itself. (C, D) The number of lacZ+ EC2 cells is diminished by IVM in mice that express GlyCl (C) but not in mice that lack the channel (D). Cell counts were done 30 dpi. Graph data expressed as summed cell counts for each animal ± SEM, Student’s t-test (two-sided). GlyCl + LacZ n = 7 veh, 7 IVM; LacZ n = 4 veh, 7 IVM. **p<0.01. Unnecessary cerebellar tissue, where present, was masked in Photoshop to match fields of view across panels.
-
Figure 1—figure supplement 1—source data 1
Numerical data for Figure 1—figure supplement 1.
- https://cdn.elifesciences.org/articles/83813/elife-83813-fig1-figsupp1-data1-v2.xlsx
Figure 1—figure supplement 2
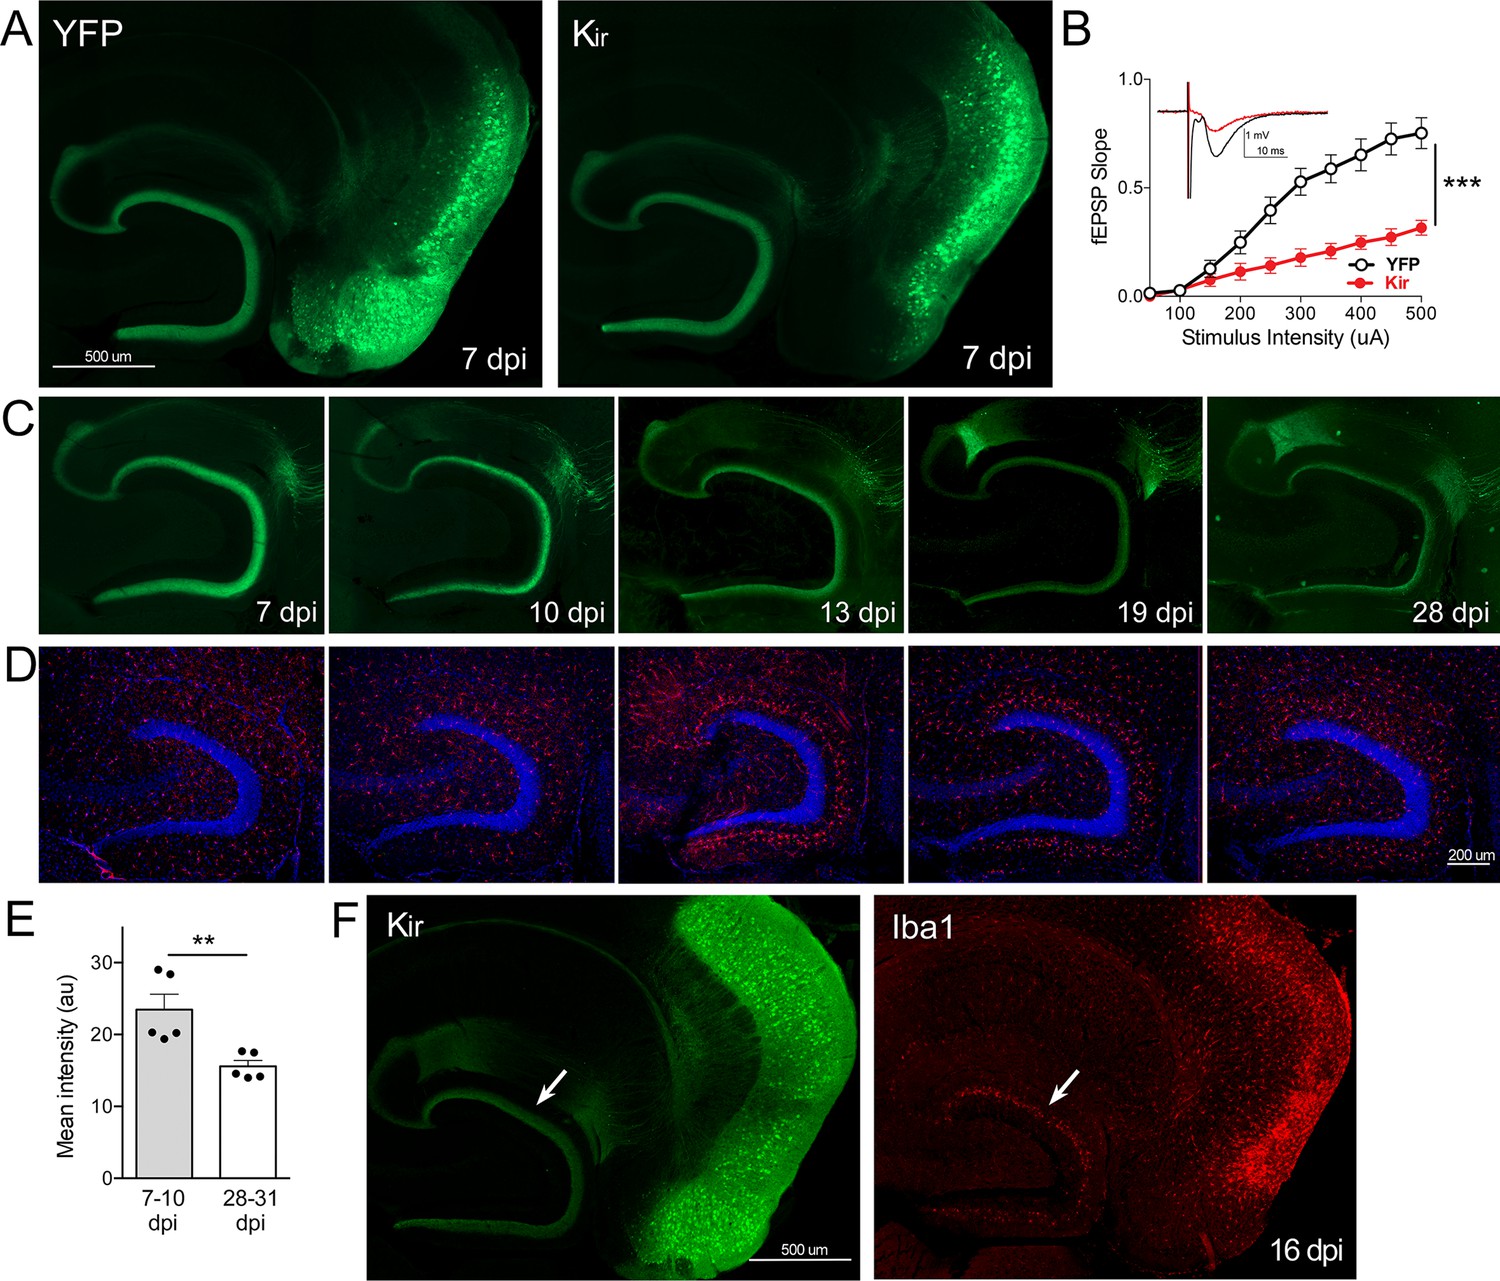
Gradual loss of dentate gyrus (DG) labeling upon entorhinal cortex (EC) neuronal silencing with Kir.
(A) AAV was used to express either YFP or YFP plus Kir in entorhinal neurons via stereotaxic intracranial injection of adult Nop-tTA mice. By 7 dpi, labeled EC2 axons terminating in the DG can be clearly seen by either immuno- (shown) or native fluorescence in both YFP and Kir-YFP animals. (B) Virally delivered Kir effectively diminishes synaptic transmission into the DG. Data expressed as mean ± SEM, two-way repeated-measures ANOVA (p-value for interaction of condition × stimulus intensity, ***p<0.001). n = 15 slices from three mice (YFP), 10 slices from three mice (Kir), harvested 7–9 dpi. Note that YFP data shown here is identical to Figure 3B as the same control group was used for both experiments. (C) Over the course of several weeks following injection, virally delivered Kir leads to diminished labeling of perforant path axons. This phenotype is consistent with axonal loss but lacked the axonal retraction bulbs of GlyCl. Images show native fluorescence. (D) Iba1 immunostaining reveals hypertrophic microglia in the DG concurrent with loss of EC innervation. (E) The intensity of YFP immunostaining in the DG decreased between the first and fourth weeks after viral injection of Kir. Graph data expressed as average values for each animal ± SEM, Student’s t-test (two-sided). **p<0.01. (F) Example of the microglial response to Kir expression at 16 dpi. YFP (left) and Iba1 (right) were co-immunostained to reveal hypertrophic microglia neighboring the silenced EC2 soma and their projections in DG (arrow). 7 dpi n = 4 YFP, 4 Kir; 10 dpi n = 3 YFP, 1 Kir; 12–13 dpi n = 5 YFP, 3 Kir; 16–19 dpi n = 10 YFP, 5 Kir; 22–28 dpi n = 2 YFP, 5 Kir. Unnecessary cerebellar tissue, where present, was masked in Photoshop to match fields of view across panels.
-
Figure 1—figure supplement 2—source data 1
Numerical data for Figure 1—figure supplement 2.
- https://cdn.elifesciences.org/articles/83813/elife-83813-fig1-figsupp2-data1-v2.xlsx
Figure 2 with 1 supplement
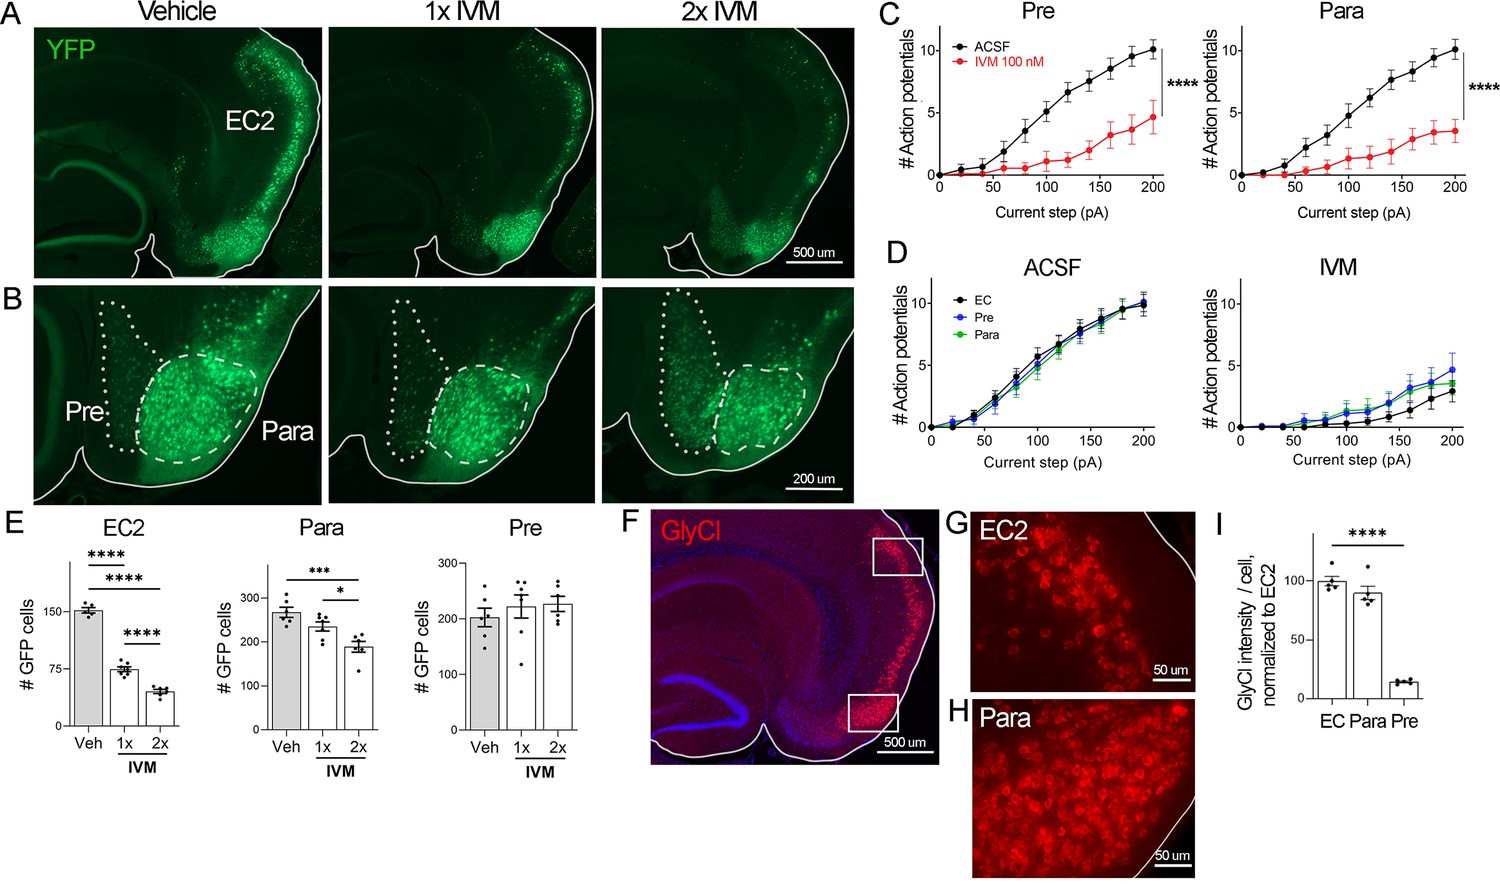
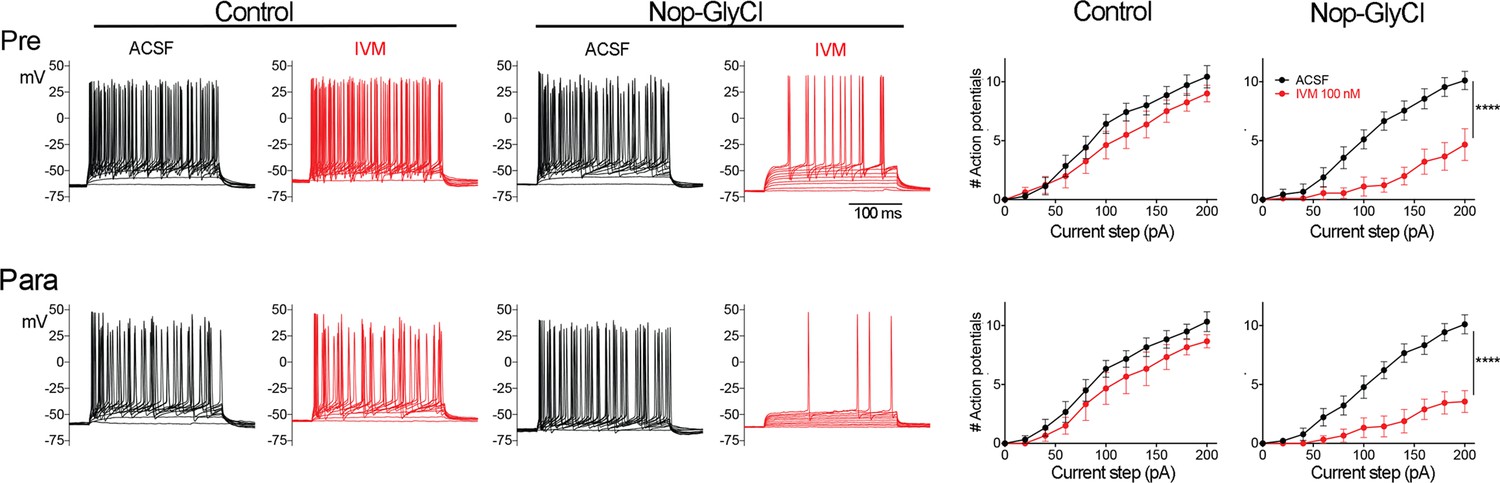
EC2 is more vulnerable to electrical inactivation than neighboring regions.
(A, B) The Nop-tTA line drives expression of transgenic GlyCl in neural populations beyond the entorhinal cortex (EC), including the pre- and parasubiculum. Bigenic Nop-GlyCl mice were injected with vehicle or ivermectin (IVM) at 5 mg/kg (1×) or 10 mg/kg (2×) to assess the relationship between dose and neuronal loss in these brain regions. (C) Whole-cell recordings of pre- and parasubiculum show that action potentials initiation in both cell types is effectively suppressed upon 100 nM IVM exposure, similar to EC2. Data expressed as mean ± SEM, two-way repeated-measures ANOVA (p-value for interaction of treatment × current). Pre n = 9 cells from nine slices (four mice); para n = 9 cells from nine slices (four mice). (D) Graphs showing action potential number as a function of current step in EC, parasubiculum, and presubiculum were overlaid to show that neurons in all three brain regions were similarly silenced at 100 nM IVM (mean ± SEM, two-way repeated-measures ANOVA with Sidak’s post-test). The data shown here for comparison of the three regions also appears separately in Figure 1A, (C), and Figure 2—figure supplement 1. (E) Quantification of YFP+ cells revealed that only EC2 neurons are lost at a dose of 1× IVM, and this population is severely affected by 2× IVM. Parasubiculum neurons only become significantly vulnerable to silencing at 2× IVM. Presubiculum neurons showed no cell loss at either dose. (F) Immunostaining for the transgenic human glycine receptor revealed that EC2 and parasubiculum neurons express high levels of GlyCl, while expression in presubiculum was considerably lower. (G, H) High-magnification images of GlyCl immunostaining from (E) show that fluorescence intensity was similar in EC2 and parasubiculum. (I) Quantification of per-cell fluorescence intensity confirms that GlyCl expression is nearly identical between EC2 and parasubiculum despite differences in cell loss upon IVM silencing. Graphs depict average number of YFP+ cells (E) or average per-cell intensity of GlyCl+ neurons (I) for each animal ± SEM, one-way ANOVA with Tukey’s post-test. Cell counts were done 14 dpi. Veh n = 5, 1× IVM n = 7, 2× IVM n = 6. *p<0.05, ***p<0.001, ****p<0.0001. Associated with Figure 2—figure supplement 1.
-
Figure 2—source data 1
Numerical data for Figure 2.
- https://cdn.elifesciences.org/articles/83813/elife-83813-fig2-data1-v2.xlsx
Figure 2—figure supplement 1
Brain regions outside entorhinal cortex (EC) express GlyCl in the Nop-GlyCl model and are electrically suppressed by ivermectin (IVM).
Left panels show example traces from whole-cell current-clamp recordings in presubiculum (top row) and parasubiculum (bottom row). Action potential firing in response to stepped current injection is unaffected by application of 100 nM IVM in control mice (Nop-tTA single transgenic) but is decreased in cells from Nop-GlyCl bigenic animals. Summary graphs on right show action potential number as a function of current step (mean ± SEM). Graphs for Nop-GlyCl animals are identical to those shown in Figure 2 and are repeated here for comparison with controls. Data expressed as mean ± SEM, two-way repeated-measures ANOVA (p-value for interaction of treatment × current, ****p<0.0001). Controls: pre n = 7 cells from seven slices (three mice); para n = 6 cells from six slices (three mice).
-
Figure 2—figure supplement 1—source data 1
Numerical data for Figure 2—figure supplement 1.
- https://cdn.elifesciences.org/articles/83813/elife-83813-fig2-figsupp1-data1-v2.xlsx
Figure 3
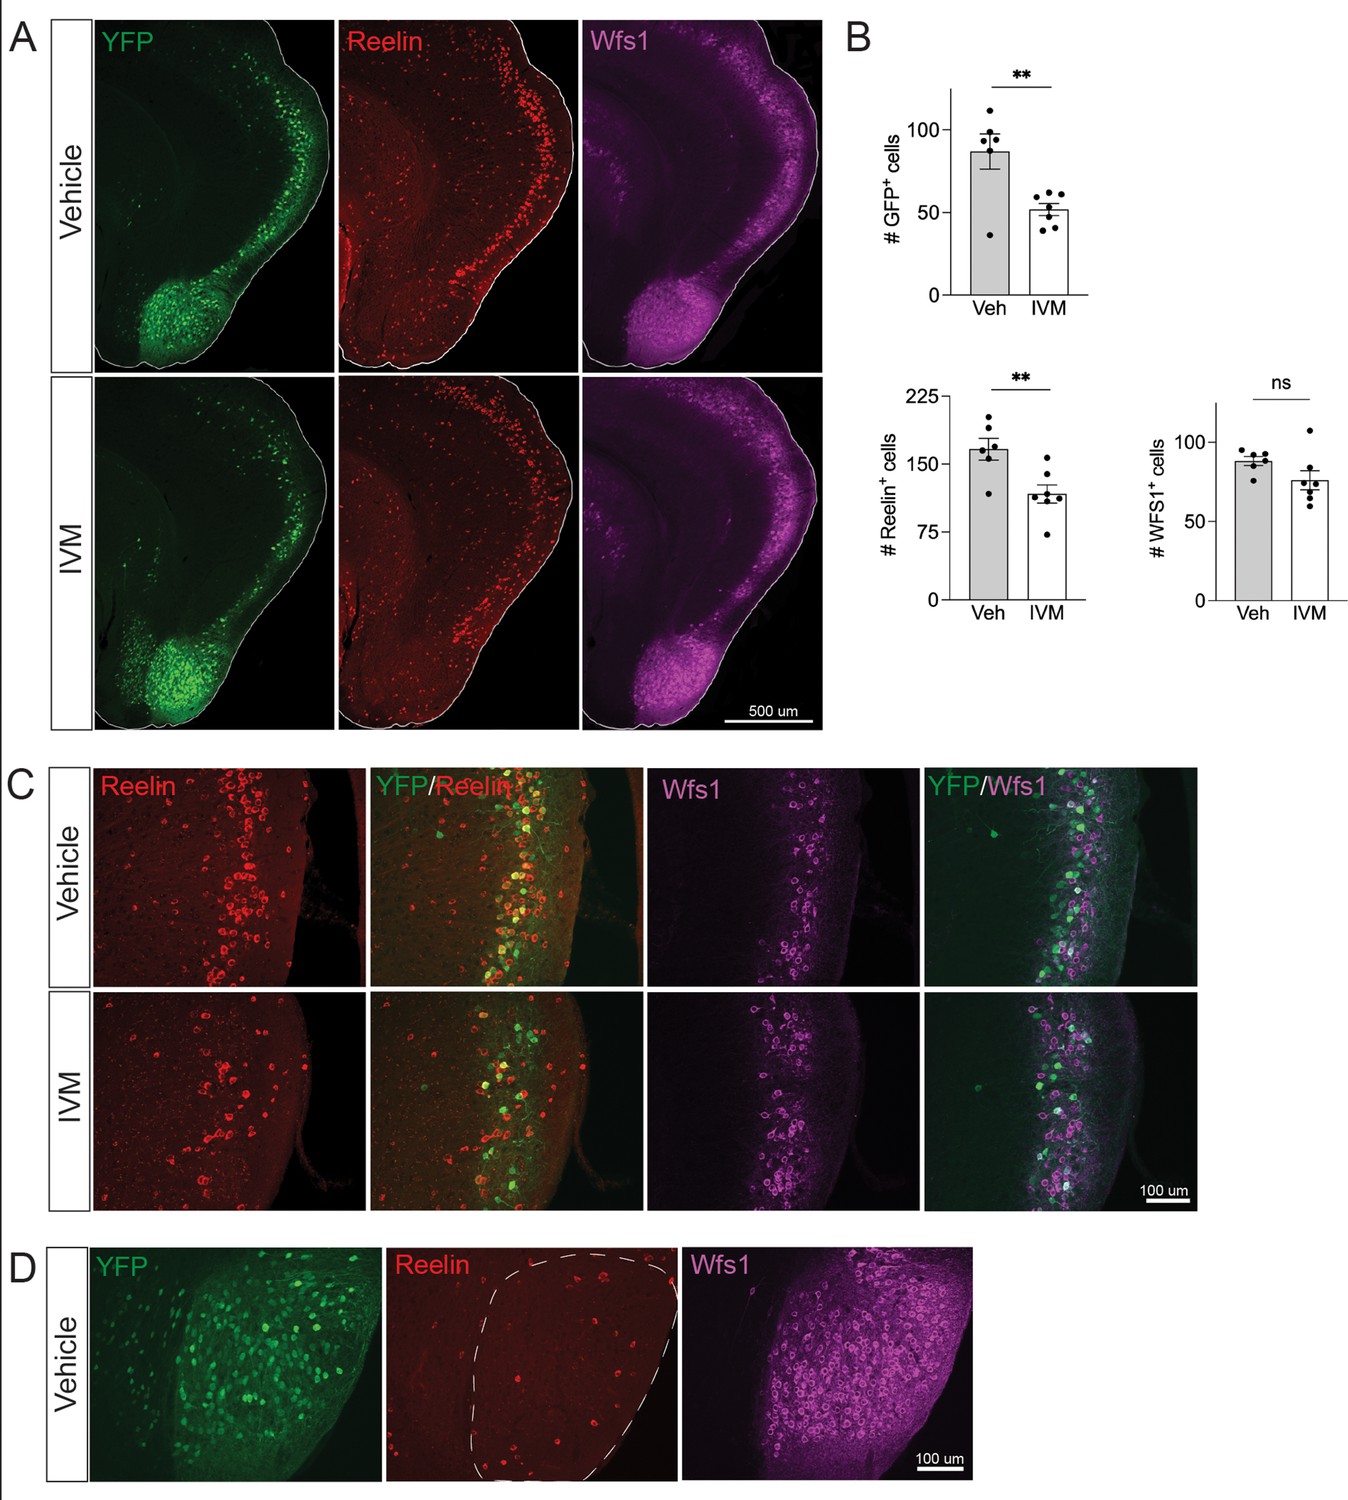
Electrical silencing preferentially kills reelin-positive stellate cells in EC2.
(A) Co-immunostaining of Nop-GlyCl mice for YFP, reelin, and Wfs1 revealed that the transgene was expressed in both EC2 reelin+ stellate cells and Wfs1+ pyramidal neurons. Animals were harvested 7 days after a single injection of vehicle or ivermectin (IVM) (5 mg/kg). (B) EC2 YFP+ cells were diminished by ~40% upon silencing, reelin cells were reduced by ~30%, and Wfs1 cells were preserved, suggesting preferential vulnerability of stellate neurons upon electrical silencing. Data expressed as mean ± SEM. Veh n = 6, IVM n = 7. Student’s t-test (two-sided). **p<0.01. (C) High-magnification images of reelin, Wfs1, and YFP immunostaining in EC2 show a loss of reelin+ and YFP+ cells but no difference in Wfs1+ neurons after electrical silencing. (D) High-magnification images of the parasubiculum show that cells in this region are predominantly Wfs1+, consistent with their resistance to activity perturbation.
-
Figure 3—source data 1
Numerical data for Figure 3.
- https://cdn.elifesciences.org/articles/83813/elife-83813-fig3-data1-v2.xlsx
Figure 4
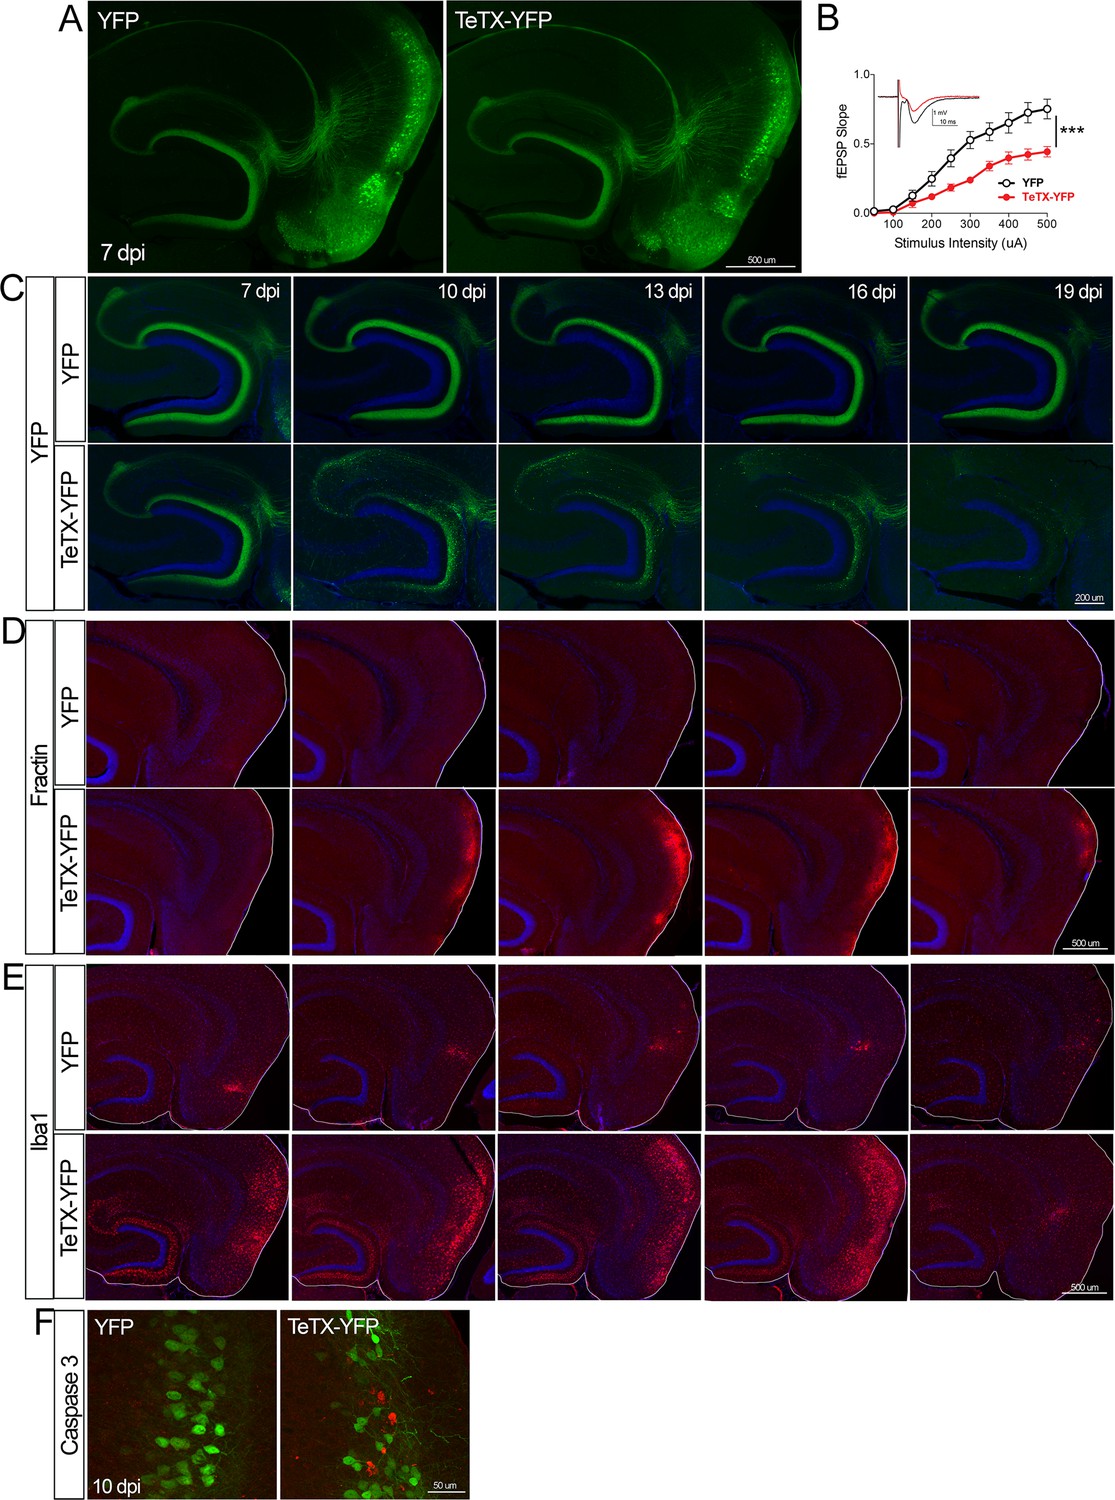
Entorhinal cell death is also elicited by synaptic silencing with tetanus toxin (TeTX).
(A) AAV was used to express either YFP or YFP plus TeTX in entorhinal neurons. By 7 dpi, axons terminating in the dentate gyrus (DG) can be clearly seen in both constructs by native fluorescence. (B) Virally delivered TeTX effectively diminishes synaptic transmission into DG. Data expressed as mean ± SEM, two-way repeated-measures ANOVA (p-value for interaction of condition × stimulus intensity, ***p<0.001). n = 15 slices from three mice (YFP), 17 slices from three mice (TeTX), harvested 7–9 dpi. Note that YFP data shown here is identical to Figure 1—figure supplement 2B as the same control group was used for both experiments. (C) TeTX causes disintegration of labeled perforant path axons. No change in dentate innervation is seen in animals injected with YFP control virus. DAPI counterstain indicates the dentate granule cell layer. (D) Fractin immunostaining appears in EC as axons disintegrate in DG. (E) Microglial activation detected with Iba1 appears rapidly in both DG and EC by 7 dpi in mice injected with AAV-TeTX and persists in EC for more than a week before resolving. Microglial activation is seen only at the injection site in mice injected with AAV-YFP. (F) Active caspase 3 immunostaining (red) is found among YFP+ cells in the EC (green) only in animals co-expressing TeTX. 4 dpi n = 2 YFP, 2 TeTX; 7 dpi n = 4 YFP, 4 TeTX; 10 dpi n = 3 YFP, 4 TeTX; 13 dpi n = 5 YFP, 4 TeTX; 16 dpi n = 6 YFP, 4 TeTX; 19 dpi n = 3 YFP, 5 TeTX; 22 dpi n = 2 YFP. Unnecessary cerebellar tissue, where present, was masked in Photoshop to match fields of view across panels.
-
Figure 4—source data 1
Numerical data for Figure 4.
- https://cdn.elifesciences.org/articles/83813/elife-83813-fig4-data1-v2.xlsx
Figure 5

Different patterns of axonal damage attend neuronal silencing by GlyCl and tetanus toxin (TeTX).
(A) Retraction bulbs were visible in deep entorhinal cortex (EC) layers of Nop-GlyCl bigenic animals 4 days after injection of ivermectin (IVM) (upper panel), while axons in vehicle-treated mice remain intact (lower panel). (B) In contrast to the discrete retraction bulbs seen with GlyCl, TeTX silencing caused axonal fragmentation throughout the dentate gyrus (DG) molecular layer (arrows, upper panel). YFP labeling in TeTX mice became punctate and innervation deteriorated within 10 days after viral injection, while the axons of EC neurons labeled with YFP alone remained robust and bright (lower panel).
Figure 6 with 2 supplements
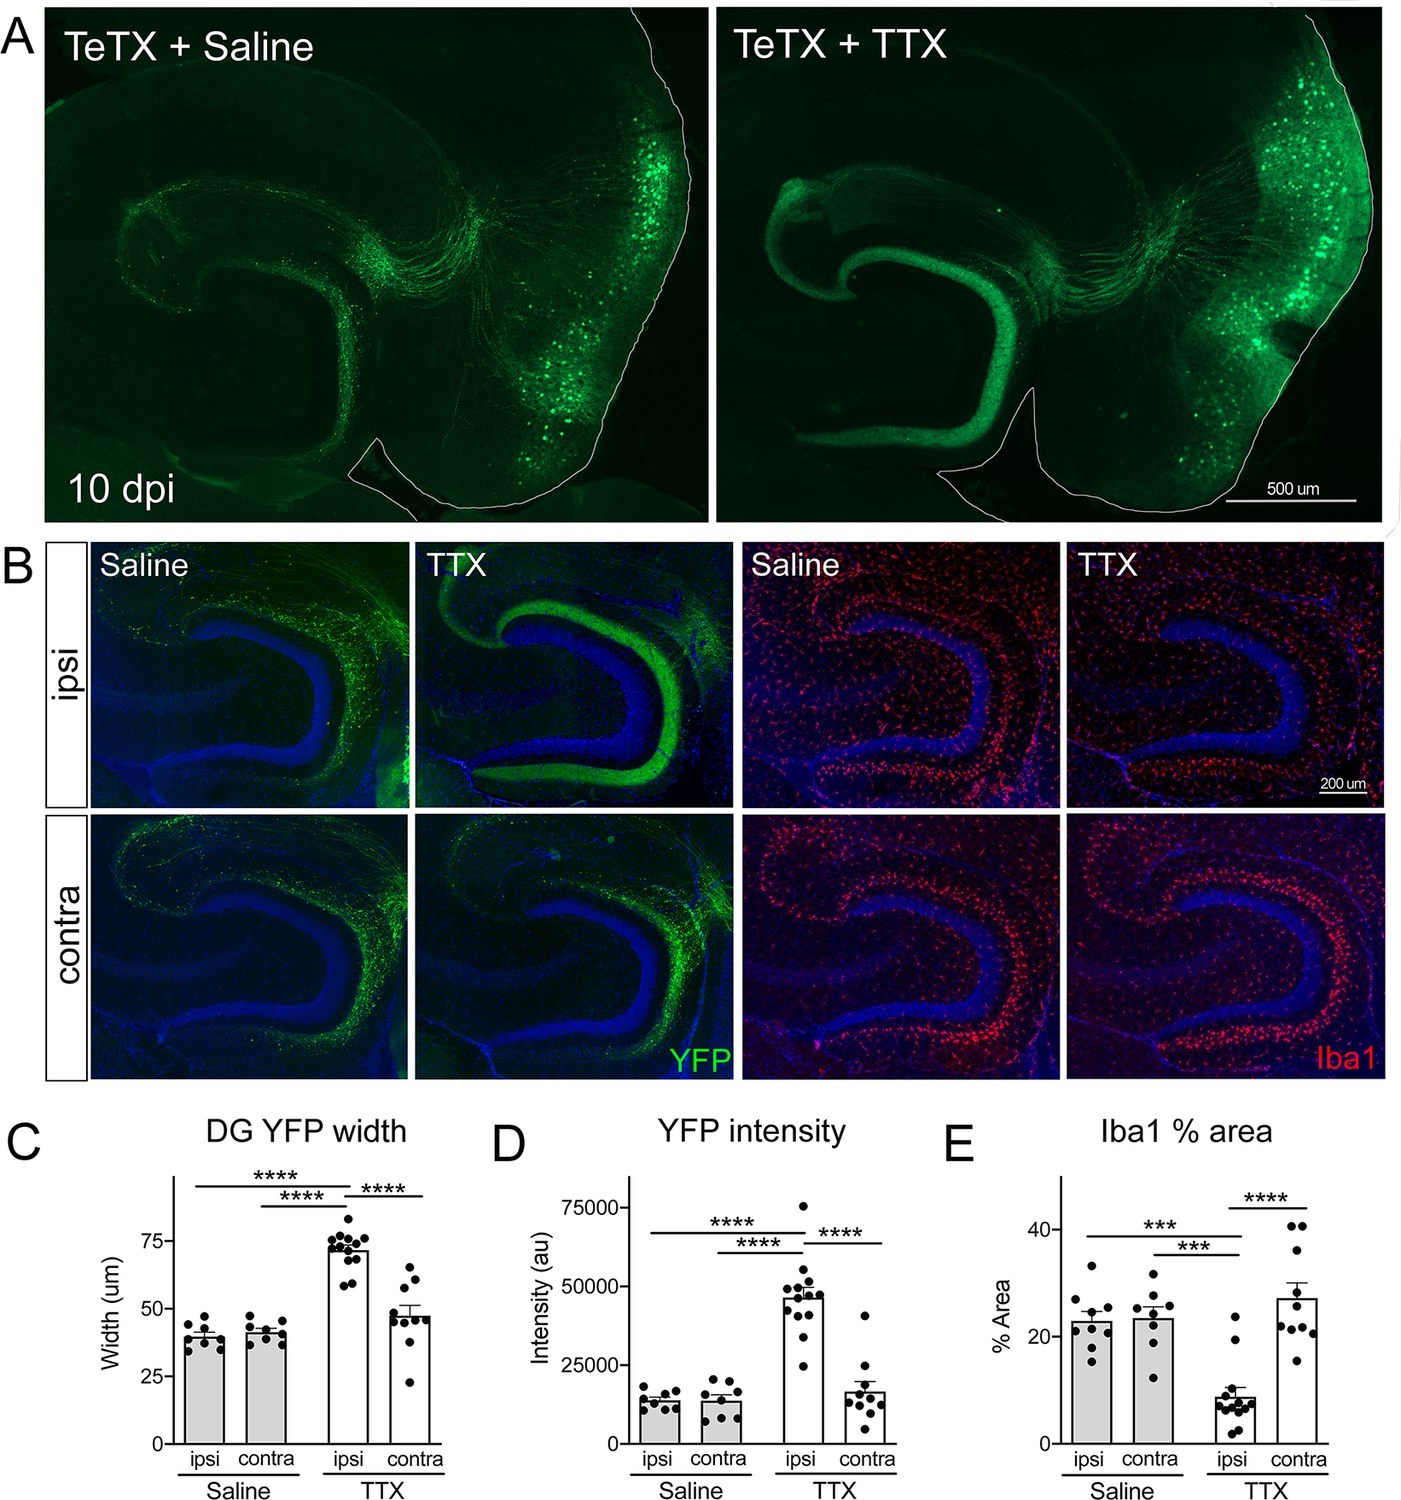
Activity-dependent competition governs entorhinal cortex (EC) axonal disintegration due to tetanus toxin (TeTX) silencing.
Mice expressing TeTX + YFP in EC neurons were treated by local infusion of tetrodotoxin (TTX) or saline. Unilateral infusion targeting dorsal EC began 3 days after viral injection and continued until mice were harvested 7 days later (10 dpi). (A) Representative images showing the spread of TeTX transduction in the EC as visualized by native YFP fluorescence. Preservation of dentate gyrus (DG) innervation can be seen in the TTX-infused animal (right), in contrast to the punctate 'beads on a string' labeling of remaining perforant path axons in the saline-infused condition (left). (B) Left panels: images show YFP labeling of TeTX-expressing axons (green) in the DG both ipsilateral and contralateral to the infusion cannula. DG innervation is only preserved ipsilateral to TTX infusion. Right panels: images show Iba1 immunostaining in the DG, where TeTX-evoked microglial activation is prevented in the TTX-infused hemisphere. (C, D) The width (C) and intensity (D) of YFP labeling at the crest of the DG confirms axonal sparing ipsilateral to TTX infusion. (E) Analysis of % area occupied by Iba1 in the DG confirms that microglial activation was prevented in the TTX-infused hemisphere. Graphs depict average values for each animal ± SEM, one-way ANOVA with Tukey’s post-test (missed injection target for some hemispheres precluded two-way ANOVA). n = 8–9 (saline infusion), 10–13 (TTX infusion). *p<0.05, ***p<0.001, ****p<0.0001. Associated with Figure 6—figure supplements 1 and 2.
-
Figure 6—source data 1
Numerical data for Figure 6.
- https://cdn.elifesciences.org/articles/83813/elife-83813-fig6-data1-v2.xlsx
Figure 6—figure supplement 1
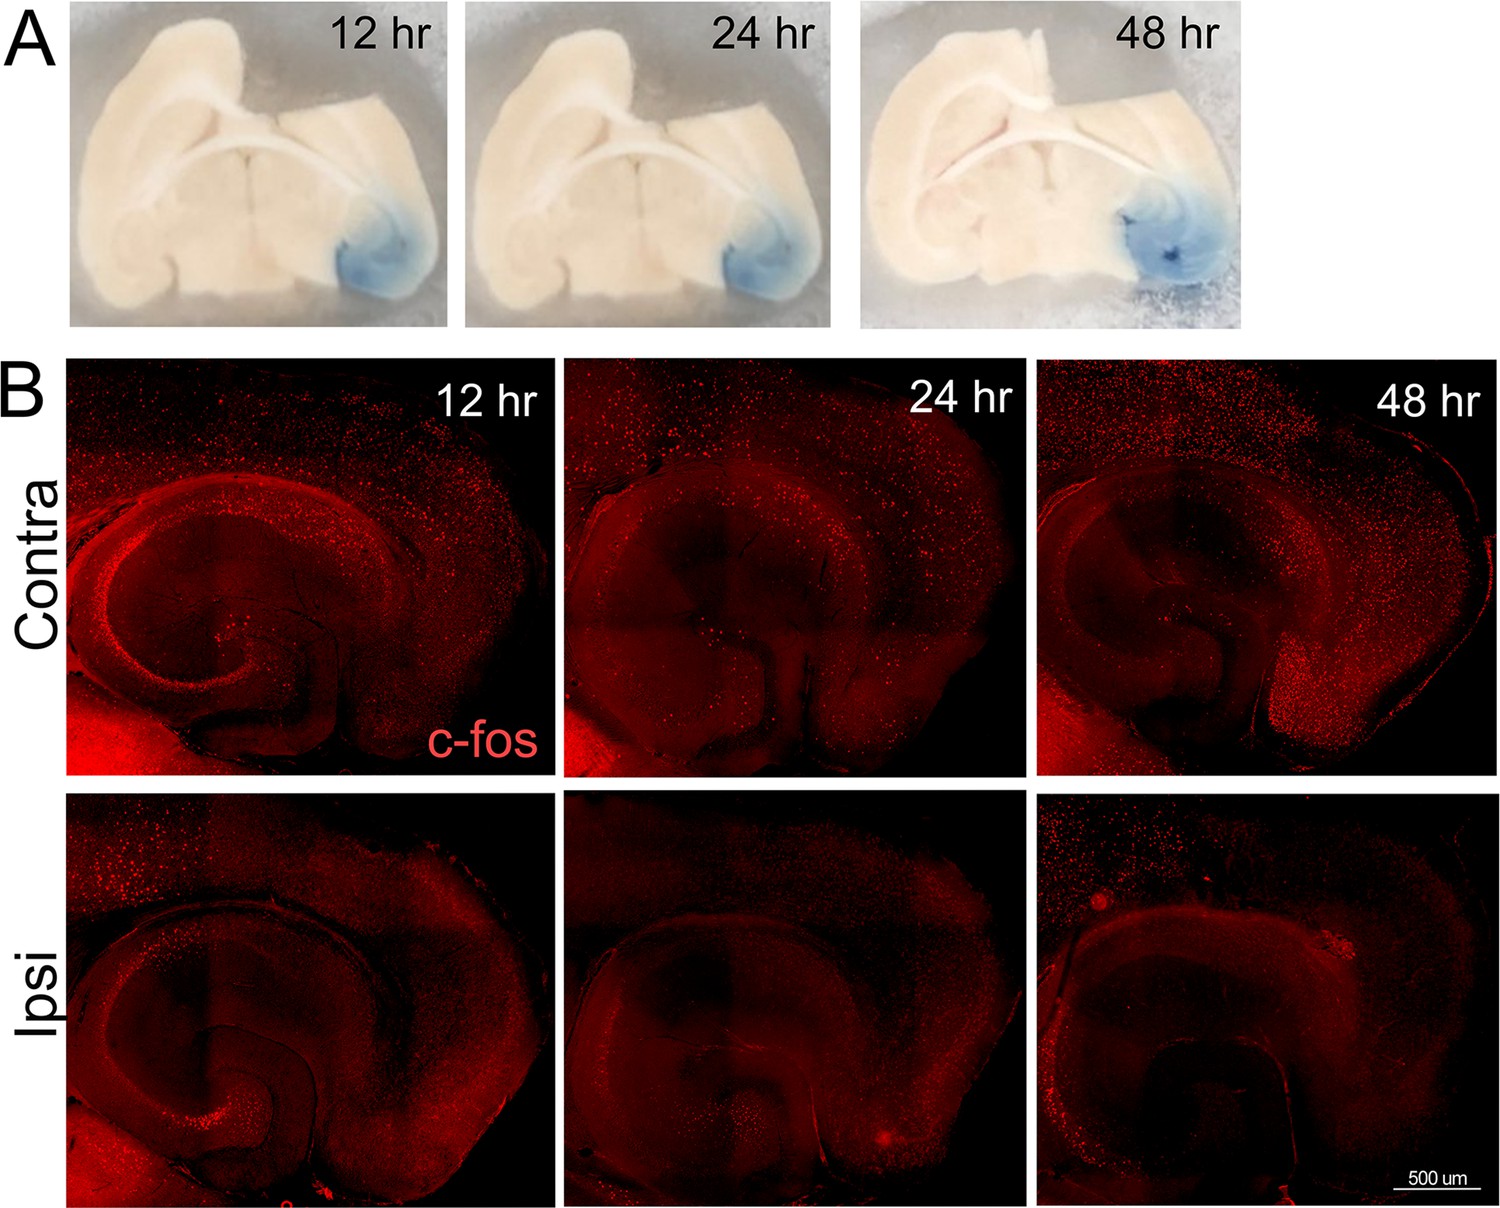
Broad silencing of neuronal activity in the entorhinal cortex (EC) following tetrodotoxin (TTX) infusion.
An intracranial cannula was placed just above the right EC, fed by a subdermal osmotic pump containing 2.3 µM TTX and trypan blue dye in saline. Pentylenetetrazol (PTZ) was injected 90 min prior to harvest to assess when and where TTX spread was able to suppress neuronal activity induced by a proconvulsant drug. (A) Trypan blue in the entorhinal cortex and dentate gyrus at 12, 24, and 48 hr after cannula insertion shows the reach of infused TTX. (B) Tissue sections from animals infused with TTX were immunostained with c-fos to visualize neuronal activation following PTZ injection. The top row shows broad c-fos distribution in the contralateral hemisphere, consistent with generalized seizure activity caused by PTZ. The bottom row shows c-fos distribution in the hemisphere infused with TTX, harvested 12, 24, or 48 hr after cannula placement. The absence of c-fos staining in the EC, subiculum, and dentate gyrus (DG) indicates that TTX effectively suppressed neuronal activity by 12 hr after the start of infusion. n = 2 for each time point.
Figure 6—figure supplement 2
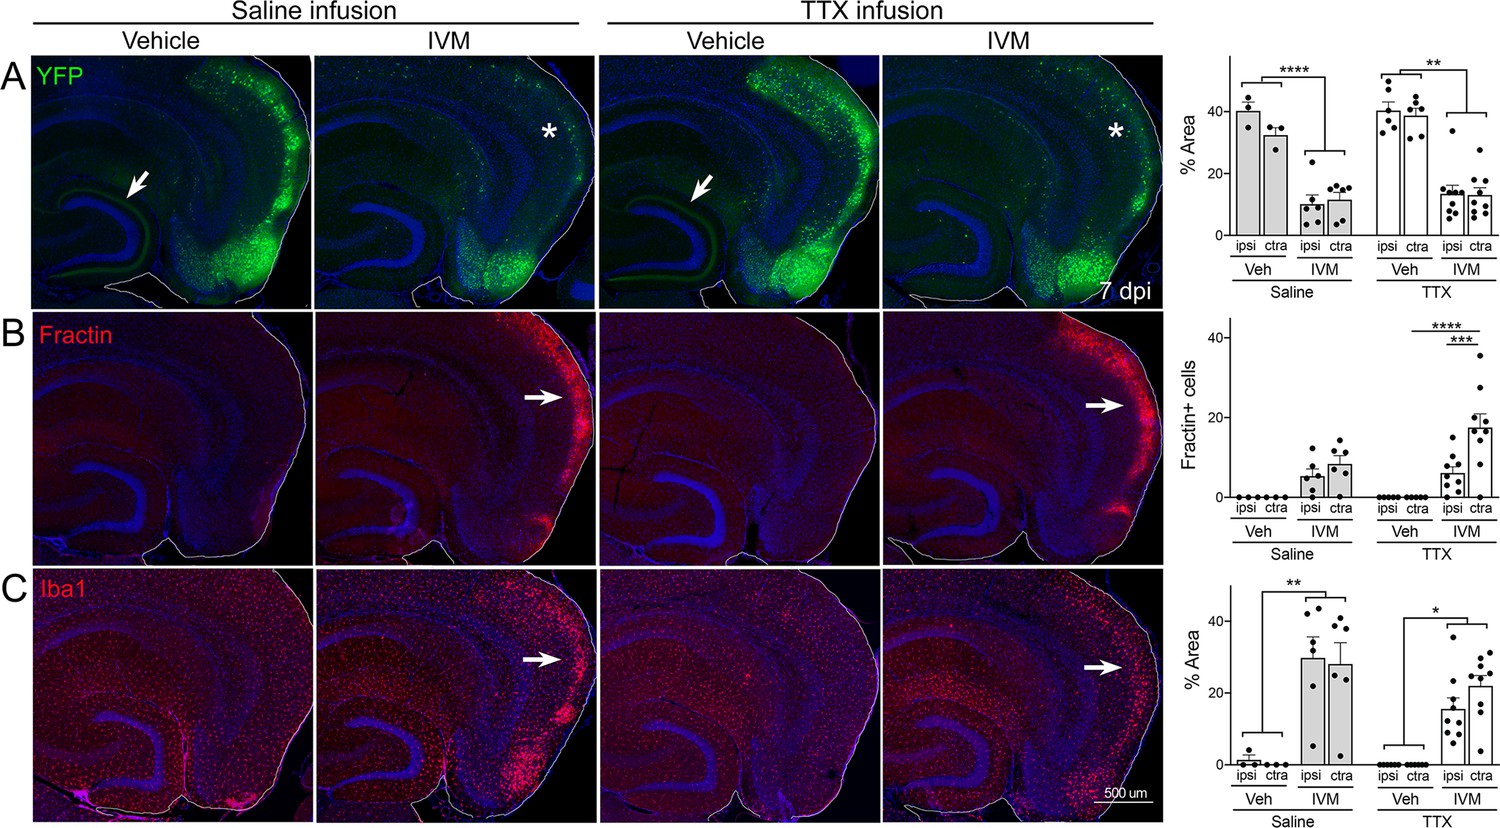
Global suppression of entorhinal cortex (EC) activity does not prevent cell death by GlyCl activation.
Nop-tTA; TRE-GlyCl-YFP bigenic mice were cannulated to infuse either tetrodotoxin (TTX) or saline into the right subiculum via osmotic pump. 12 hr later, animals were injected with either vehicle or ivermectin (IVM). All images are from mice euthanized 7 days after IVM treatment. (A) YFP immunostaining shows clear EC2 cell loss in IVM-treated mice regardless of whether they were infused with TTX or saline (asterisks). In contrast, both EC2 labeling of cell bodies and axonal labeling in the DG (arrows) were preserved in vehicle-injected mice, and this pattern was unaffected by TTX infusion. (B) Fractin expression was increased in EC2 of IVM-treated mice (arrows) and unchanged by TTX infusion. (C) Iba1 immunostaining identified EC microglial activation in IVM-treated mice. Graph data expressed as average per section for each animal ± SEM, three-way ANOVA with Sidak’s post-test. n = 3 vehicle + saline infusion; n = 6 IVM + saline infusion; n = 6 vehicle + TTX infusion; n = 9 IVM + TTX infusion. *p<0.05, **p<0.01, ***p<0.001, ****p<0.0001. Unnecessary cerebellar tissue, where present, was masked in Photoshop to match fields of view across panels.
-
Figure 6—figure supplement 2—source data 1
Numerical data for Figure 6—figure supplement 2.
- https://cdn.elifesciences.org/articles/83813/elife-83813-fig6-figsupp2-data1-v2.xlsx
Author response image 1
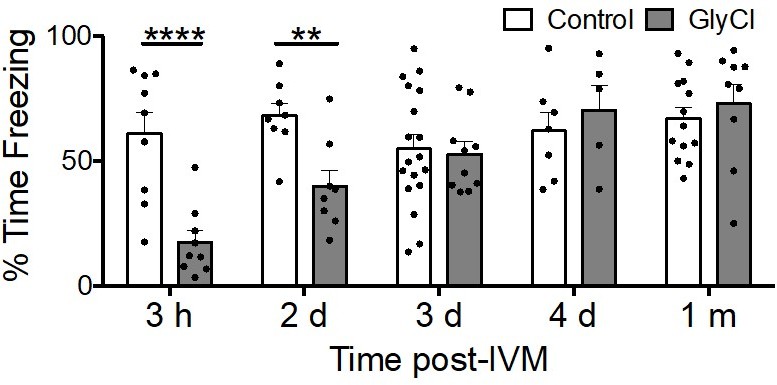
Acquisition of conditioned fear takes several days to recover from entorhinal silencing.
Contextual fear conditioning was performed in 3 month old animals trained at varying times following a single injection of IVM. Recall for the trained chamber was measured 24 hours after conditioning as % time immobile during a 5 min test session. IVM treatment had no effect at any time on control animals lacking GlyCl expression (white bars), while associative memory was significantly impaired in animals with entorhinal GlyCl trained 3 hours or 2 days after IVM injection, and finally recovered to control levels by 3 days after IVM dosing.
Additional files
Download links
A two-part list of links to download the article, or parts of the article, in various formats.
Downloads (link to download the article as PDF)
Open citations (links to open the citations from this article in various online reference manager services)
Cite this article (links to download the citations from this article in formats compatible with various reference manager tools)
Activity disruption causes degeneration of entorhinal neurons in a mouse model of Alzheimer’s circuit dysfunction
eLife 11:e83813.
https://doi.org/10.7554/eLife.83813


