Fluid extraction from the left-right organizer uncovers mechanical properties needed for symmetry breaking
- CEDOC, Chronic Diseases Research Centre, NOVA Medical School. Faculdade de8 Ciências Médicas, Universidade Nova de Lisboa, Portugal
- Laboratorio Nacional de Microscopía Avanzada. Departamento de Genética del Desarrollo y Fisiología Molecular. Instituto de Biotecnología. Universidad Nacional Autónoma de México (UNAM), Mexico
- Instituto Gulbenkian de Ciência, Fundação Calouste Gulbenkian, Portugal
- School of Mathematics, University of Birmingham, United Kingdom
- Institute for Metabolism and Systems Research, University of Birmingham, United Kingdom
Figures
Figure 1 with 6 supplements
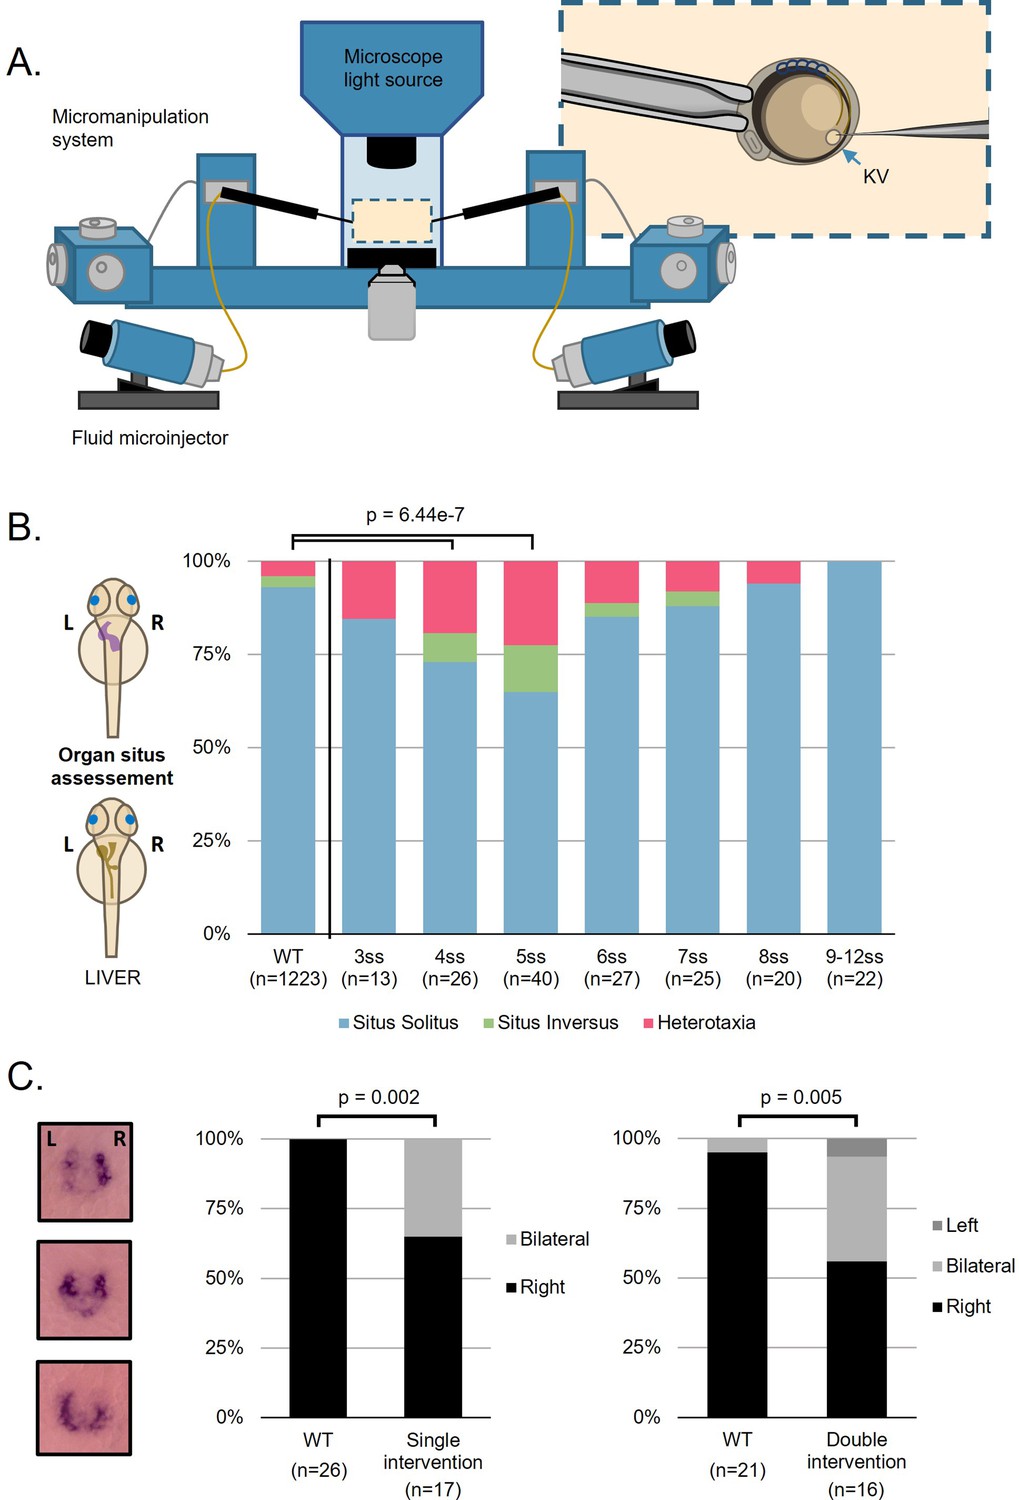
Fluid extractions uncover a sensitive one-hour interval.
(A) Schematic representation on the micromanipulation setup developed for the zebrafish LRO fluid extraction throughout development. (B) Evaluation of organ patterning after 48 hr. Heart and liver position were scored for each embryo manipulated in the respective developing stage from 3 to 12 ss, situs inversus in zebrafish means both organs are localized on the right side and heterotaxia means that at least one organ is wrongly localized. (C) dand5 expression pattern at 8 ss after single intervention at 5 ss and double intervention at 5 and 7 ss for LRO liquid extraction. LRO. left-right organizer, ss. somite stage.
-
Figure 1—source data 1
Characterization of heart and gut situs in zebrafish larvae.
- https://cdn.elifesciences.org/articles/83861/elife-83861-fig1-data1-v1.xlsx
Figure 1—figure supplement 1
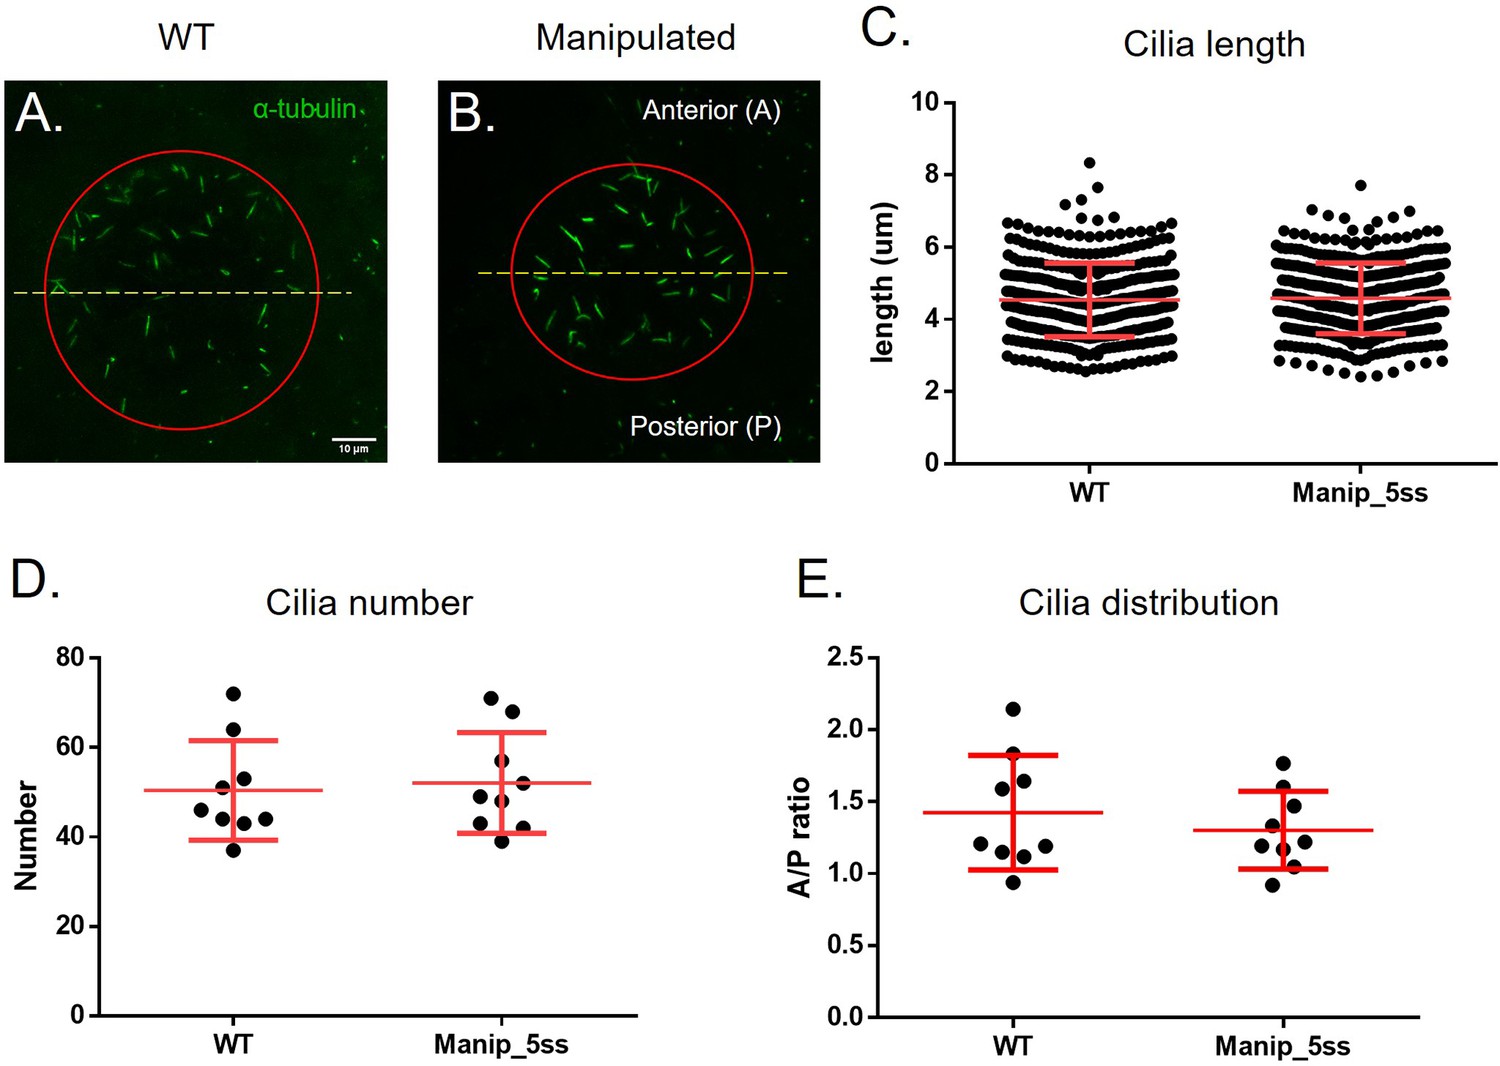
Manipulated embryos develop normal LRO cilia evaluated by immunofluorescence.
Cilia number, length and anterior-posterior ratio of cilia distribution in WT and fluid extracted embryos – (A–B): Acetylated α-tubulin (in green) immunostaining examples showing LRO labelled cilia on WT and manipulated embryos. A number of 388 cilia in 8 WT embryos and 399 cilia in 8 manipulated embryos were measured in 3D (C). Mean cilia number (D) and A/P ratio (E) are displayed per embryo. Student’s t-test was used to assess differences between groups.
-
Figure 1—figure supplement 1—source data 1
Cilia number for WT and manipulated embryos.
- https://cdn.elifesciences.org/articles/83861/elife-83861-fig1-figsupp1-data1-v1.xlsx
Figure 1—figure supplement 2
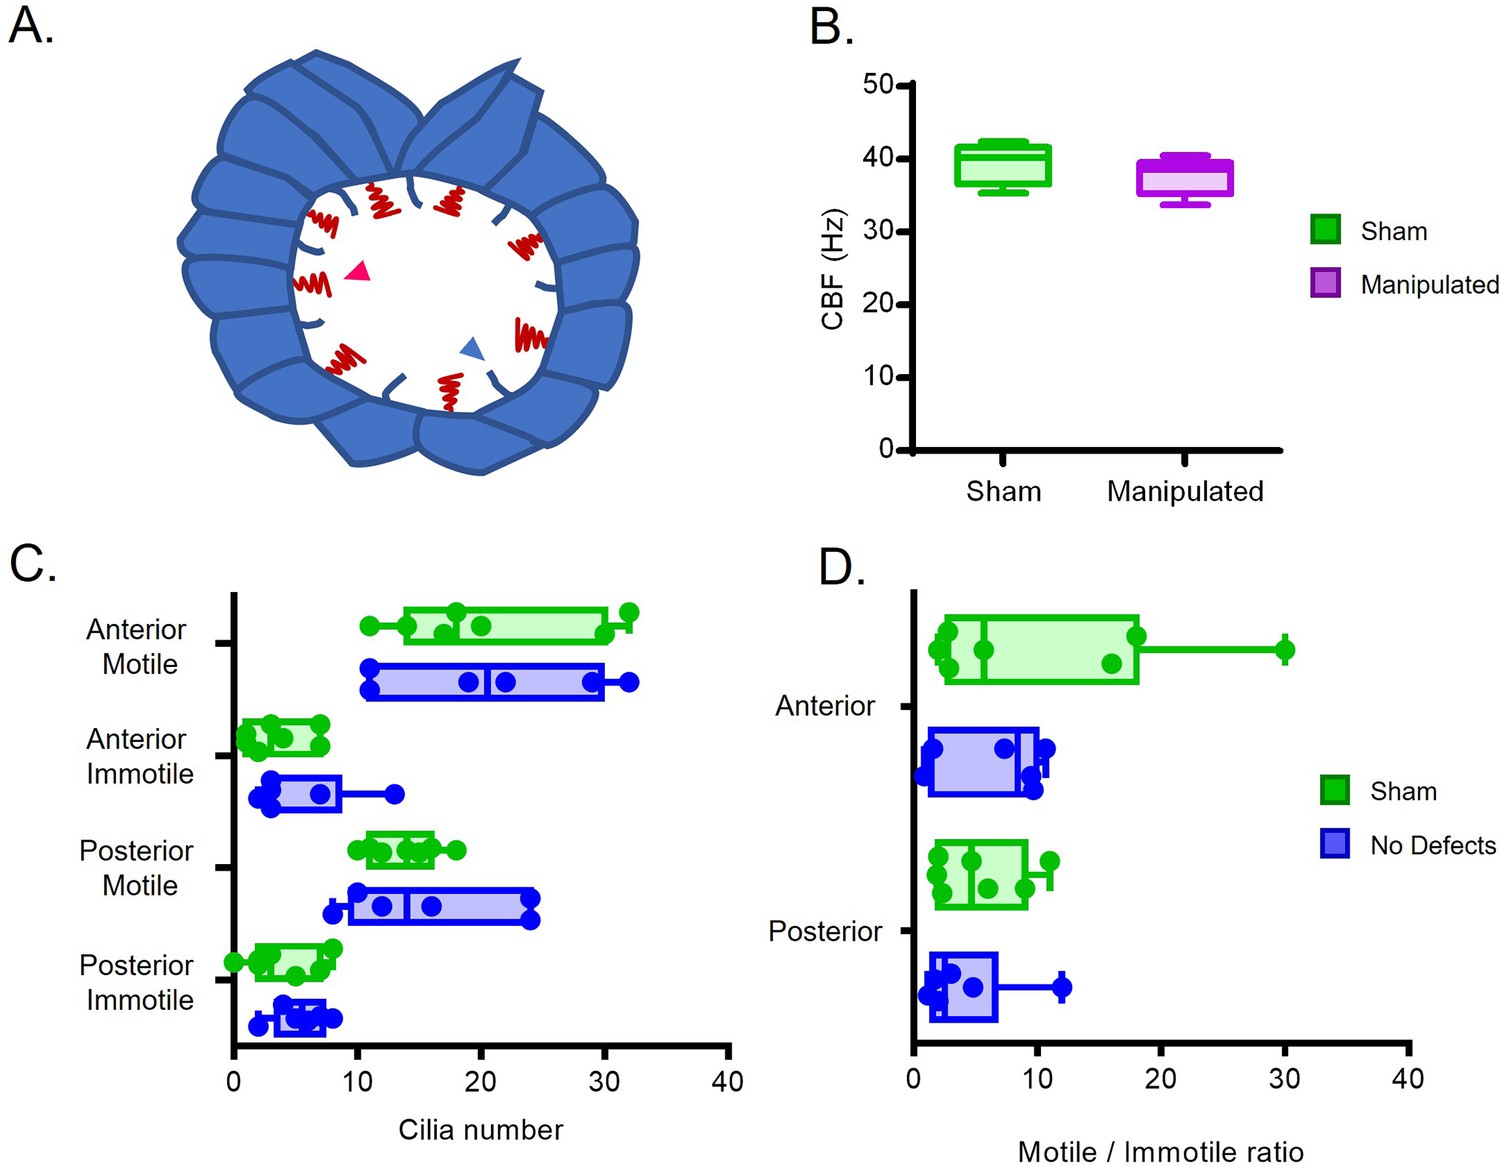
Cilia Beat Frequency and motile/ immotile cilia ratio do not change in manipulated embryos evaluated by live imaging.
(A) Diagram highlighting motile and immotile cilia intercalated in the LRO cells. (B) CBF of the motile beating cilia that could be visualized by bright field live microscopy in the Sham control embryos versus manipulated embryos (C) Total number of motile and immotile cilia located anteriorly and posteriorly between sham controls and embryos without LR defects. (D) Motile to immotile cilia ratio in the anterior and posterior LRO of Sham control embryos versus embryos that later developed without LR defects. Fisher’s exact test was used to assess differences between treatments using pooled data from 6 embryos per treatment. Embryos were manipulated for LRO fluid extracted at 5 ss and were imaged at 6 ss. CBF: cilia beat frequency (relates to Figure 1—video 3).
-
Figure 1—figure supplement 2—source data 1
Live imaging cilia motility status and localization.
- https://cdn.elifesciences.org/articles/83861/elife-83861-fig1-figsupp2-data1-v1.xlsx
Figure 1—figure supplement 3
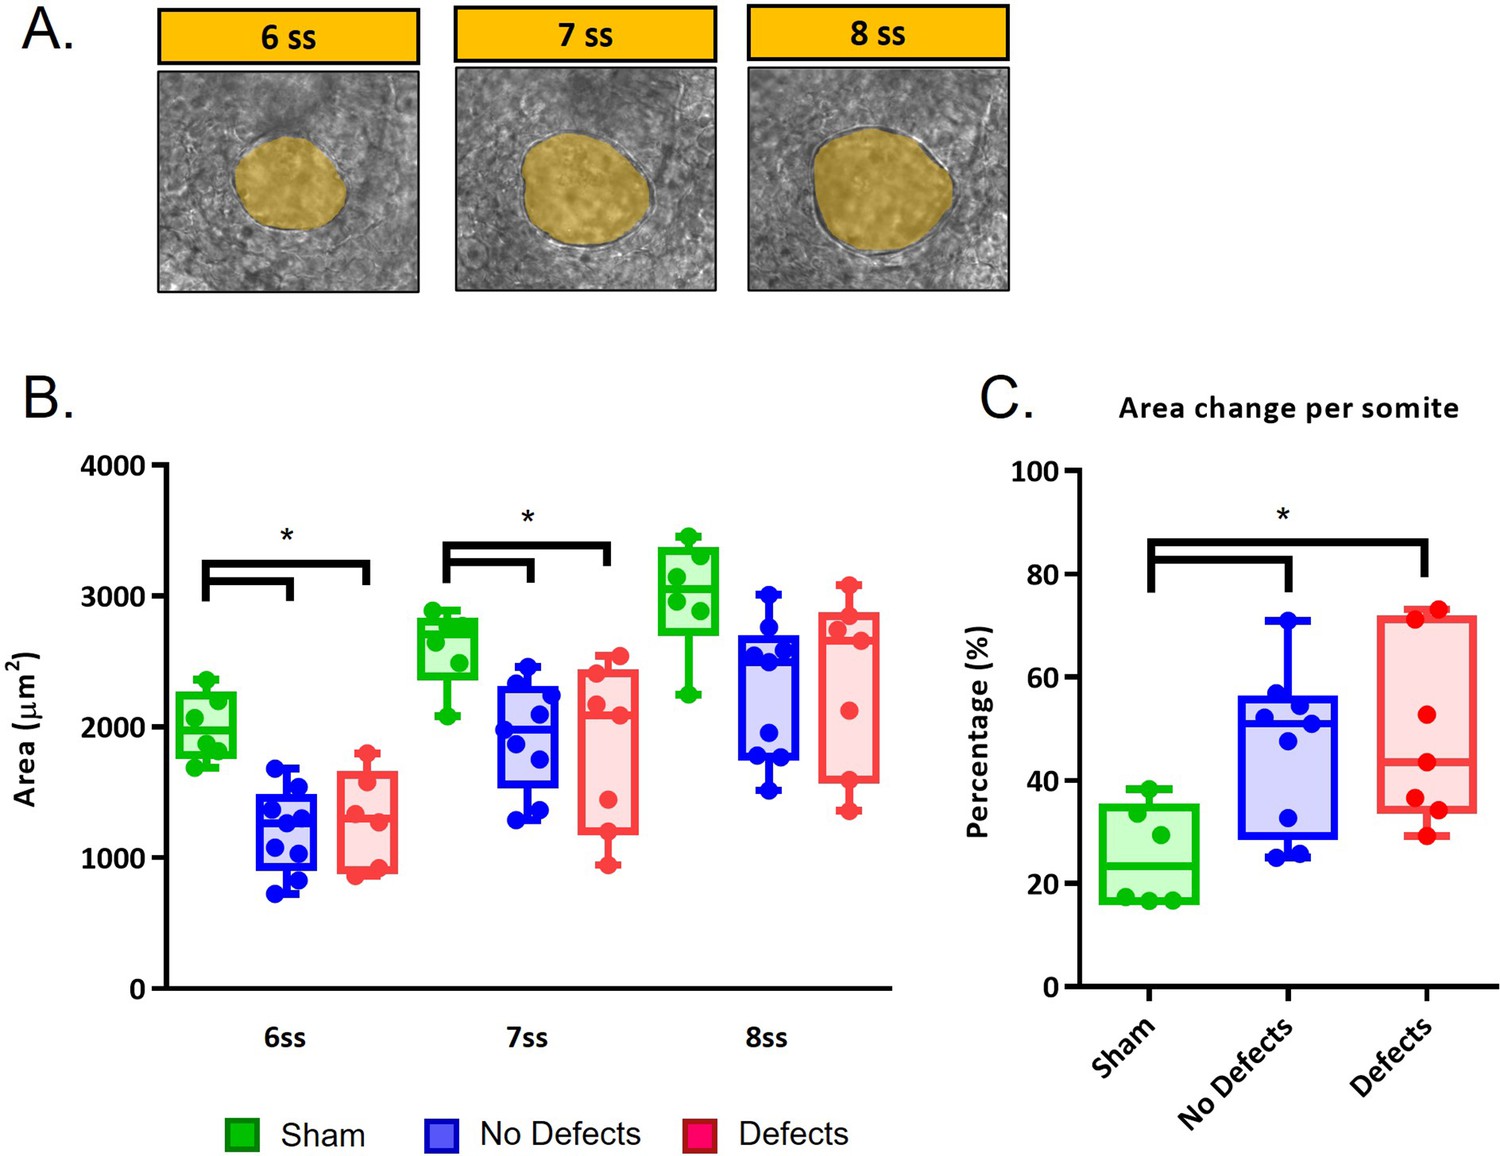
LRO areas from recovering embryos that develop left-right defects are not different from embryos that have a normal development.
(A) LRO areas at 6–8 ss following extraction at 5 ss (B) Quantifications of LRO area of the three different groups (‘Sham’ control, ‘No Defects’ and ‘Defects’ group) in manipulated embryos during LRO lumen area recovery from 6 ss to 8 ss. (C) Area change per somite. Mann-Whitney U test p-value <0.05.
-
Figure 1—figure supplement 3—source data 1
Left right organizer area quantification.
- https://cdn.elifesciences.org/articles/83861/elife-83861-fig1-figsupp3-data1-v1.xlsx
Figure 1—video 1
Close-up of fluid extraction technique employed in a 8 ss embryo.
Sequence of processed bright-field images acquired at ×10 magnification, showing a micropipette extracting the liquid from the KV lumen (related to Figure 1A–B).
Figure 1—video 2
Close-up of fluid extraction technique employed in a 5 ss embryo.
Sequence of processed bright-field images acquired at ×10 magnification, showing a micropipette extracting the liquid from the KV lumen (related to Figure 1A–B).
Figure 1—video 3
Evaluation of motile and immotile cilia distribution at 6 somite stage embryos.
Injection of arl13b at one-cell stage allows for visualization of motile versus immotile cilia. Anterior-posterior distribution was scored in 15 embryos that were later grouped as sham controls (normal situs), embryos with LR defects and without LR defects (related to Supplementary file 1).
Figure 2 with 4 supplements
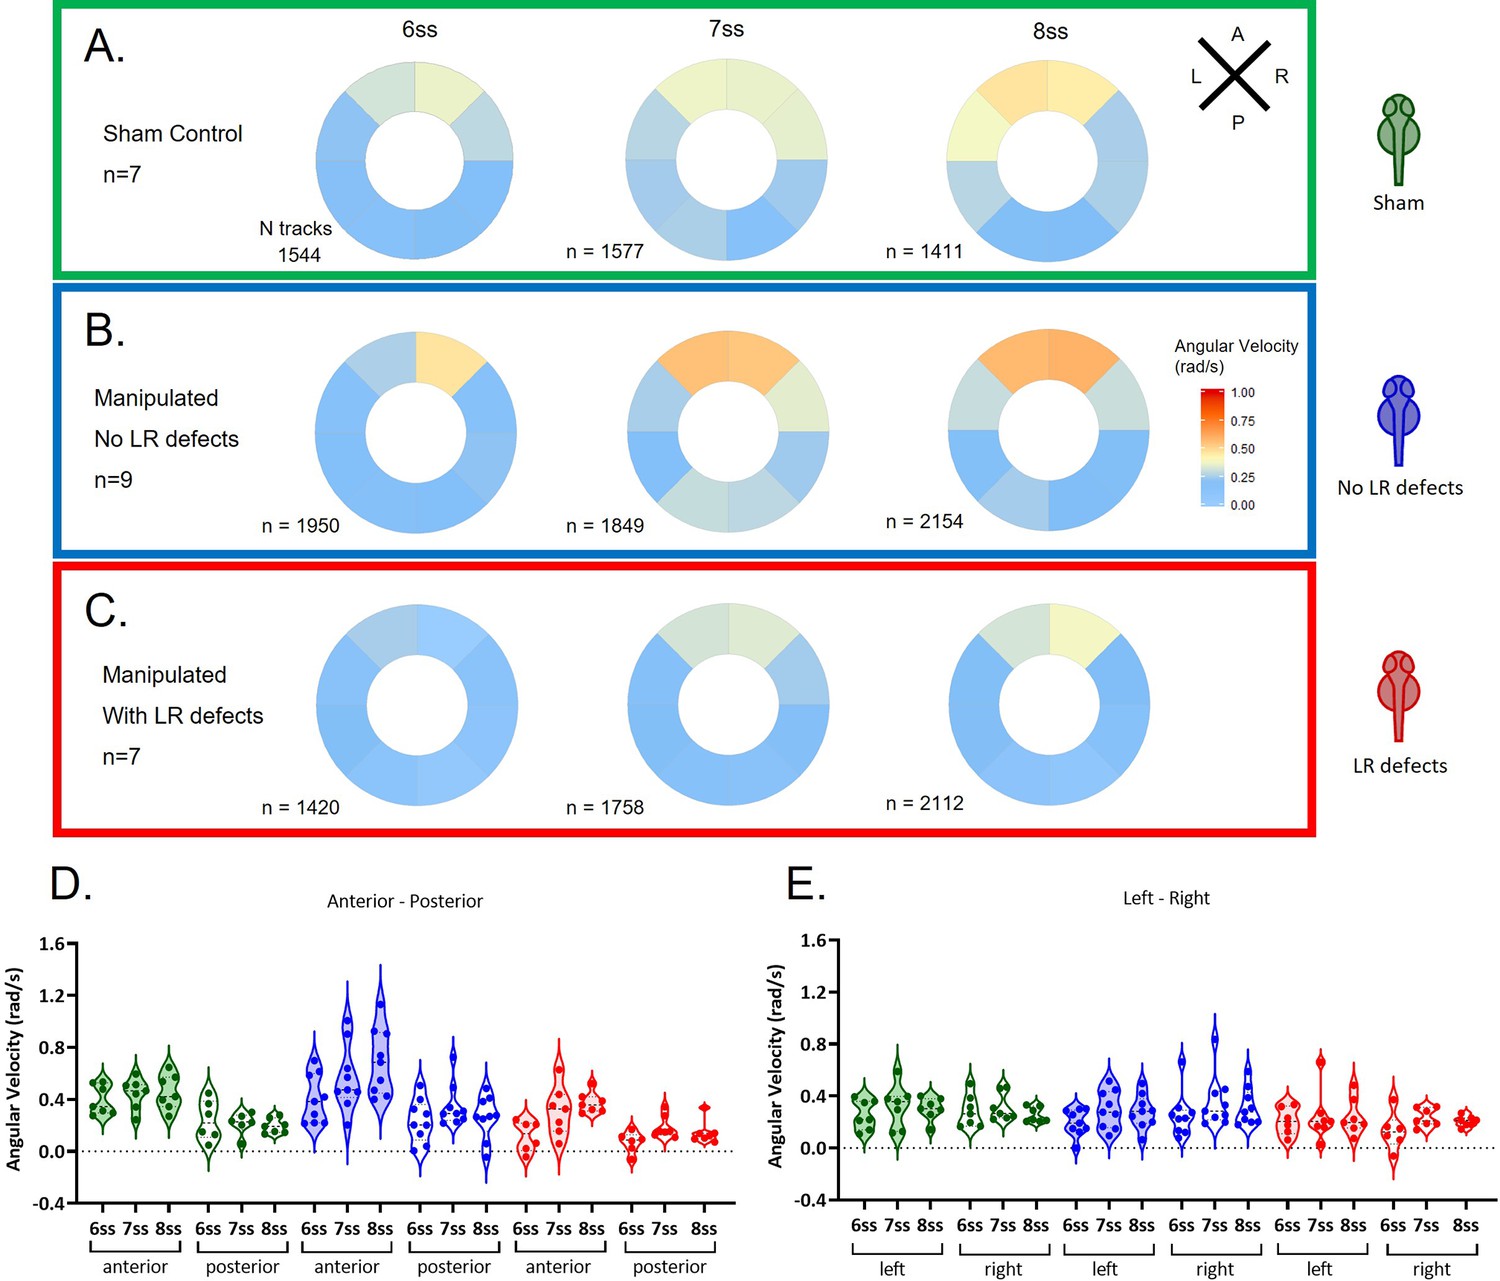
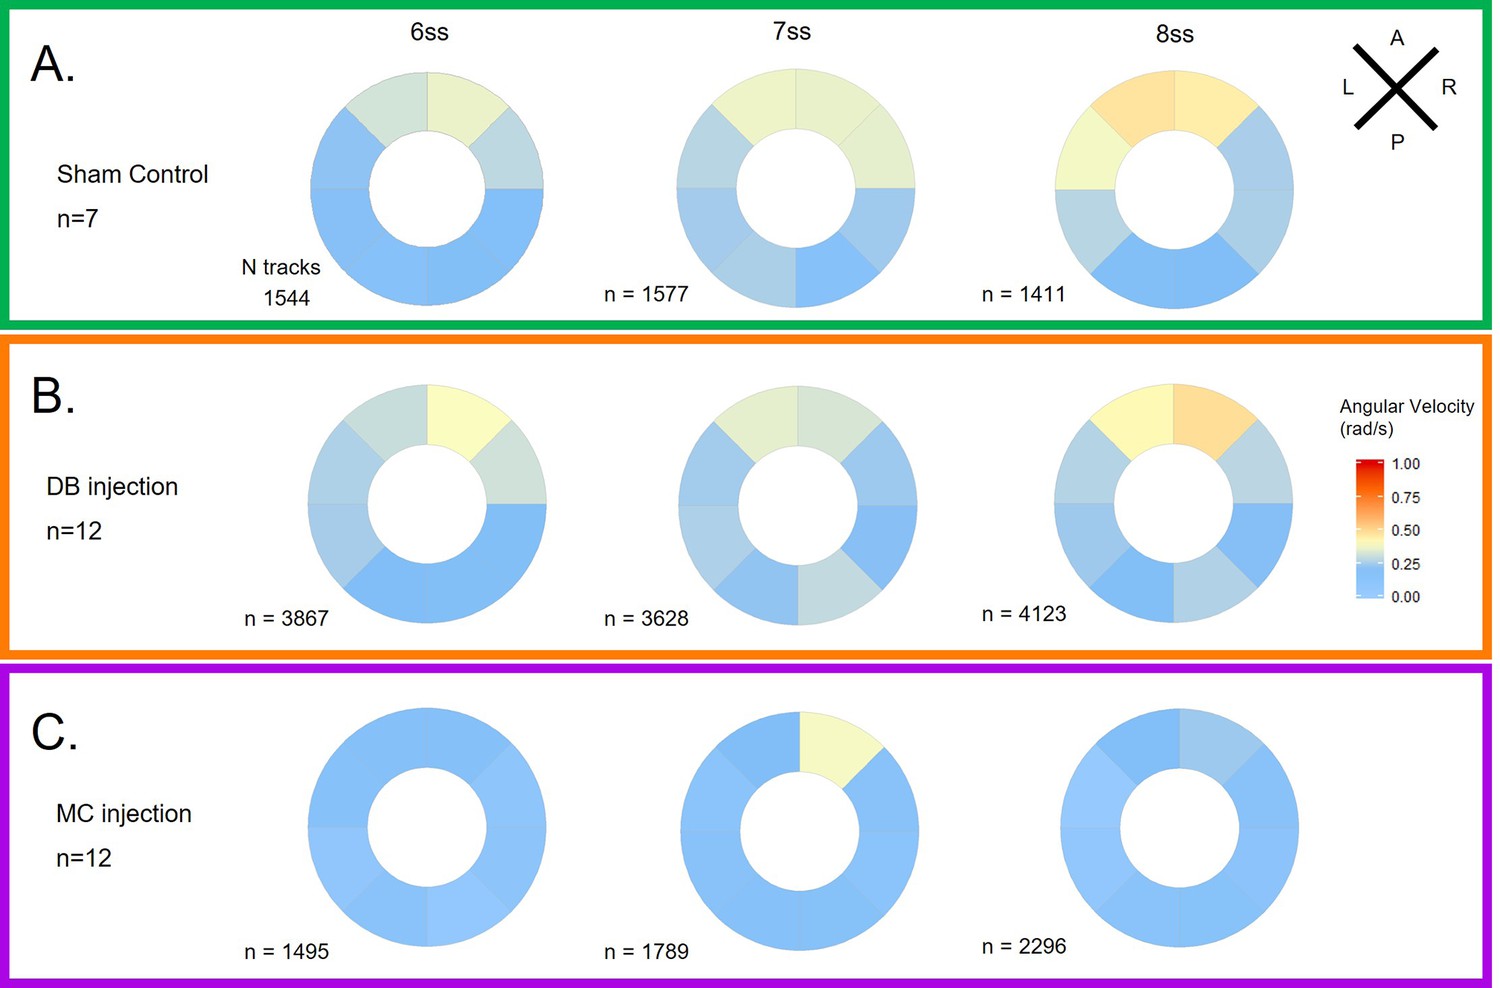
Angular velocity during LRO fluid flow recovery.
Angular velocity polar plots for 6 ss, 7 ss, and 8 ss for the three different groups (A) 'Sham’ control embryos colour coded in green, (B) ‘No LR Defects’ group of embryos colour coded in blue and (C) 'LR Defects’ group of embryos colour coded in red. LR defects refer to misplacement of heart or liver encountered at the larval stage after fluid extraction was performed at 5 ss; number of tracks refers to the number of particle trajectories identified for the quantifications and respective angular velocity plots. Colour code on polar plots refers to the median angular velocity for pooled embryos. (D–E) Violin plots showing quantifications of angular velocities found for the tracks analysed (D) anterior-posterior and (E) left and right. Dots contained in the violin plots correspond to median values per embryo. A statistical linear mixed effects regression was applied (see results in Table 1).
-
Figure 2—source data 1
Angular velocity quantifications at 6, 7, and 8 somite stages after fluid extraction at 5 somite stage.
- https://cdn.elifesciences.org/articles/83861/elife-83861-fig2-data1-v1.zip
Figure 2—figure supplement 1
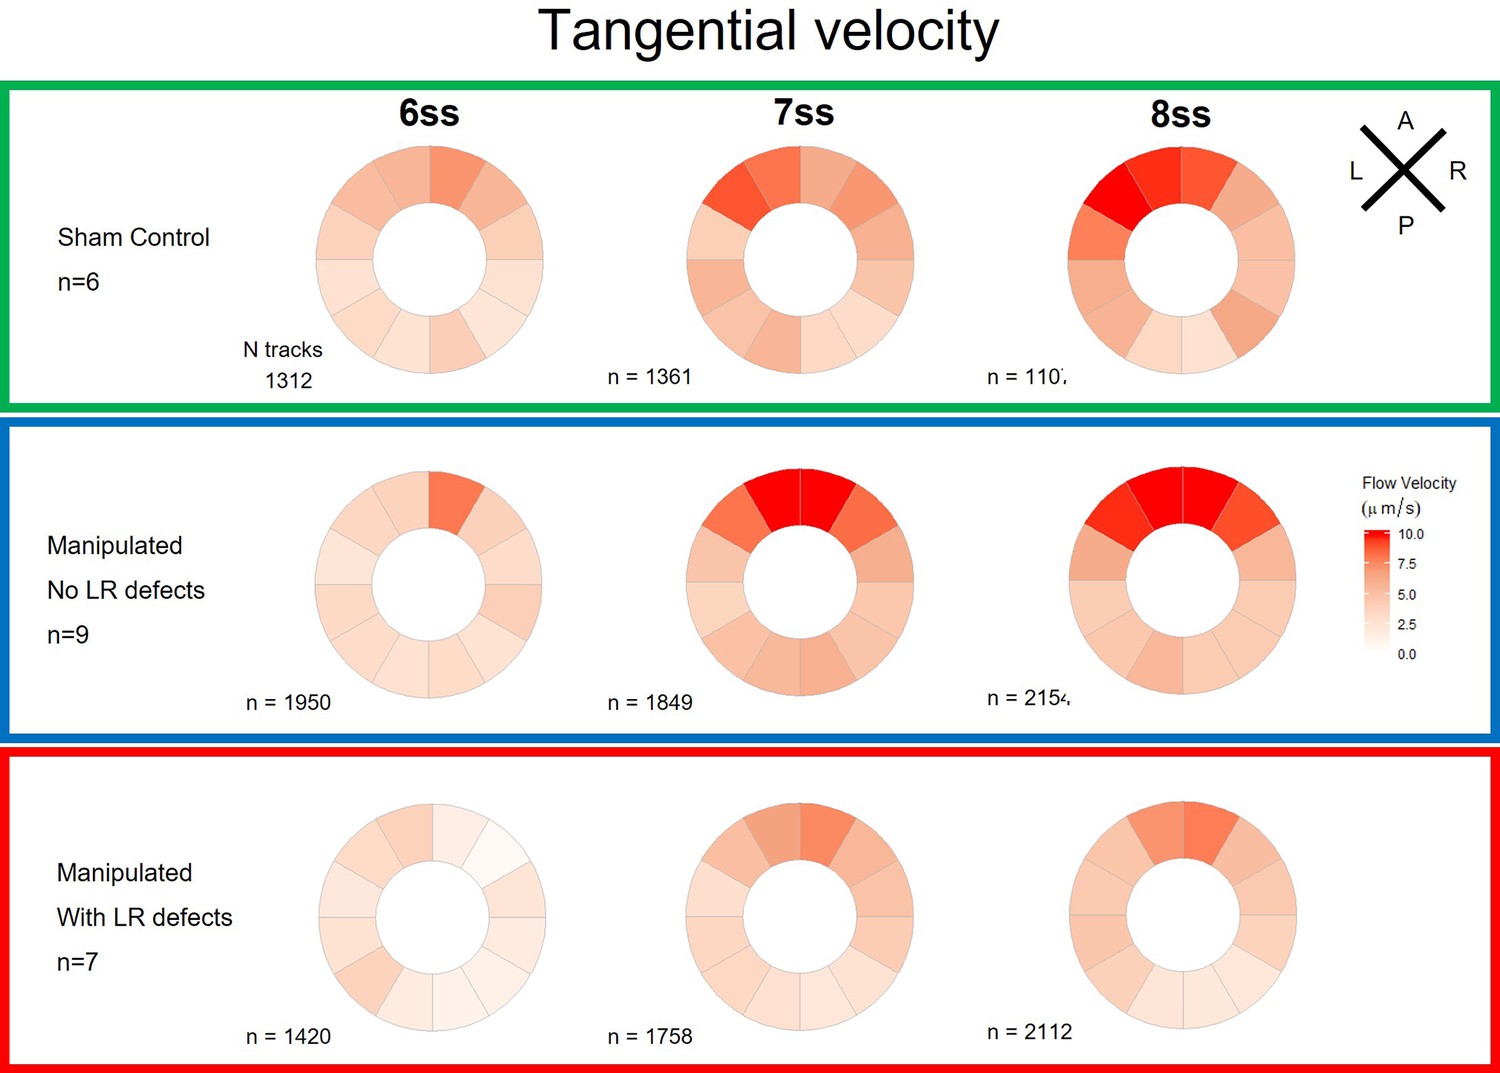
Tangential velocity component of particle movement in the outer LRO luminal space.
Tangential velocity polar plots for 6 ss, 7 ss, and 8 ss for the three different groups (‘Sham’ control, ‘Defects’ and ‘No Defects’ group) – number of tracks refers to the number of particle trajectories identified for the quantifications and respective tangential velocity plots. Colour code on polar plots refers to the median angular velocity for all pooled embryos. LRO: left-right organizer; ss: somite stage.
Figure 2—figure supplement 2
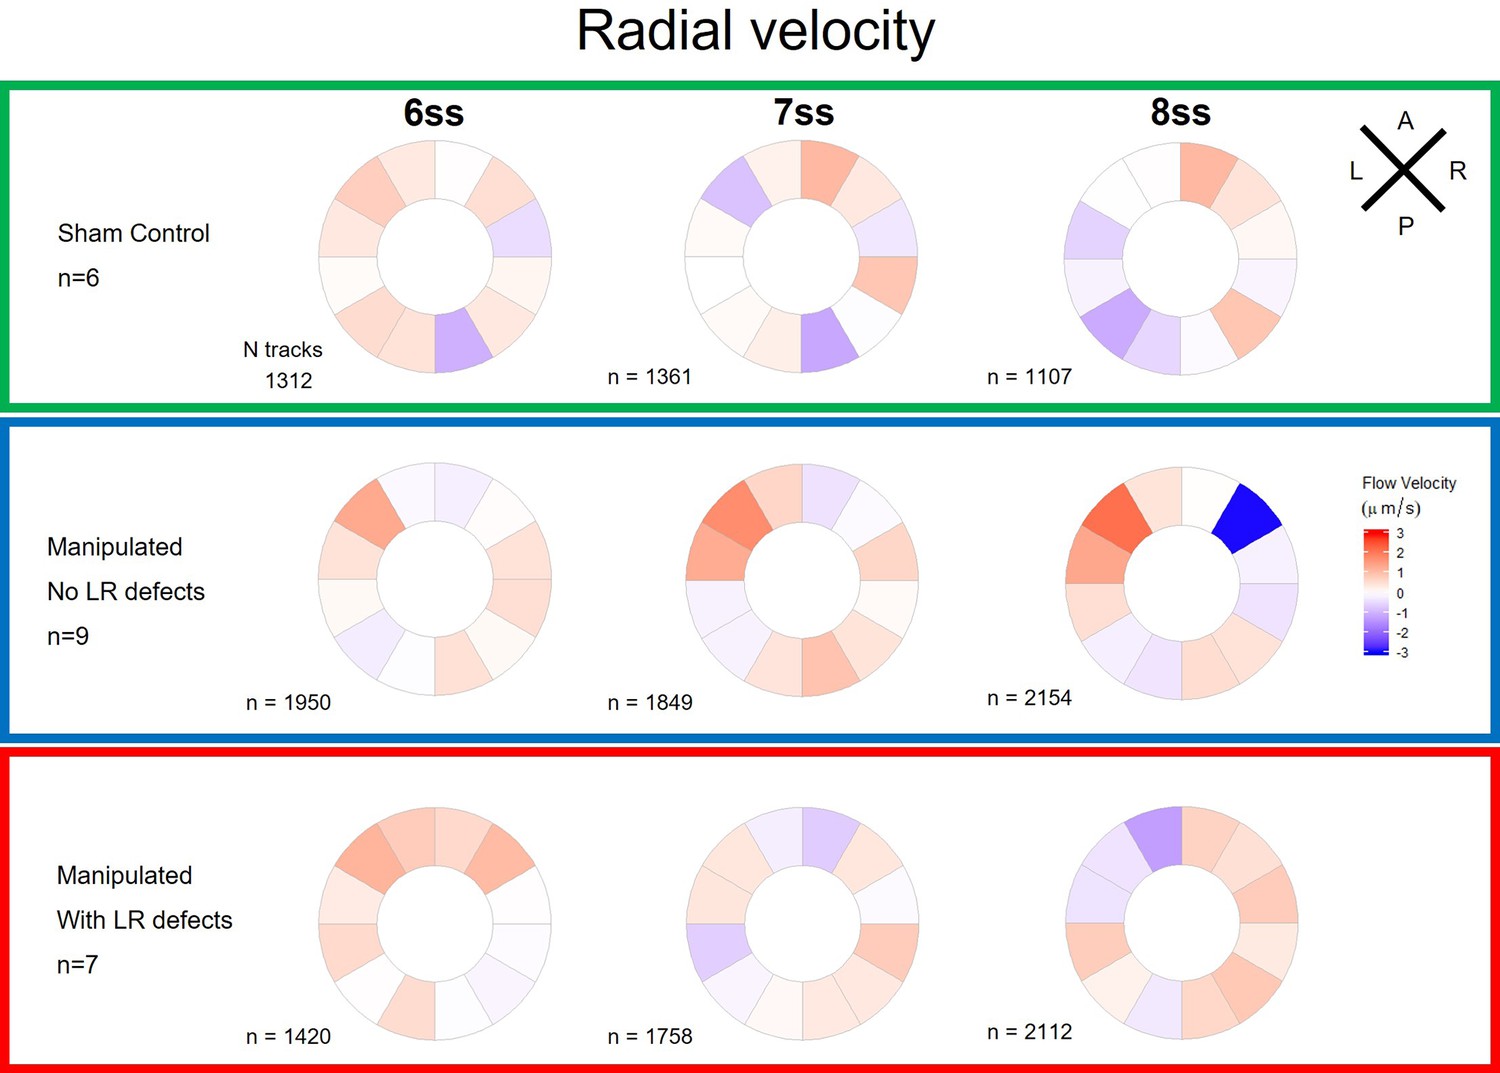
Radial velocity components of particle movement in the outer KV luminal space during fluid recovery.
Radial velocity polar plots from the outermost area of the KV (radius > 0.5 for a maximum of 1) are at 6ss, 7ss. and 8ss are represented for the three different groups (‘Sham’ control, ‘Defects’ and ‘No Defects’ group) – number of tracks refers to the number of particle trajectories identified for the quantifications and respective velocity plots. Colors on circular plots refer to the median velocity component for all pooled embryos. Positive radial components indicate predominant flow movement towards the KV surface. ss: somite stage.
Figure 2—video 1
Example of a manipulated embryo that developed normal zebrafish situs (left heart and left liver).
Sequence of processed bright-field images of a 6 ss KV is shown, oriented with anterior to the top and left to the left of the page, played at 25 fps (related to Figure 2B).
Figure 2—video 2
Example of a manipulated embryo that developed abnormal situs.
Sequence of processed bright-field images of a 6 ss KV is shown, oriented with anterior to the top and left to the left of the page, played at 25 fps (related to Figure 2C).
Figure 3 with 6 supplements
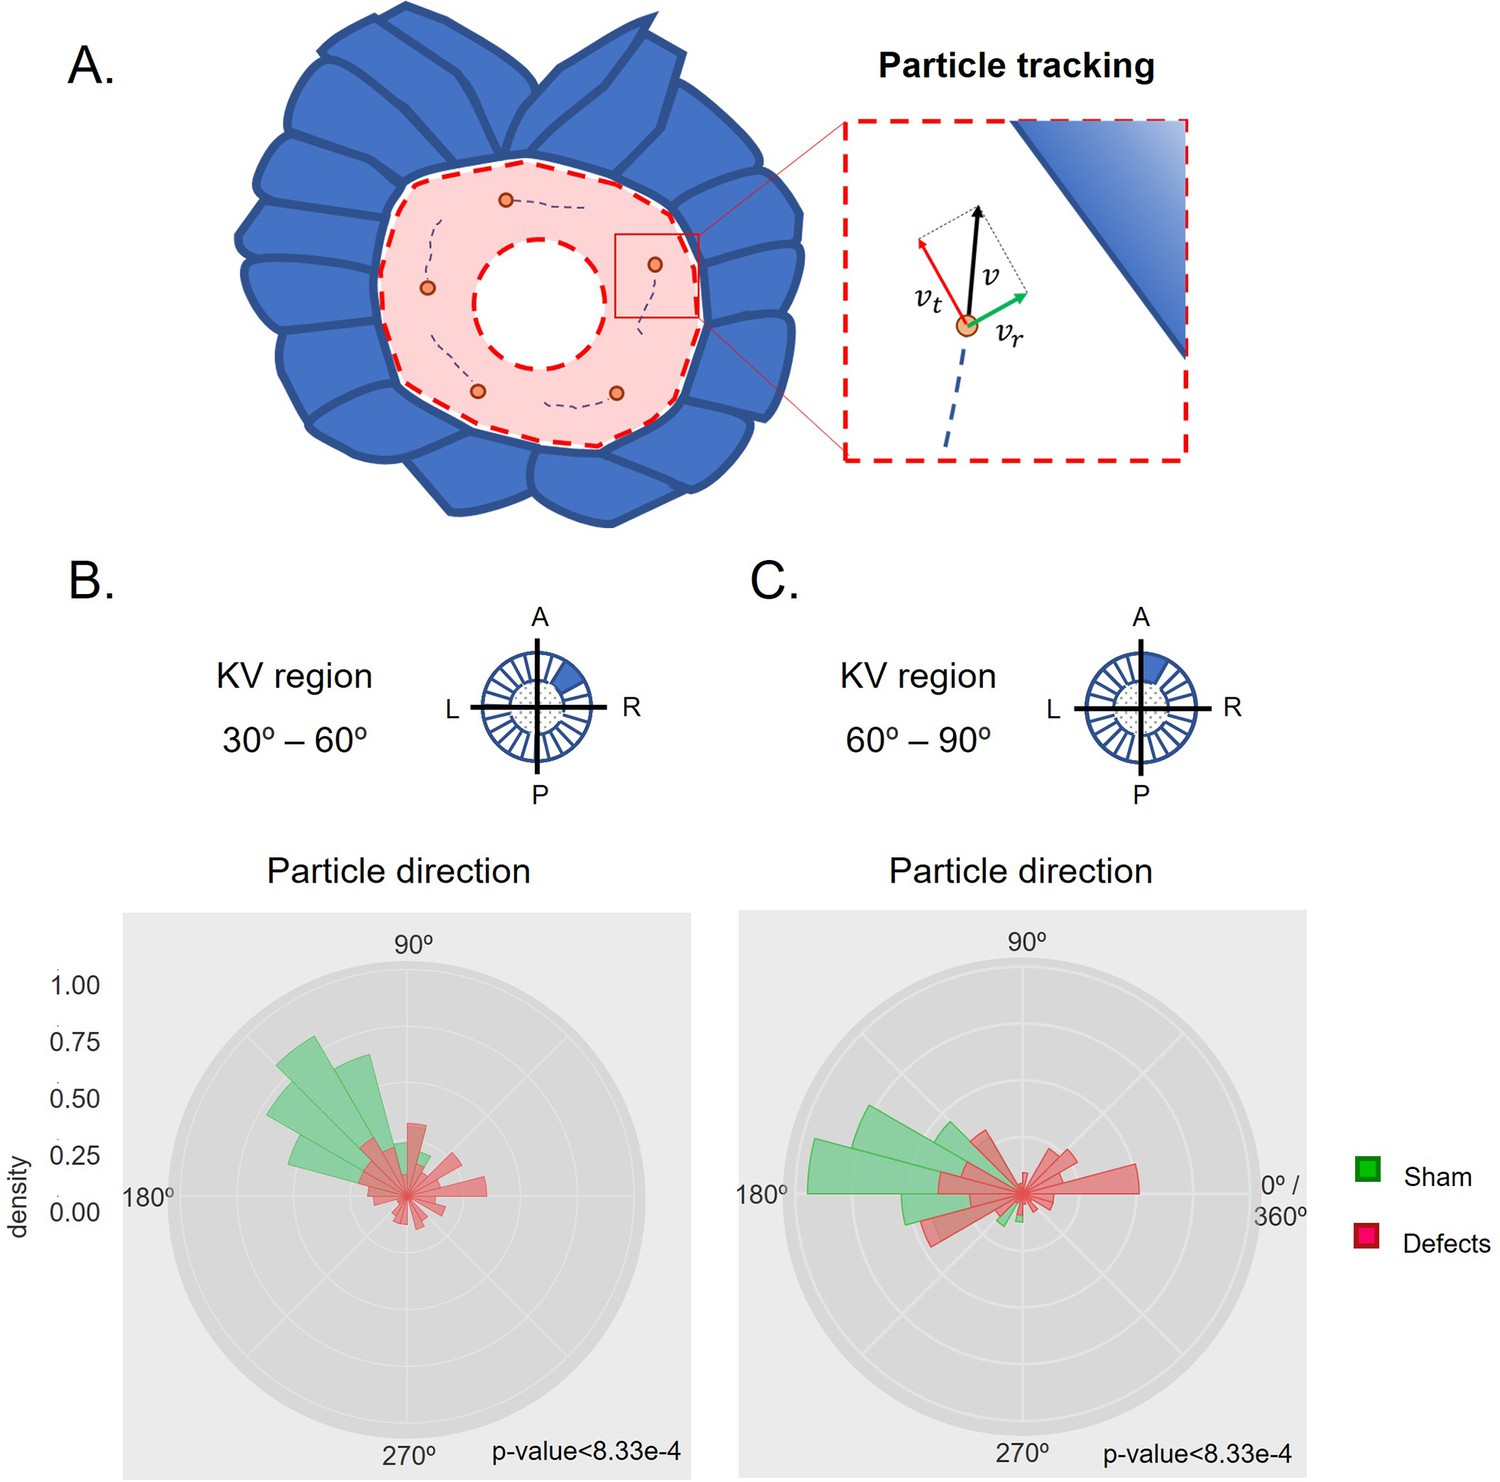
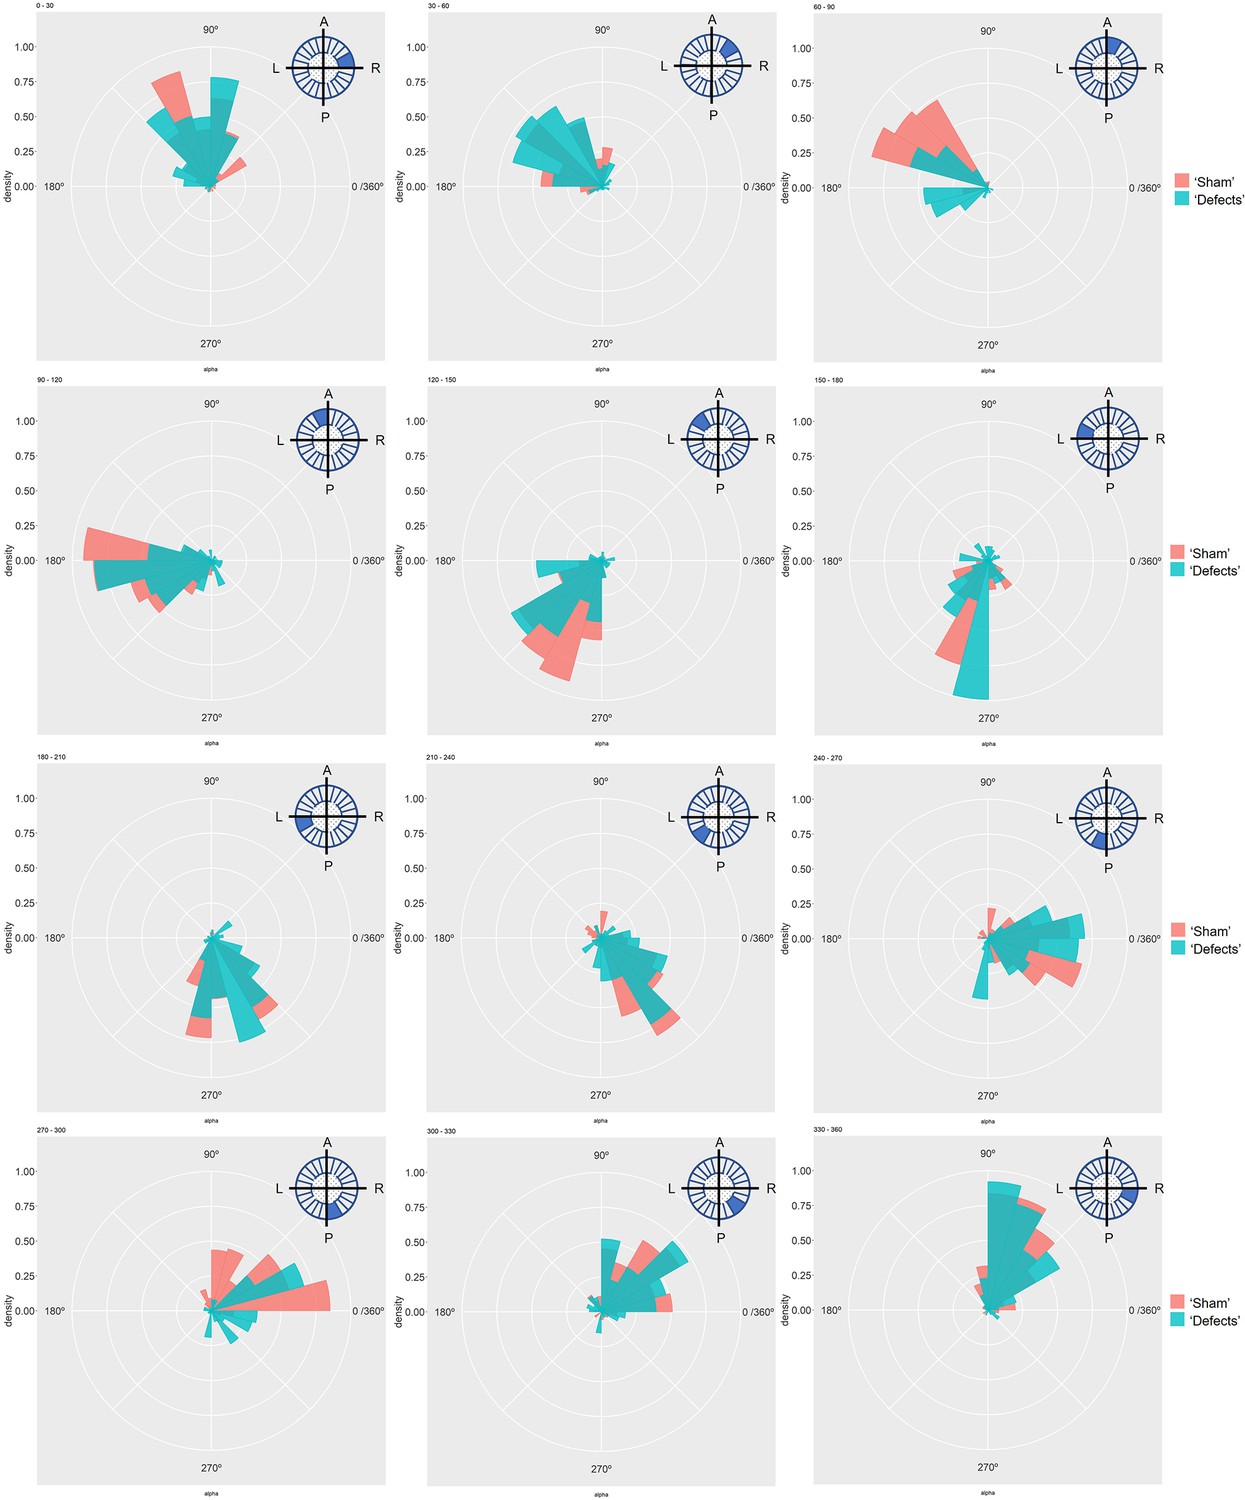
Directionality of vector fields changes in embryos that develop LR defects.
(A) Diagram representing particle directionality. LRO area sections were delimited based on intervals of 30 degrees. Highlighted are regions (B) from 30 to 60 degrees and (C) 60–90 degrees, that showed significant differences in particle movement between the groups ‘Sham’ control embryos and embryos with ‘LR Defects’. Each density plot represents the pooled tracked trajectory of all moving particles at any given point in time. Respective area region analysed is represented on the top right corner of each plot. To assess differences upon fluid manipulation ‘Sham’ and ‘Defect’ groups were plotted for the 6 ss. Kolmogrov-Smirnov test was used for comparing trajectory distribution between the two groups. Full data can be found in Figure 3—figure supplements 1–6.
Figure 3—figure supplement 1
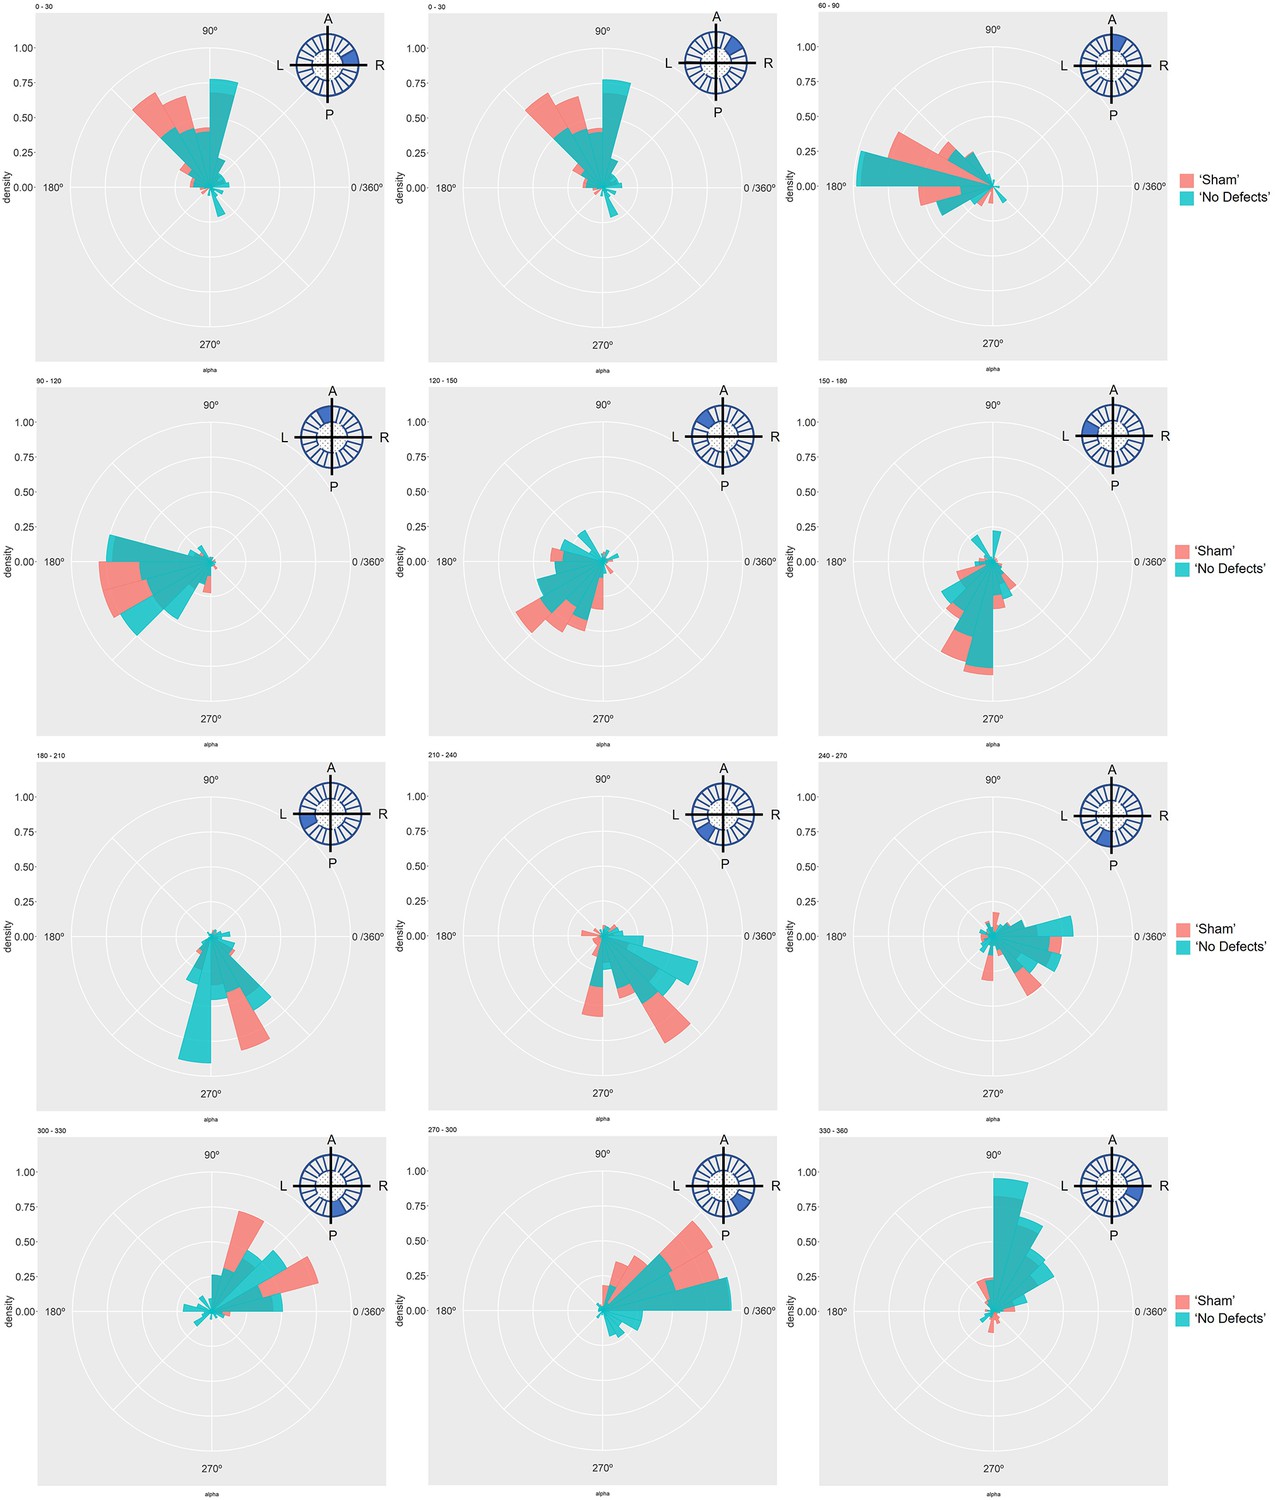
Particle movement direction at different regions of the LRO for ‘Sham’ and ‘No Defects’ groups at 6 ss.
Each plot represents the pooled tracked trajectory of a moving particle at even given point in time. Trajectories were plotted from the outermost area of the LRO (radius > 0.5 from a maximum of 1). Kolmogorov-Smirnov test was used from comparing trajectory distribution between the two groups. ss: somite stage. LRO: left-right organizer.
Figure 3—figure supplement 2
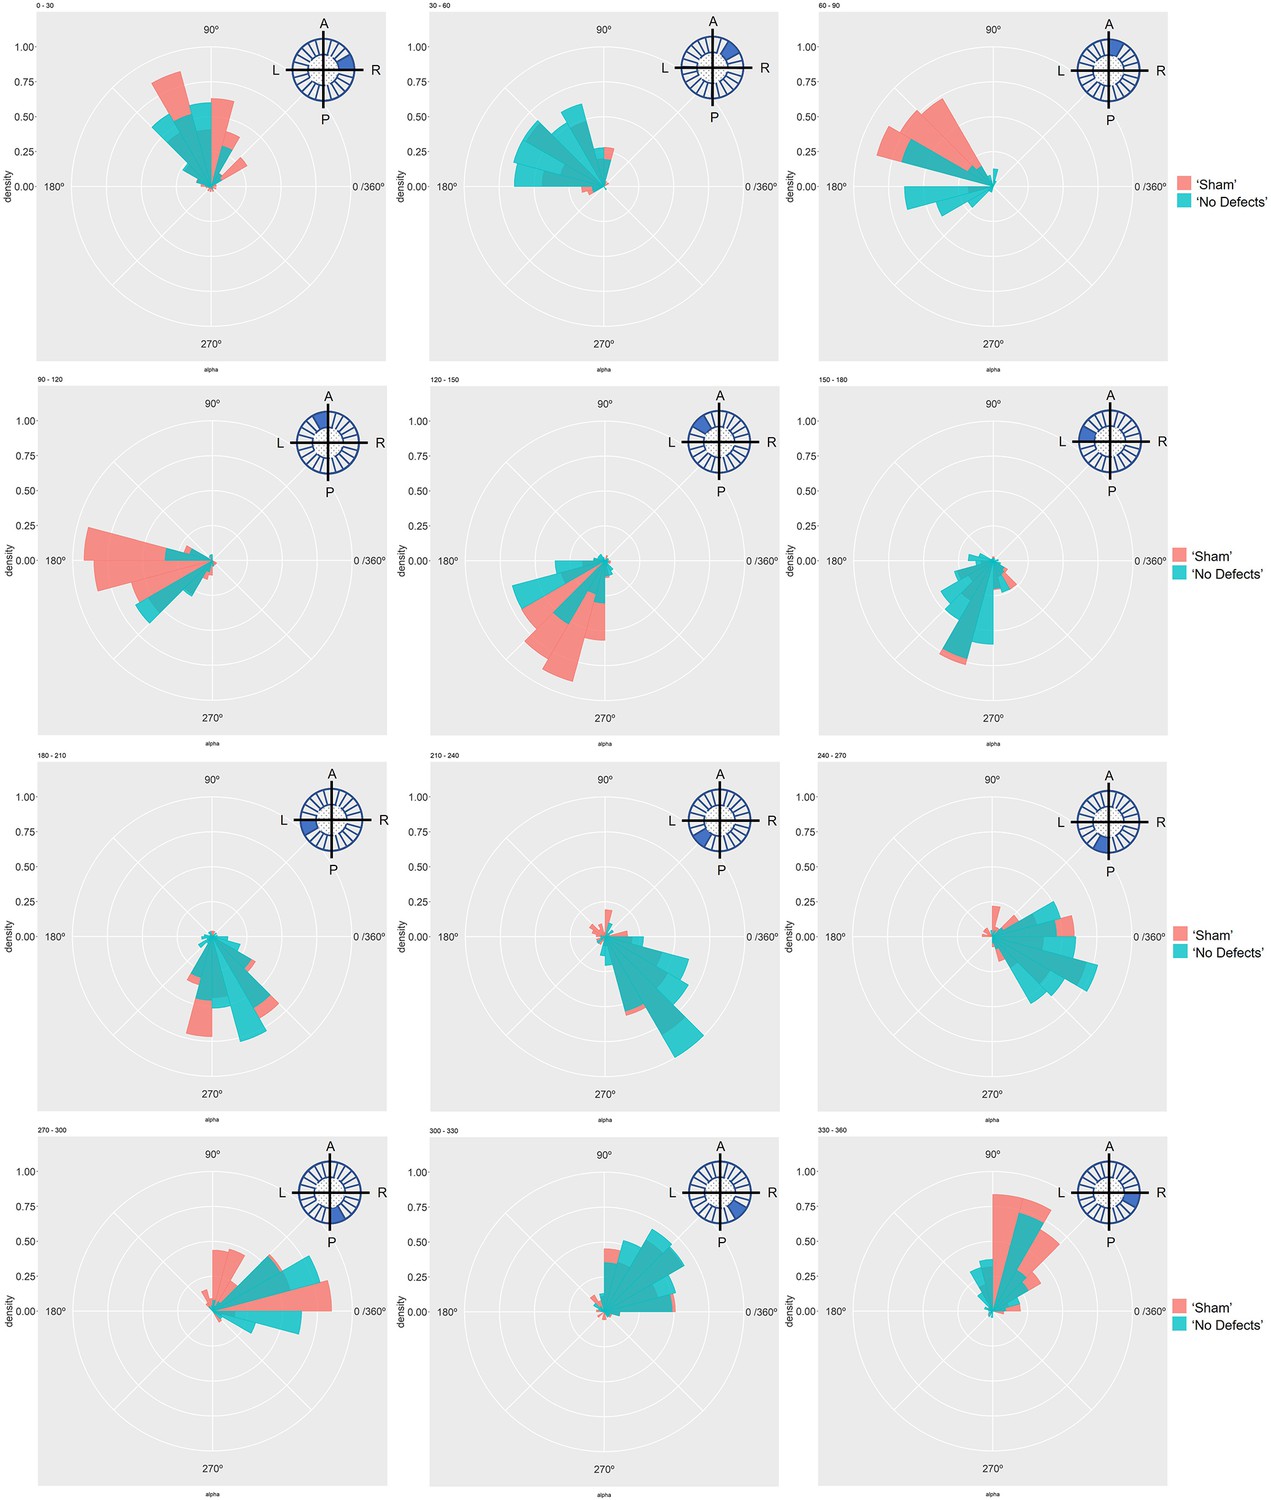
Particle movement direction at different regions of the LRO for ‘Sham’ and ‘No Defects’ groups at 7 ss.
Each plot represents the pooled tracked trajectory of a moving particle at even given point in time. Trajectories were plotted from the outermost area of the KV’s (radius > 0.5 from a maximum of 1). Kolmogrov-Smirnov test was used from comparing trajectory distribution between the two groups. ss: somite stage; LRO: left-right organizer.
Figure 3—figure supplement 3
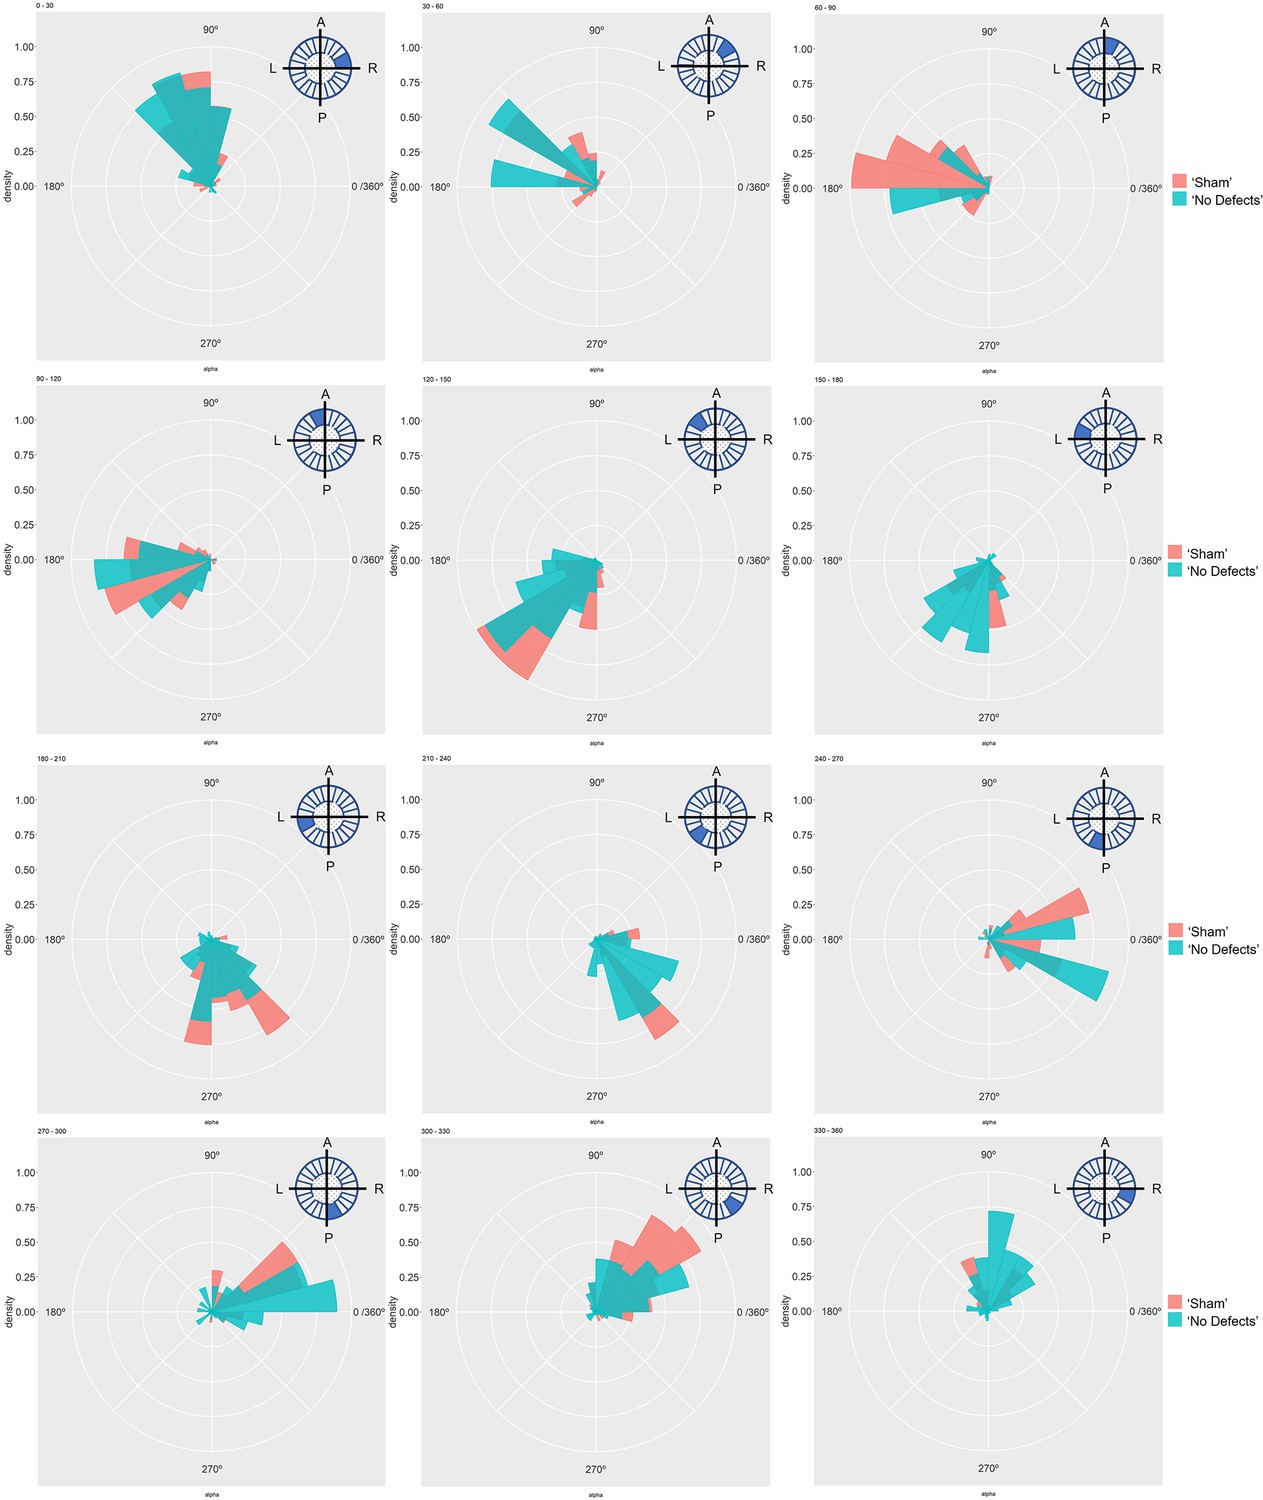
Particle movement direction at different regions of the LRO for ‘Sham’ and ‘No Defects’ groups at 8ss.
Each plot represents the pooled tracked trajectory of a moving particle at even given point in time. Trajectories were plotted from the outermost area of the KV’s (radius > 0.5 from a maximum of 1). Kolmogorov-Smirnov test was used from comparing trajectory distribution between the two groups. ss: somite stage. LRO: left-right organizer.
Figure 3—figure supplement 4
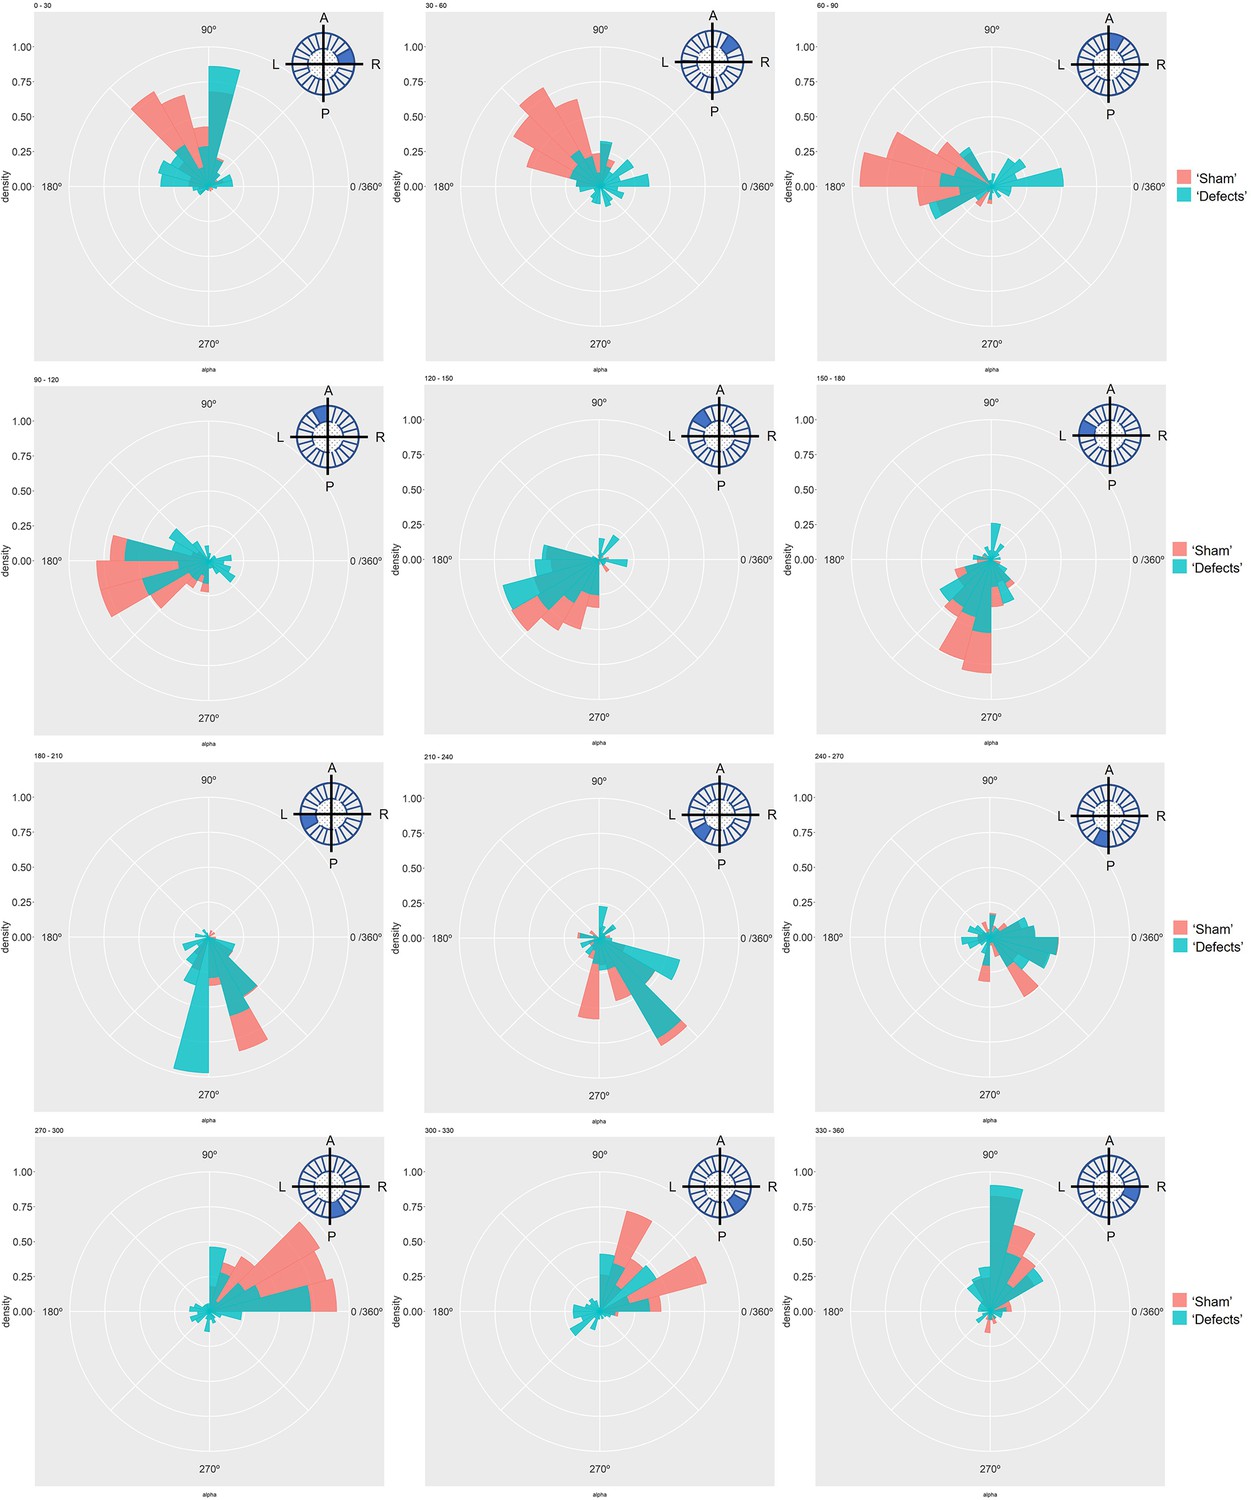
Particle movement direction at different regions of the KV for ‘Sham’ and ‘Defects’ groups at 6 ss.
Each plot represents the pooled tracked trajectory of a moving particle at even given point in time. Trajectories were plotted from the outermost area of the KV’s (radius > 0.5 from a maximum of 1) Kolmogorov-Smirnov test was used from comparing trajectory distribution between the two groups. ss: somite stage. LRO: left-right organizer.
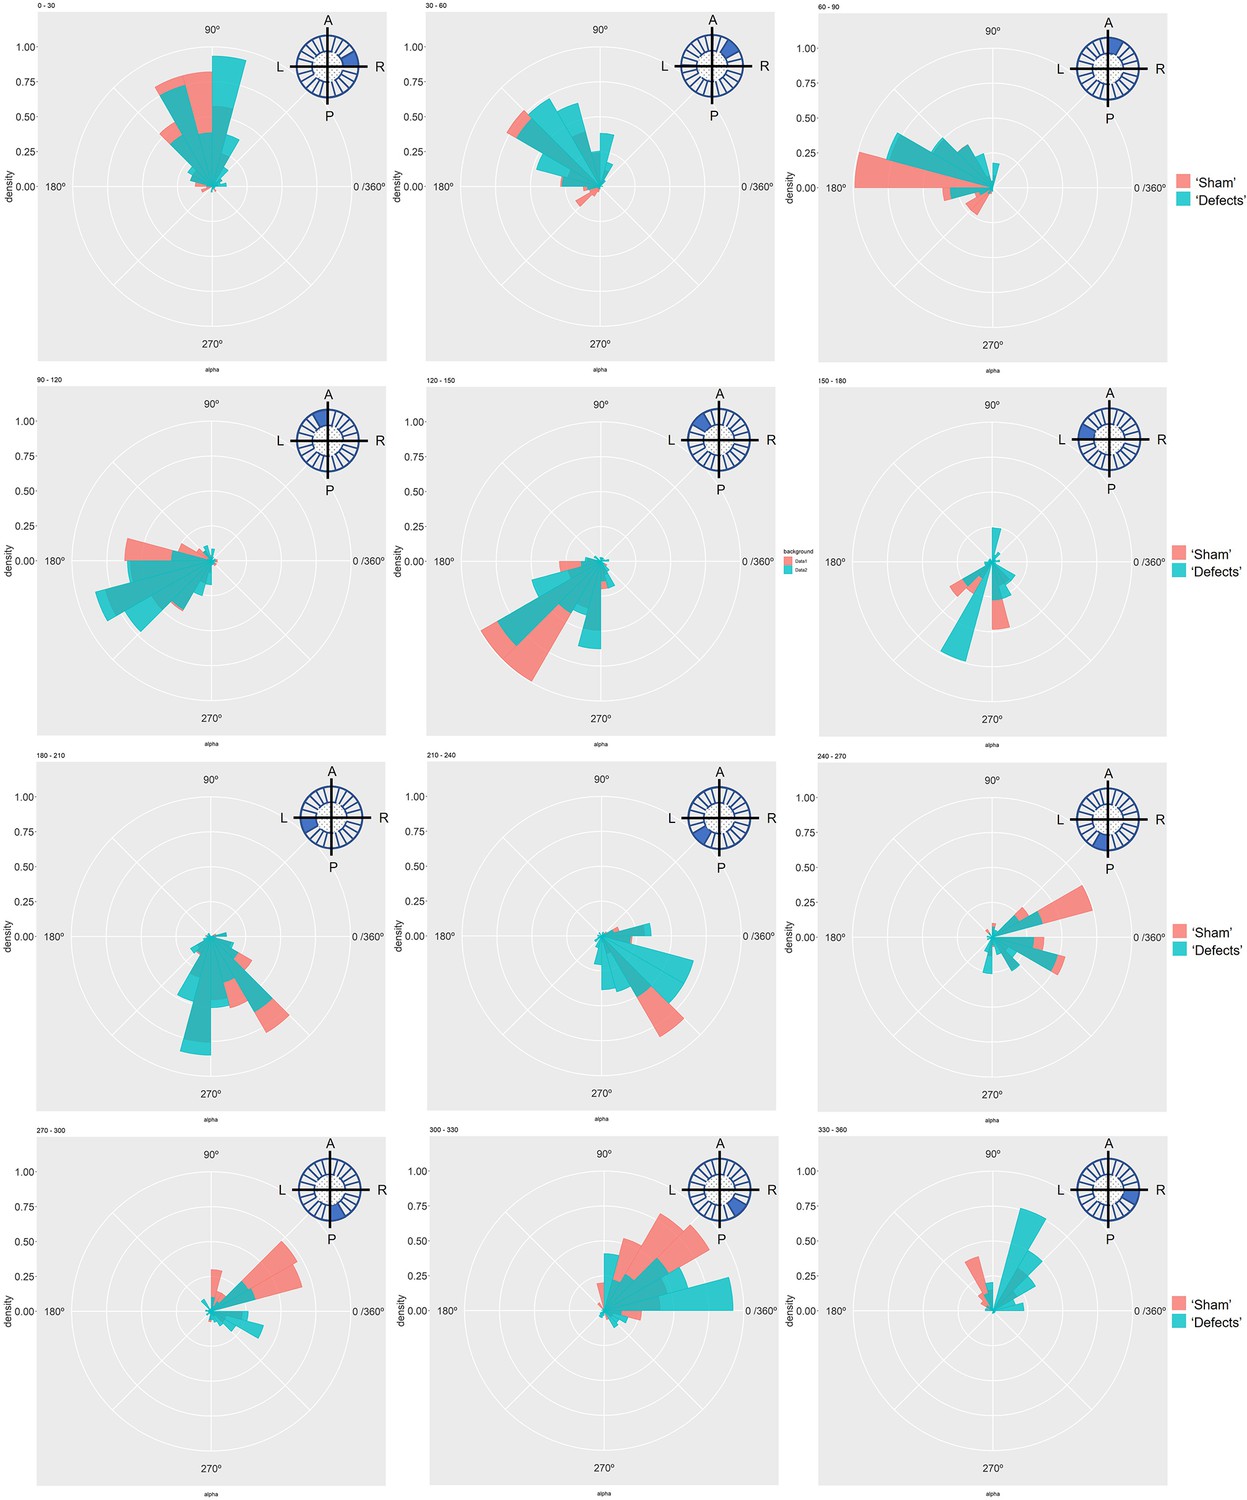
Figure 3—figure supplement 5
Particle movement direction at different regions of the LRO for ‘Sham’ and ‘Defects’ groups at 7 ss.
Each plot represents the pooled tracked trajectory of a moving particle at even given point in time. Trajectories were plotted from the outermost area of the KV’s (radius >0.5 from a maximum of 1). Kolmogorov-Smirnov test was used from comparing trajectory distribution between the two groups. ss: somite stage. LRO: left-right organizer.
Figure 3—figure supplement 6
Particle movement direction at different regions of the LRO for ‘Sham’ and ‘Defects’ groups at 8 ss.
Each plot represents the pooled tracked trajectory of a moving particle at even given point in time. Trajectories were plotted from the outermost area of the KV’s (radius >0.5 from a maximum of 1). Kolmogorov-Smirnov test was used from comparing trajectory distribution between the two groups. ss: somite stage. LRO: left-right organizer.
Figure 4 with 2 supplements
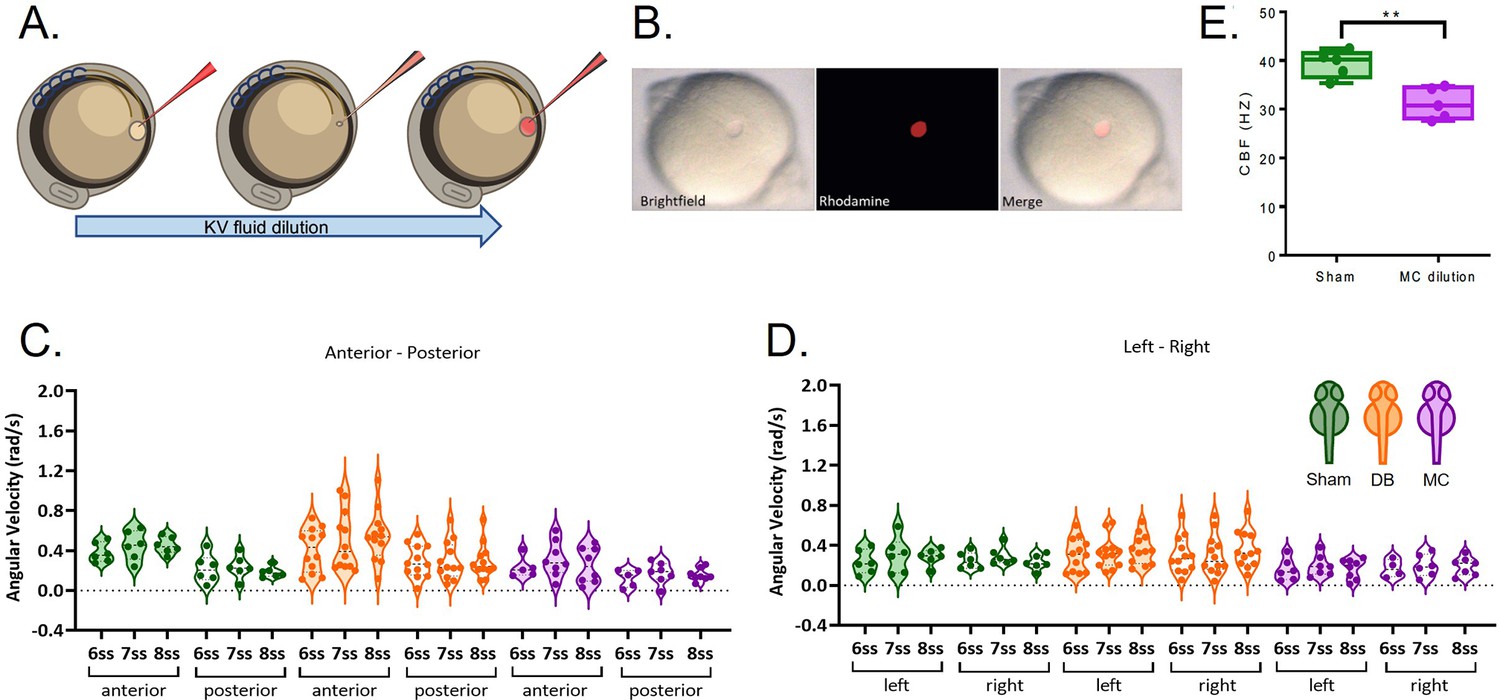
LRO fluid dilution with physiological buffer has no negative impact on angular velocity.
(A) Diagram of the dilution experiment: KV fluid is extracted by a needle previously loaded with fluorescent rhodamine-dextran diluted in Danieau’s buffer (DB) that, after mixing of the two liquids, are re-injected into the LRO. (B) Example of a successfully micro-injected embryo labelled with fluorescent rhodamine-dextran. (C–D) Violin plots showing quantifications of angular velocities found for the tracks analysed (C) anterior-posterior and (D) left and right. Dots contained in the violin plots correspond to median values per embryo. A statistical linear mixed effects regression was applied (see results in Table 2).
-
Figure 4—source data 1
Cilia beat frequency quantification during methylcellulose treatment.
- https://cdn.elifesciences.org/articles/83861/elife-83861-fig4-data1-v1.xlsx
-
Figure 4—source data 2
Angular velocity quantifications at 6, 7 and 8 somite stages after fluid extraction at 5 somite stage and replacement with normal or viscous Danieau buffer.
- https://cdn.elifesciences.org/articles/83861/elife-83861-fig4-data2-v1.zip
Figure 4—figure supplement 1
LRO flow dynamics is only affected when fluid dilution alters fluid viscosity (A) Angular velocity polar plots for 6 ss, 7 ss and 8 ss for the three different groups (A) 'Sham’ control, (B) 'DB dilution’ group and (C) 'MC dilution’ group.
Number of tracks refers to the number of particle trajectories identified for the quantifications and respective angular velocity plots. Colour code on polar plots refers to the median angular velocity for all pooled embryos. LRO: left-right organizer. DB: Danieau buffer. MC: methylcellulose.
Figure 4—video 1
Close-up of fluid dilution technique employed in a 5 ss embryo.
Sequence of processed bright-field images acquired at ×10 magnification, showing the extracted liquid from the KV lumen being mixed with a previously loaded micropipette with Danieau’s buffer (related to Figure 4A–B).
Figure 5
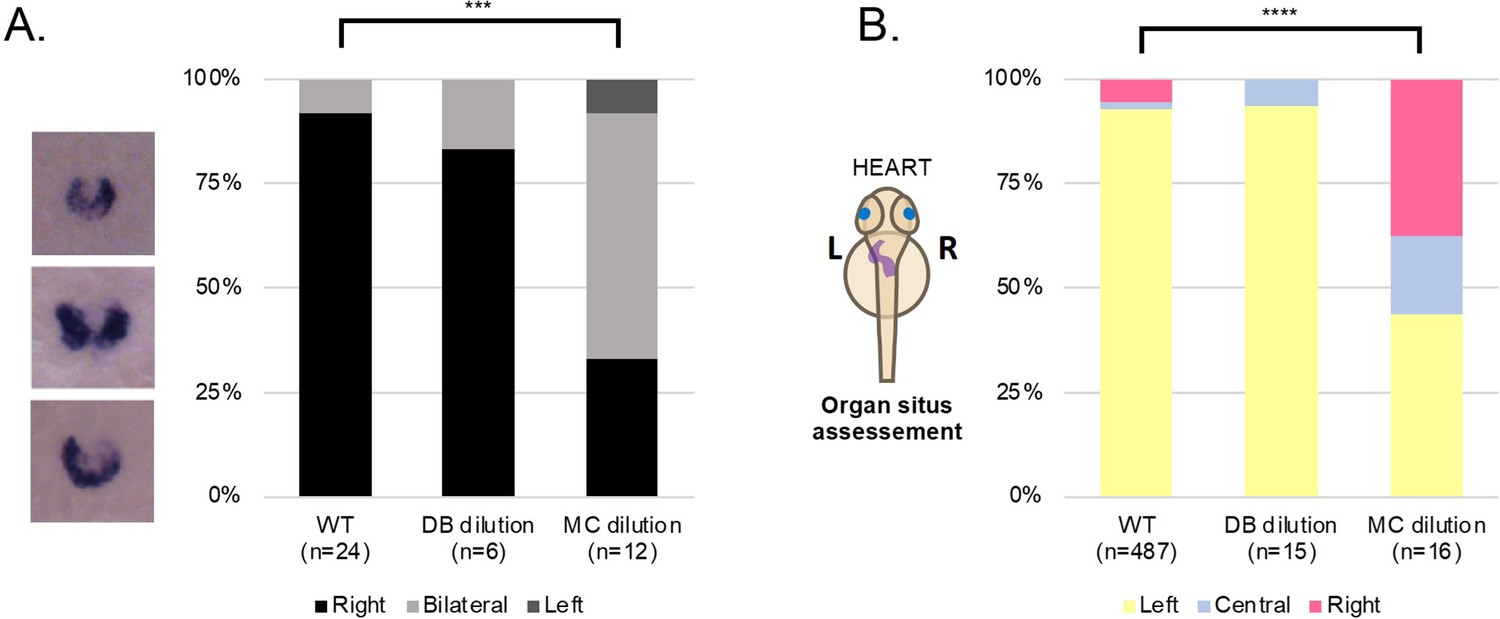
LRO fluid content does not affect left-right development.
(A) dand5 mRNA expression pattern in wild-type control embryos, embryos with LRO fluid diluted with DB and embryos with LRO fluid diluted with MC. Embryos were manipulated at 5 ss and fixed at 8 ss for dand5 whole mount embryo in situ hybridization. (B) Heart position (left, central or right sided) was scored at 30 hpf in wild-type control embryos, embryos with LRO fluid diluted with DB and embryos with LRO fluid diluted with MC. ss: somite stage; DB Danieau buffer; MC methylcellulose; hpf: hours post fertilization.
-
Figure 5—source data 1
Quantification of dand5 expression pattern and heart situs.
- https://cdn.elifesciences.org/articles/83861/elife-83861-fig5-data1-v1.xlsx
Figure 6 with 2 supplements
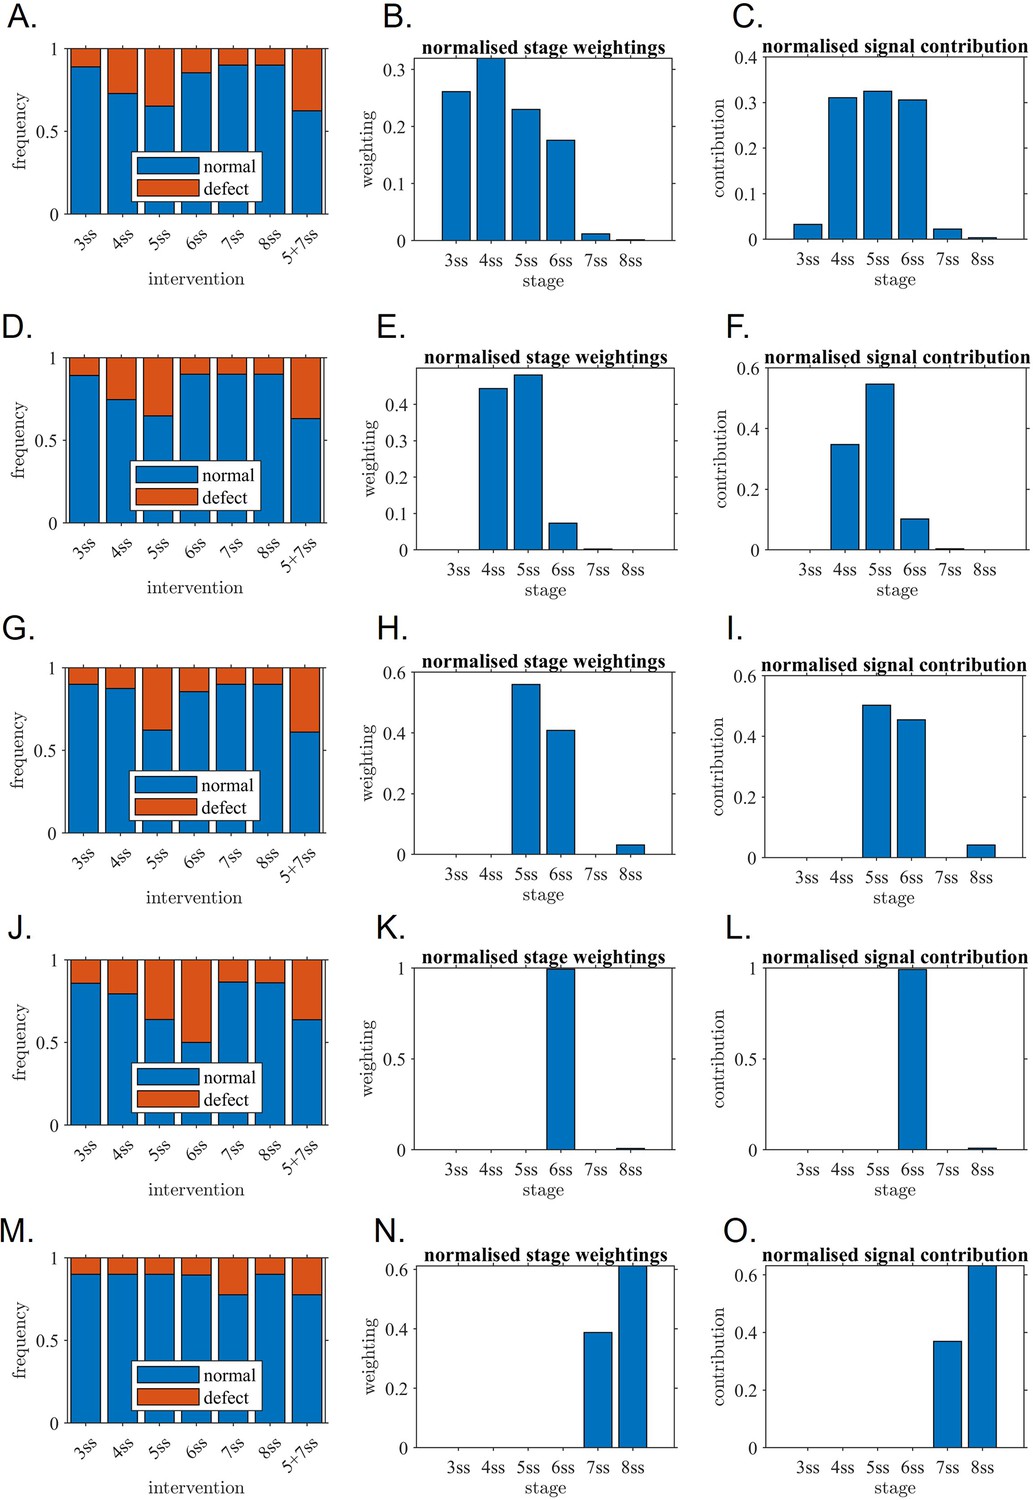
Mathematical modelling confirms the critical role of one-hour interval confirming the experimental observations.
Outcome of model fitting to experiment, associated stage weightings (sensitivity of KV to its own flow) and signal contribution (sensitivity multiplied by flow strength) for (A–C) Unrestricted model, (D–F) model with 3 ss contribution omitted, (G–I) model with 3–4 ss contributions omitted, (J–L) model with 3–5 ss contributions omitted, (M–O) model with 3–6 ss contributions omitted. The restricted models are included to assess alternative explanations for the data in which later stages still make a significant contribution. (A, D, G, J, M) fitted model outputs of rates of normal and abnormal situs for direct comparison with experiment; (B, E, H, K, N) fitted stage weightings (sensitivity of KV to its own flow) where tall bars mean ‘relatively more sensitive’ in arbitrary units, (C, F, I, L, O) signal contribution (sensitivity multiplied by flow strength) where tall bars mean ‘relatively more contribution’. The fitted restricted models for (G–I, J–L and M–O) do not fit the experiment well which confirms that they are unlikely to represent what is occurring in the KV. The fitted models for (A–C, D–F and G–I) have a much better fit and confirm that 5ss makes a major contribution, as do 4ss and/or 6ss. ss: somite stage.
Figure 6—figure supplement 1
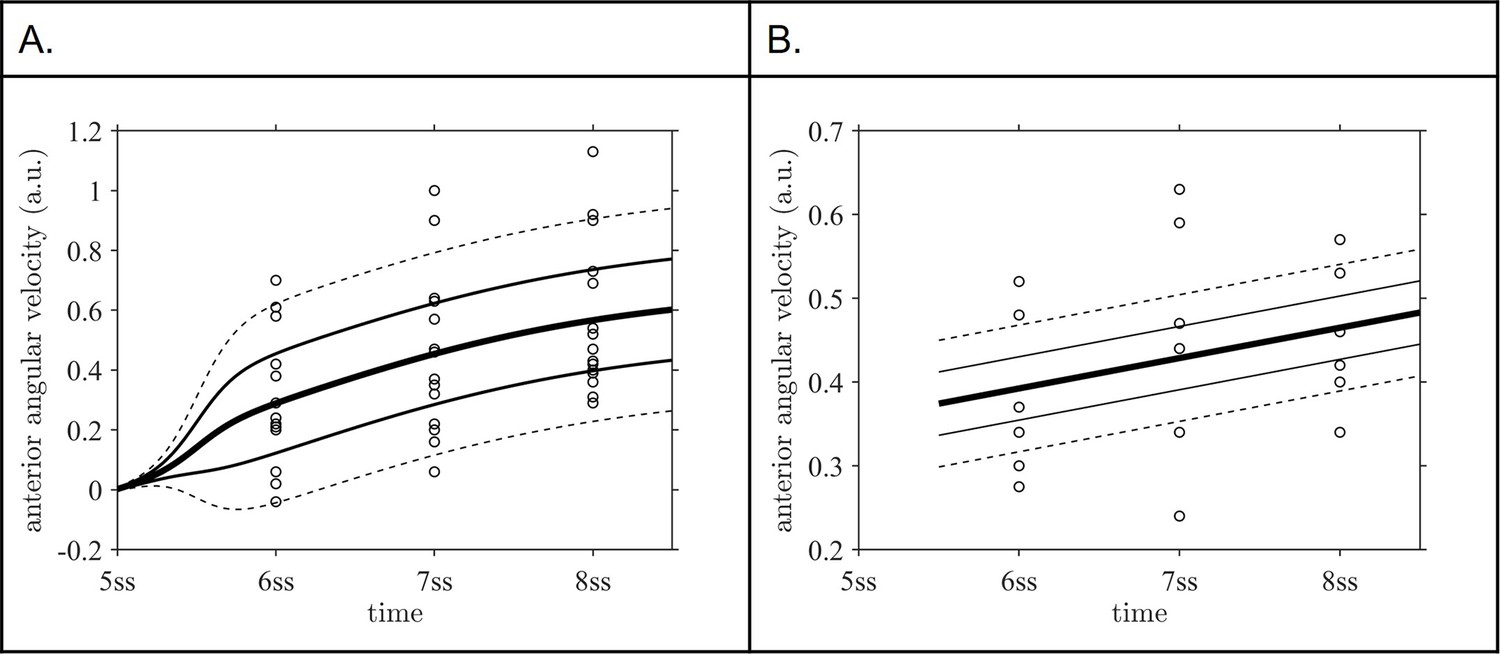
Mixed effects model fits for the distributions of anterior angular velocity to (A) data for sham intervention, (B) data for suction intervention at 5 ss.
Central line is fixed effect, outer pairs of lines are +/-1 and+/-2 standard deviations in normally distribution random effects. ss: somite stage.
Figure 6—figure supplement 2
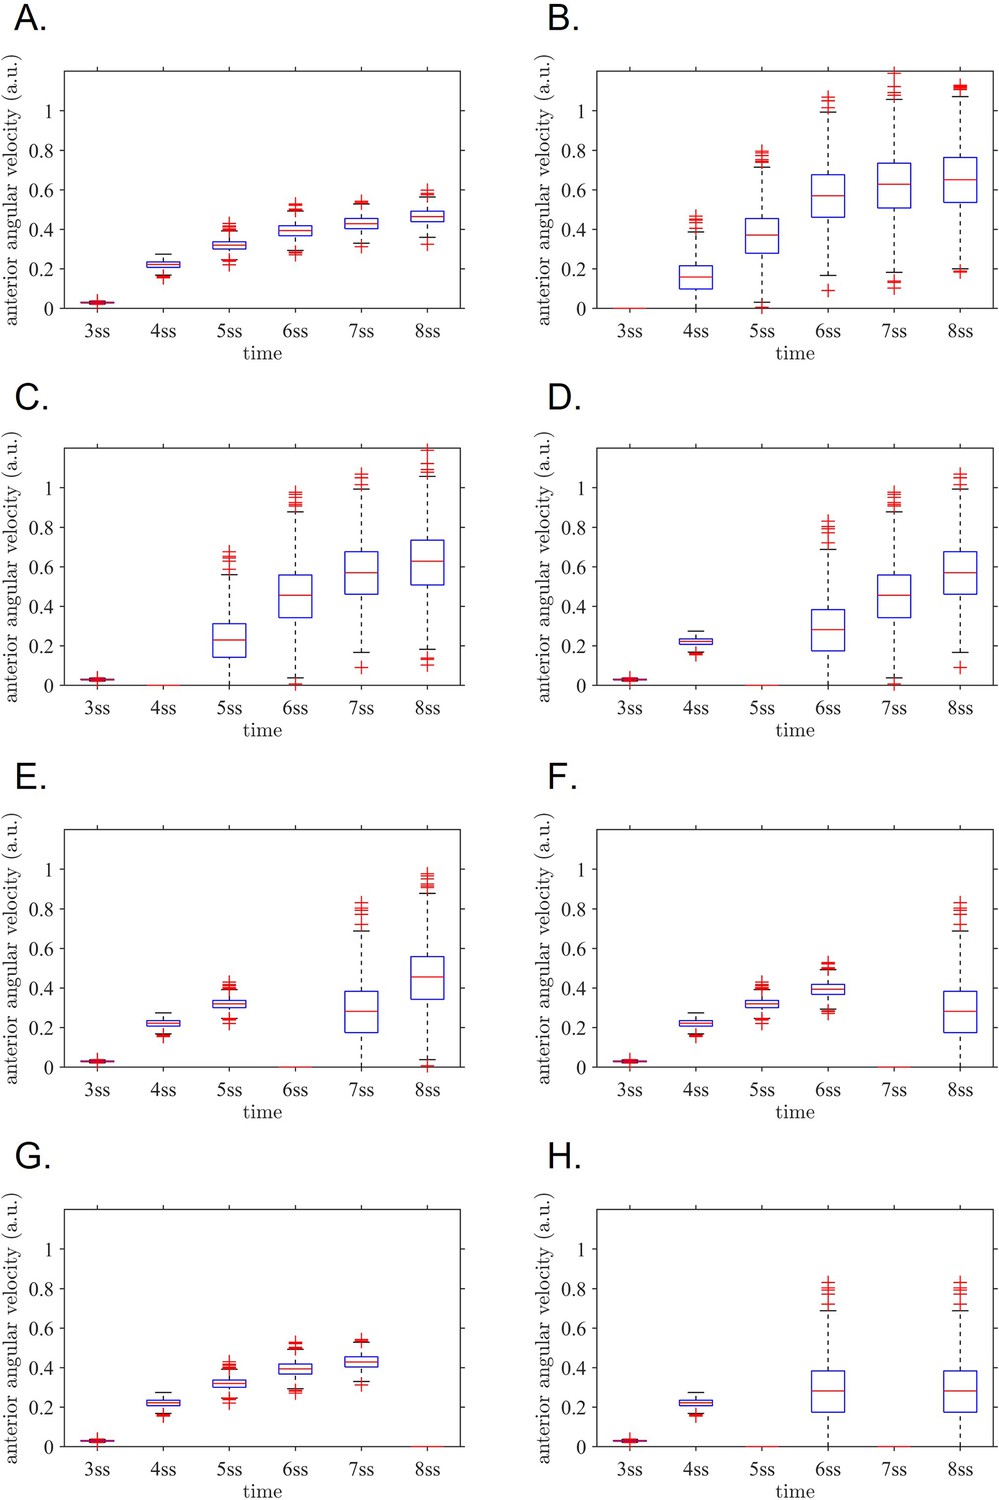
Anterior angular velocity distributions for all modelled experimental interventions.
(A) sham, (B) 3 ss intervention, (C) 4 ss intervention, (D) 5 ss intervention, (E) 6 ss intervention, (F) 7 ss intervention, (G) 8 ss intervention, (H) both 5 ss and 7 ss intervention. These distributions are combined with stage weightings to fit the normal/defect percentages for each experiment series. ss: somite stage.
Figure 7
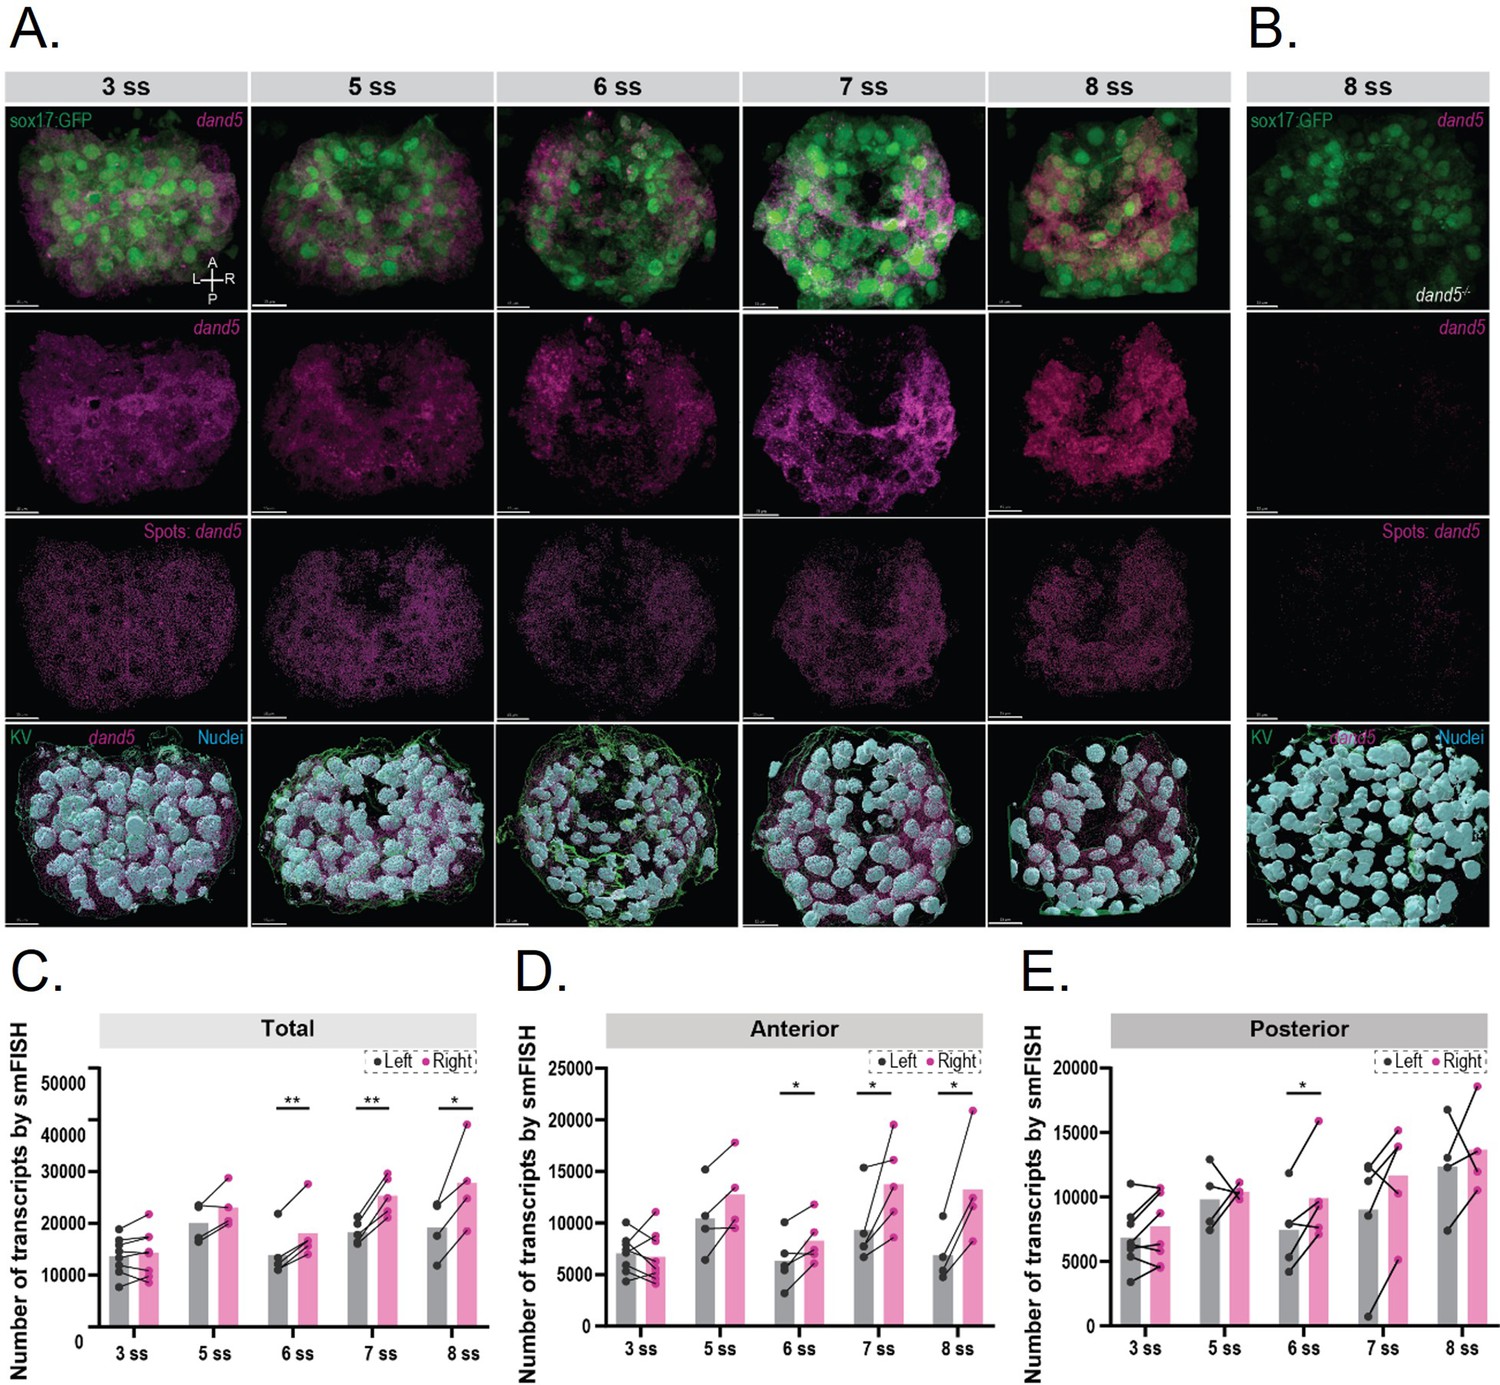
3D smFISH and spatial analysis of dand5 mRNA transcripts in the KV.
(A) Time-course 3D analysis of dand5 mRNA transcripts by smFISH in Tg(sox17:GFP) embryos at 3, 5, 6, 7, and 8 somite stage (ss). 3D representations of dand5 mRNA (magenta), nuclei (cyan), and sox17:GFP (green) are shown. The KV surface (green) was used to mask both the dand5-Atto 565 and DAPI channels to remove nuclear staining. Spot detection was used to detect the dand5 cytoplasmic transcripts. Axes are indicated. Scale bar = 15 µm (B) The spot detection algorithm was validated in 8 ss dand5-/- embryos raised on the Tg(sox17:GFP) background. (C–E) Quantification of differences in the number of dand5 mRNA transcripts detected on the left and right sides of the KV; total number (C), at the anterior (D), and posterior (E) sides of the KV. Gray and magenta represent the left and right sides, respectively. Paired t-tests were used. The bars represent the mean values, and the dots represent individual embryos. Asterisks denote statistical significance: * corresponds to a p-value <0.05, and ** indicates a p-value <0.005.
-
Figure 7—source data 1
Quantification of cytoplasmatic dand5 expression by smFISH in the LRO left, right, anterior and posterior halves.
- https://cdn.elifesciences.org/articles/83861/elife-83861-fig7-data1-v1.xlsx
Tables
Table 1
Linear mixed-effects regression: Results for fluid extraction experiment.
Fixed effects coefficient estimates are given. Number of observations: 15775; embryos n=23; Fixed effects coefficients: 12; Random effects coefficients 69; Covariance parameters: 7. Regression formula: AAV ~1 + Group*LR +Group*PA +Group*Time + (1+Group | EmbryoID). Results relate to Figure 2D–E; *** indicates p<0.001; ** indicates p<0.01; * indicates p<0.05.
| Name | Estimate | Lower CI | Upper CI | p-value |
|---|---|---|---|---|
| (Regression line intercept) | 0.2515 | 0.20762 | 0.29544 | 3.8408E-29 *** |
| No defects group | –0.032775 | –0.12321 | 0.05766 | 0.47748 |
| Defects group | –0.12728 | –0.18434 | –0.070215 | 1.2396E-05 *** |
| Left-right axis | 0.0042934 | –0.0092686 | 0.019363 | 0.57655 |
| Posterior-anterior axis | 0.16131 | 0.14636 | 0.17626 | 6.285E-98 *** |
| Somite stage | 0.02145 | 0.012091 | 0.030809 | 7.0847E-06 *** |
| Interaction of no defects group and left-right axis | 0.026653 | 0.007577 | 0.04573 | 0.006176 ** |
| Interaction of defects group and left-right axis | –0.0026553 | –0.022753 | 0.017443 | 0.79567 |
| Interaction of no defects group and posterior-anterior axis | 0.033645 | 0.012118 | 0.055171 | 0.0021912 ** |
| Interaction of defects group and posterior-anterior axis | –0.041406 | –0.06219 | –0.020622 | 9.461E-05 *** |
| Interaction of no defects group and somite stage | 0.026635 | 0.014317 | 0.038953 | 2.2637E-05 *** |
| Interaction of defects group and somite stage | 0.013497 | 0.00056621 | 0.026427 | 0.040778 * |
Table 2
Linear mixed-effects regression: Results for Danieau’s buffer (DB) and methylcellulose (MC) dilution experiments.
Fixed effects coefficient estimates are given. Number of observations: 16622; n=30 embryos; Fixed effects coefficients: 12; Random effects coefficients 90; Covariance parameters: 7. Results relate to Figure 4C–D. Regression formula: AAV ~1 + Intervention*LR +Intervention*PA +Intervention*Time + (1+Intervention | EmbryoID). *** indicates p<0.001; ** indicates p<0.01; * indicates p<0.05.
| Name | Estimate | Lower CI | Upper CI | p-value |
|---|---|---|---|---|
| (Regression line intercept) | 0.25148 | 0.20891 | 0.29405 | 6.8705E-31 *** |
| DB injection | 0.070724 | –0.030824 | 0.17227 | 0.17223 |
| MC injection | –0.12344 | –0.19256 | –0.05431 | 0.00046626 *** |
| Left-right axis | 0.0042626 | –0.008177 | 0.016702 | 0.50182 |
| Posterior-anterior axis | 0.16135 | 0.14901 | 0.17369 | 4.4137E-142 *** |
| Somite stage | 0.021413 | 0.013687 | 0.029139 | 5.6349E-08 *** |
| Interaction: DB injection and left-right axis | –0.012356 | –0.027636 | 0.002925 | 0.11301 |
| Interaction: MC injection and left-right axis | 0.026366 | 0.008478 | 0.044254 | 0.0038681 *** |
| Interaction: DB injection and posterior-anterior axis | –0.02139 | –0.036997 | –0.00578 | 0.0072282 *** |
| Interaction: MC injection and posterior-anterior axis | –0.073208 | –0.092273 | –0.05414 | 5.4857E-14 *** |
| Interaction: DB injection and time | –0.012635 | –0.022248 | –0.00302 | 0.0099937 *** |
| Interaction: MC injection and time | –0.0004407 | –0.012174 | 0.011293 | 0.94131 |
Additional files
-
Supplementary file 1
Motile and immotile cilia distribution at 5 somite stage embryos.
Analyses of cilia motility per LRO anterior and posterior halves.
- https://cdn.elifesciences.org/articles/83861/elife-83861-supp1-v1.docx
-
MDAR checklist
- https://cdn.elifesciences.org/articles/83861/elife-83861-mdarchecklist1-v1.docx
Download links
A two-part list of links to download the article, or parts of the article, in various formats.
Downloads (link to download the article as PDF)
Open citations (links to open the citations from this article in various online reference manager services)
Cite this article (links to download the citations from this article in formats compatible with various reference manager tools)
Fluid extraction from the left-right organizer uncovers mechanical properties needed for symmetry breaking
eLife 12:e83861.
https://doi.org/10.7554/eLife.83861


