Modulation of brain signal variability in visual cortex reflects aging, GABA, and behavior
- Department of Psychology, University of Michigan, United States
- Max Planck UCL Centre for Computational Psychiatry and Ageing Research, Germany
- Center for Lifespan Psychology, Max Planck Institute for Human Development, Germany
Figures
Figure 1
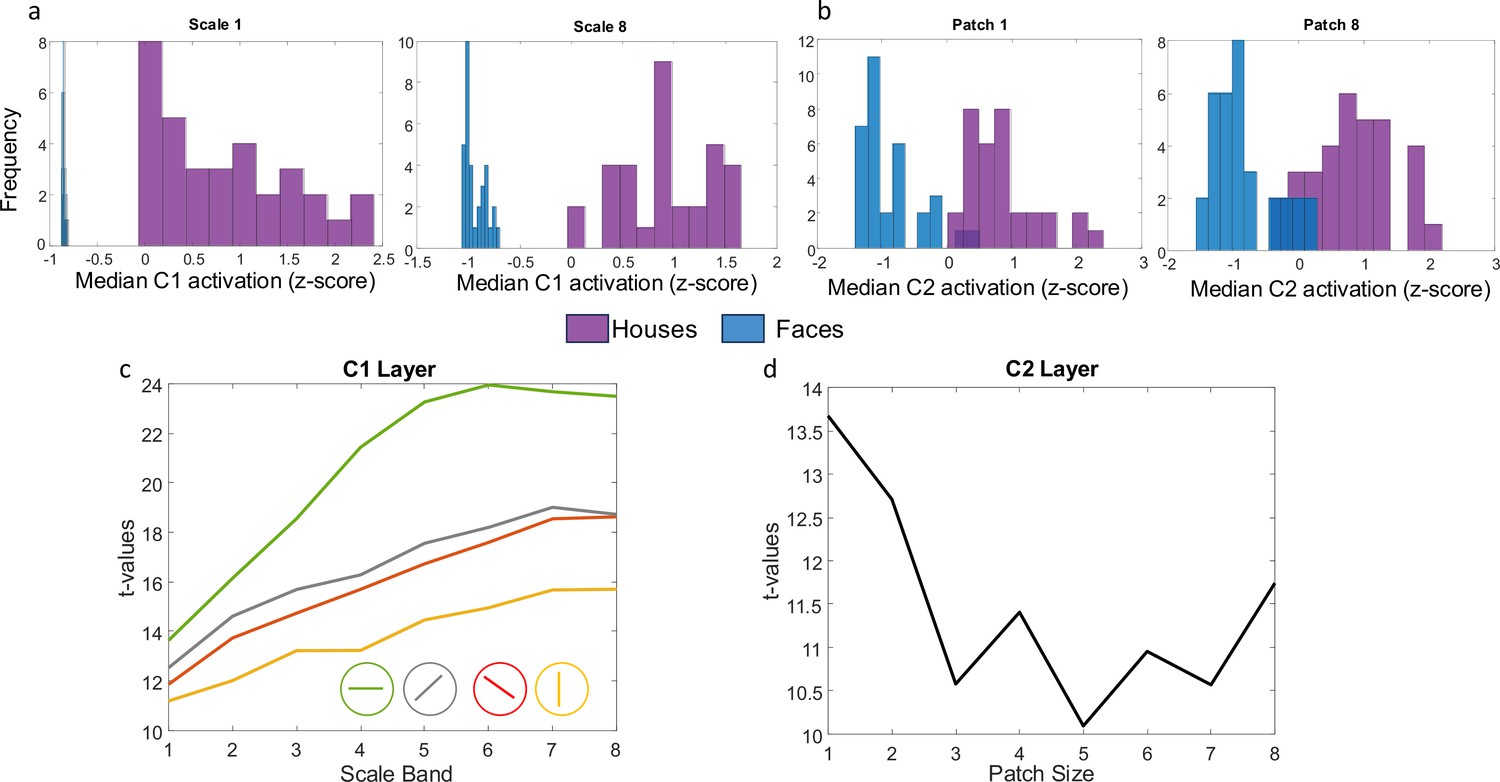
Example C1 and C2 activation distributions to house and face stimuli.
(A) Z-scored median activation at C1 for all images in the two stimulus categories (faces in blue, houses in purple) for one orientation and two different scales. (B) Z-scored median activation at C2 for all images in both stimulus categories for two different patch sizes. (C) t-values comparing house vs. face median activation in layer C1 across four different orientations and 8 scale bands (from smallest to largest receptive field). (D) t-values comparing house vs. face median activation in layer C2 for 8 different patch sizes. All p-values for the t-tests are less than 0.001.
Figure 2
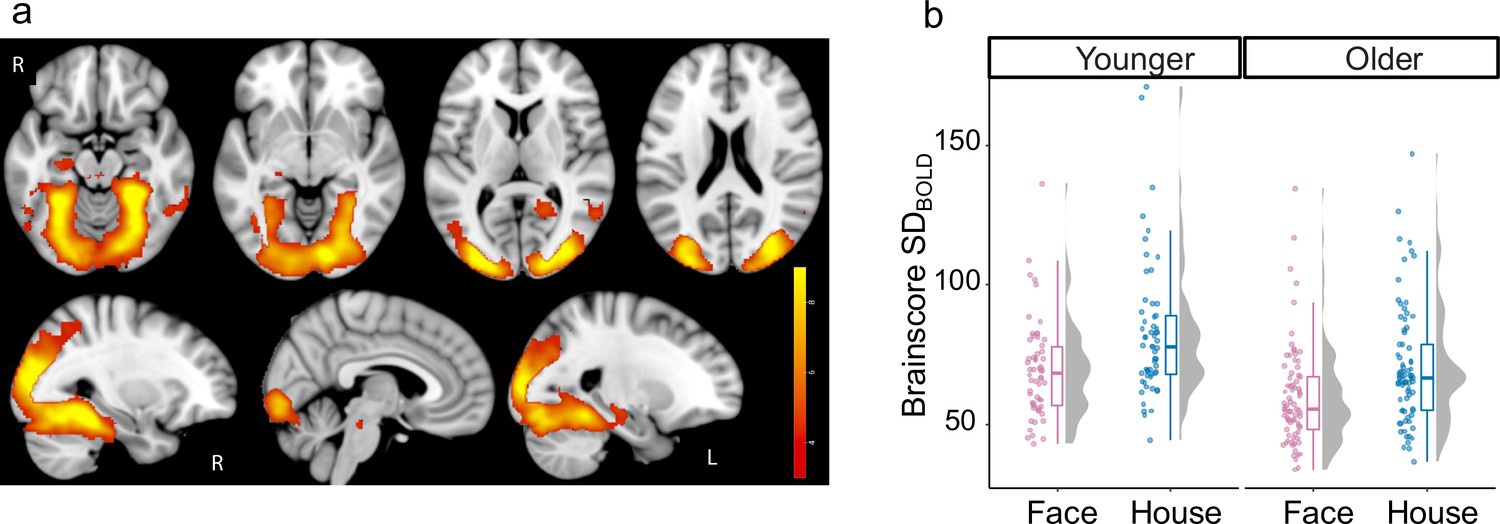
Effect of task-condition on SDBOLD.
(a) Bootstrap ratios are thresholded at a value of ≥3.00, which approximates a 99% confidence interval and increase from red to yellow (no regions showed reliable decrease). (b) Primary and extended visual cortex show reliably higher variability (Cohen’s f=0.46) during the house condition (in blue) than face condition (in pink) in both younger and older adults.
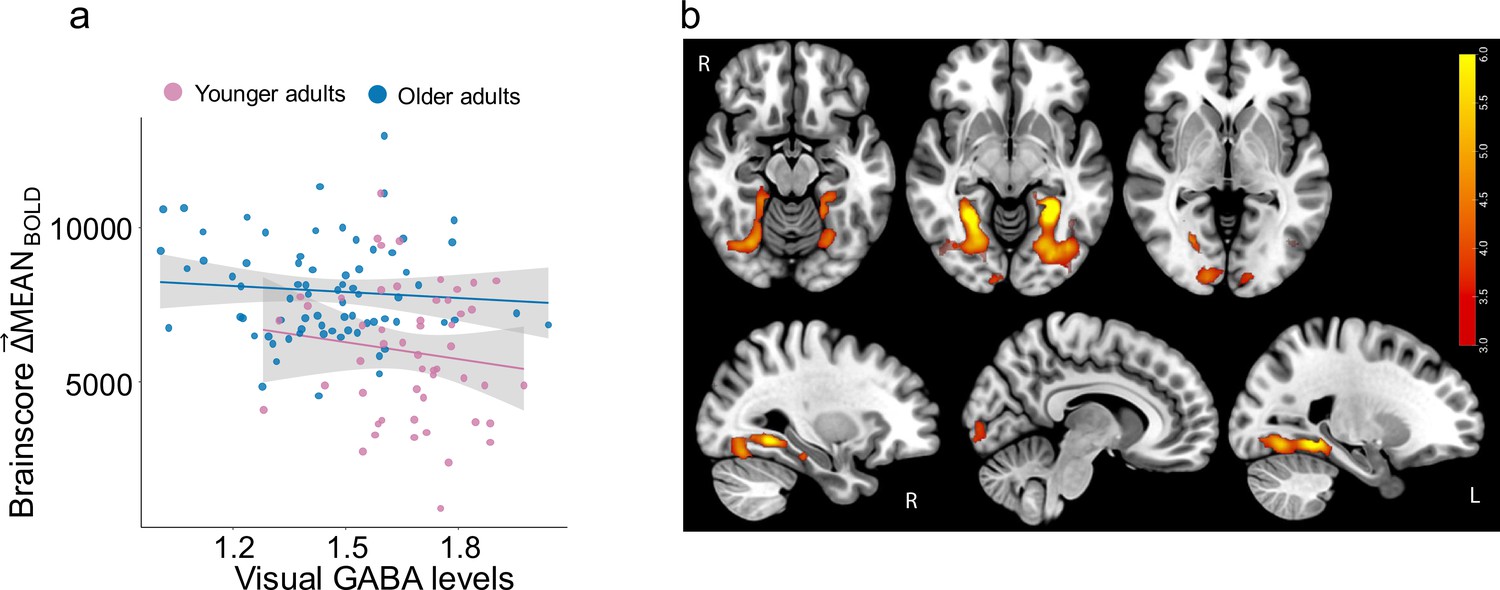
Figure 3
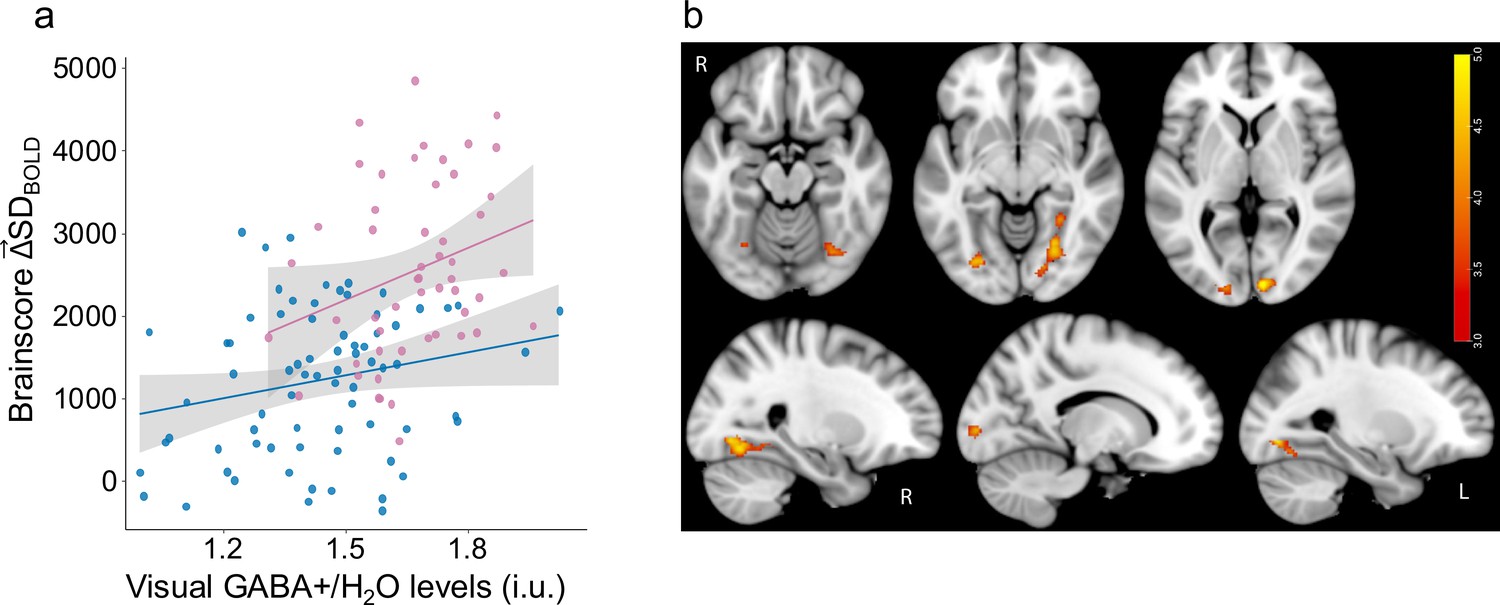
Higher GABA +levels are associated with greater .
(a) Higher multivariate is associated with younger adult age (Cohen’s f=0.71) and with greater GABA +levels (Cohen’s f=0.22) in both older (in blue) and younger adults (in pink). (b) Relationship between and GABA levels is robust in primary visual cortex and fusiform gyrus. Bootstrap ratios are thresholded at a value of ≥3.00, which approximates a 99% confidence interval and increase from red to yellow.
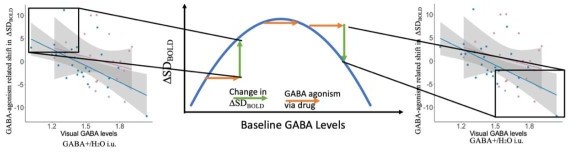
Figure 4

Drug-related shift in is associated with baseline GABA +levels measured using MRS (off-drug).
GABA agonism leads to an increase in in participants with lower GABA levels, while those with higher GABA levels exhibit a decrease in (Cohen’s f=0.42) in both older adults (in blue) and younger adults (in pink).
Figure 5
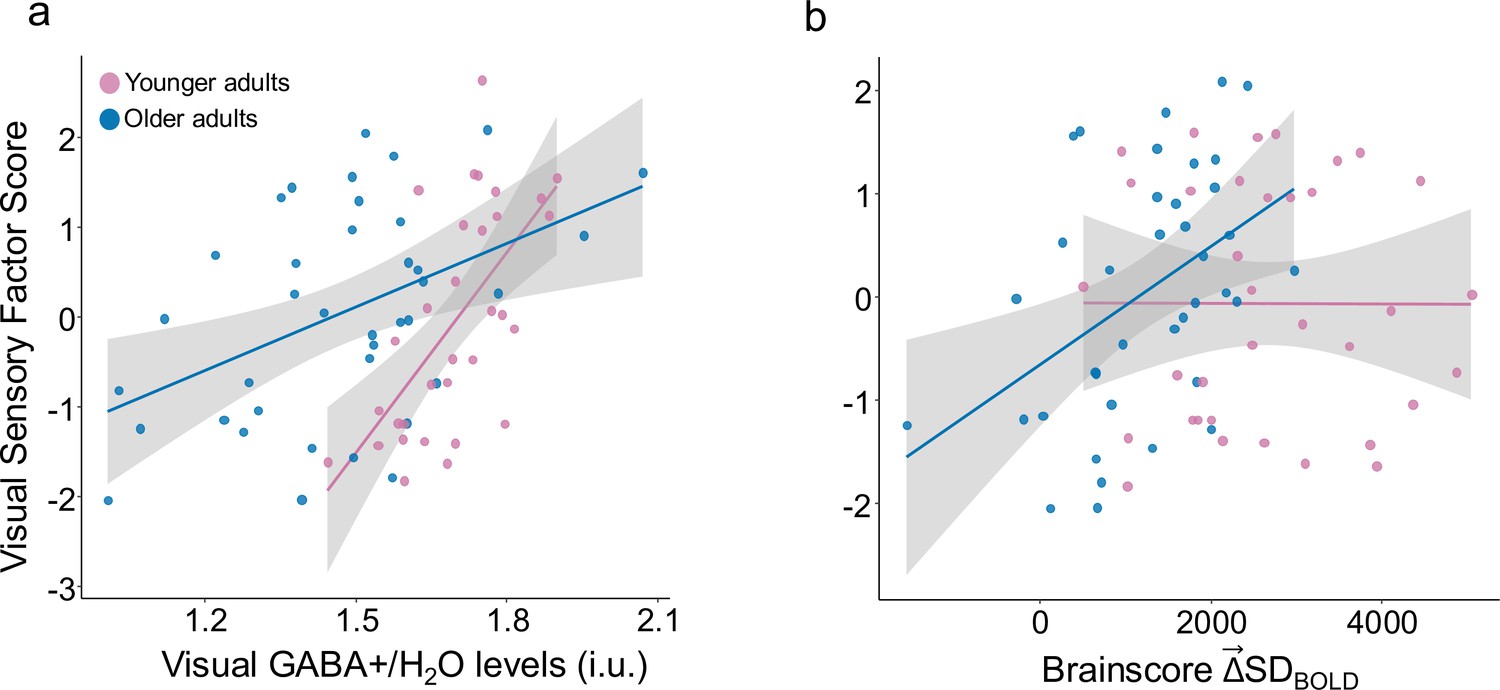
Visual sensory function, GABA +levels, and .
(a) Greater visual sensory scores are significantly associated with higher GABA levels in older adults (in blue) (rho(36) = 0.41) and younger adults (in pink) (rho(30) = 0.62). (b) Higher visual sensory scores were also significantly associated with in older adults (rho(36) = 0.41) but not in younger adults.
Figure 6
and GABA +levels.
(a) Higher multivariate is associated with older adult age (F(1,129) = 36, p < 0.001) but not with GABA +levels in older (in blue) and younger adults (in pink). (b) Relationship between and Age is robust in primary visual cortex and fusiform gyrus. Bootstrap ratios are thresholded at a value of ≥3.00, which approximates a 99% confidence interval and increase from red to yellow.
Figure 7
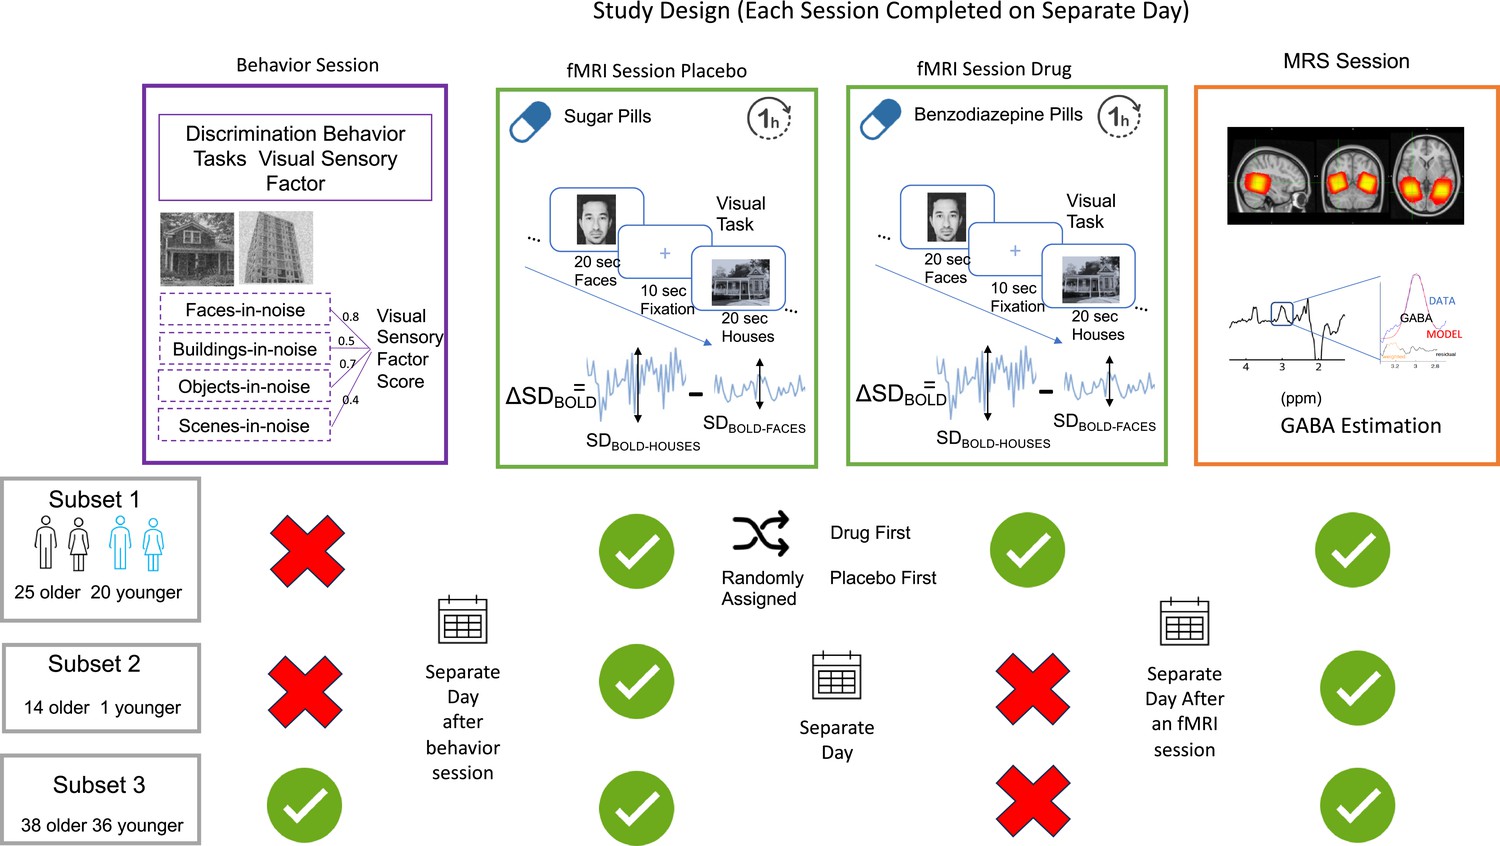
Session design and participant distribution.
All participants underwent an fMRI and MRS scanning session on separate days. One subset of participants (25 older and 20 younger) received an additional on-drug fMRI scan on a separate day. The order of on-drug and off-drug fMRI sessions was randomized. A different subset (3) of participants (38 older and 36 younger) completed four visual discriminatory tasks on a separate day before fMRI testing. During the fMRI session participants completed a 6-min visual task with pseudorandomized 20 s blocks of passively viewed houses and faces interleaved with 10 s fixation blocks as shown in the green panel. Change in variability () is computed at every voxel as the difference between SDBOLD-HOUSES and SDBOLD-FACES. The orange panel shows the MRS voxel overlap across participants with brighter (yellow) indicating maximum overlap and red showing the least, an example spectrum obtained, and that raw GABA+/water is estimated by fitting a Gaussian model to compute the area under the curve of the 3ppm GABA peak.
Author response image 1
Tables
Table 1
Brain regions that exhibited a reliable association between task-condition and SDBOLD.
| Cluster number | MNI co-ordinates | Peak threshold (BSR) | Cluster size (in 2 mm voxels) | Cortical region label based on Harvard Oxford Cortical Atlas | ||
|---|---|---|---|---|---|---|
| X | Y | Z | ||||
| 1 | 26 | –44 | –18 | 16.71 | 18565 | Temporal Occipital Fusiform Cortex Includes parts of Occipital Pole (AAL Label: Calcarine, Lingual), Lingual Gyrus, Temporal Fusiform Cortex, Occipital Fusiform Gyrus, posterior Parahippocampal Gyrus etc. |
Table 2
Brain regions that exhibited a reliable association between age, GABA and .
| Cluster number | MNI co-ordinates | Peak threshold (BSR) | Cluster size (in 2 mm voxels) | Cortical region label based on Harvard Oxford Cortical Atlas | ||
|---|---|---|---|---|---|---|
| X | Y | Z | ||||
| 1 | –28 | –78 | -6 | 5.35 | 118 | Occipital Fusiform Gyrus |
| 2 | 10 | –92 | 2 | 5.05 | 124 | Bilateral Occipital Pole (AAL Label: Calcarine and Lingual) |
| 3 | 24 | –70 | -8 | 4.69 | 199 | Occipital Fusiform Gyrus |
Table 3
Participant distribution across three subsets.
| Subset | Completed dates | Number of participants | Age | Sex (female counts) | Sessions completed | ||||||
|---|---|---|---|---|---|---|---|---|---|---|---|
| Young | Older | Young | Older | Young | Older | fMRI placebo | fMRI drug | MRS | Vis Behav | ||
| 1 | February 2018 | 20 | 25 | 23.5 | 69.9 | 13 | 16 | ✓ | ✓ | ✓ | |
| 2 | June 2018 | 1 | 14 | 21 | 70.9 | 1 | 14 | ✓ | ✓ | ||
| 3 | March 2020 | 38 | 36 | 22.4 | 69.9 | 15 | 22 | ✓ | ✓ | ✓ | |
Table 4
Minimum reporting standard table for MRS session.
| 1. Hardware | |
|---|---|
| a. Field Strength [T] | 3T |
| b. Manufacturer | GE |
| c. Model (software version if available) | Discovery MR750 DV26R2 |
| d. RF coils: nuclei (transmit/receive), number of channels, type, body part | 8-channel head coil |
| e. Additional hardware | NA |
| 2. Acquisition | |
| a. Pulse sequence | MEGA-PRESS Mescher et al., 1998 |
| b. Volume of Interest (VOI) locations | Seven VOI collected:
|
| c. Nominal VOI size [cm3, mm3] | 30x30 x 30 mm3 |
| d. Repetition time (TR), echo time (TE) [ms, s] | TR = 1800ms, TE = 68ms (TE1 = 15ms, TE2 = 53ms) |
| e. Total number of excitations of or acquisitions per spectrum In time series for kinetic studies i. Number of averaged spectra (NA) per time point ii. Averaging method (eg block-wise or moving average) iii. Total number of spectra (acquired/in time series) | 256 (128 ON interleaved with 128 OFF) |
| f. Additional sequence parameters (spectral width in Hz, number of spectral points, frequency offsets) If STEAM: mixing time (TM) If MRSI: 2D or 3D, FOX in all directions, matrix size, acceleration factors, sampling method | Spectral width = 5 kHz Data points = 4,096 Frequency selective editing pulses applied at: ON pulse = 1.9 ppm OFF pulse = 7.46 ppm |
| g. Water suppression method | CHESS |
| h. Shimming method, reference peak, and thresholds for “acceptance of shim” chosen | Auto-shim, if linewidth >15 then voxel placement adjusted and shim redone. |
| i. Triggering or motion correction method (respiratory, peripheral, cardiac triggering, incl. device used and delays) | None |
| 3. Data analysis methods and outputs | |
| a. Analysis software | Gannet 3.1 in MATLAB |
| b. Processing steps deviating from quoted reference or product | No deviations – standard steps were used. |
| c. Output measure (eg absolute concentration, institutional units, ratio), processing steps deviating from quote reference or product | Gannet outputs: - Ratio to Cr (GABA/Cr) - Ratio to NAA (GABA/NAA) - Institutional units relative to water, uncorrected for VOI tissue composition (GABA/H2O) - Institutional units relative to water, corrected for VOI CSF content (GABA/H2O CSF) - Institutional units relative to water, corrected for tissue composition of VOI (GABA/H2O TC) - Institutional units relative to water, corrected for tissue composition of VOI, and alpha of.5 applied to white matter % (GABA/H2O ATC) - Institutional units relative to water, corrected for tissue composition of VOI, and alpha of.5 applied to white matter %, and normallised to average tissue composition of VOI in young adults (GABA/H2O GATC) |
| d. Quantification references and assumptions, fitting model assumption | |
| 4. Data quality | |
| a. Reported variables | GABA +fit error |
| b. Data exclusion criteria | - Spectra were visually inspected for GABA peaks and model fits. - Gannet derived estimates were included in analyses if GABA +fit error was below 15% |
| c. Quality measures of post-processing model fitting (eg CRLB, goodness of fit, SD of residual) | Gannet: Fit Error % |
| 5. Average Spectra | |
Within Older Adults with ±1 Standard deviation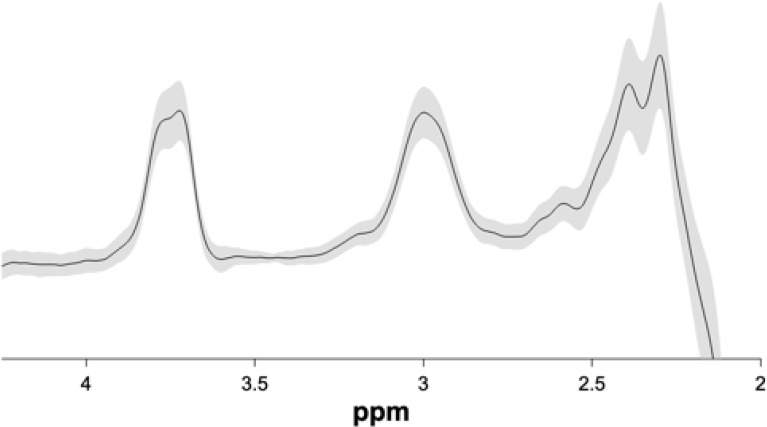 | Within Younger Adults with ±1 Standard deviation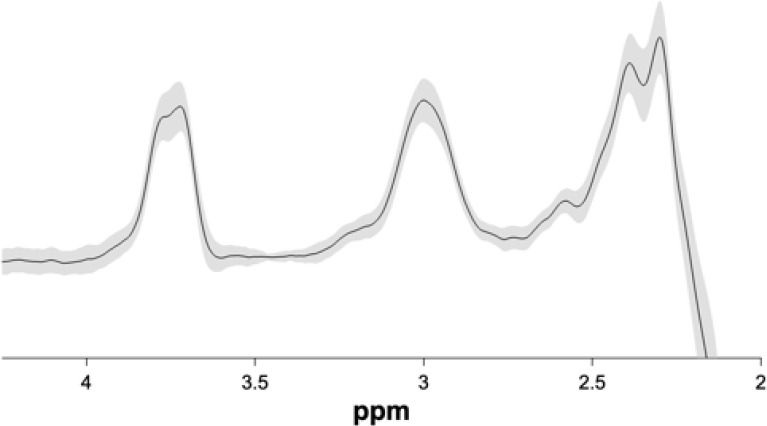 |
Additional files
-
MDAR checklist
- https://cdn.elifesciences.org/articles/83865/elife-83865-mdarchecklist1-v1.pdf
-
Supplementary file 1
De-identified processed data for all participants.
- https://cdn.elifesciences.org/articles/83865/elife-83865-supp1-v1.xlsx
Download links
A two-part list of links to download the article, or parts of the article, in various formats.
Downloads (link to download the article as PDF)
Open citations (links to open the citations from this article in various online reference manager services)
Cite this article (links to download the citations from this article in formats compatible with various reference manager tools)
Modulation of brain signal variability in visual cortex reflects aging, GABA, and behavior
eLife 14:e83865.
https://doi.org/10.7554/eLife.83865


