Germinal center B cells that acquire nuclear proteins are specifically suppressed by follicular regulatory T cells
- Department of Microbiology and Immunology, University of Michigan–Ann Arbor, United States
- Department of Internal Medicine, Division of Rheumatology, University of Michigan–Ann Arbor, United States
- Department of Microbiology and Immunology, Indiana University School of Medicine, United States
Figures
Figure 1
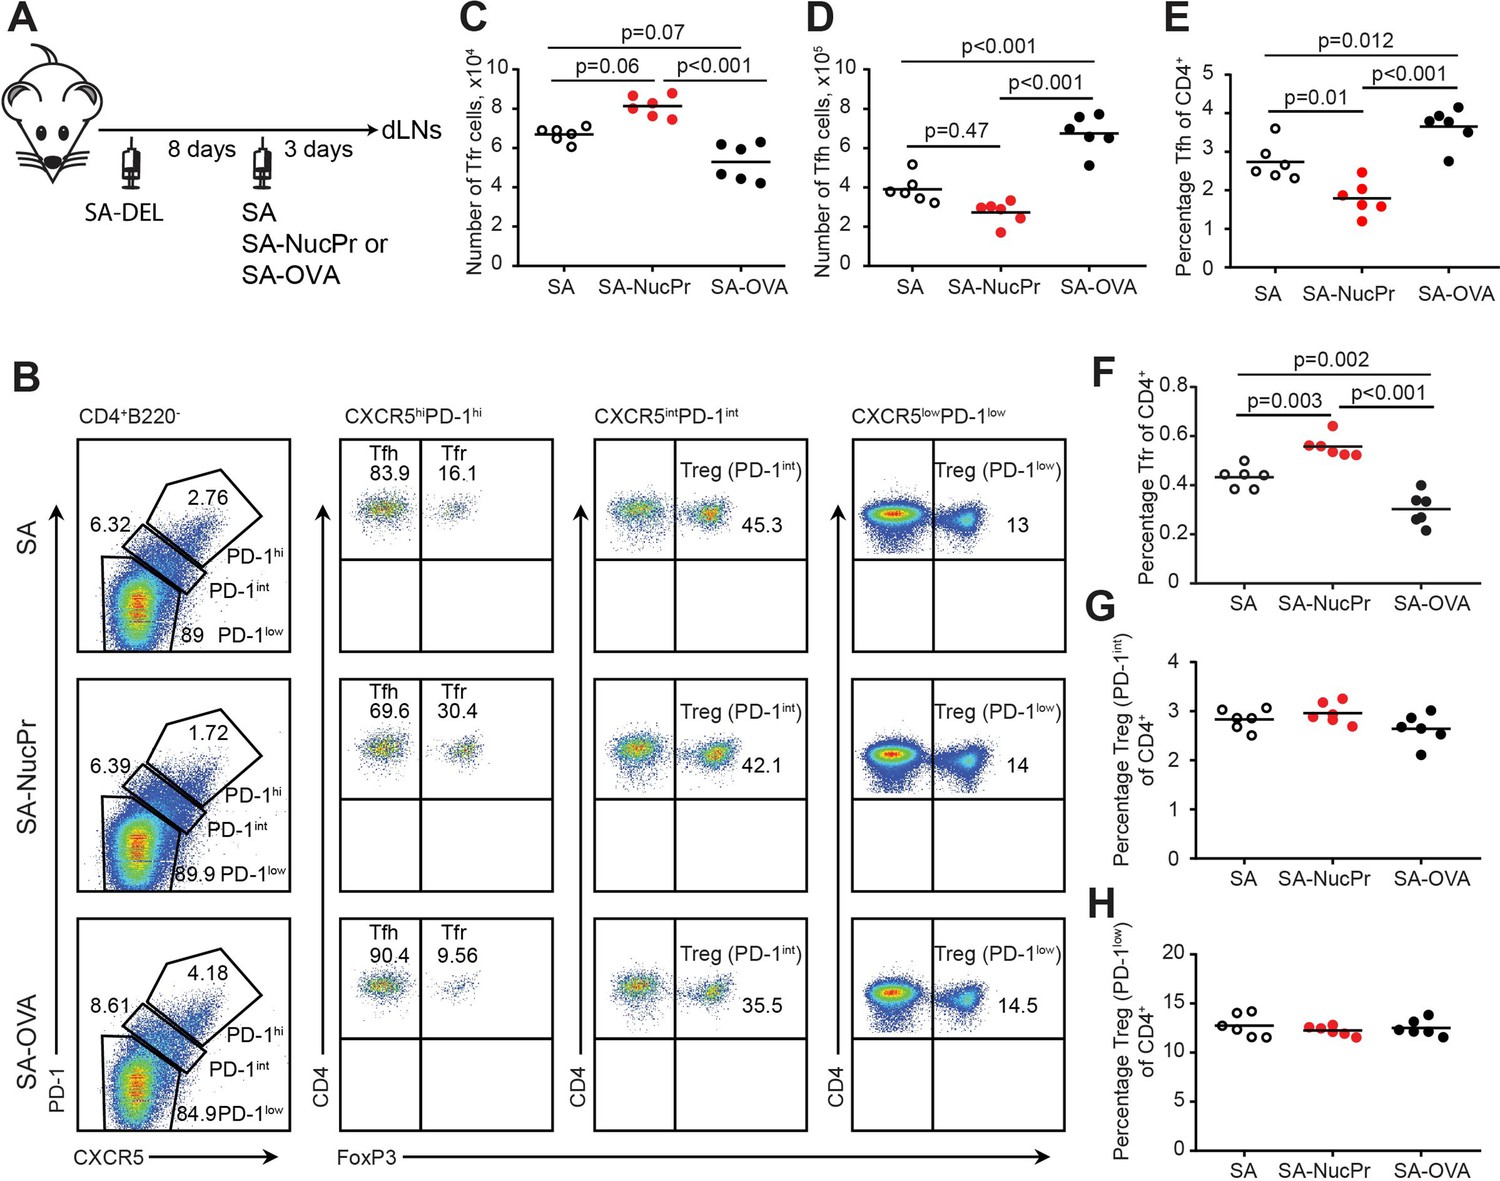
Boosting mice with streptavidin (SA) linked to nuclear proteins (NucPrs) induces rapid follicular regulatory T cell (Tfr) response.
(A) Experimental outline. B6 mice were subcutaneously (s.c.) immunized with SA-DEL in Ribi and at day 8 were s.c. reimmunized with SA, SA-NucPr, or SA-OVA in Ribi for analysis 3 days later. (B–G) Flow cytometry analysis of Tfr, Tfh, and other Treg subsets in the draining inguinal lymph nodes (dLNs) of immunized mice. (B) The gating strategy to identify the CXCR5hiPD1hi FOXP3+ (Tfr) and CXCR5hiPD1hi FOXP3- (Tfh), CXCR5intPD1int FOXP3+ (PD1int Tregs), and CXCR5lowPD1low FOXP3+ (PD1low Tregs) cell populations and representative flow plots for SA, SA-NucPr, and SA-OVA-boosted mice. (C) The numbers of Tfr. (D, E) The numbers (D) and percentage (E) of Tfh cells. (F–H) The frequencies of Tfr (F), PD-1int Tregs (G), and PD-1low Tregs (H) of total CD4+ T cells in the dLNs. Data are representative of n=3 independent experiments. Each symbol represents one mouse. Lines indicate means. One-way ANOVA with Bonferroni’s multiple comparisons test.
Figure 2 with 2 supplements
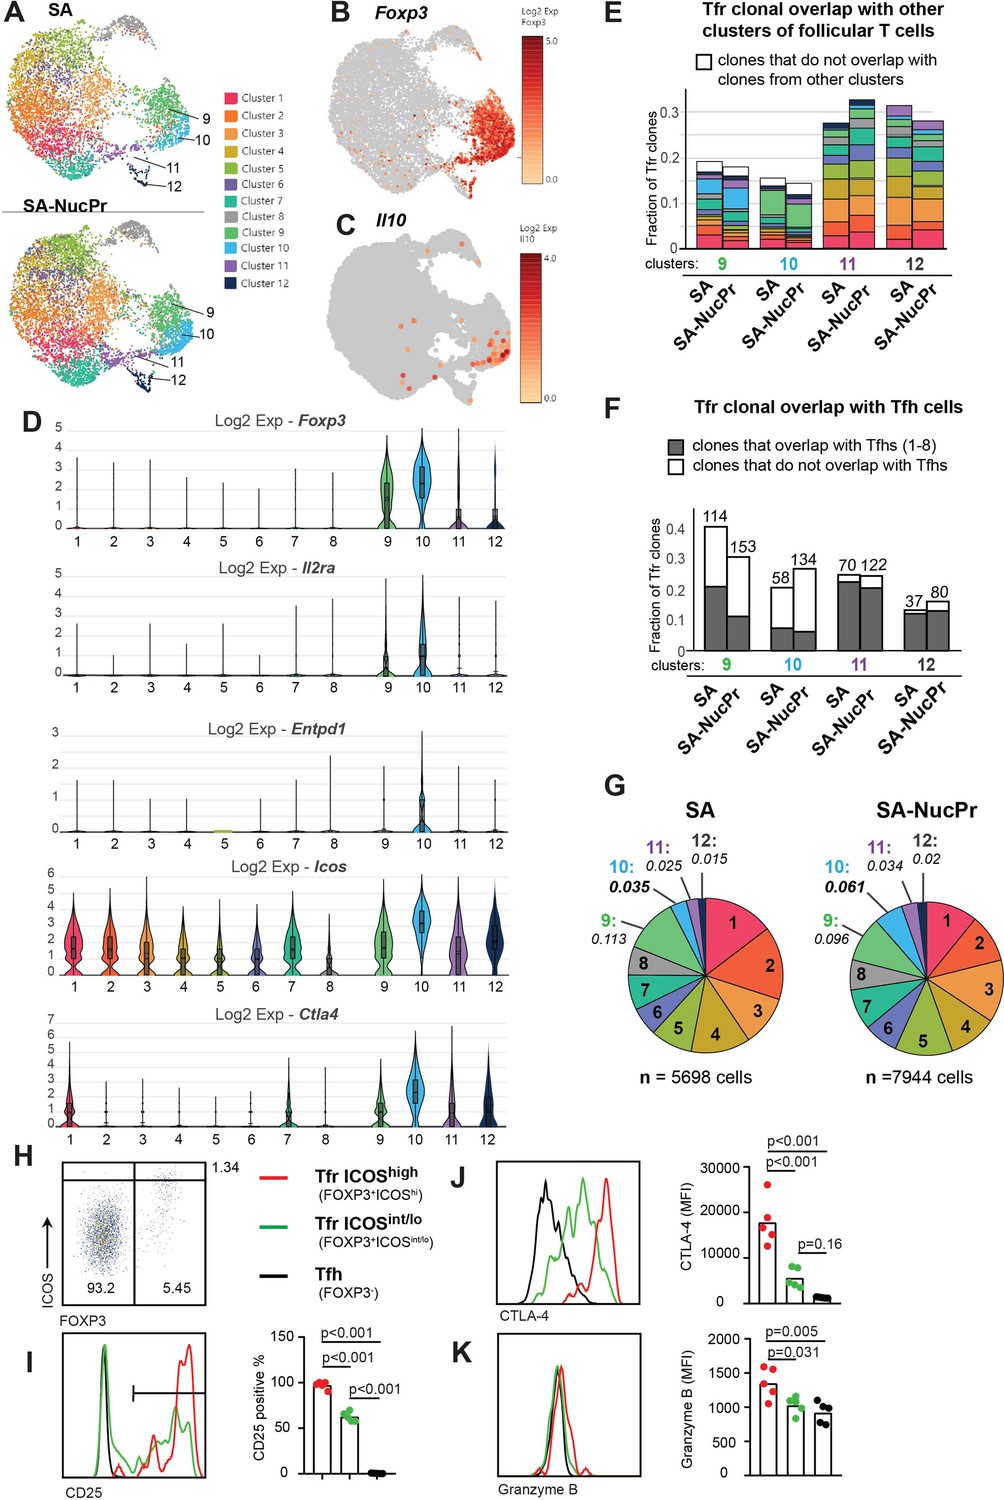
Analysis of follicular regulatory T cells (Tfr) gene expression and TCR repertoire in streptavidin (SA) and SA-nuclear protein (NucPr)-boosted mice (related to Figure 2—figure supplement 1).
(A–G) Single-cell 10× Genomics (Cell Ranger) analysis of gene expression and TCR repertoire of the CD4+CD8-220-CXCR5hiPD1hi cells (Tfr and Tfh) sorted from the draining inguinal lymph nodes (dLNs) of mice immunized with SA-DEL and boosted with SA (two mice) or SA-NucPr (two mice) as in Figure 2—figure supplement 1A. (A) Graph-based clustering of follicular T cells from SA and SA-NucPr-boosted mice visualized in 2D using uniform manifold approximation and projection for dimension reduction (UMAP) algorithm. (B, C) Single-cell expression of Foxp3 (in B) and Il10 (in C) in follicular T cells for combined SA and SA-NucPr data shown in UMAP. (D) Expression of selected genes associated with Treg-mediated regulation in the follicular T cell clusters 1–12. Clusters 9–12 are enriched for follicular T cells with Foxp3 expression and will be called Tfr-like cell clusters. Clusters 1–8 will be called Tfh-like cell clusters. (E) Overlap of TCR clones (with >1 cell per clone) within Tfr-like clusters 9–12 with other follicular T cell clusters (color-coded as in 2A). Note that the largest fraction of TCR clones in cluster 9 overlap with cluster 10 and vice versa. (F) Fraction of TCR clones (with >1 cell per clone) within Tfr-like clusters 9–12 that overlap or not with Tfh-like clusters 1–8 after SA versus SA-NucPr boosting. Note that there is no increase in the Tfh-like TCR clones within Tfr-like clones after SA-NucPr boosting. (G) Relative abundance of follicular T cells in 1–12 clusters in the SA versus SA-NucPr-boosted mice. Note about twofold increase in the Tfr-like cluster 10 in the SA-NucPr-boosted mice. (H–K) Flow cytometry analysis of CD25, CTLA4, and granzyme B expression in CD4+CD8-B220-CXCR5highPD1high cells that are FOXP3- (Tfh), FOXP3+ICOShigh (Tfr ICOShigh) and FOXP3 ICOSint/low (Tfr ICOSint/lo) in the dLNs of SA-NucPr-boosted mice. (H) The gating strategy of CD4+CD8-B220-CXCR5highPD1high cells. (I–K) Representative flow histograms (left panels) and percent of positive cells (right panel) for CD25 (in I) or MFIs (right panels) for CTLA4 (in J), granzyme B (in K). n=2 independent experiments. Each point represents one mouse. One-way ANOVA with Bonferroni’s multiple comparisons test.
Figure 2—figure supplement 1
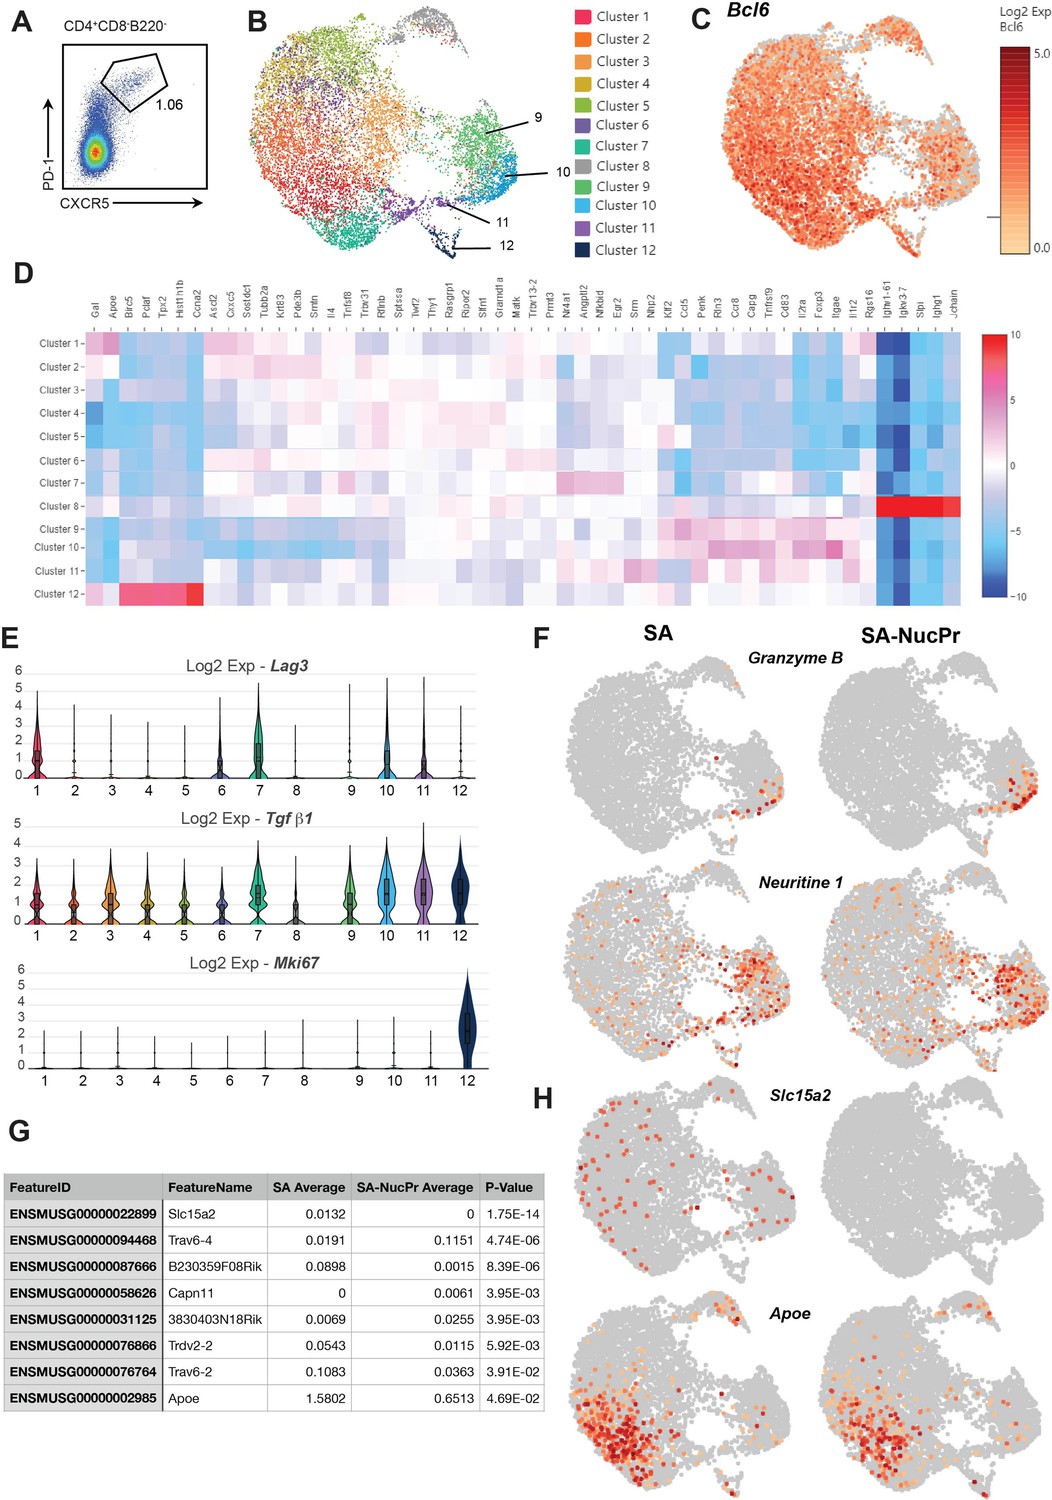
Analysis of follicular T cells gene expression in the streptavidin (SA) and SA-nuclear protein (NucPr)-boosted mice.
Single cell 10× Genomics (Cell Ranger) analysis of gene expression of the CD4+CD8-B220-CXCR5hiPD1hi cells (follicular regulatory T cells [Tfr] and Tfh) sorted from the draining inguinal lymph nodes (dLNs) of mice treated as described in Figure 1A following their boosting with SA (two mice) or SA-NucPr (two mice). (A) The gating strategy for follicular T cell sorting. Cell purity >94%. (B) Graph-based clustering of follicular T cells from combined SA and SA-NucPr-boosted mice visualized in 2D using uniform manifold approximation and projection for dimension reduction (UMAP) algorithm. (C) Single-cell expression of follicular T cells transcription factor Bcl6. (D) Heatmap with genes that have highest statistical significance of mean gene expression in follicular T cell clusters 1–12 (five genes per each cluster) calculated based on negative binomial test (Cell Ranger). (E) Expression of selected genes associated with Treg-mediated regulation and proliferation in the follicular T cell clusters 1–12. (F) Single-cell expression of granzyme B and neuritine 1 in Tf cells. (G, H) The genes differentially expressed in Tfh cells in the SA versus SA-NucPr boosted mice. (G) The list of genes with statistically significant differences in expression. (H) Single-cell expression data is shown for Slc15a2 (proton-coupled peptide transporter) and Apoe (apolipoprotein E).
-
Figure 2—figure supplement 1—source data 1
The genes differentially expressed in Tfh cells in the streptavidin (SA) versus SA-nuclear protein (NucPr)-boosted mice with statistically significant differences in expression.
- https://cdn.elifesciences.org/articles/83908/elife-83908-fig2-figsupp1-data1-v1.xlsx
Figure 2—figure supplement 2
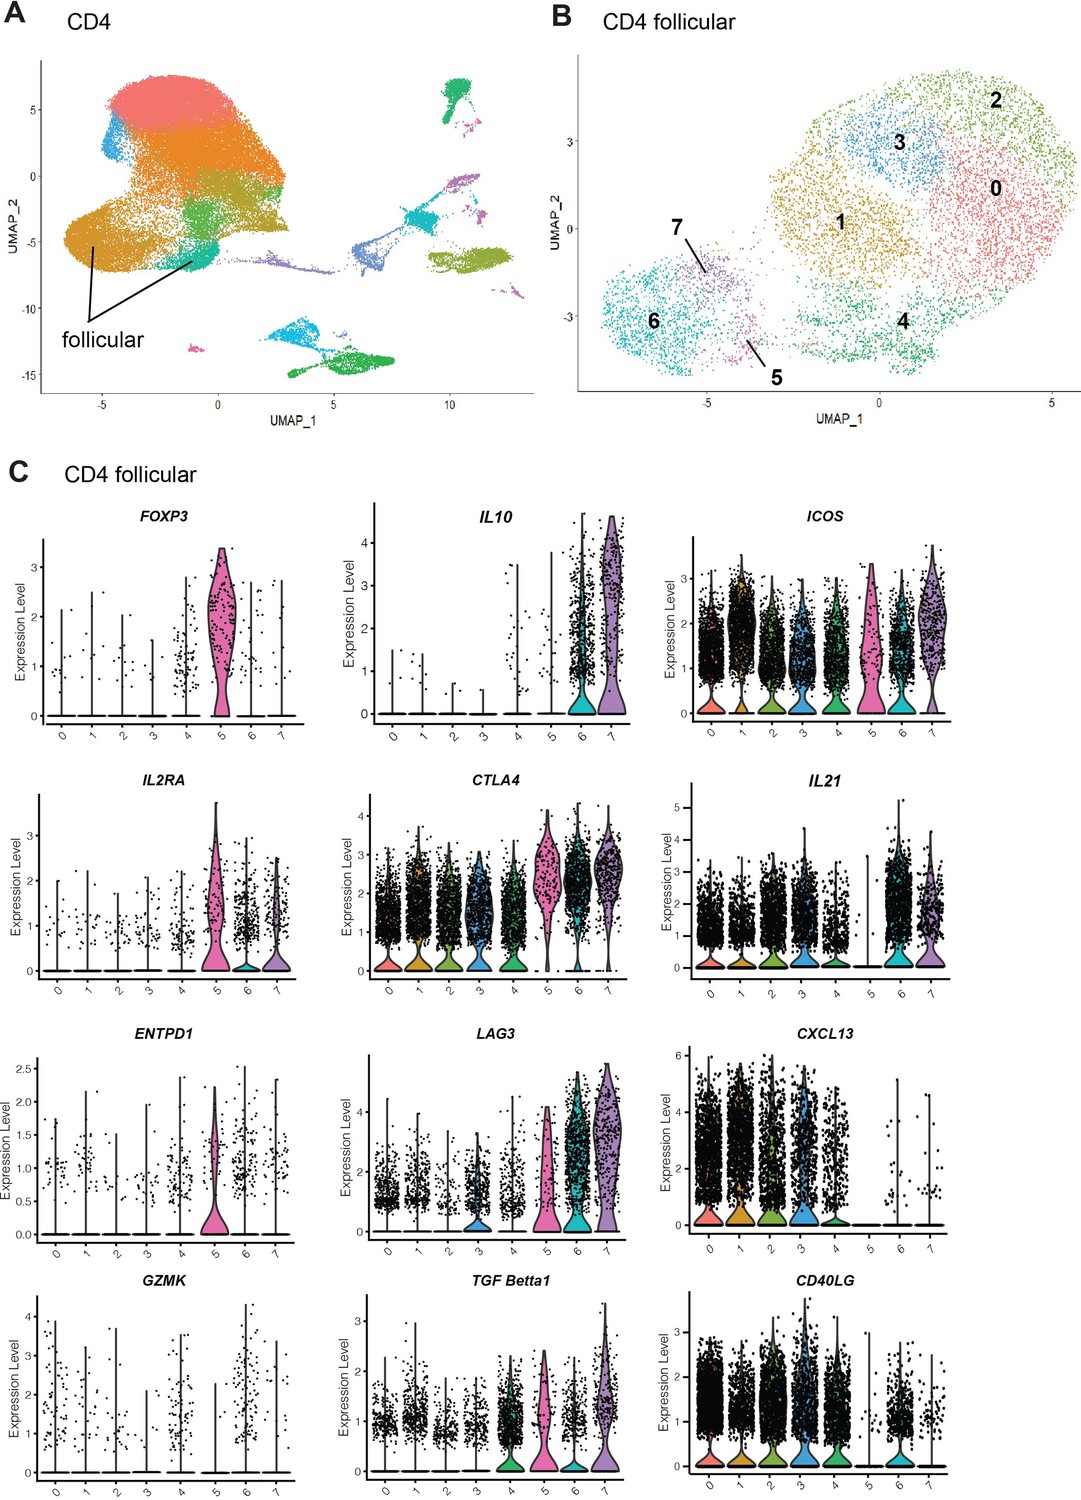
Analysis of human follicular T cells gene expression.
Human lymph nodes scRNA-seq analysis was performed on the publicly available single-cell datasets from fine needle aspirations of the draining ipsilateral axillary lymph nodes in SARS-CoV-2 mRNA-vaccinated human subjects (GSE195673). Seurat v4 was used to normalize, find variable features (2000), and to perform PCA of CD4 T cells. Follicular T cells were identified using modular score generated based on the expression of CXCR5, PDCD1, BCL6, ICOS, CTLA4, IL1R2, and CXCL13. Follicular T cell subsets were then reclustered. (A, B) PCA and clusterization analysis for CD4 T cells (in A) and follicular-like CD4 T cells (in B). (C) Expression of the immunosuppressive genes and genes associated with Tfh cells in human follicular-like T cell clusters 0–7. Cluster 5 is consistent with Tfr-like cells.
Figure 3 with 1 supplement
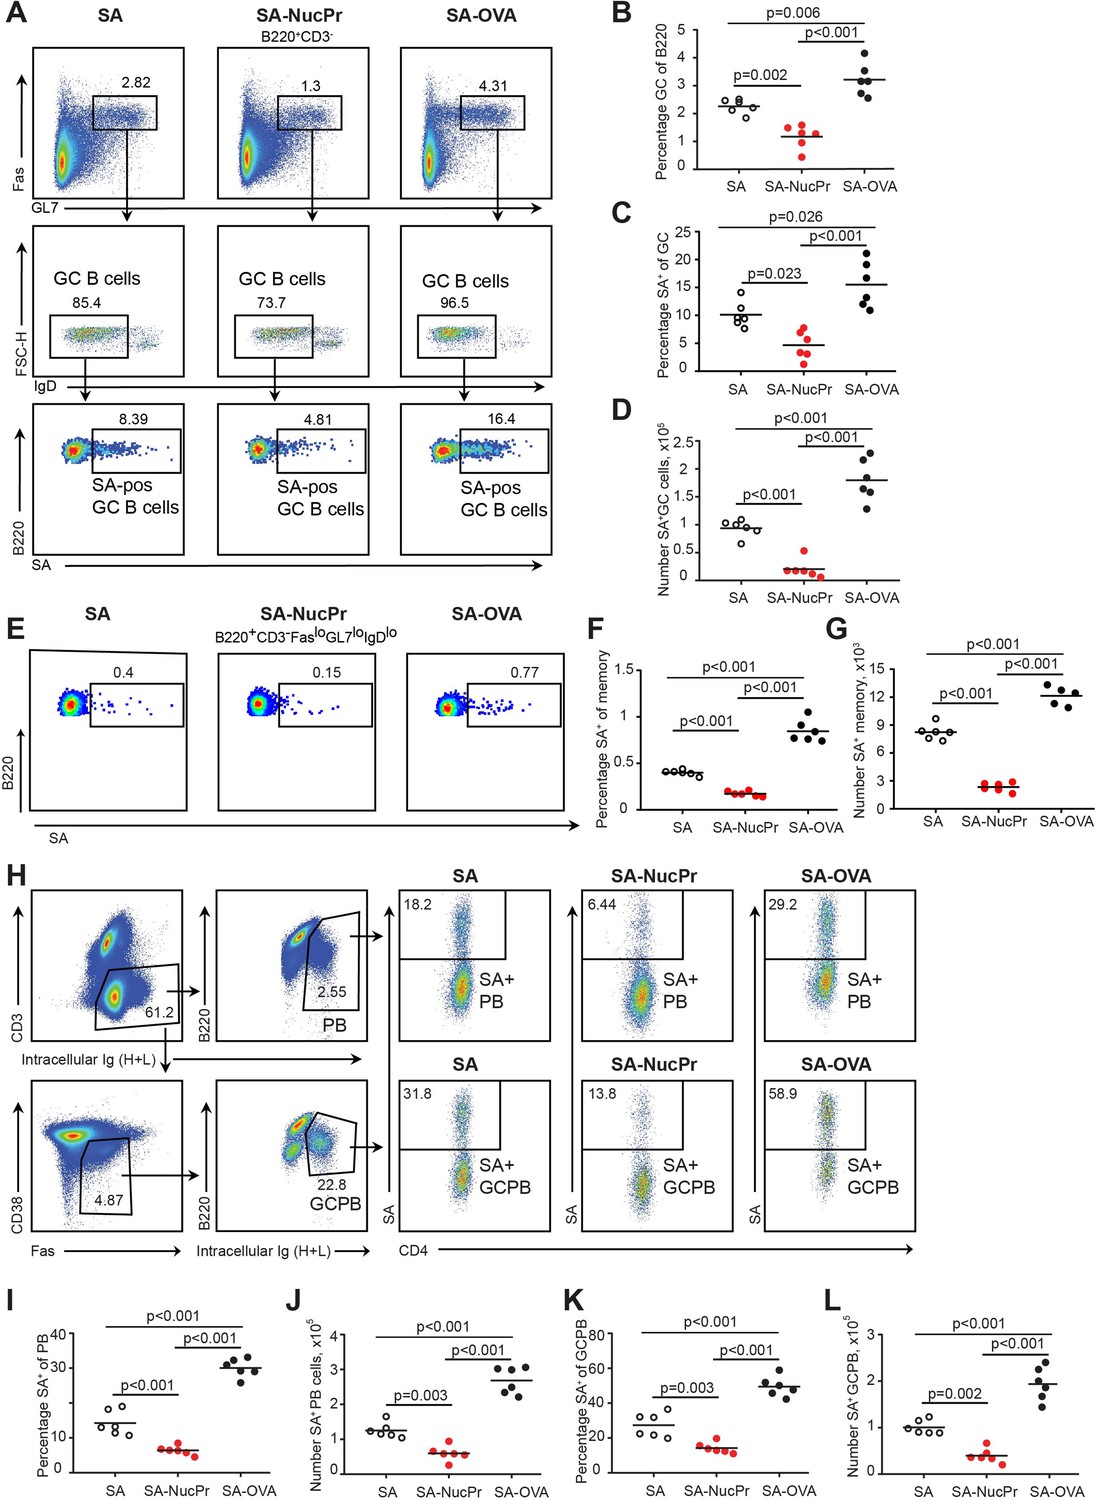
Boosting mice with streptavidin nuclear proteins (SA-NucPrs) suppresses germinal center (GC), memory and plasmablasts (PB) responses with predominant inhibition of the SA-specific B cells (related to Figure 3—figure supplement 1).
Flow cytometry analysis of the total and SA-specific GC (A–D), memory (E–G), and PB (H–L) responses in the draining inguinal lymph nodes (dLNs) of mice treated as shown in Figure 1A. (A) Representative flow plots for the total and SA-specific GC B cells in SA, SA-NucPr, and SA-OVA-boosted mice. (B) The GC B cells percentage of total B220+ B cells. (C, D) SA-specific GC B cells percentage of total GC B cells (C) and their numbers in dLNs (D). (E) Representative flow plots for the class-switched SA-specific memory B cell response in SA, SA-NucPr, and SA-OVA-boosted mice. (F, G) SA-specific memory B cells percentage of total class-switched memory B cells (B220+CD3-FASloGL7loIgDlo) (F) and their numbers in dLNs (G). (H) Representative flow plots for SA-specific PB and GC B cell (GCPB) response in SA, SA-NucPr, and SA-OVA-boosted mice. (I–L) SA-specific PB and GCPB percentage of total PB and GCPB (I, K) and their numbers in dLNs (J, L). Data are representative of n=3 independent experiments. Each symbol represents one mouse. Lines indicate means. One-way ANOVA with Bonferroni’s multiple comparisons test.
Figure 3—figure supplement 1
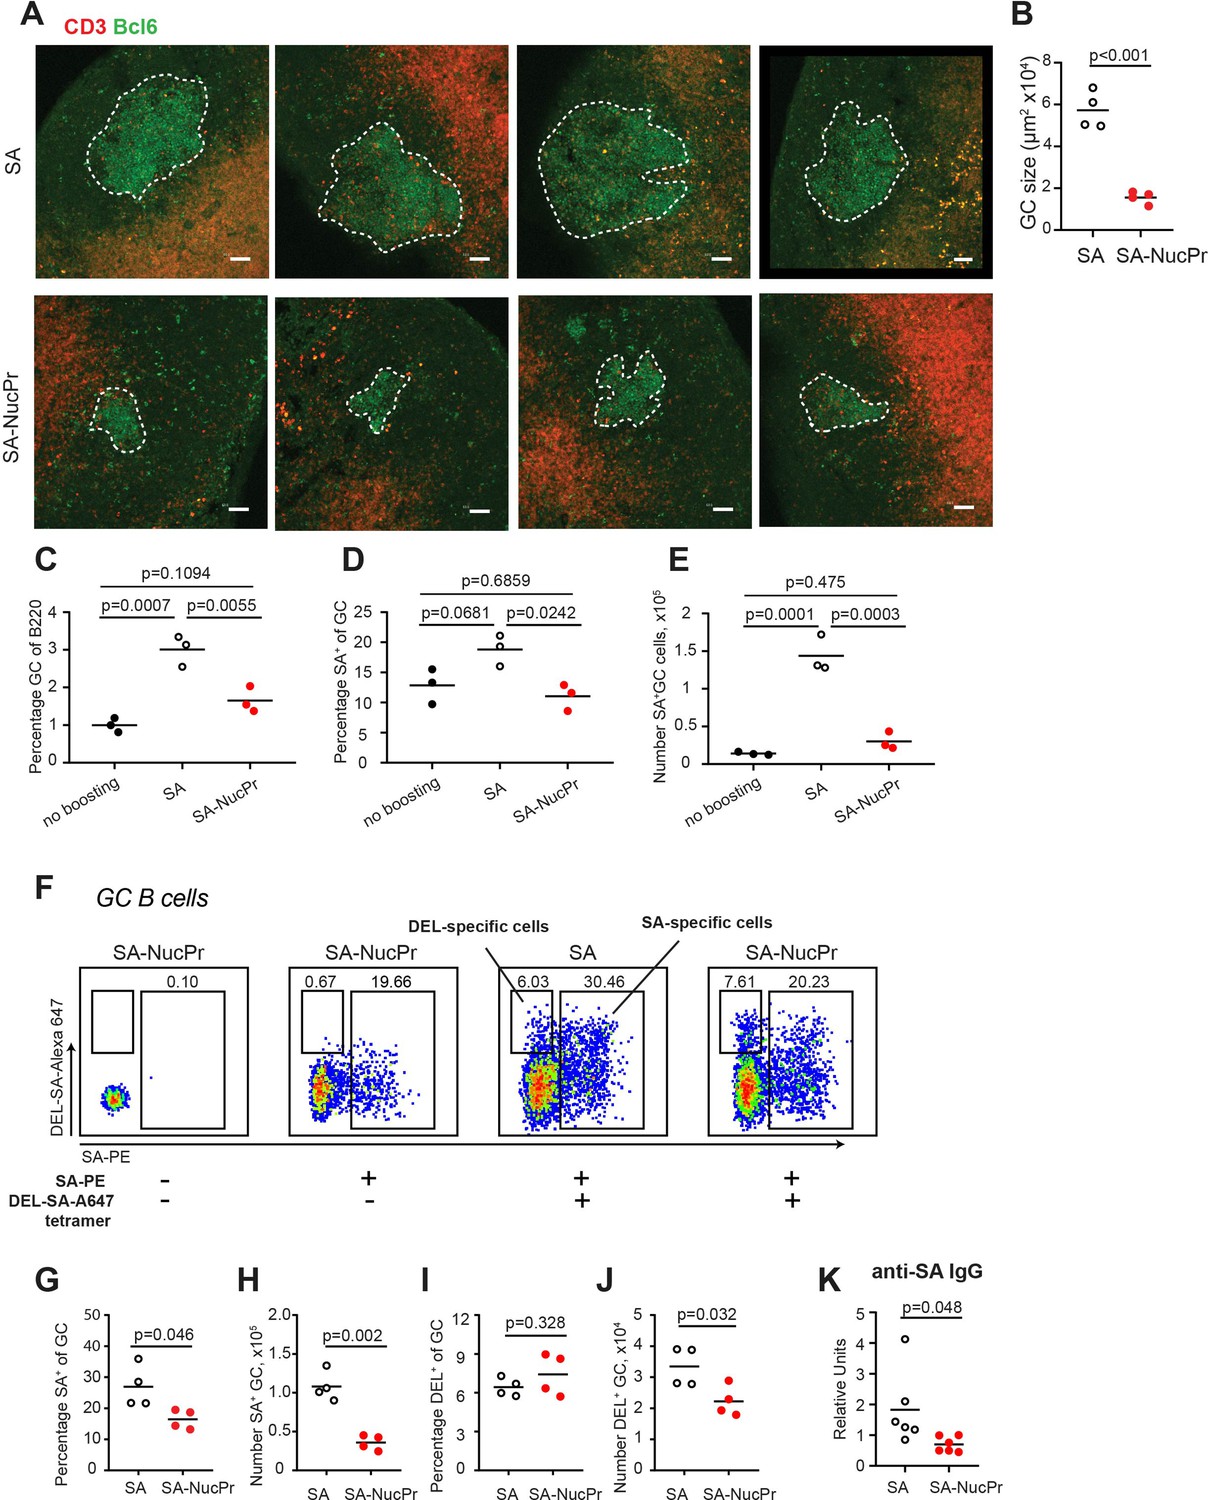
Boosting mice with streptavidin nuclear proteins (SA-NucPrs) suppresses germinal center (GC) and antibody (Ab) responses with predominant inhibition of the SA-specific B cells (related to Figure 3).
(A, B) Immunofluorescent analysis of GC responses in the draining inguinal lymph node (dLN) sections of mice immunized and boosted with SA or SA-NucPr as in Figure 1A. Images of dLNs sections with GCs (in A) and quantification of Bcl6+ GC area (in B). Scale bars, 50 µm. Sections from eight mice, n=2 independent experiments. (C–E) Analysis of GC and SA-specific GC responses in mice immunized with SA-DEL in Ribi subcutaneously (s.c.) and boosted with SA or SA-NucPr or not boosted for control. (F–J) Analysis of SA-specific and DEL-specific B cell responses in mice immunized with SA-DEL in Ribi s.c. and boosted with SA or SA-NucPr. To identify DEL-specific and SA-specific GC B cells lymphocytes from dLNs were stained with SA-PE and DEL-SA-A647 tetramers. (F) Representative flow plots for DEL-specific and SA-specific (B220+CD3-FAS+GL7+IgDlo) GC B cells in SA- and SA-NucPr-boosted mice. (G, H) The frequency (G) and the number (H) of SA-specific GC B cells. (I, J) The frequency (I) and the number (J) of DEL-specific GC B cells. (K) Serum titers of SA-specific IgG in SA and SA-NucPr-boosted mice. Data are from n=2 (C–J) or n=3 (K) independent experiments. Each symbol represents one mouse. Lines indicate means. Two-tailed Student’s t test (in B, G–K). One-way ANOVA with Bonferroni’s multiple comparisons test (in C–E).
Figure 4
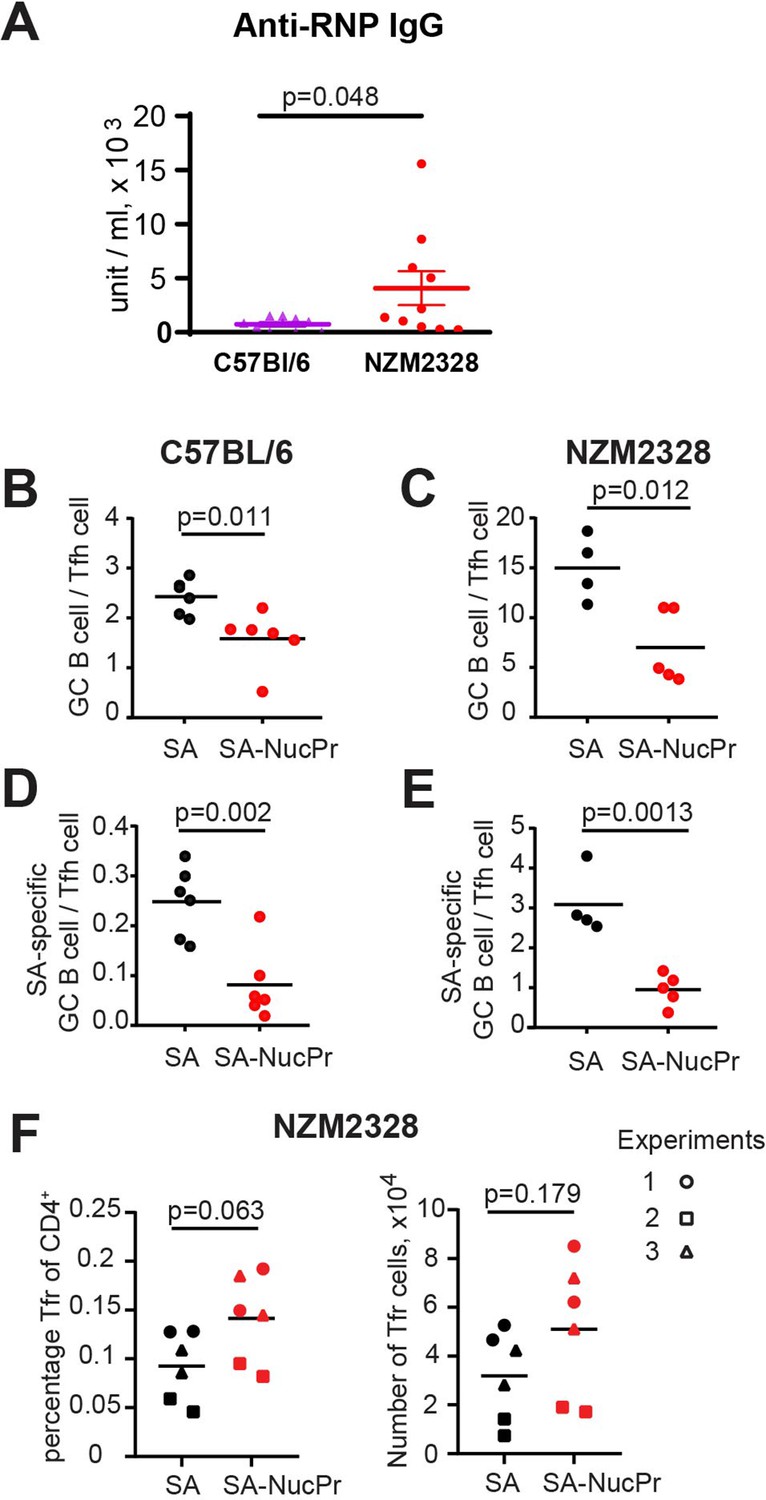
Boosting mice with streptavidin nuclear proteins (SA-NucPrs) reduces the ratio of germinal center (GC) B cells to Tfh cells in both C57BL/6 and NZM2328 mice.
(A) Analysis of anti-ribonucleoprotein (RNP) antibodies (Abs) via ELISA in the serum of female C57BL/6 (52 weeks of age) and NZM2328 female mice (32–52 weeks of age). (B–F) Suppression of GC B cell responses and induction of follicular regulatory T cell (Tfr) response in the draining inguinal lymph nodes (dLNs) of 6- to 8-week-old C57BL/6 and NZM2328 female mice treated as in Figure 1A after the boost with SA-NucPr. (B–E) The ratio of GC B cells to Tfh cells in C57BL/6 (B) and NZM2328 (C) mice. n=2 independent experiments. The ratio of SA-specific GC B cells to Tfh cell in C57BL/6 (D) and NZM2328 (E) mice. (F) Tfr percentage of CD4+ cells (left panel) and total numbers (right panel) in the NZM mice. Different symbols represent n=3 independent experiments. Each symbol represents one mouse. Lines indicate means. Two-tailed Student’s t test.
Figure 5
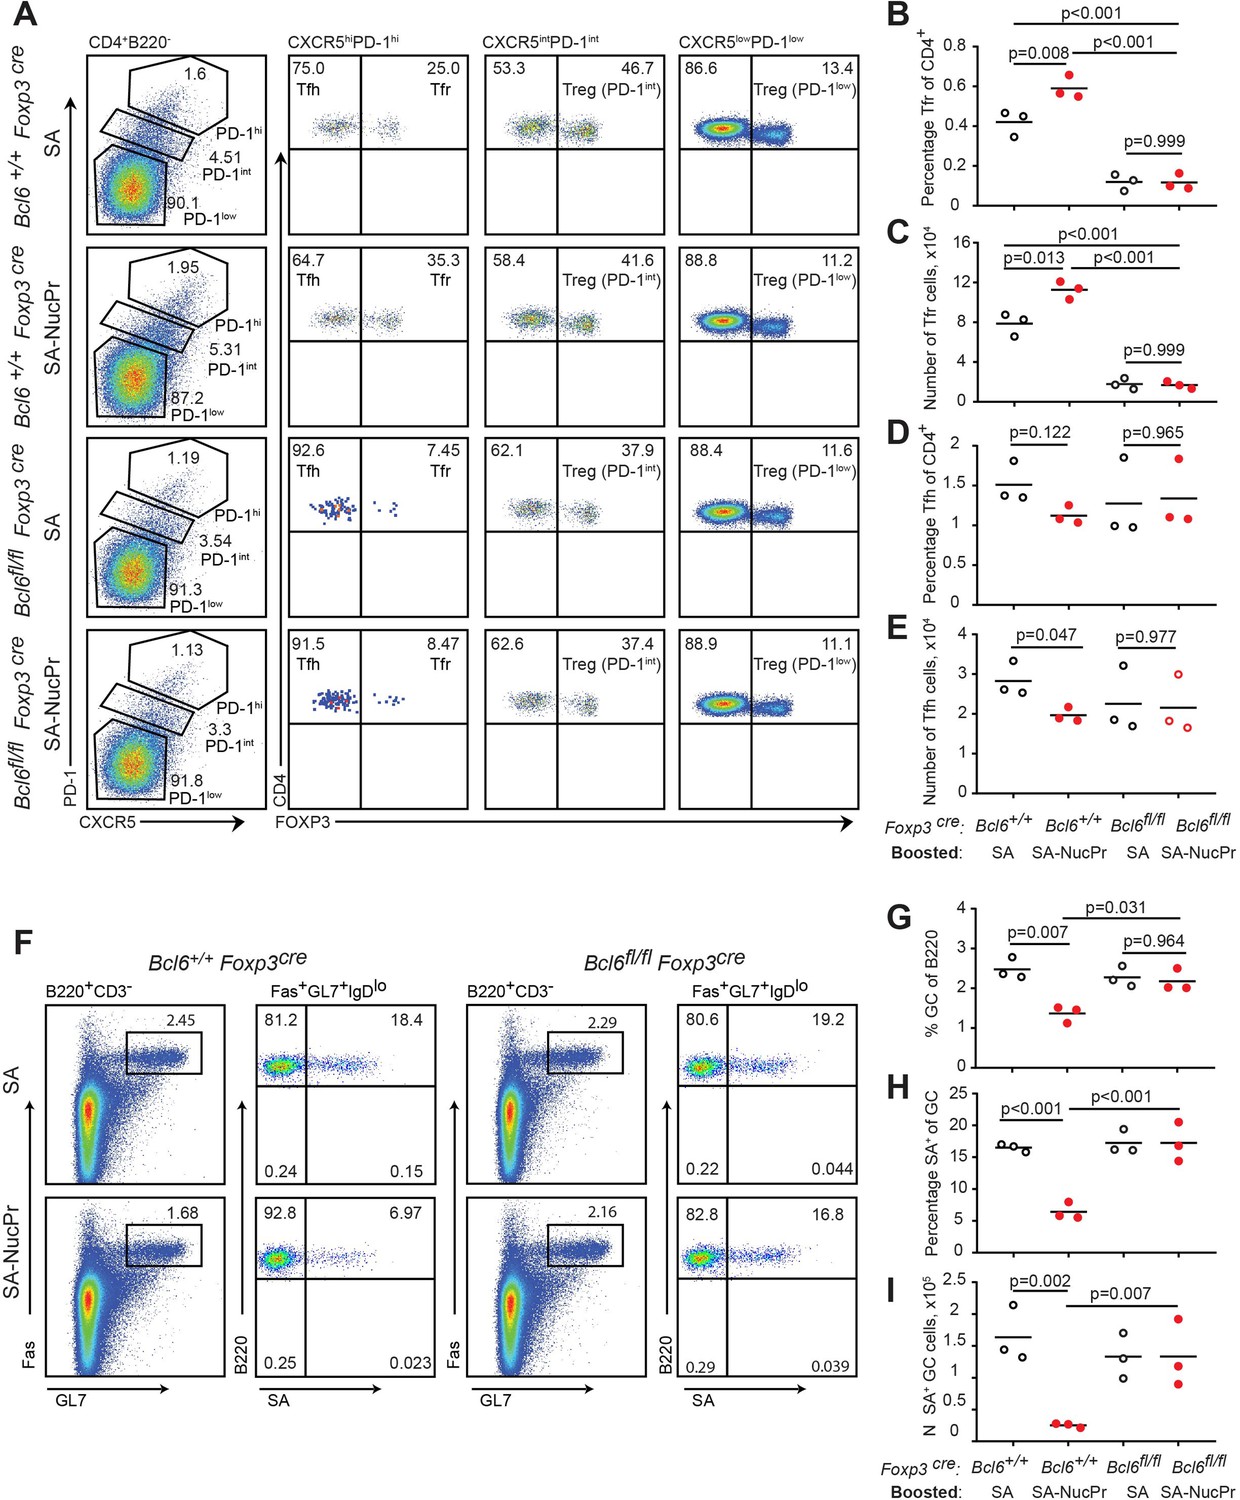
Follicular regulatory T cells (Tfr) are required for the suppression of germinal center (GC) response in mice boosted with streptavidin nuclear proteins (SA-NucPrs).
Bcl6+/+ Foxp3 Cre and Tfr-deficient Bcl6fl/fl Foxp3Cre mice were subcutaneously (s.c.) immunized with SA-DEL in Ribi and at day 8 reimmunized with SA, or SA-NucPr in Ribi s.c. for analysis 3 days later. (A) Representative flow plots for Tfh, Tfr, and other Treg subsets in the dLNs of mice boosted with SA or SA-NucPr. (B, C) Tfr percentage of CD4+ T cells (B) and total numbers (C) in dLNs. (D, E) Tfh cells percentage of CD4+ T cells (D) and total numbers (E) in dLNs. (F) Representative flow plots showing GC B cells and SA-specific GC B cells in Tfr-proficient and -deficient mice after the boost with SA or SA-NucPr. (G) GC B cells percentage of total B220+ B cells. (H, I) SA-specific GC B cells percentage of total GC B cells (H) and total numbers (I) in dLNs. n=3 independent experiments. Each symbol represents one mouse. Lines indicate means. Two-way ANOVA with Tukey’s multiple comparisons test.
Figure 6 with 1 supplement
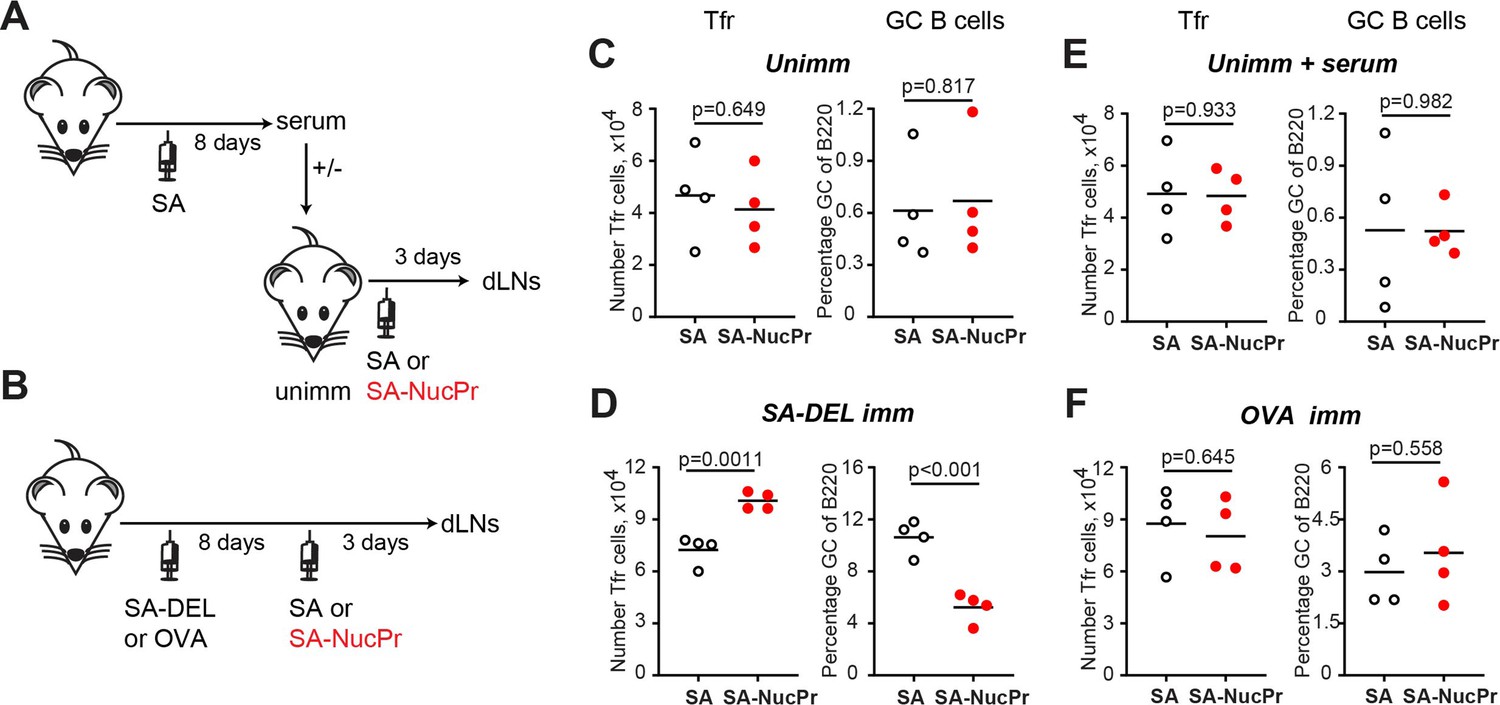
Analysis of the immunization conditions inducing follicular regulatory T cell (Tfr) response.
(A, C, E) Experimental outline (A). Some B6 mice were subcutaneously (s.c.) immunized with streptavidin (SA) and serum were collected at day 8. Unimmunized B6 mice were transferred with serum from above (E) or not (C) and were s.c. immunized with SA or SA-nuclear proteins (NucPr) in Ribi for analysis 3 days later. (B, D, F) Experimental outline (B). B6 mice were s.c. immunized with SA-DEL (D) or OVA (F) in Ribi and at day 8 were s.c. boosted with SA or SA-NucPr in Ribi for analysis 3 days later. (C, D, E, F) The numbers of Tfr (left panels) and the GC B cells percentages of total B220+ B cells (right panels). Data are from n=2 independent experiments. Each symbol represents one mouse. Lines indicate means. Two-tailed Student’s t test.
Figure 6—figure supplement 1
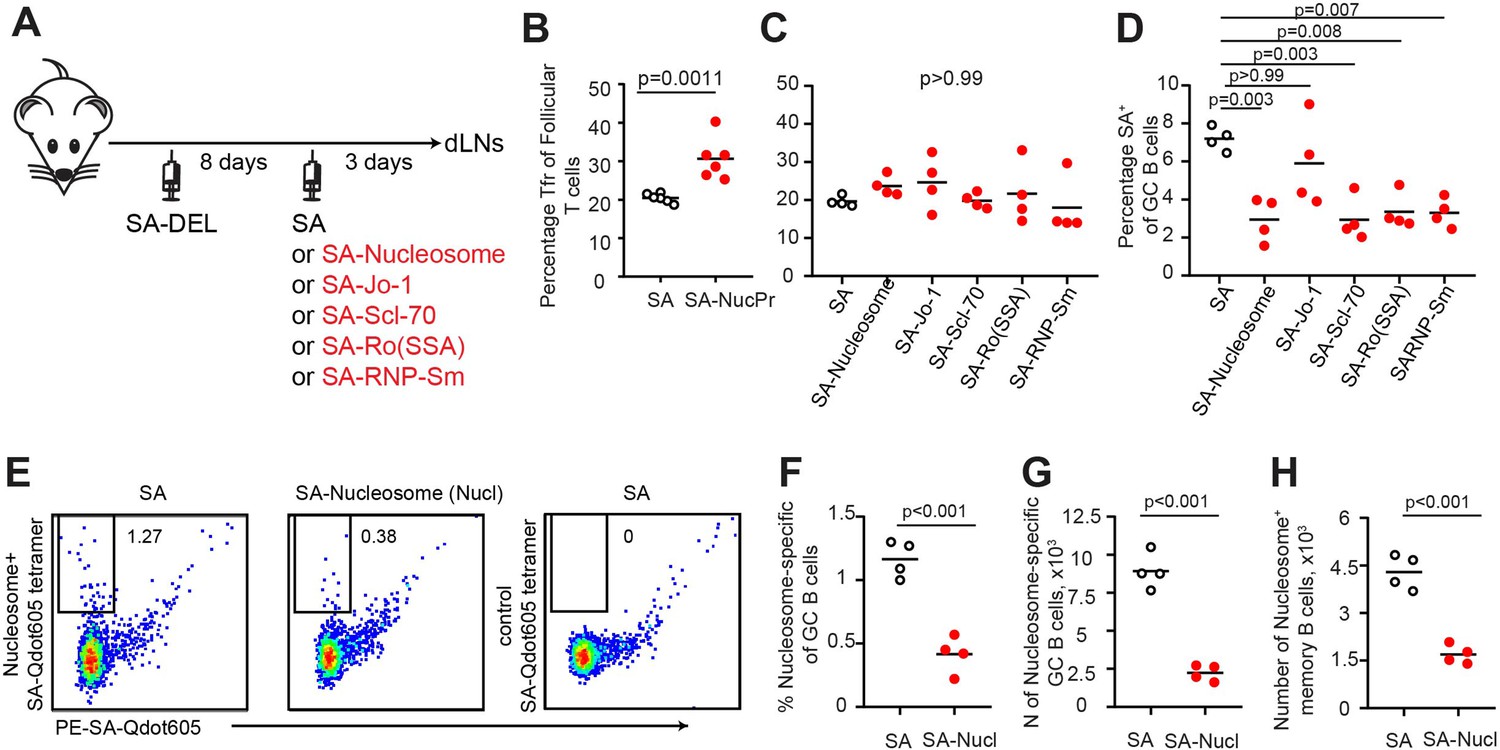
Analysis of follicular regulatory T (Tfr) and germinal center (GC) B cell responses in mice boosted with streptavidin (SA) linked to individual nuclear proteins (NucPrs)/complexes.
(A–D) Analysis of Tfr and SA-specific GC response in B6 mice immunized with SA-DEL in Ribi s.c. and at day 8 s.c. reimmunized with SA, SA-nucleosome, SA-Jo-1, SA-Scl-70, SA-Ro (SSA), or SA-RNP-Sm in Ribi for analysis 3 days later. (A) Experiment outline. (B, C) Tfr percentage of total CD4+B220-CXCR5highPD1high follicular T cells in mice boosted with SA or combined SA-NucPrs (B) and in mice boosted with SA versus separate SA-NucPrs (C). (D) The SA-specific B cells percentage of total GC B cells. (E–H) Analysis of the nucleosome-specific B cells in SA-DEL-immunized mice, boosted with SA or SA-nucleosomes. (E) Representative flow analysis of nucleosome-specific GC B cells. To identify nucleosome-specific and SA-specific GC B cells lymphocytes from draining inguinal lymph nodes (dLNs) were stained with PE-SA-Qdot605 and nucleosome-SA-A647 or control SA-A647 tetramers. (F–H) Nucleosome-specific GC B cells percentage of total GC B cells (F), GC B cell numbers (G), memory B cells (B220+CD3-FASloGL7loCD38hiIgDlo) (H). Data are representative of n=2 independent experiments. Each symbol represents one mouse. Lines indicate means. Two-tailed Student’s t test (for B, F, G, H). One-way ANOVA with Bonferroni’s multiple comparisons test (for C, D).
Figure 7
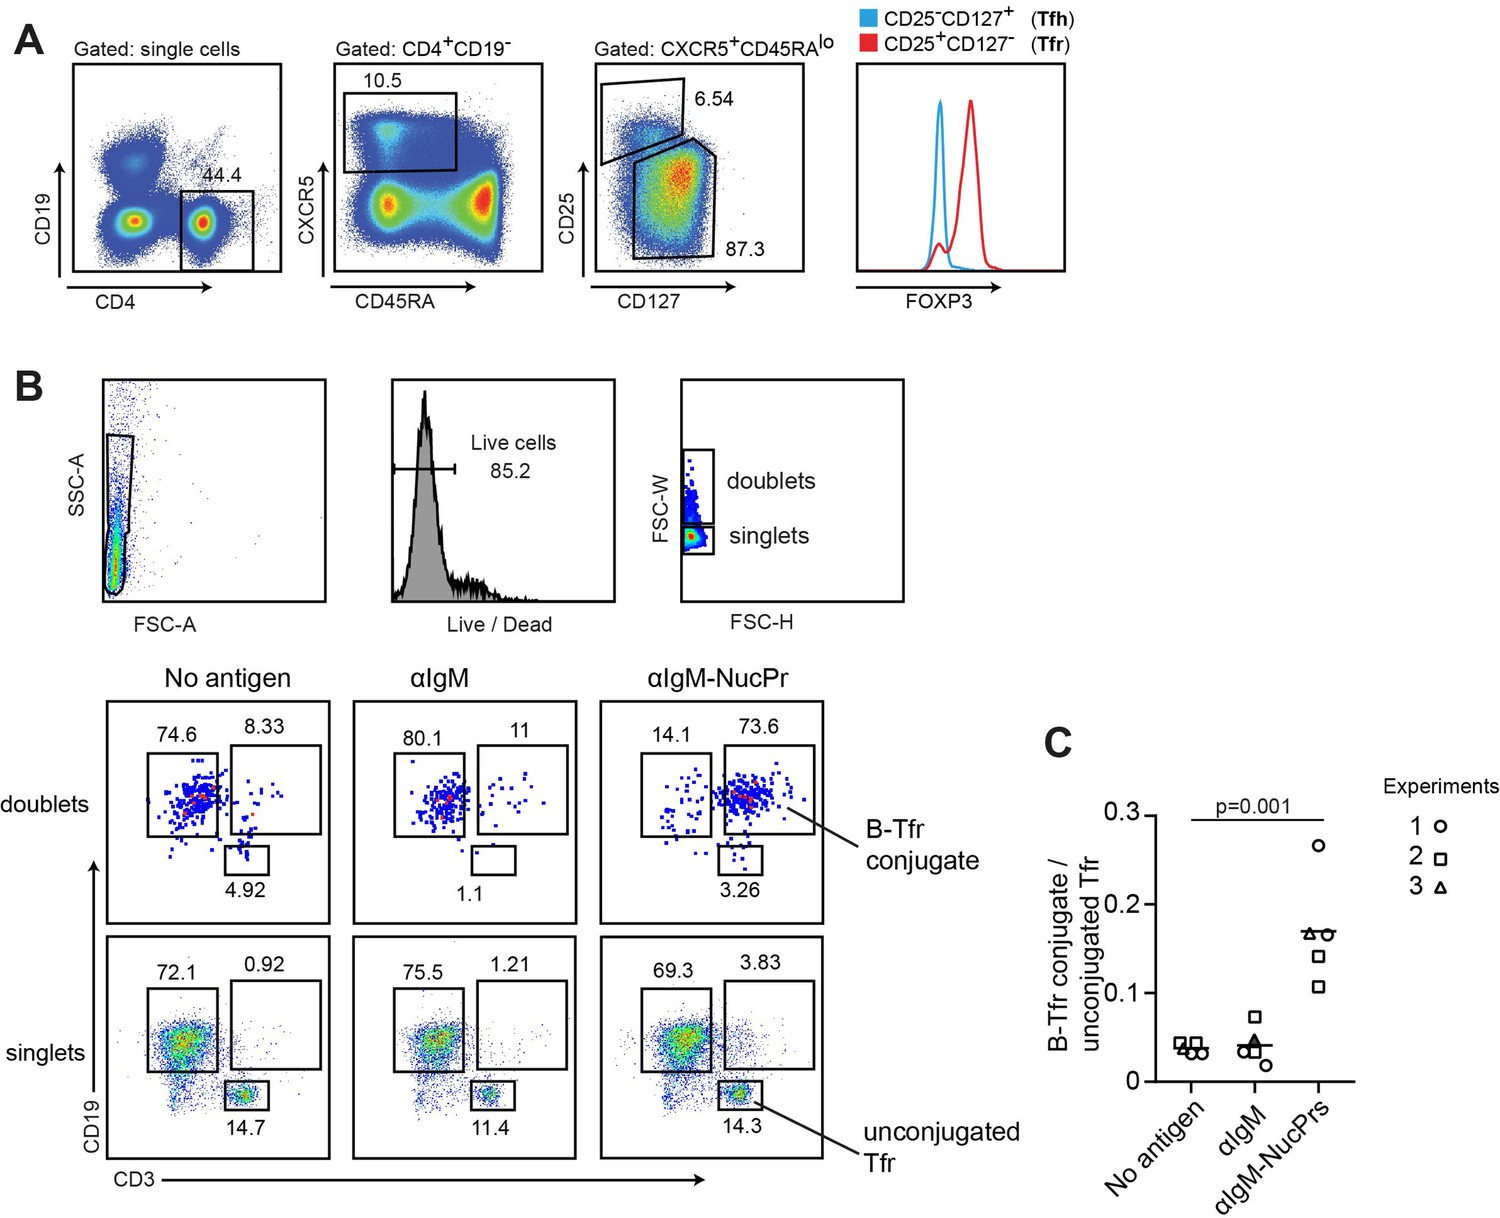
Formation of conjugates between human B cells acquiring nuclear proteins (NucPrs) and follicular regulatory T cells (Tfr).
B cells and Tfr were sorted from human blood. (A) Sorting strategy for Tfr. (B, C) Sorted CD19+CD3-CD27- naïve B cells were incubated ex vivo with αIgM (anti-IgM-SA [opened symbols], anti-IgM-SA-DEL [filled symbol]), αIgM-NucPrs (anti-IgM-SA-NucPrs), or medium for control for 30 min. After that they were cocultured with Tfr from the same patient. (B) Representative example of flow cytometry analysis of singlets and doublets for B-Tfr conjugate formation after 36 hr of coculturing. (C) The ratio of Tfr-B cell conjugates (in doublets) to unbound Tfr (in singlets). Data are from n=3 independent experiments. Each type of symbol represents one patient, one or two replicas. Two-tailed Student’s t test.
Tables
Key resources table
| Reagent type (species) or resource | Designation | Source or reference | Identifiers | Additional information |
|---|---|---|---|---|
| Antibody | Anti-mouse B220 Biotin, clone RA3-6B2 (Rat monoclonal) | BD Bioscience | Cat#553086; PRID:AB 394616 | FC (1:100) |
| Antibody | Anti-mouse B220 Pacific Blue, clone RA3-6B2 (Rat monoclonal) | BioLegend | Cat#103227; PRID:AB 492865 | FC (1:100) |
| Antibody | Anti-mouse B220 PerCP-Cy5.5, clone RA3-6B2 (Rat monoclonal) | BD Bioscience | Cat#552771; PRID:AB 394457 | FC (1:100) |
| Antibody | Anti-mouse B220 V500, clone RA3-6B2 (Rat monoclonal) | BD Bioscience | Cat#561226; PRID:AB 10563910 | FC (1:100) |
| Antibody | Anti-mouse Bcl6 Alexa Fluor 488, clone K112-91 (Mouse monoclonal) | BD Bioscience | Cat#561524; PRID:AB 10716202 | IC (1:20) |
| Antibody | Anti-mouse CD3 Alexa Fluor 700, clone 17A2 (Rat monoclonal) | BioLegend | Cat#100216; PRID:AB 493697 | FC (1:100) |
| Antibody | Anti-mouse CD3 PE-CF594, clone 145–2C11 (Hamster monoclonal) | BD Bioscience | Cat#562286; PRID:AB 11153307 | IC (1:100) |
| Antibody | Anti-mouse CD4 APC/Cy7, clone RM4-5 (Rat monoclonal) | BioLegend | Cat#100526; PRID:AB 312727 | FC (1:100) |
| Antibody | Anti-mouse CD4 FITC clone RM4-5 (Rat monoclonal) | BD Bioscience | Cat#553047; PRID:AB 394583 | FC (1:100) |
| Antibody | Anti-mouse CD4 V500 clone RM4-5 (Rat monoclonal) | BD Bioscience | Cat#560782; PRID:AB 1937315 | FC (1:100) |
| Antibody | Anti-mouse CD8a APC/Cy7, clone 53–6.7 (Rat monoclonal) | BioLegend | Cat#100714; PRID:AB 312753 | FC (1:100) |
| Antibody | Anti-mouse CD8a Pacific Blue, clone 53–6.7 (Rat monoclonal) | BioLegend | Cat#100725; PRID:AB 493425 | FC (1:100) |
| Antibody | Anti-mouse CD8a V500 clone 53–6.7 (Rat monoclonal) | BD Bioscience | Cat#560776; PRID:AB 1937317 | FC (1:100) |
| Antibody | Anti-mouse CD8a Biotin clone 53–6.7 (Rat monoclonal) | BD Bioscience | Cat#553029; PRID:AB 394567 | FC (1:100) |
| Antibody | Anti-mouse CD25 BV421, clone PC61 (Rat monoclonal) | BioLegend | Cat#102034; PRID:AB11203373 | FC (1:100) |
| Antibody | Anti-mouse CD38 PerCP-Cy5.5, clone 90/CD38 (Rat monoclonal) | BD Bioscience | Cat#562770; PRID:AB 2737782 | FC (1:100) |
| Antibody | Anti-mouse CD95 PE-Cy7, clone Jo2 (Armenian hamster Monoclonal) | BD Bioscience | Cat#557653; PRID:AB 396768 | FC (1:100) |
| Antibody | Anti-mouse CD185 (CXCR5) BV605, clone L138D7 (Rat monoclonal) | BioLegend | Cat#145513; PRID:AB 2562208 | FC (1:50) |
| Antibody | Anti-mouse CD279 (PD-1) PE-Cy7, clone RMP1-30 (Rat monoclonal) | BioLegend | Cat#109110; PRID:AB 572017 | FC (1:100) |
| Antibody | Anti-mouse Foxp3 APC, clone FJK-16s (Rat monoclonal) | eBioscience | Cat#17-5773-82; PRID:AB 469457 | FC (1:100) |
| Antibody | Anti-mouse GL7 eFluor 450, clone GL-7 (Rat monoclonal) | eBioscience | Cat#48-5902-82; PRID:AB 10870775 | FC (1:100) |
| Antibody | Anti-mouse GL7 eFluor 660, clone GL-7 (Rat monoclonal) | eBioscience | Cat#50-5902-82; PRID:AB 2574252 | FC (1:100) |
| Antibody | Anti-mouse IgD APC/Cy7 clone 11–26c.2a (Rat monoclonal) | BioLegend | Cat#405716; PRID:AB 10662544 | FC (1:100) |
| Antibody | Anti-mouse IgG(H+L) HRP (Goat polyclonal) | Thermo Fisher Scientific | Cat#62–6520; PRID:AB 88369 | ELISA (1:2000) |
| Antibody | Anti-mouse Ig(H+L) Alexa Fluor 488 (Goat polyclonal) | Southern Biotech | Cat#1010–30; PRID:AB 2794130 | FC (1:100) |
| Antibody | Anti-human CD3 AF700, clone OKT3 (Mouse monoclonal) | BioLegend | Cat#317339; PRID:AB 2563407 | FC (1:100) |
| Antibody | Anti-human CD19 Pacific Blue, clone SJ25C1 (Mouse monoclonal) | BioLegend | Cat#363036; PRID:AB 2632787 | FC (1:100) |
| Antibody | Anti-human FoxP3 AF488, clone 259D (Mouse monoclonal) | BioLegend | Cat#320211; PRID:AB 430886 | FC (1:20) |
| Antibody | Anti-human CD4 BV510 clone RPA-T4 (Mouse monoclonal) | BioLegend | Cat#300545; PRID:AB 2563313 | FC (1:100) |
| Antibody | Anti-human CD127 BV605, clone A019D5 (Mouse monoclonal) | BioLegend | Cat#351333; PRID:AB 2562019 | FC (1:100) |
| Antibody | Anti-human CD25 PE, clone M-A251 (Mouse monoclonal) | BioLegend | Cat#356103; PRID:AB 2561860 | FC (1:100) |
| Antibody | Anti-human CD45RA APC-Cy7, clone HI100 (Mouse monoclonal) | BioLegend | Cat#304127; PRID:AB 10708419 | FC (1:100) |
| Antibody | Anti-human CXCR5 AF647, clone RF8B2 (Rat monoclonal) | BioLegend | Cat#558113; PRID:AB 2737606 | FC (1:50) |
| Antibody | Anti-human CD27 FITC clone M-T271 (Mouse monoclonal) | BD Bioscience | Cat#555440; PRID:AB 395833 | FC (1:100) |
| Antibody | Anti-human IgM Biotin F(ab’)2 fragment (Goat polyclonal) | Jackson Immuno Research Labs | Cat#109-066-129; PRID:AB 2337642 | 5 µg/ml for activation |
| Chemical compound, drug | Ficoll-Paque Plus | GE Healthcare | Cat#17-1440-02 | |
| Commercial assay or kit | EZ-Link Sulfo-NHS-LC-Biotin | Thermo Fisher Scientific | Cat#A39257 | |
| Chemical compound, drug | Fluoromount-G | SouthernBiotech | Cat#0100–01 | |
| Commercial assay or kit | 1-step Ultra TMB-ELISA Substrate Solution | Thermo Fisher Scientific | Cat#34028 | |
| Commercial assay or kit | Foxp3/Transcription Factor staining Buffer Set | eBioscience | Cat#00-5523-00 | |
| Chemical compound, drug | Gelatin blocking buffer 1% in PBS | Alfa Aesar | Cat#J62755 | |
| Peptide, recombinant protein | Recombinant Human CD40L | BioLegend | Cat#591702 | |
| Peptide, recombinant protein | Ovalbumine | Sigma | Cat#A5503-5G | |
| Peptide, recombinant protein | Duck Egg Lysozyme | (Allen, C.D. et al., 2007). | Purified from Duck eggs | |
| Chemical compound, drug | CM Sephadex C-25 beads | GE Healthcare | Cat#17-0210-01 | |
| Chemical compound, drug | Sephadex G-50 medium beads | GE Healthcare | Cat#17-0043-01 | |
| Chemical compound, drug | Sephadex G-100 beads | GE Healthcare | Cat#17-0060-01 | |
| Chemical compound, drug | Sigma Adjuvant System | Sigma | Cat#S6322-1VL | |
| Peptide, recombinant protein | Streptavidin | Sigma | Cat#S4762-5MG | |
| Peptide, recombinant protein | Streptavidin PE | BioLegend | Cat#405204 | |
| Peptide, recombinant protein | Streptavidin Qdot 605 | Thermo Fisher Scientific | Cat#Q10101MP | |
| Peptide, recombinant protein | Streptavidin Qdot 647 | Thermo Fisher Scientific | Cat#S21374 | |
| Peptide, recombinant protein | Streptavidin Qdot 655 | Thermo Fisher Scientific | Cat#Q10121MP | |
| Peptide, recombinant protein | Nucleosome | AROTEC DIAGNOSTICS | ATN02-02 | |
| Peptide, recombinant protein | Jo-1 | AROTEC DIAGNOSTICS | ATJ01-02 | |
| Peptide, recombinant protein | Scl-70 | AROTEC DIAGNOSTICS | ATS01-02 | |
| Peptide, recombinant protein | Ro (SSA) | AROTEC DIAGNOSTICS | ATR02-02 | |
| Peptide, recombinant protein | RNP-Sm | AROTEC DIAGNOSTICS | ATR01-02 | |
| Strain, strain background (Mus musculus) | C57BL/6J | The Jackson Laboratory | JAX:000664 | Wild-type (males and females) |
| Strain, strain background (Mus musculus) | Bcl6fl/fl | Hollister et al., 2013 | (Males and females) | |
| Strain, strain background (Mus musculus) | Foxp3-Yfpcre | Rubtsov et al., 2008 | (Males and females) | |
| Strain, strain background (Mus musculus) | NZM2328 | Jacob et al., 2003 | Females | |
| Software, algorithm | FlowJo V10 | FlowJo | https://www.flowjo.com/ | |
| Software, algorithm | GraphPad Prism 8 | GraphPad | https://www.graphpad.com/ | |
| Software, algorithm | Imaris | Bitplane | https://imaris.oxinst.com/ | |
| Software, algorithm | Adobe Illustrator | Adobe | https://www.adobe.com/ | |
| Software, algorithm | Loupe Browser 6.0 | 10× Genomics, Cell Ranger | https://www.10xgenomics.com | |
| Software, algorithm | Loupe VDJ Browser 4.0 | 10× Genomics, Cell Ranger | https://www.10xgenomics.com | |
| Software, algorithm | ImageJ2 | ImageJ | https://imagej.nih.gov/ij/ |
Additional files
-
Supplementary file 1
Table 1: Significant genes in the clusters 1–12 of murine follicular T cells.
Single-cell 10× Genomics (Cell Ranger) analysis of gene expression in Foxp3 expressing CD4+CD8-B220-CXCR5hiPD1hi cells sorted from the draining inguinal lymph nodes (dLNs) of mice treated as described in Figure 1A. Follicular regulatory T cells (Tfr) were reclustered in Loupe software (Cell Ranger) based on gene expression into clusters 1–12 (see Figure 2). Statistical significance of mean gene expression in Tfr cluster compared to other Tfr was calculated based on negative binomial test (Cell Ranger).
- https://cdn.elifesciences.org/articles/83908/elife-83908-supp1-v1.zip
-
MDAR checklist
- https://cdn.elifesciences.org/articles/83908/elife-83908-mdarchecklist1-v1.docx
Download links
A two-part list of links to download the article, or parts of the article, in various formats.
Downloads (link to download the article as PDF)
Open citations (links to open the citations from this article in various online reference manager services)
Cite this article (links to download the citations from this article in formats compatible with various reference manager tools)
Germinal center B cells that acquire nuclear proteins are specifically suppressed by follicular regulatory T cells
eLife 12:e83908.
https://doi.org/10.7554/eLife.83908


