Kidins220 regulates the development of B cells bearing the λ light chain
- Faculty of Biology, Albert-Ludwigs-University of Freiburg, Germany
- Signalling Research Centers BIOSS and CIBSS, University of Freiburg, Germany
- Center of Chronic Immunodeficiency CCI, University Clinics and Medical Faculty, Germany
- Department of Dermatology and Allergy Biederstein, School of Medicine, Technical University of Munich, Germany
- Institute of Medical Engineering and Medical Informatics, School of Life Sciences, FHNW 15 University of Applied Sciences and Arts Northwestern Switzerland, Switzerland
- Max Planck Institute of Immunobiology and Epigenetics, Germany
- CIBSS – Centre for Integrative Biological Signalling Studies, University of Freiburg, Germany
- Division of Clinical and Experimental Immunology, Institute of Immunology, Center for Pathophysiology, Infectiology and Immunology, Medical University of Vienna, Austria
- Department of Rheumatology and Clinical Immunology, University Medical Center Freiburg, Faculty of Medicine, University of Freiburg, Germany
- aiNET GmbH, Switzerland
- SIB Swiss Institute of Bioinformatics, Switzerland
Figures
Figure 1 with 1 supplement
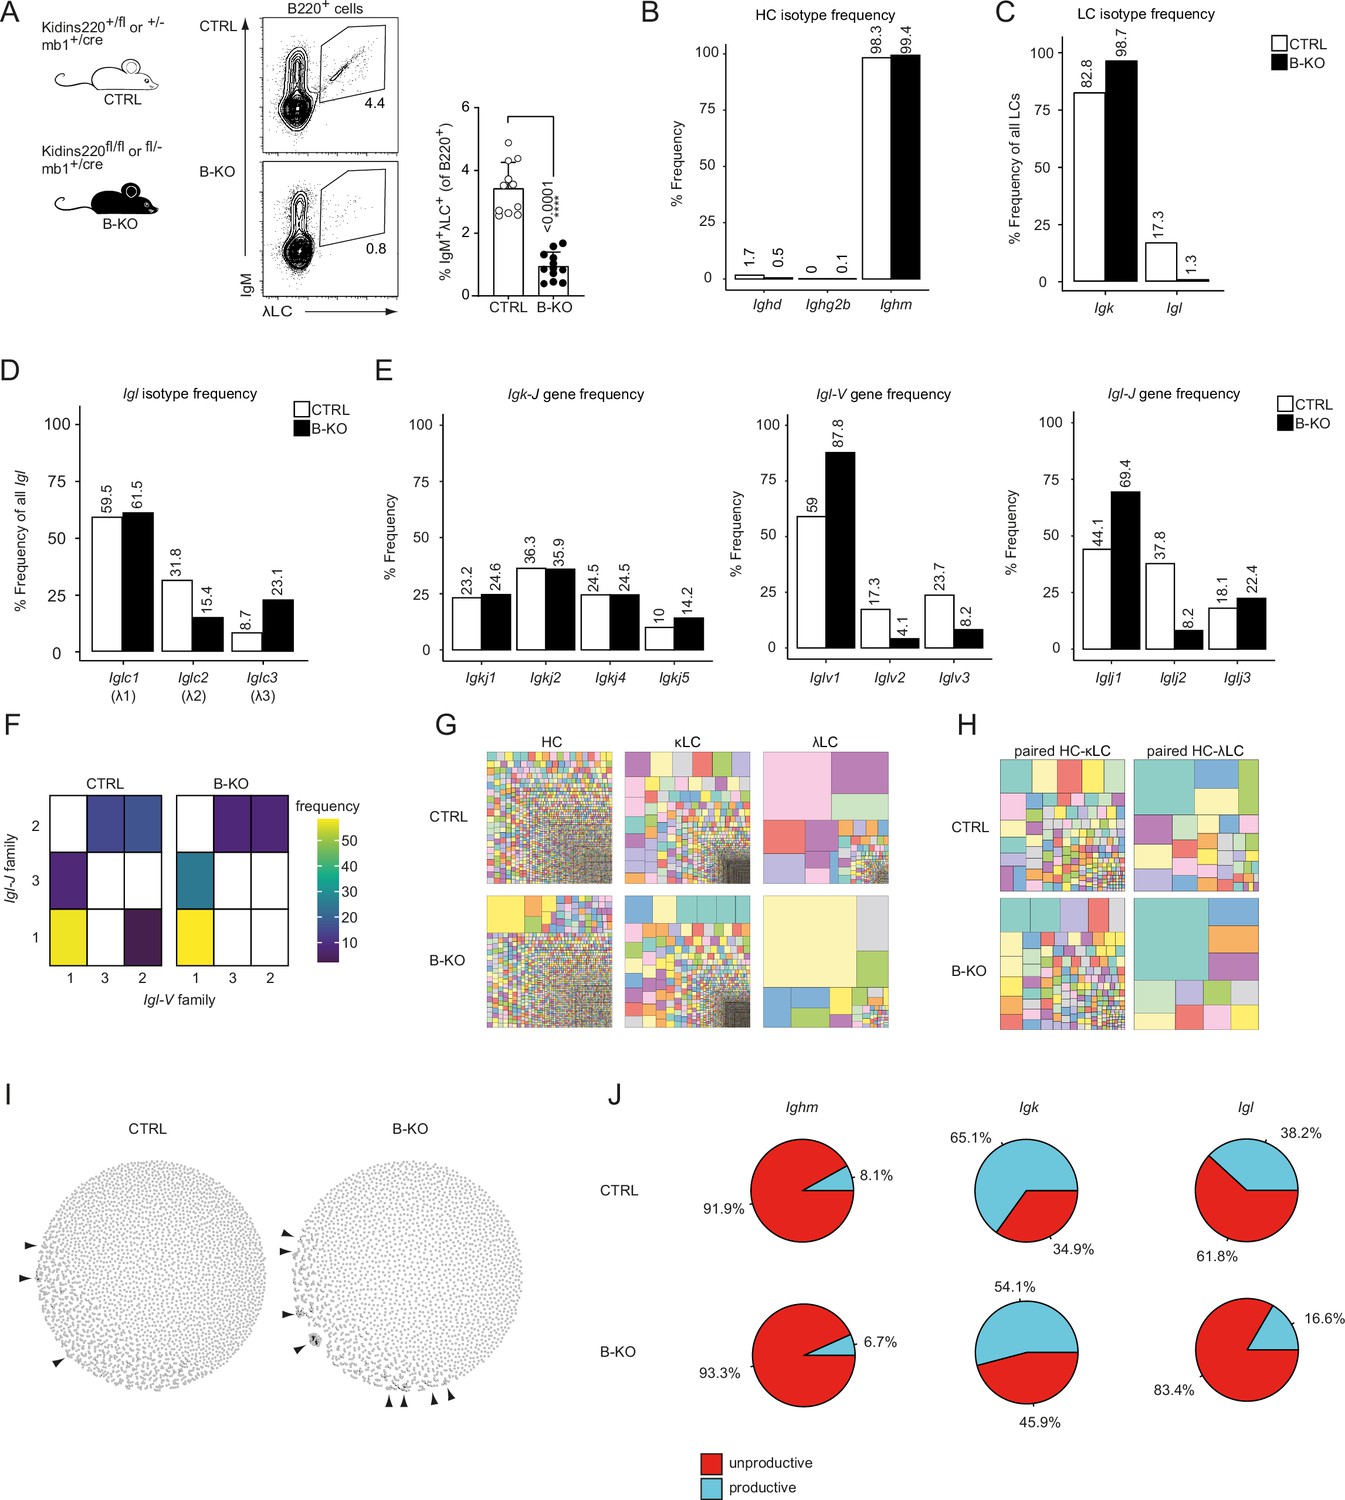
Kidins220 immature B-KO cells show a skewed primary BCR repertoire.
(A) Schematics of the genotypes of the Kidins220 locus and cre-recombinase expression for control (CTRL) and B cell specific knockout (B–KO) mice (left). Representative flow cytometric BM analysis using antibodies for B220, IgM and λLC as well as statistical quantification (right, five independent experiments were pooled; n=11–12 mice per genotype). The mean + SD is plotted. Statistical analysis was performed using unpaired Student’s t-test. p-value is indicated. (B–J) Immature B cells (B220+IgM+IgD-) of three individual mice per genotype were pooled and subjected to single cell sequencing analyzing full-length Ig-gene V(D)J recombination status and BCR repertoire based on cDNA. More than 10,000 cells per genotype were analyzed. Only productive recombinations are used for the analyses in (B–I). The frequencies of the individual HCs (B) and LCs (C) isotypes in CTRL and B-KO of all obtained sequences are plotted. (D) Relative frequencies of the individual λLC families are depicted. (E) The Frequencies of V- and J-gene sequences of the Igk and Igl loci of all obtained V- or J-gene sequences within the respective LC isotype are plotted. (F) Heatmap of the Igl-V-J gene combinations of the λLC. (G) Tree maps illustrating clonal CDR3 frequency of HC, κLC, and λLC. Each square represents an individual CDR3, and its frequency correlates with the square size. (H) Tree maps illustrating the clonal CDR3 frequency of the whole BCR (paired HC-LC). Each square represents an individual CDR3, and its frequency correlates with the square size. (I) Primary antibody repertoire networks showing unique CDR3 sequences (nodes) as individual dots. Dots are connected via similarity edges only when their sequence differs in just one amino acid. Clustered dots indicative of clonal expansion are indicated with arrowheads. (J) Productive and unproductive read frequencies.
-
Figure 1—source data 1
Kidins220 immature B-KO cells show a skewed primary BCR repertoire (Figure 1 and Figure 1—figure supplement 1).
- https://cdn.elifesciences.org/articles/83943/elife-83943-fig1-data1-v2.xlsx
Figure 1—figure supplement 1
Immature B-KO B cells show a skewed primary BCR repertoire.
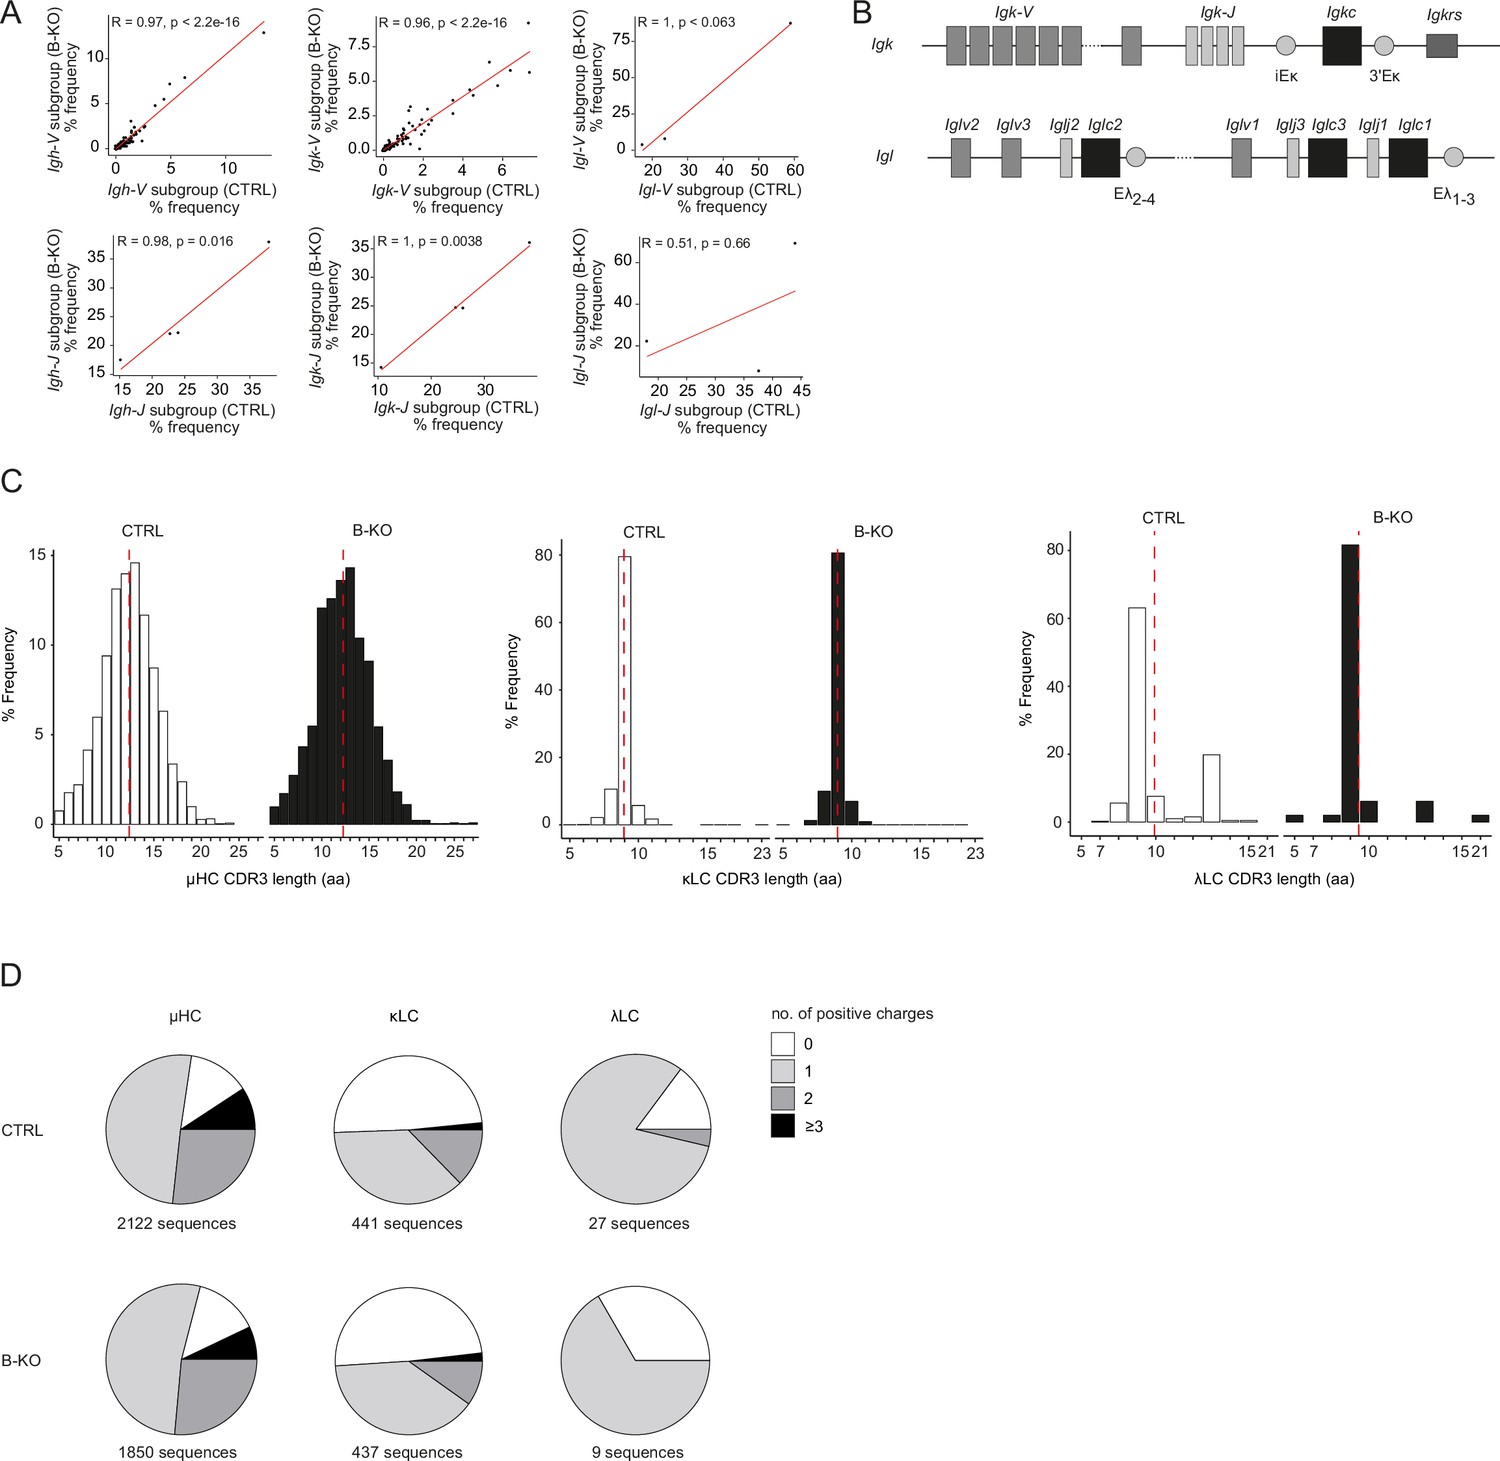
(A, C, D) Immature B cells (B220+IgM+IgD-) of three individual mice per genotype were pooled and subjected to single cell sequencing analyzing full-length Ig-gene V(D)J recombination status and BCR repertoire based on cDNA. More than 10,000 cells per genotype were analyzed. Only productive recombinations are used for the analysis. (A) Correlation of V- and J-gene usage in Igh, Igk, and Igl loci between CTRL and B-KO immature B cells. Pearson correlation coefficient (R) and pvalues are shown. Sequence frequencies of the individual V- and J-subgroup genes of all obtained V- and J-gene sequences within an individual Ig chain are plotted. (B) Schematic representation of the murine Igk and Igl loci. The CDR3 length (C) and amount of positive amino acids (D) for HC, κLC, and λLC are depicted. Sequence frequencies and distribution within an individual Ig chain are plotted. Mean is represented by a red dotted line (C).
Figure 2 with 1 supplement
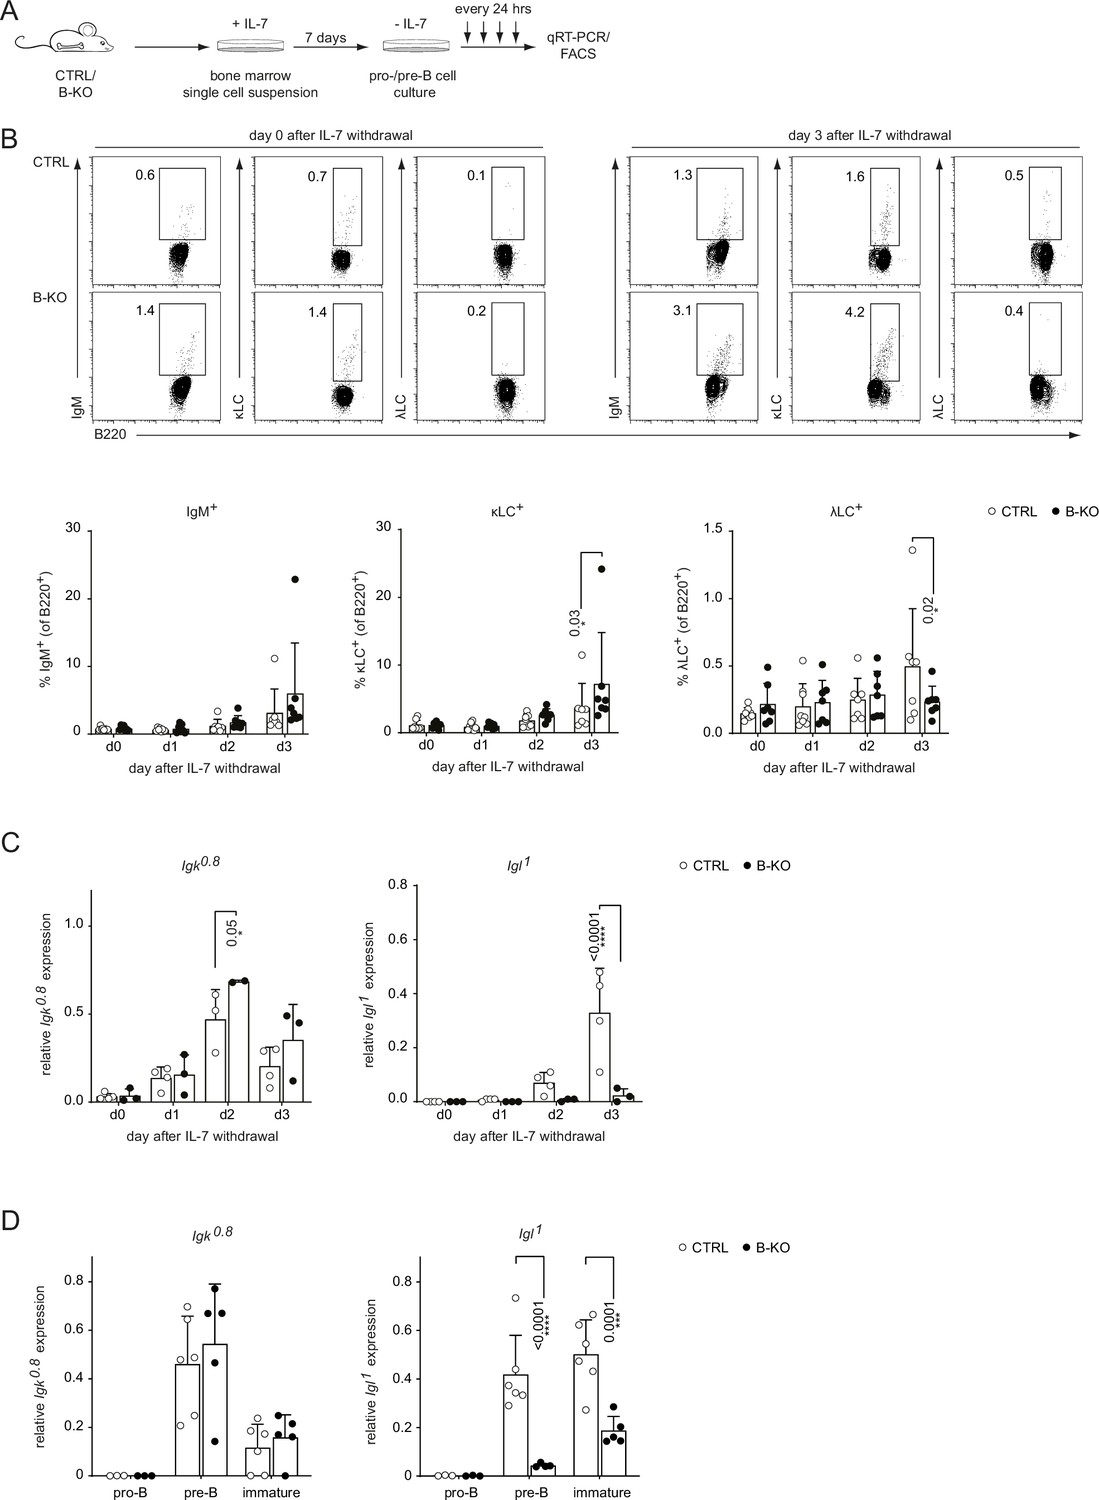
Kidins220 is required for the opening of the Igl locus in pro-/pre-B cells.
(A) Experimental setup to generate primary BM derived pro-/pre-B cell cultures. Total BM was isolated from CTRL and B-KO mice and cultured for 7 days in medium supplemented with IL-7. Next, IL-7 was removed, and samples were taken immediately (day 0) and every 24 hr for subsequent analyses. (B) Flow cytometry assayed surface expression of B220, IgM, λLC, and κLC. Representative plots of day 0 and day 3 as well as statistical analyses are shown (n=7–8 per genotype). (C, D) Isolated RNA was reverse transcribed to assay the relative expression of germline transcripts of the Igk and Igl loci by qRT-PCR. (C) Normalization was done using Hrpt (n=2–4 per genotype). (D) Pro-B cells (B220+CD117+CD25-IgM-), pre-B cells (B220+CD117-CD25+IgM-) and immature B cells (B220+IgM+IgD-) were FACS sorted from CTRL and B-KO mice. Normalization was done using Hrpt and Actb (n=3–6 per genotype). In all graphs, the mean + SD is plotted. Each symbol represents one mouse. Statistical analysis was performed using Two-way ANOVA with Fisher’s (Least Significant Difference) LSD test. Only p-values <0.05 are indicated.
-
Figure 2—source data 1
Kidins220 is required for the opening of the Igl locus in pro-/pre-B cells.
- https://cdn.elifesciences.org/articles/83943/elife-83943-fig2-data1-v2.xlsx
Figure 2—figure supplement 1
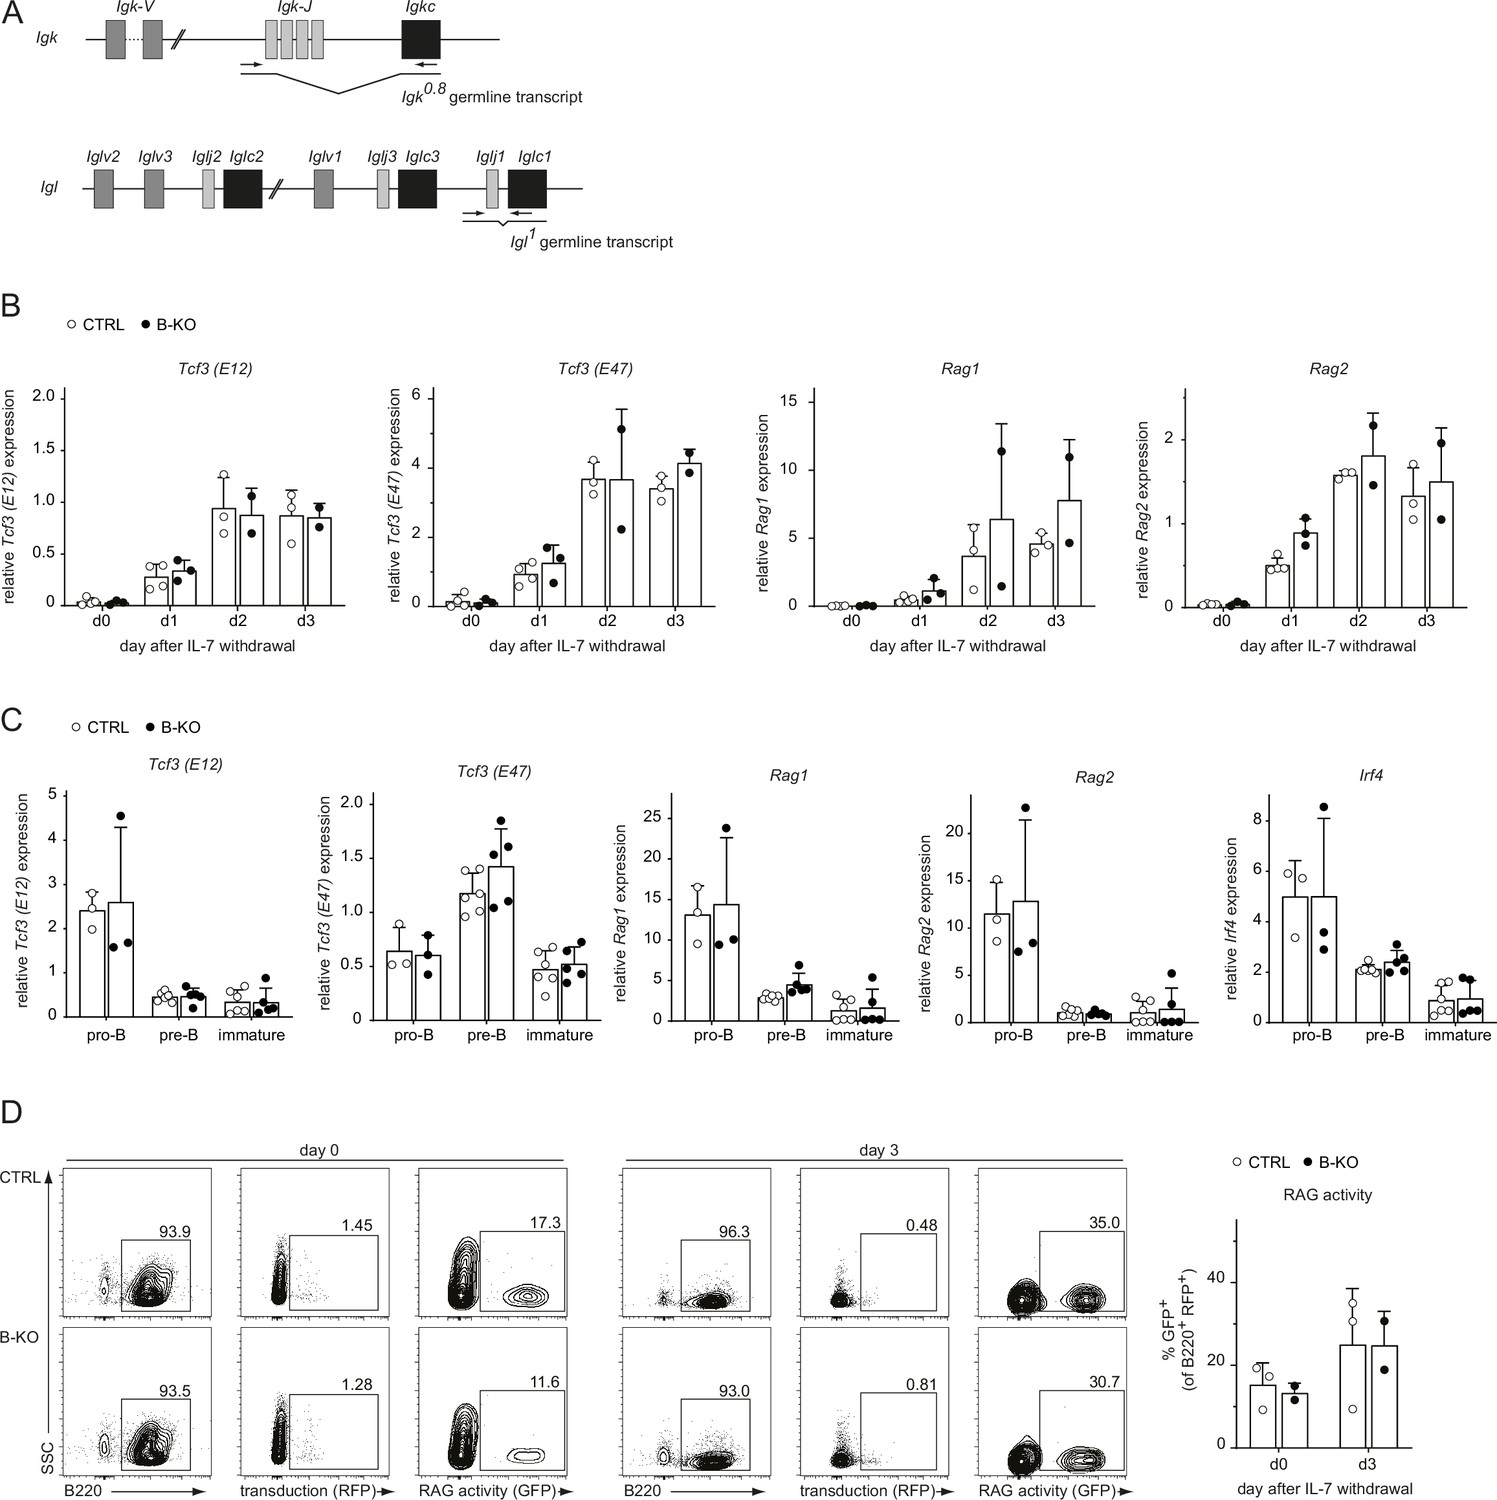
The transcriptional network controlling LC recombination as well as RAG protein activity are independent of Kidins220.
(A) Schematic representation of the primer position (black arrows) for the detection of the Igk0.8 and Igl1 germline transcripts. (B) RNA isolated from pro-/pre-B cell cultures after IL-7 withdrawal was reverse transcribed to assess the relative expression of mRNA transcripts of Tcf3 (encoding for E12 and E47), Rag1 and Rag2 genes by qRT-PCR. Normalization was done using Hrpt (n=2–4 mice per genotype). (C) Pro-B cells (B220+CD117+CD25-IgM-), pre-B cells (B220+CD117-CD25+IgM-) and immature B cells (B220+IgM+IgD-) were FACS sorted from CTRL and B-KO mice. RNA was isolated and reverse transcribed to assess the relative expression of the indicated mRNA transcripts. Normalization was done using Hrpt and Actb (n=3–6 mice per genotype). (D) Pro-/pre-B cell cultures were retrovirally transduced with GFPi reporter plasmids at day 7 of IL-7 culture. Two days later, IL-7 was withdrawal. Cells transduced with the plasmid (RFP+ cells) were further analyzed for GFP expression at days 0 and 3 of IL-7 withdrawal. Representative dot plots and gating strategy (left) as well as statistical analysis (right) are shown. (n=2–3 per genotype). Each symbol represents one mouse. In all graphs, the mean + SD is plotted. Statistical analysis was performed using Two-way ANOVA with Fisher’s LSD test. Only p-values <0.05 are indicated.
-
Figure 2—figure supplement 1—source data 1
Kidins220 is required for the opening of the Igl locus in pro-/pre-B cells.
- https://cdn.elifesciences.org/articles/83943/elife-83943-fig2-figsupp1-data1-v2.xlsx
Figure 3 with 1 supplement
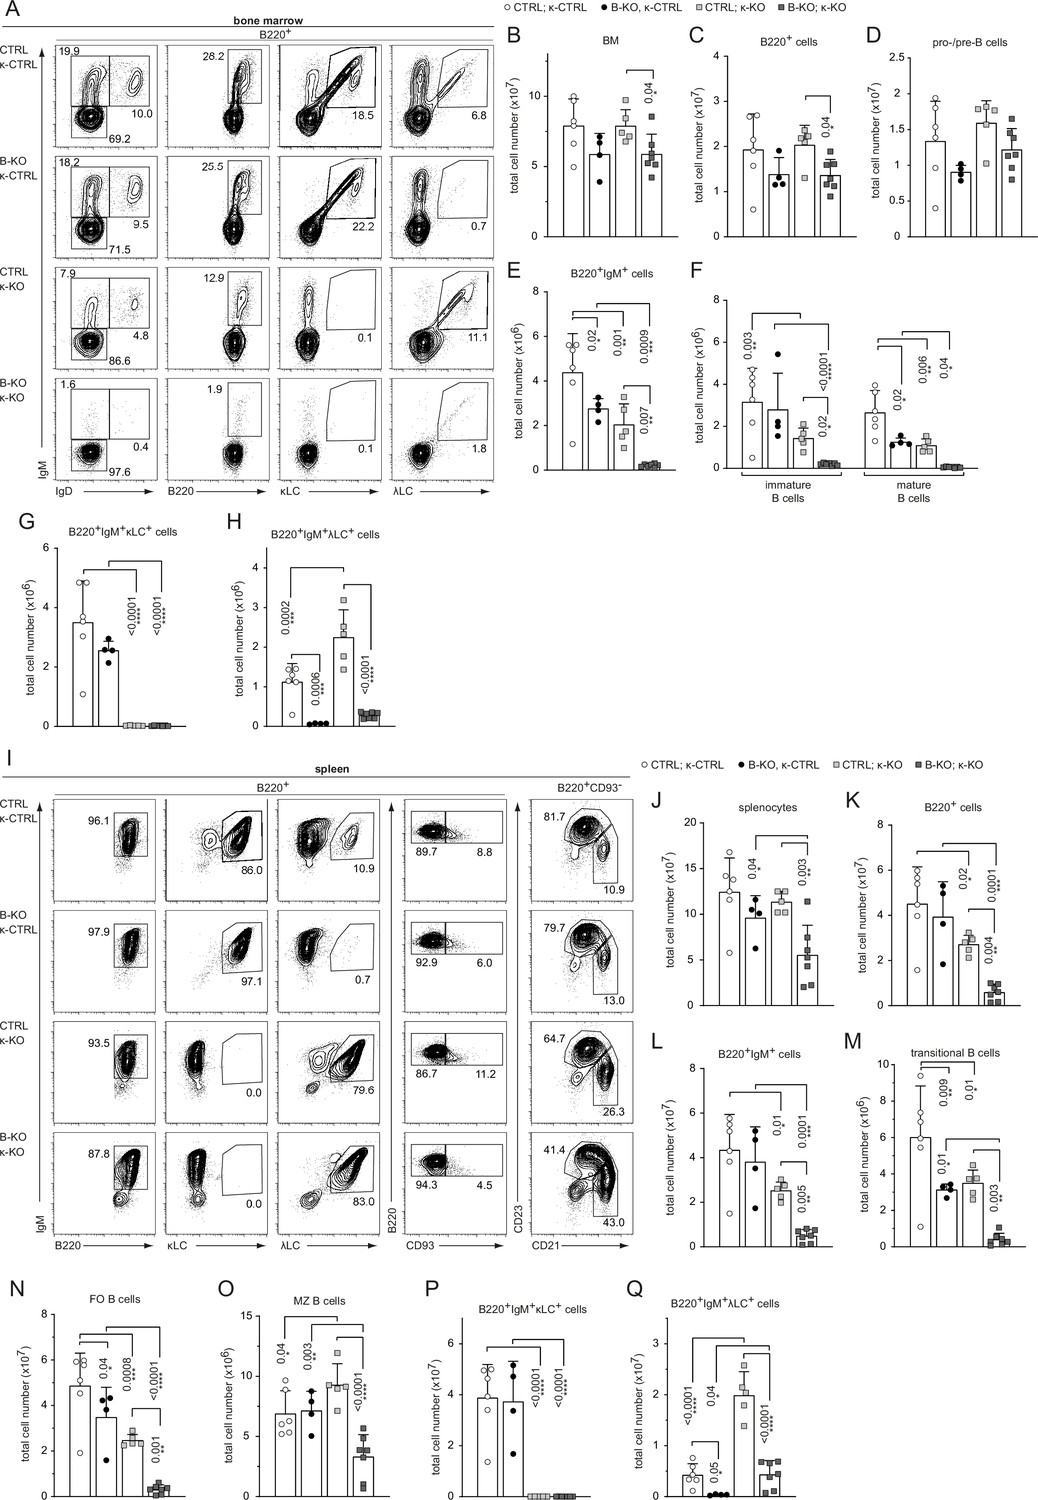
Kidins220 is required for the generation of λLC-bearing B cells even in κ-KO mice.
(A, I) Representative flow cytometric analysis of the BM (A) and spleen (I) of CTLR and B-KO mice in κ-sufficient (κ-CTRL) and -deficient (κ-KO) backgrounds. (B-H; J–Q) Total cell numbers for each B cell compartment from BM (B–H) and spleen (J–Q). Pro-/pre-B cells are defined as B220+IgM-IgD-, immature B cells as B220+IgM+IgD-, mature B cells as B220+IgM+IgD+, transitional B cells as B220+CD93+, follicular (FO) B cells as B220+CD93-IgM+CD21medCD23high and marginal zone (MZ) B cells as B220+CD93-IgM+CD21highCD23med. For the quantification, three independent experiments with n=4–7 mice per genotype were pooled. Each symbol represents one mouse. In all graphs, the mean + SD is plotted. Statistical analysis was performed using Two-way ANOVA (F) or One-way ANOVA with Fisher’s LSD test. Only p-values <0.05 are indicated.
-
Figure 3—source data 1
Kidins220 is required for the generation of λLC-bearing B cells even in κ-KO mice.
- https://cdn.elifesciences.org/articles/83943/elife-83943-fig3-data1-v2.xlsx
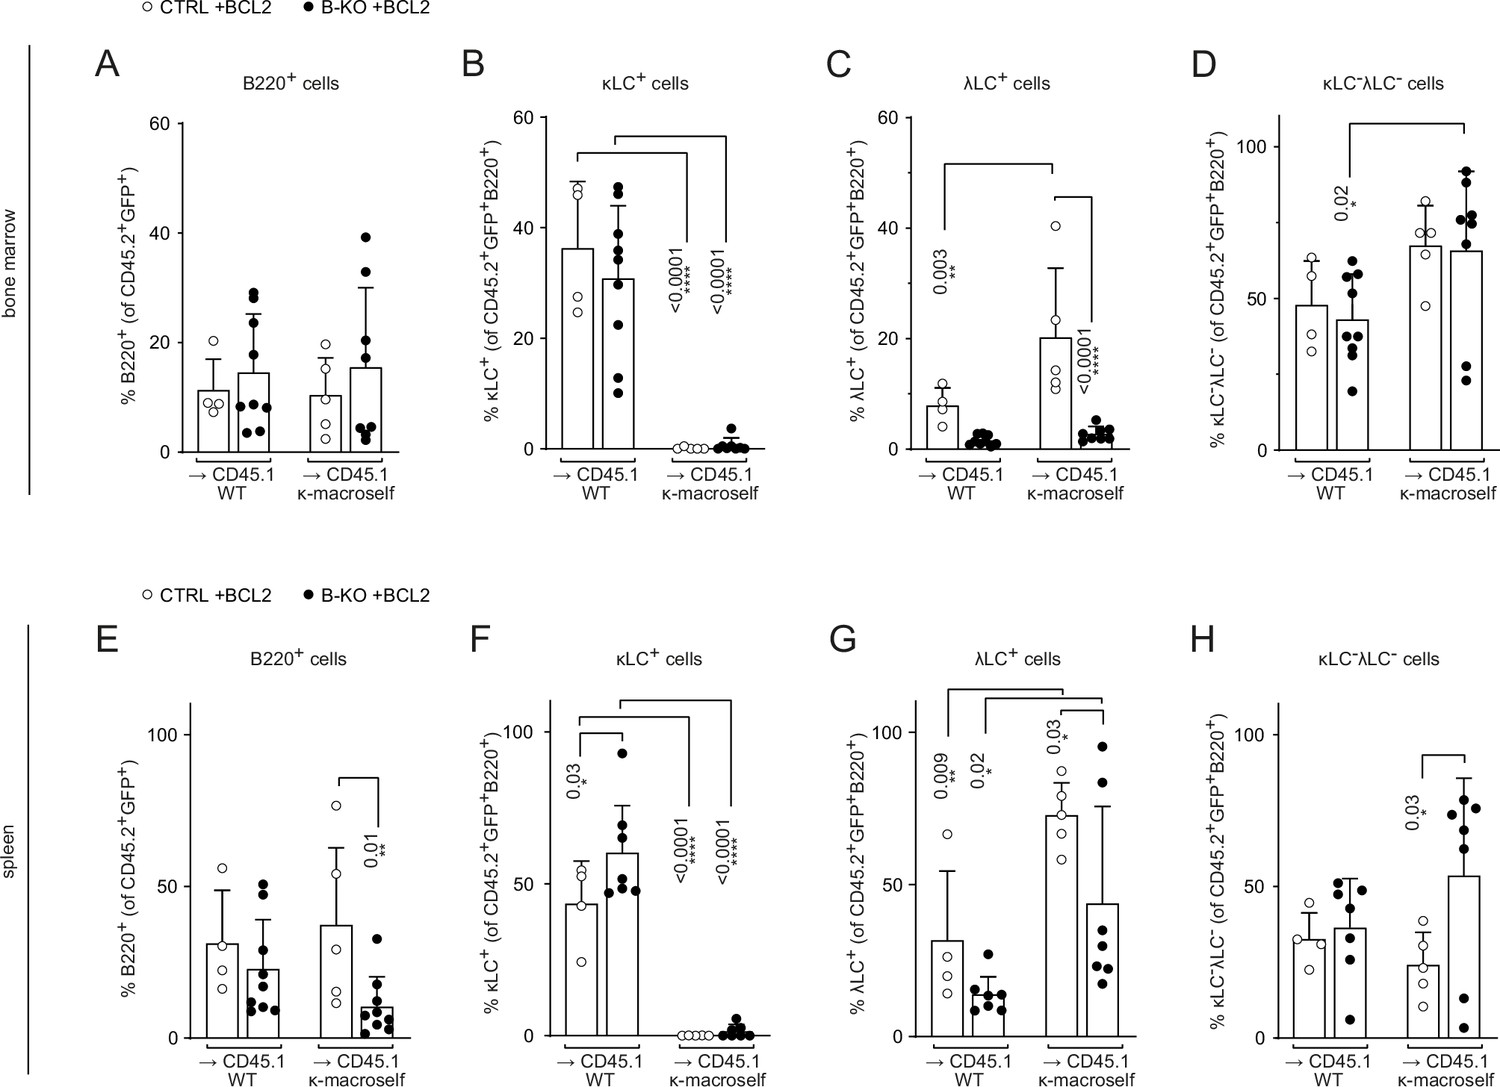
Figure 3—figure supplement 1
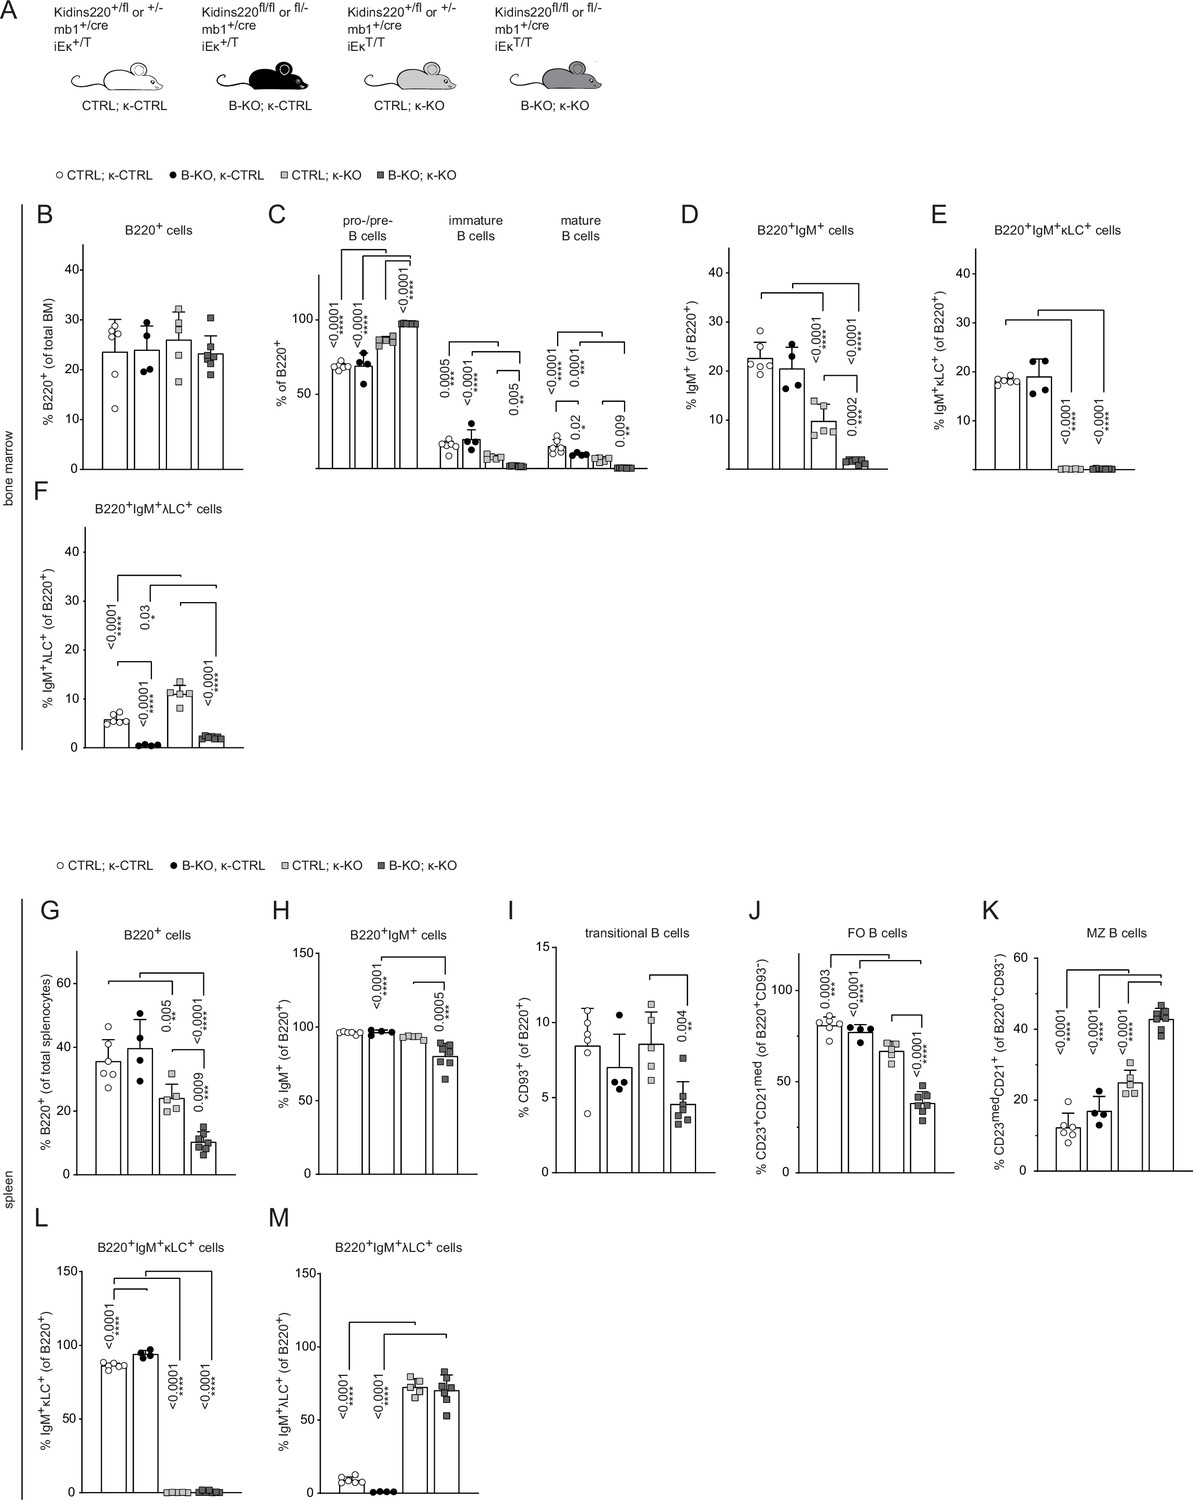
Kidins220 is required for the generation of λLC bearing B cells even in κ-KO mice.
(A) Genotypes of the Kidins220 locus, the mb1 Cre-recombinase expression, and the Igκ locus for CTRL and B-KO mice carrying a neomycin resistance gene (T) heterozygously (κ-CTRL) or homozygously (κ-KO) in the Igk locus. (B-F; G–M) Statistical analysis of the relative cell numbers of B cell subpopulations in the BM (B–F) and spleen (G–M). Pro-/pre-B cells were defined as B220+IgM-IgD-, immature B cells as B220+IgM+IgD-, mature B cells as B220+IgM+IgD+, transitional B cells as B220+CD93+, follicular (FO) B cells as B220+CD93-IgM+CD21medCD23high and marginal zone (MZ) B cells as B220+CD93-IgM+CD21highCD23med. Quantification of three independent experiments with n=4–7 mice per genotype. Each symbol represents one mouse. In all graphs, the mean + SD is plotted. Statistical analysis was performed using Two-way ANOVA (C) or One-way ANOVA with Fisher’s LSD test. Only p-values <0.05 are indicated.
-
Figure 3—figure supplement 1—source data 1
Kidins220 is required for the generation of λLC bearing B cells even in κ-KO mice.
- https://cdn.elifesciences.org/articles/83943/elife-83943-fig3-figsupp1-data1-v2.xlsx
Figure 4 with 1 supplement
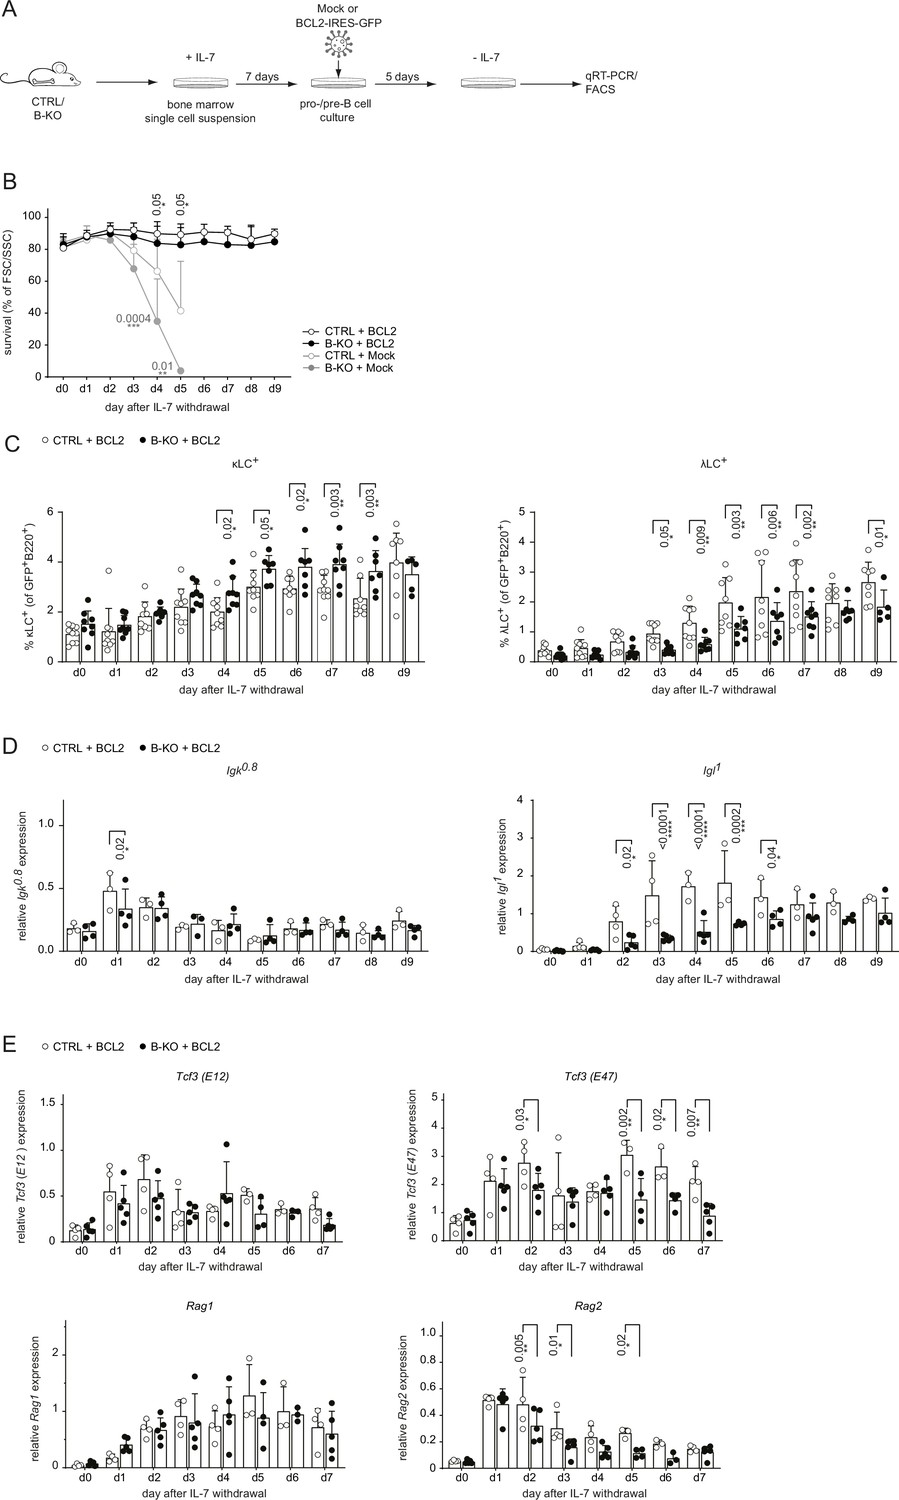
BCL2-mediated survival partially rescues λLC deficiency in vitro.
(A) Experimental setup to generate primary BM-derived pro-/pre-B cell cultures overexpressing BCL2. Total BM was isolated from CTRL and B-KO mice and cultured for 7 days in medium supplemented with IL-7. The cells were retrovirally transduced with a BCL2-IRES-GFP overexpression or Mock plasmid, and cultured in the presence of IL-7 for 5 more days. Upon IL-7 withdrawal, samples were collected directly (day 0) and then every 24 hr for 9 days for analysis. (B) The percentage of living cells was estimated using flow cytometry based on FSC/SSC daily (three to five independent experiments; n=5–11 mice per genotype). (C) Surface expression of λLC and κLC in BCL2-transduced pro-/pre-B cell cultures assayed by flow cytometry (four independent experiments; n=5–9 per genotype). (D, E) RNA was isolated and reverse transcribed to quantify the relative expression of (D) Igk0.8 and Igl1 germline transcripts (n=3–4) and (E) Tcf3 (E12 and E47), Rag1 and Rag2 transcripts analyzed by qRT-PCR. (n=4–5 mice per genotype). Data were normalized to Hrpt. Each symbol represents one mouse (C–E). In all graphs, the mean + SD is plotted. Statistical analysis was performed using Two-way ANOVA with Fisher’s LSD test. Only p-values <0.05 are indicated.
-
Figure 4—source data 1
BCL2-mediated survival partially rescues λLC deficiency in vitro.
- https://cdn.elifesciences.org/articles/83943/elife-83943-fig4-data1-v2.xlsx
Figure 4—figure supplement 1
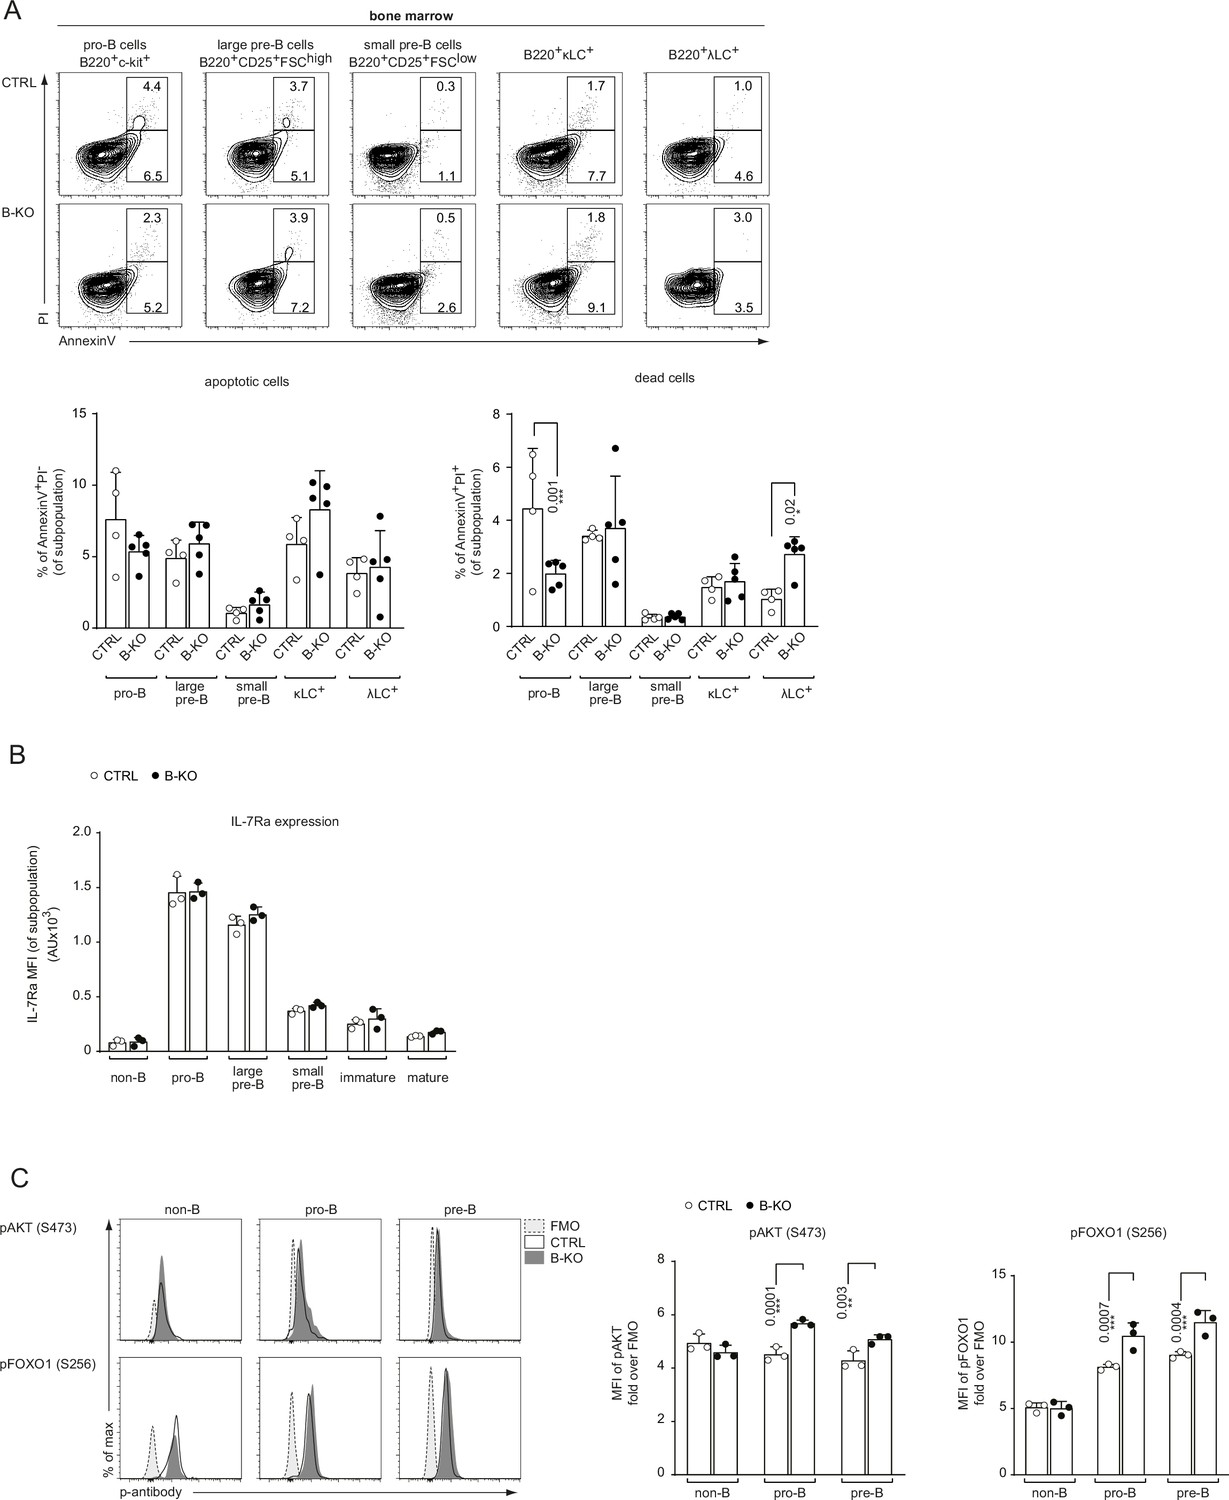
Kidins220 influences B cell survival and IL-7R signaling.
(A) BM cells were freshly isolated from CTRL and B-KO mice and analyzed for apoptosis and cell viability. The frequency of apoptotic (AnnexinV+PI-) and dead (AnnexinV+PI+) cells was analyzed by flow cytometry for B cells at various stages of development in the BM. Representative FACS plots and statistics are depicted (two independent experiments; n=4–5 mice per genotype). (B) Surface expression of IL-7Ra during B cell development in the BM of CTRL and B-KO mice (n=3 mice per genotype). (C) BM cells of CTRL and B-KO cells were isolated and directly fixed for basal phospho-flow analysis. Representative histograms (left) and quantification (right) of the relative mean fluorescence intensity (MFI) signal over the FMO control for pAKT (S473) and pFOXO1 (S256) are shown (n=2–3 mice per genotype). Each symbol represents one mouse. In all graphs, the mean + SD is plotted. Statistical analysis was performed using Two-way ANOVA with Fisher’s LSD test. Only p-values <0.05 are indicated.
-
Figure 4—figure supplement 1—source data 1
Kidins220 influences B cell survival and IL-7R signaling.
- https://cdn.elifesciences.org/articles/83943/elife-83943-fig4-figsupp1-data1-v2.xlsx
Figure 5 with 1 supplement
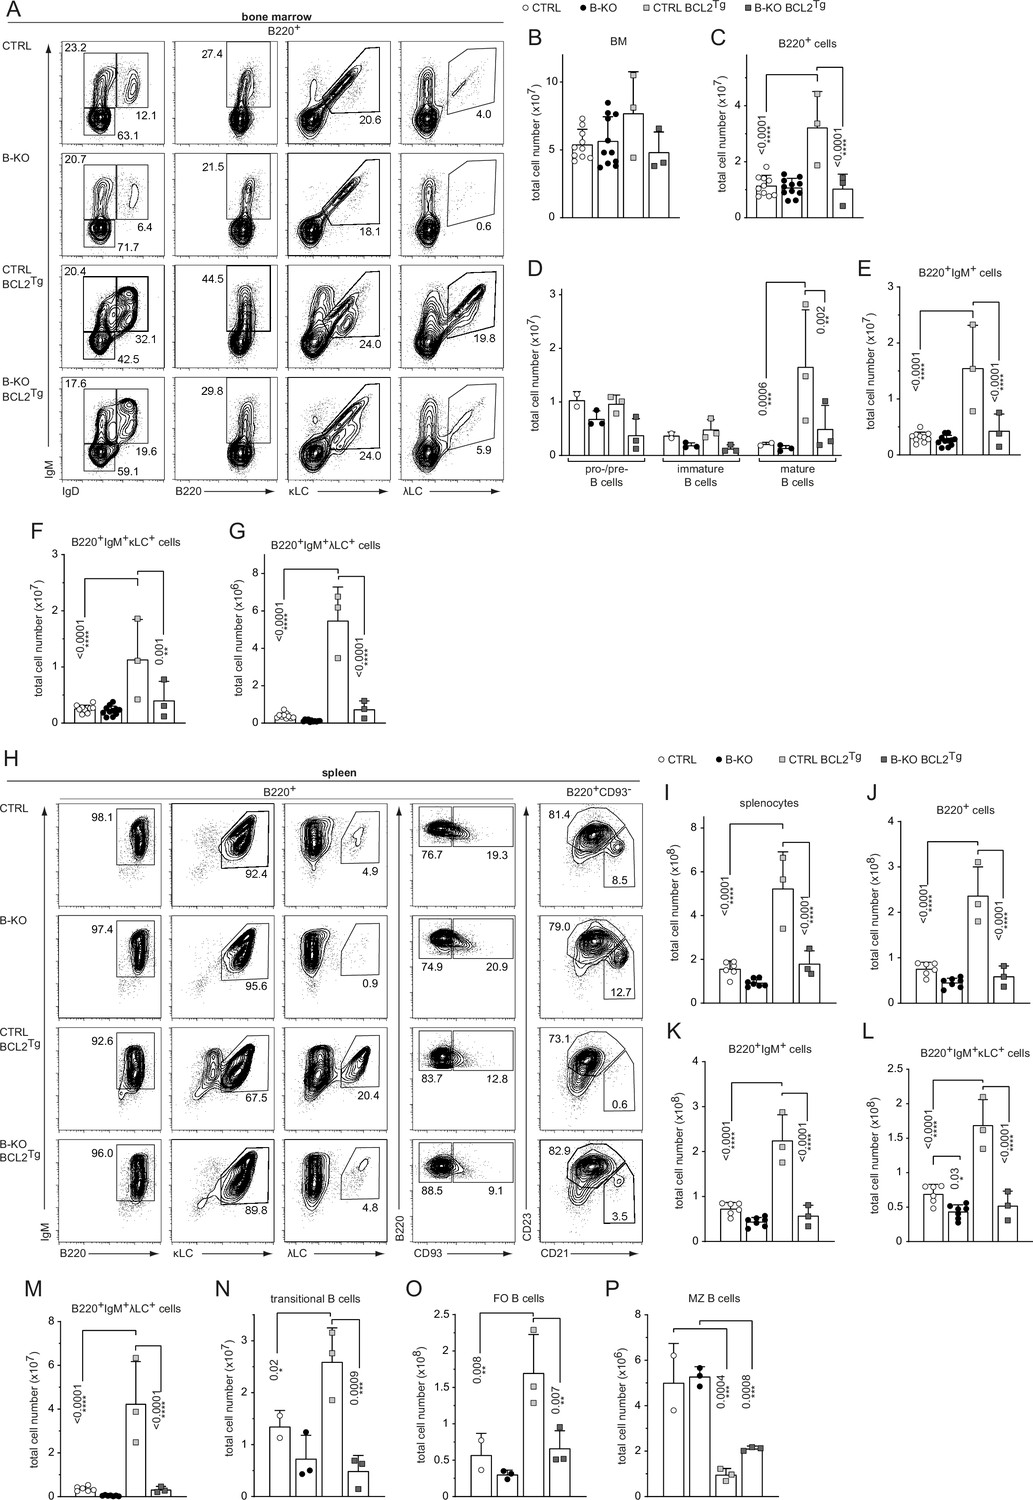
Ectopic BCL2-expression partially rescues λLC expression in Kidins220 B-KO mice.
(A, H) Representative flow cytometry plots of CTRL and B-KO mice in the absence or presence of the BCL2 transgene of BM (A) and spleen (H). Total cell numbers for each B cell compartment from BM (B–G) and spleen (I–P) are shown. Pro-/pre-B cells are defined as B220+IgM-IgD-, immature B cells as B220+IgM+IgD-, mature B cells as B220+IgM+IgD+, transitional B cells as B220+CD93+, follicular (FO) B cells as B220+CD93-IgM+CD21medCD23high and marginal zone (MZ) B cells as B220+CD93-IgM+CD21highCD23med. The quantification of three to five independent experiments with n=2–12 mice per genotype were pooled. Each symbol represents one mouse. In all graphs, the mean + SD is plotted. Statistical analysis was performed using Two-way ANOVA (D) or One-way ANOVA with Fisher’s LSD test. Only p-values <0.05 are indicated.
-
Figure 5—source data 1
Ectopic BCL2-expression partially rescues λLC expression in Kidins220 B-KO mice.
- https://cdn.elifesciences.org/articles/83943/elife-83943-fig5-data1-v2.xlsx
Figure 5—figure supplement 1
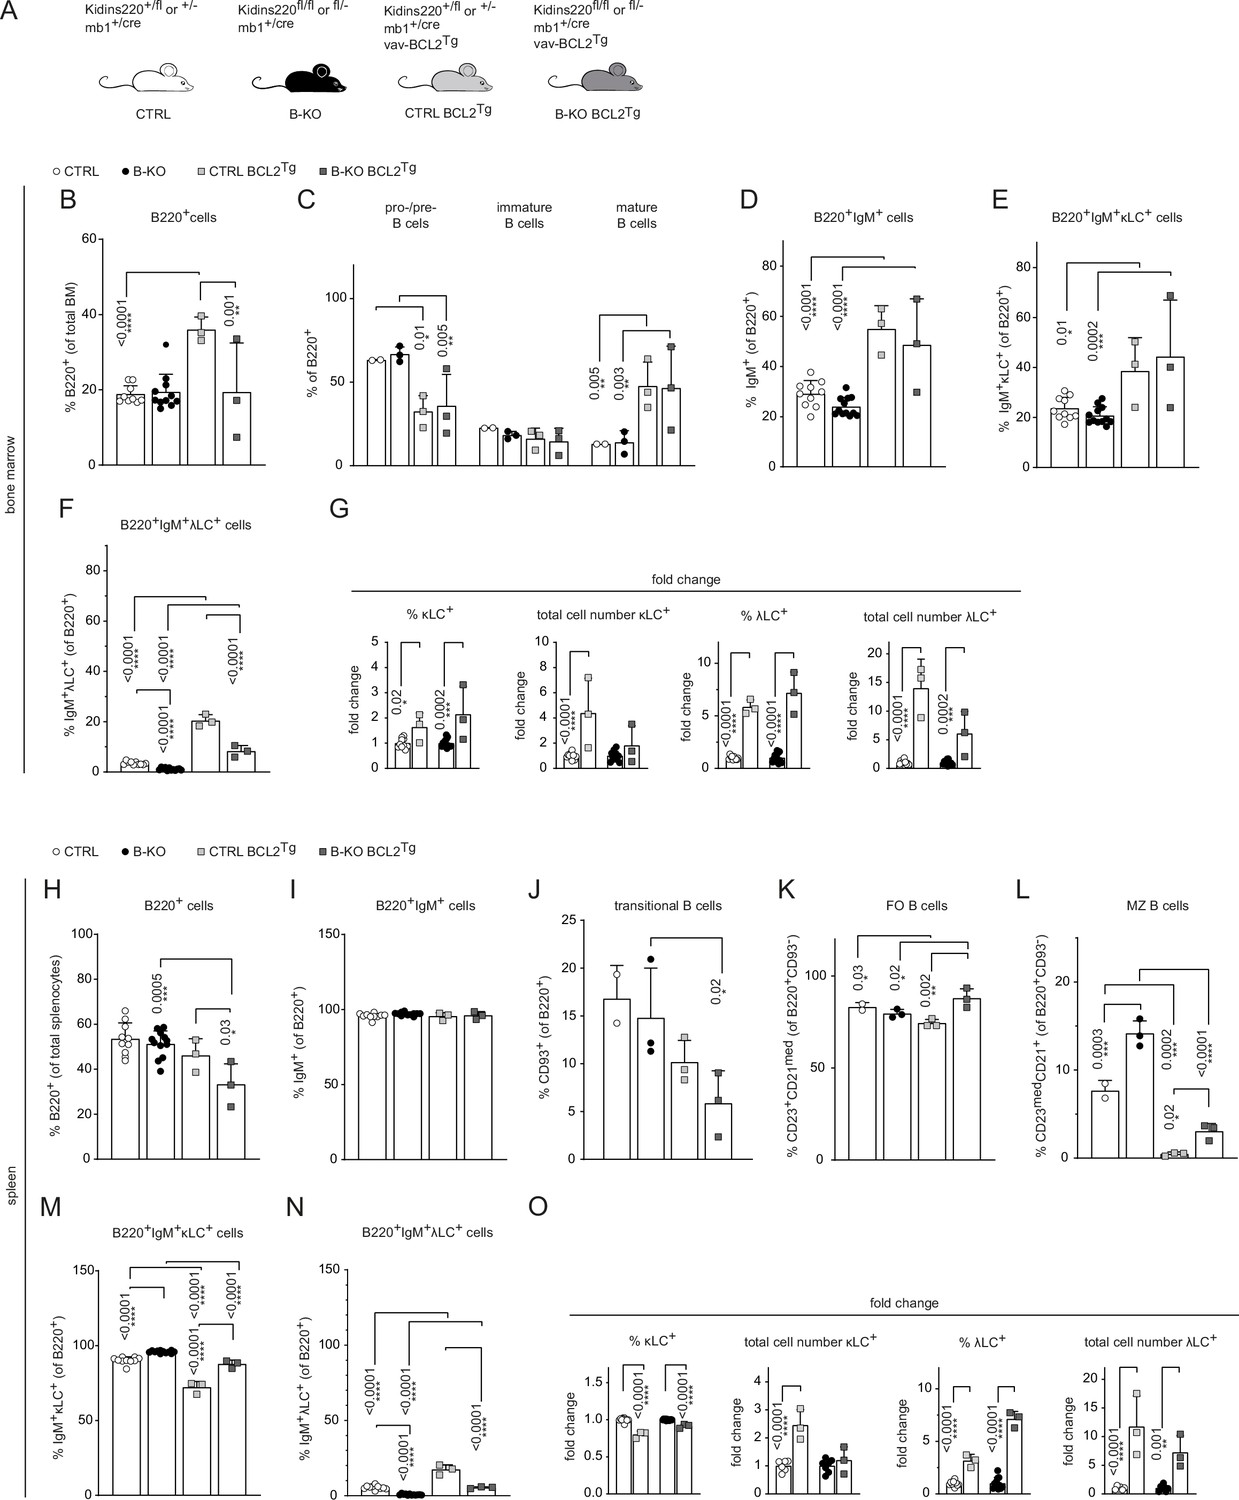
Ectopic BCL2 expression partially rescues λLC expression in B-KO mice.
(A) The genotypes of the Kidins220 locus, the mb1 Cre-recombinase expression, and vav-BCL2 transgene (vav-BCL2Tg) expression for CTRL and B-KO mice are depicted. (B-F; H–N) Quantification of the relative cell numbers of B cell subpopulations in the BM (B–F) and spleen (H–N). Pro-/pre-B cells are defined as B220+IgM-IgD-, immature B cells as B220+IgM+IgD-, mature B cells as B220+IgM+IgD+, transitional B cells as B220+CD93+, follicular (FO) B cells as B220+CD93-IgM+CD21medCD23high and marginal zone (MZ) B cells as B220+CD93-IgM+CD21highCD23med. The quantification of three to five independent experiments with n=2–12 mice per genotype were pooled. (G, O) Fold change of percent and total cell numbers of κLC and λLC B cells in the BM (G) and spleen (O) of BCL2Tg relative to non-transgenic mice. Each symbol represents one mouse. The mean + SD is plotted. Statistical analysis was performed using Two-way ANOVA (C) or One-way ANOVA with Fisher’s LSD test. Only p-values <0.05 are indicated.
-
Figure 5—figure supplement 1—source data 1
Ectopic BCL2 expression partially rescues λLC expression in B-KO mice.
- https://cdn.elifesciences.org/articles/83943/elife-83943-fig5-figsupp1-data1-v2.xlsx
Figure 6 with 1 supplement
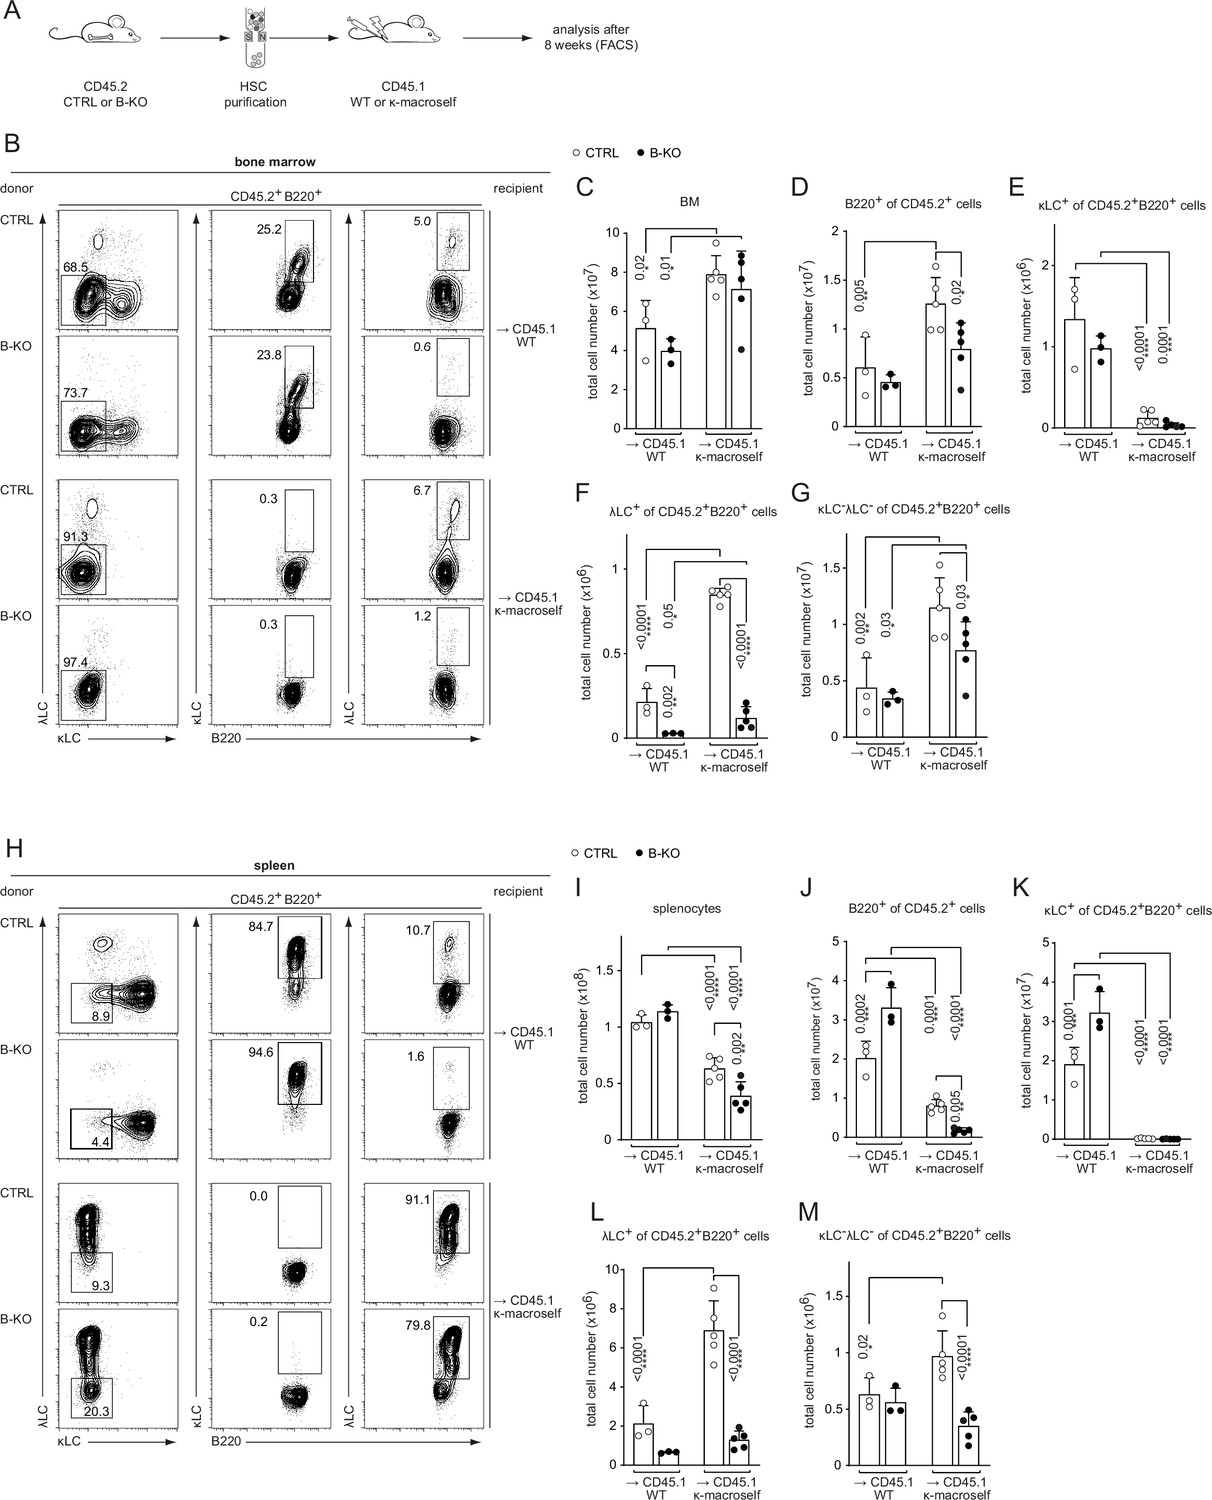
Kidins220 is dispensable for the elimination of autoreactive BCRs but necessary for the expression of innocuous λLC during tolerance induction.
(A) Experimental setup for BM transfer into CD45.1 mice. HSC from CTRL and B-KO mice were isolated by negative magnetic purification. A total of 5x10⁵ cells were injected intravenously into sublethally irradiated CD45.1 WT or CD45.1 κ-macroself transgenic mice. After 8 weeks, the reconstituted mice were analyzed by flow cytometry. Representative plots of the BM (B) and spleen (H) are shown. Total cell numbers of each B cell compartment from BM (C–G) and spleen (I–M) are shown. For the quantification, three independent experiments were pooled (n=6–13 mice per condition). Each symbol represents one mouse. In all graphs the mean + SD is plotted. Statistical analysis was performed using One-way ANOVA with Fisher’s LSD test. Only p-values <0.05 are indicated.
-
Figure 6—source data 1
Kidins220 is dispensable for the elimination of autoreactive BCRs but necessary for the expression of innocuous λLC during tolerance induction.
- https://cdn.elifesciences.org/articles/83943/elife-83943-fig6-data1-v2.xlsx
Figure 6—figure supplement 1
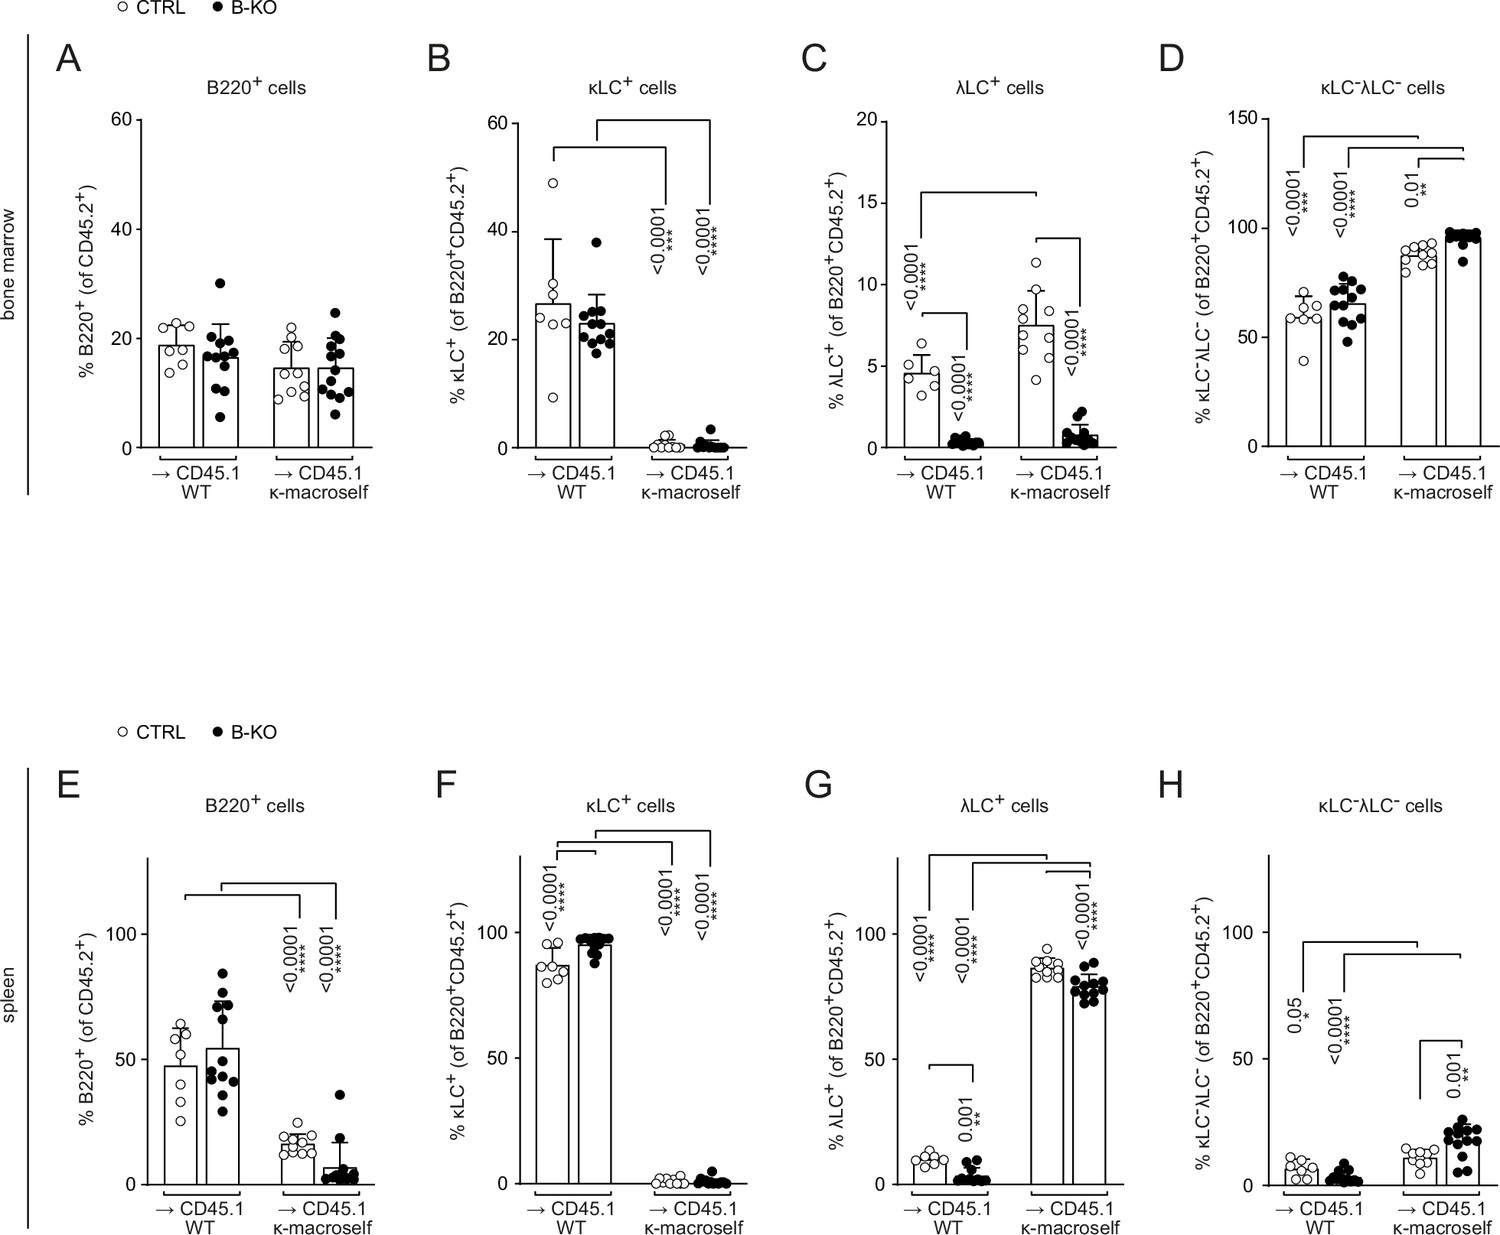
Kidins220 is dispensable for the elimination of autoreactive BCRs but is necessary for the expression of innocuous λLC during tolerance induction.
Quantification of the relative cell numbers of B cell subpopulations in the BM (A–D) and spleen (E–H) of WT and κ-macroself transgenic mice reconstituted with BM of CTRL or B-KO mice. The quantification of three independent experiments with n=6–13 mice per genotype were pooled. Each symbol represents one mouse. In all graphs, the mean + SD is plotted. Statistical analysis was performed using One-way ANOVA with Fisher’s LSD test. Only p-values <0.05 are indicated.
-
Figure 6—figure supplement 1—source data 1
Kidins220 is dispensable for the elimination of autoreactive BCRs but is necessary for the expression of innocuous λLC during tolerance induction.
- https://cdn.elifesciences.org/articles/83943/elife-83943-fig6-figsupp1-data1-v2.xlsx
Figure 7 with 1 supplement
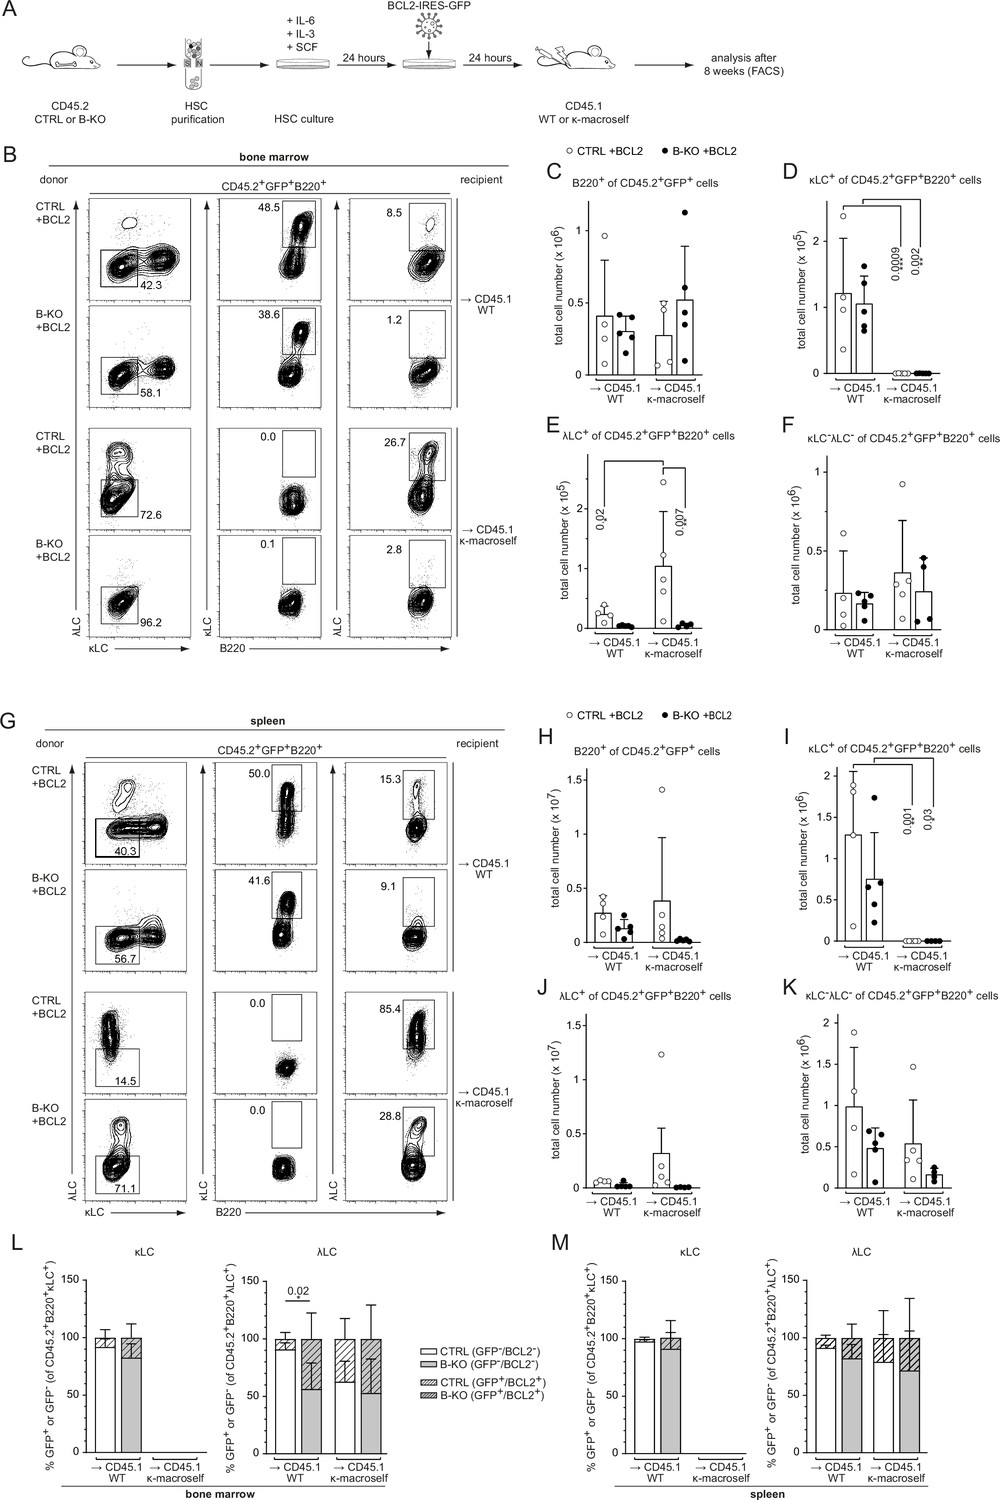
BCL2 overexpression fails to rescue λLC expression during tolerance induction.
(A) Experimental setup for BM transfer of virally transduced HSC into CD45.1 WT or CD45.1 κ-macroself transgenic mice. HSC from CTRL and B-KO mice were isolated by negative magnetic purification and cultured for 24 hr in the presence of IL-6, IL-3, and SCF. The cells were then virally transduced with a BCL2-IRES-GFP overexpression plasmid and cultured for another 24 hr. A total of 5x10⁵ cells were injected intravenously into sublethally irradiated CD45.1 WT or CD45.1 κ-macroself transgenic mice for BM reconstitution. After 8 weeks, the reconstituted mice were analyzed by flow cytometry. (B–K) BCL2-expressing donor B cells were analyzed by pre-gating on GFP+ cells. Representative plots of BM (B) and spleen (G) are shown. Total cell numbers of each B cell compartment from BM (C–F) and spleen (H–K) are shown. (L, M) Percent of donor B cells expressing BCL2 (GFP+) and not expressing BCL2 (GFP-) upon gating for κLC+ (left) or λLC+ (right) cells in the BM (L) and the spleen (M). Significance was determined by comparing the percentage of the GFP+ (striped) bars between the conditions. All panels are generated from two independent experiments (n=4–9 mice per condition). Each symbol represents one mouse. In all graphs, the mean + SD is plotted. Statistical analysis was performed using One-way ANOVA with Fisher’s LSD test. Only p-values <0.05 are indicated.
-
Figure 7—source data 1
BCL2 overexpression fails to rescue λLC expression during tolerance induction.
- https://cdn.elifesciences.org/articles/83943/elife-83943-fig7-data1-v2.xlsx
Figure 7—figure supplement 1
BCL2 overexpression partially rescues λLC expression during tolerance induction.
Quantification of the relative cell numbers of B cell subpopulations in the BM (A–D) and spleen (E–H) of WT and κ-macroself transgenic mice reconstituted with BM of BCL2 overexpressing HSCs of either CTRL or B-KO mice. BCL2-expressing donor B cells were analyzed by pre-gating on GFP+ cells. The quantification of two independent experiments with n=5–9 mice per genotype were pooled. Each symbol represents one mouse. In all graphs, the mean + SD is plotted. Statistical analysis was performed using One-way ANOVA with Fisher’s LSD test. Only p-values <0.05 are indicated.
-
Figure 7—figure supplement 1—source data 1
BCL2 overexpression fails to rescue λLC expression during tolerance induction.
- https://cdn.elifesciences.org/articles/83943/elife-83943-fig7-figsupp1-data1-v2.xlsx
Figure 8 with 1 supplement
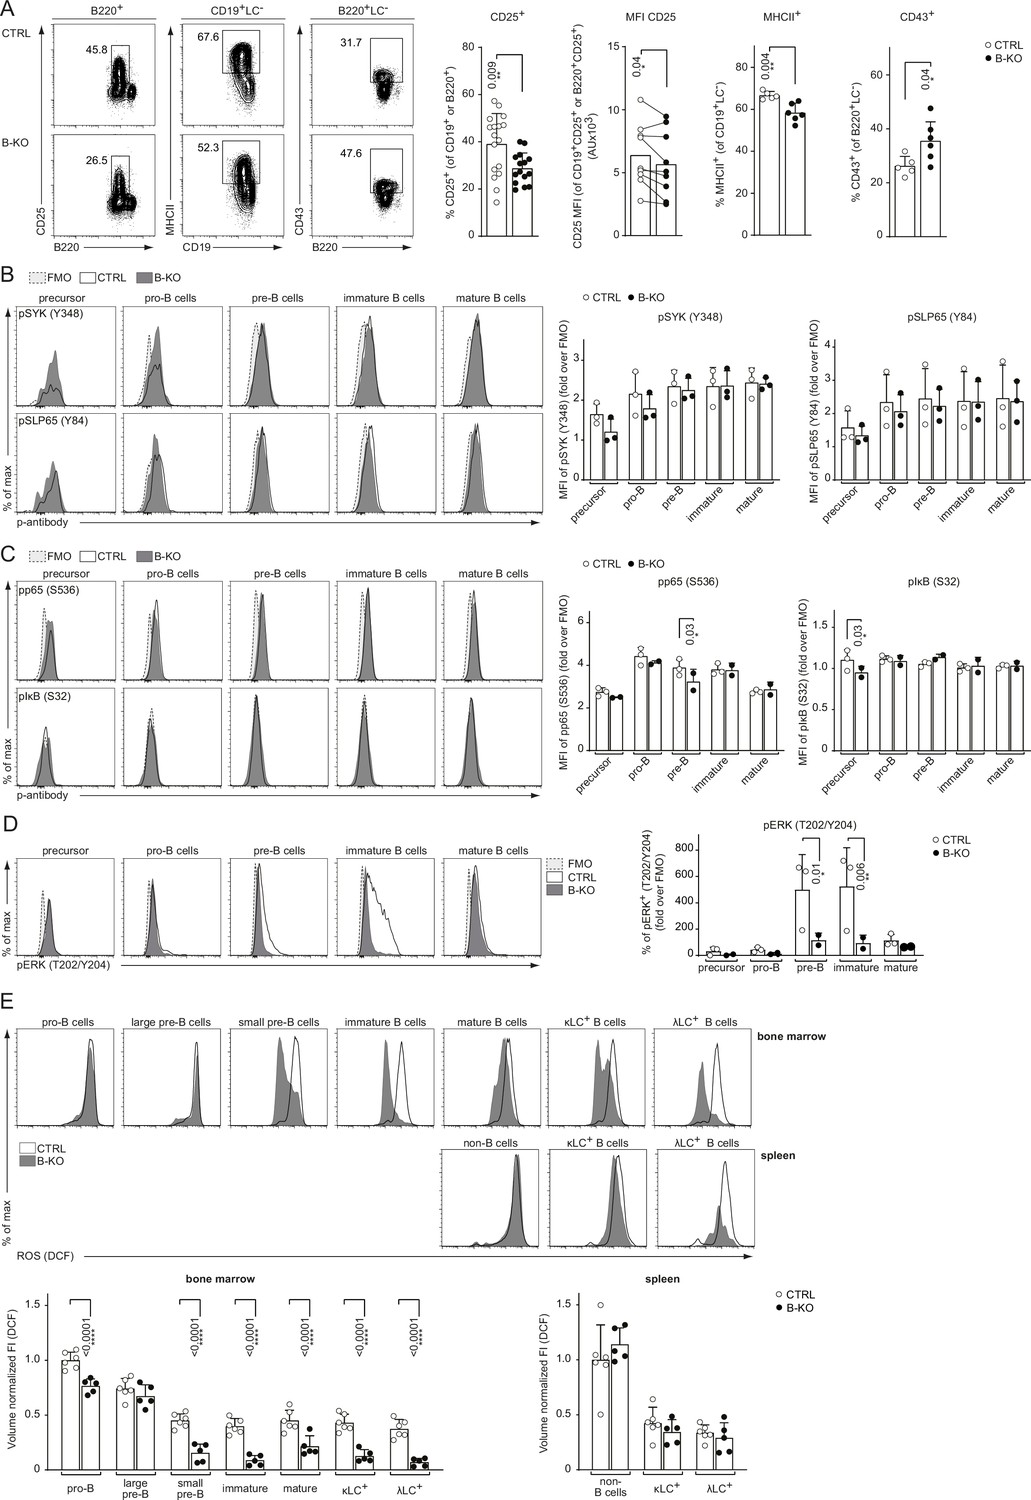
Rewired pre-BCR signaling in the absence of Kidins220.
(A) Representative flow cytometry plots of the BM of CTRL and B-KO mice showing the surface expression of CD25, MHCII and CD43 (left). For CD25, quantification of nine independent experiments with n=15–17 mice per genotype is shown. Each dot represents an individual mouse (percentage) or the average of each group within an individual experiment (MFI). For MHCII and CD43, quantification of three independent experiments with n=5–6 mice per genotype is shown. Each dot represents an individual mouse. Statistical analysis was performed using paired (CD25 MFI) or unpaired Student’s t-test. (B–D) BM cells were isolated and directly fixed for basal phospho-flow analysis. Representative histograms (left) and quantifications (right) of the relative MFI signal or percent of cells over the FMO are shown. (B) pSYK (S348) and pSLP65 (Y84). (C) NF-κB signaling pathway: pp65 (S536) and pIκB (S32). (D) pERK (T202/Y204). One representative experiment (out of 1–3 independent experiments) with each n=2–3 mice per genotype is shown. (E) B cell subpopulations from BM and spleen of CTRL and B-KO mice were analyzed by flow cytometry using specific antibodies against B220, CD117 (c-kit), CD25, κLC, and λLC. Cells were additionally stained with DCFDA to assess ROS levels. Representative histograms are shown on the top. For quantification (bottom), fluorescent intensities of the indicated metabolic marker were first normalized to the mean cell volume of each subpopulation and then normalized to pro-B cells (BM) or non-B cells (spleen). Three independent experiments were pooled; n=5–6 mice per genotype. (B–E) Each symbol represents one mouse. Statistical analysis was performed using Two-way ANOVA with Fisher’s LSD test. In all graphs, the mean + SD is plotted. Only p-values <0.05 are indicated.
-
Figure 8—source data 1
Rewired pre-BCR signaling in the absence of Kidins220.
- https://cdn.elifesciences.org/articles/83943/elife-83943-fig8-data1-v2.xlsx
Figure 8—figure supplement 1
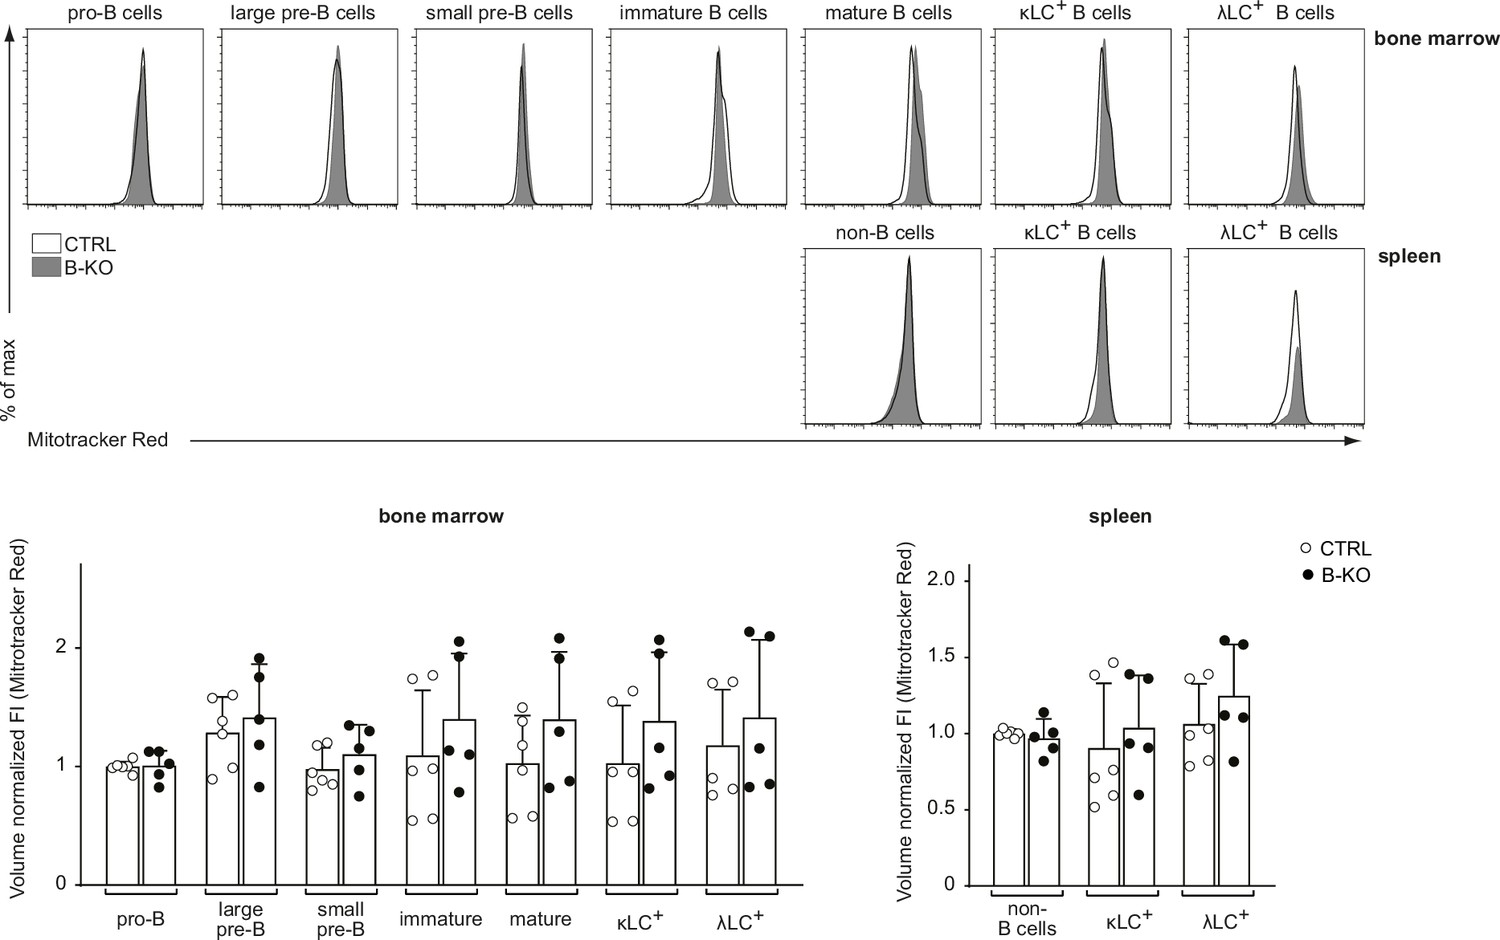
Kidins220 does not overall alter the mitochondrial function of B cells.
B cell subpopulations in the BM and spleens of CTRL and B-KO mice were analyzed by flow cytometry using specific antibodies against B220, CD117 (c-kit), CD25, κLC, and λLC. Cells were additionally stained with Mitotracker Red to assess mitochondrial mass as surrogate readout for metabolic fitness. Representative histograms are shown on the top. For quantification (bottom), fluorescent intensities of the indicated metabolic marker were first normalized to the mean cell volume of each subpopulation and then normalized to pro-B cells (BM) or non-B cells (spleen). Three independent experiments were pooled; n=5–6 mice per genotype. Each symbol represents one mouse. In all graphs, the mean + SD is plotted. Statistical analysis was performed using Two-way ANOVA with Fisher’s LSD test. Only p-values <0.05 are indicated.
-
Figure 8—figure supplement 1—source data 1
Kidins220 does not overall alter the mitochondrial function of B cells.
- https://cdn.elifesciences.org/articles/83943/elife-83943-fig8-figsupp1-data1-v2.xlsx
Figure 9
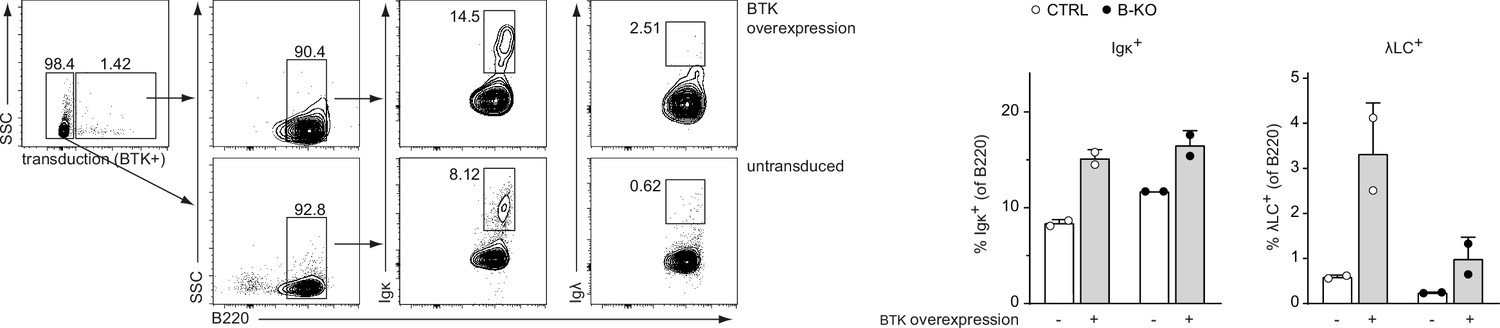
Overexpressing BTK partially rescues λLC development.
Pro-/pre-B cell cultures were retrovirally transduced with an overexpression plasmid coding for BTK at day 7 of IL-7 culture. Two days later, IL-7 withdrawal was performed. Cells transduced with the plasmid (BTK-overexpressing cells) and untransduced cells were further analyzed for B220, κLC, and λLC expression at day 3 after IL-7 withdrawal. Gating strategy (left) and statistical analysis (right) are show. Each symbol represents one mouse, n=2 mice per genotype. In all graphs, the mean + SD is plotted.
-
Figure 9—source data 1
Overexpressing BTK partially rescues λLC development.
- https://cdn.elifesciences.org/articles/83943/elife-83943-fig9-data1-v2.xlsx
Additional files
Download links
A two-part list of links to download the article, or parts of the article, in various formats.
Downloads (link to download the article as PDF)
Open citations (links to open the citations from this article in various online reference manager services)
Cite this article (links to download the citations from this article in formats compatible with various reference manager tools)
Kidins220 regulates the development of B cells bearing the λ light chain
eLife 13:e83943.
https://doi.org/10.7554/eLife.83943


