Model-based whole-brain perturbational landscape of neurodegenerative diseases
- Department of Physics, University of Buenos Aires, Argentina
- National Scientific and Technical Research Council (CONICET), CABA, Argentina
- Cognitive Neuroscience Center (CNC), Universidad de San Andrés, Argentina
- Center for Brain and Cognition, Computational Neuroscience Group, Universitat Pompeu Fabra, Spain
- Global Brain Health Institute, University of California, San Francisco, United States
- Latin American Brain Health Institute (BrainLat), Universidad Adolfo Ibáñez, Chile
- Department of Psychiatry, University of Oxford, United Kingdom
- Center for Music in the Brain, Department of Clinical Medicine, Aarhus University, Denmark
- Life and Health Sciences Research Institute (ICVS), School of Medicine, University of Minho, Portugal
- Centre for Eudaimonia and Human Flourishing, University of Oxford, United Kingdom
- Department of Information and Communication Technologies, Universitat Pompeu Fabra, Spain
- Institució Catalana de la Recerca i Estudis Avancats (ICREA), Spain
- Department of Neuropsychology, Max Planck Institute for Human Cognitive and Brain Sciences, Germany
- School of Psychological Sciences, Monash University, Australia
- Escuela de Fonoaudiología, Facultad de Odontología y Ciencias de la Rehabilitación, Universidad San Sebastián, Chile
- Trinity College Institute of Neuroscience (TCIN), Trinity College Dublin, Ireland
Figures
Figure 1

Methodological outline.
A phenomenological whole-brain model (normal mode of a Hopf bifurcation) was implemented at nodes defined by the Automated Anatomical Labeling (AAL) parcellation and coupled with the anatomical connectome. Different priors were explored to induce spatial heterogeneity in the model (i.e., variation in the local bifurcation parameters). The model was tuned to reproduce the empirical functional connectivity (FC) for each condition (CNT, Alzheimer’s disease [AD], behavioral variant frontotemporal dementia [bvFTD]), and the resulting parameters were represented in a latent space using a variational autoencoder, facilitating comparison between groups. Finally, the three different perturbations (Wave, Sync, Noise) were introduced in the model, resulting in a set of trajectories in latent space (one per pair of homotopic AAL regions).
Figure 2 with 3 supplements
Fitting the whole-brain model to the empirical data.
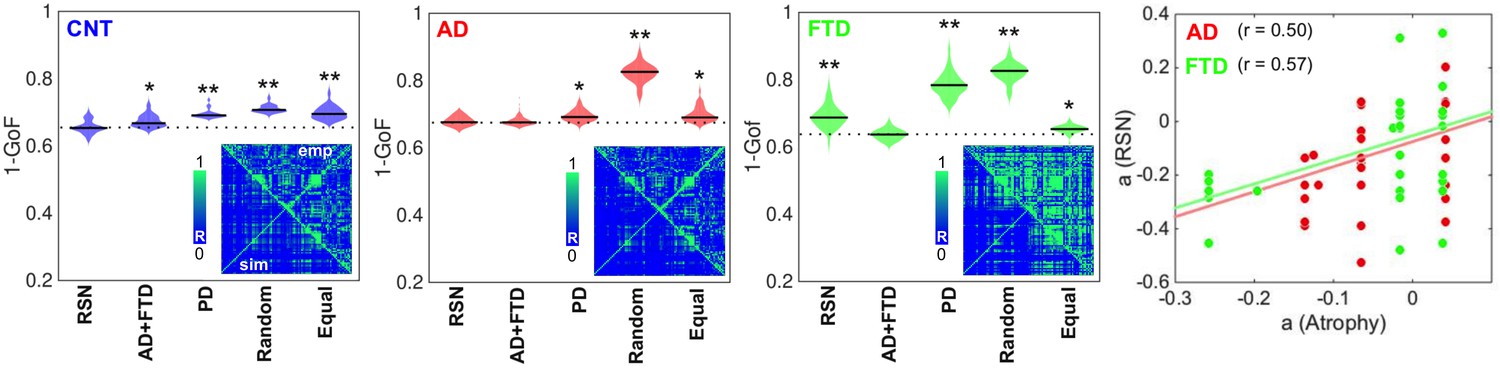
The violin plots display 1 – GoF values (300 independent realizations of parameter fitting) for CNT, Alzheimer’s disease (AD), and behavioral variant frontotemporal dementia (bvFTD) using anatomical priors based on resting state networks (RSN), AD, and bvFTD atrophy maps (AD + FTD), Parkinson’s disease atrophy map (PD), random assignment (Random), and equally sized groups of nodes defined by anatomical proximity (Equal) (* and ** indicate large [ >0.8] and very large [ >1.3] effect sizes according to Cohen’s d, computed in each case against the best fitting prior; e.g., in the models fitted to the CNT and AD groups, the effect size was computed against the RSN and AD + FTD priors, respectively). Insets present the empirical (‘emp,’ below diagonal) and the best simulated (‘sim,’ above diagonal) FC matrices, with contradiagonal matrix entries added for visualization purposes. The rightmost panel shows the bifurcation parameters obtained using the RSN vs. AD + FTD atrophy priors for AD (red) and bvFTD (green), together with the corresponding Pearson correlation values and least-squares linear fits.
Figure 2—figure supplement 1
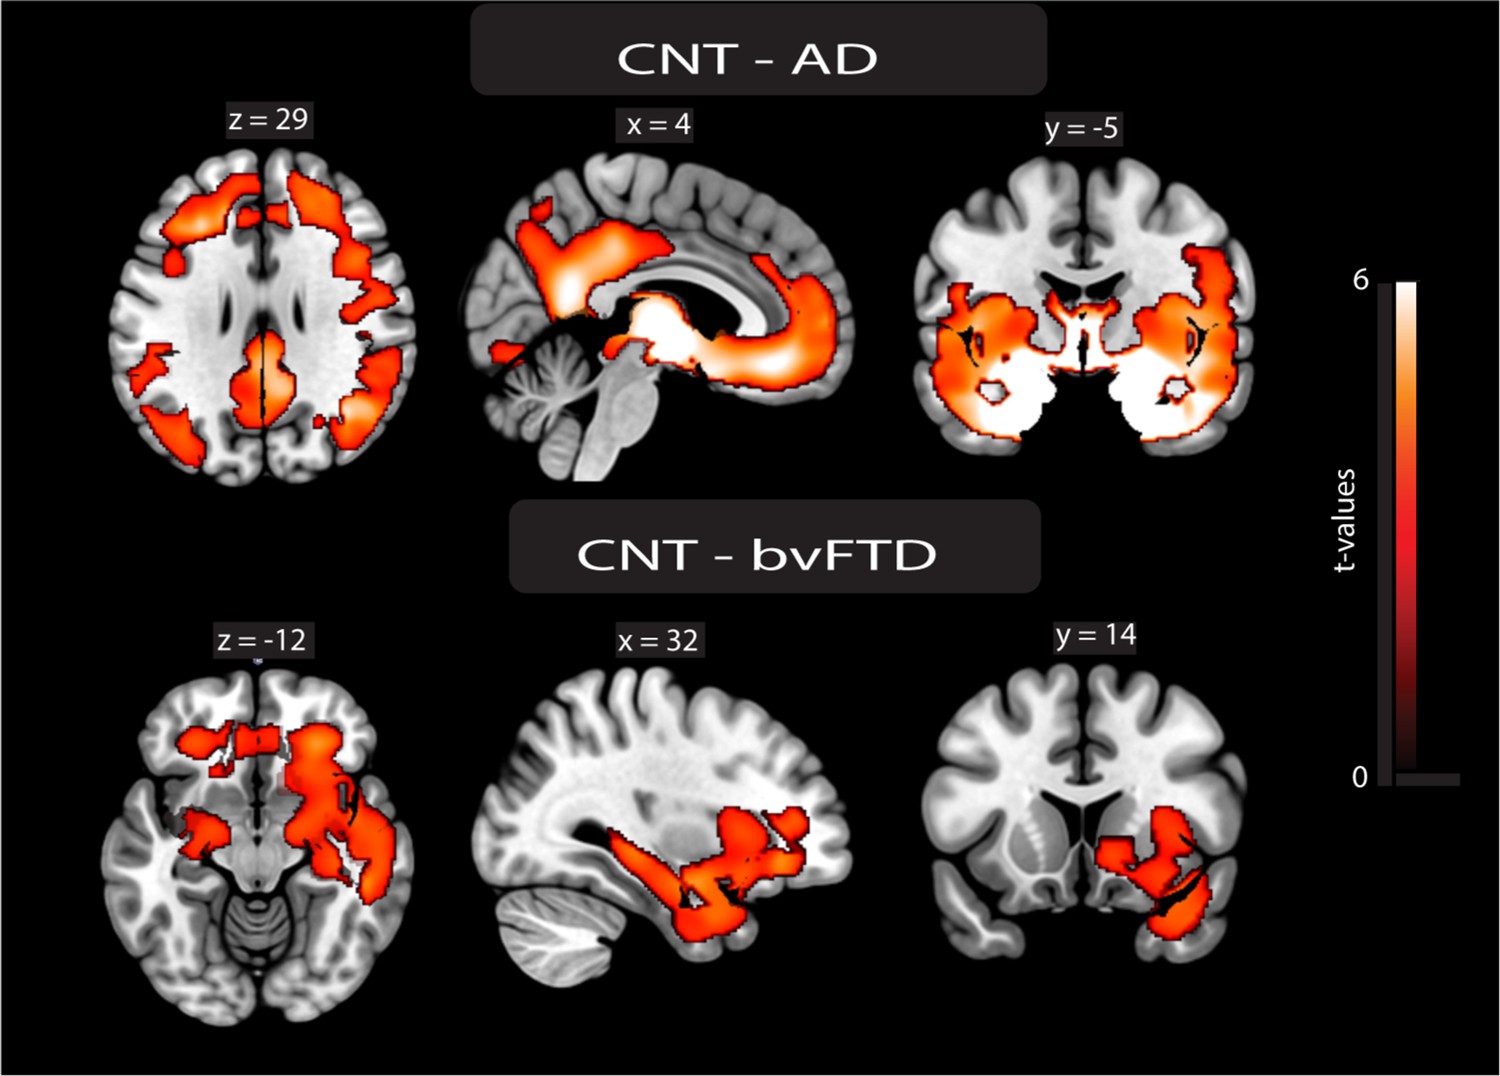
Atrophy maps.
Voxel-based morphometry analysis. The atrophy pattern of participants with Alzheimer’s disease (AD) and behavioral variant frontotemporal dementia (bvFTD) was calculated by comparing their gray matter W-maps with those of controls using two-sample t-tests in SPM12. The alpha level was set at p<0.001, cluster-corrected for multiple comparisons. Localization was derived from the Automated Anatomical Labeling (AAL) atlas. The brain renders of atrophy maps of AD (upper panel) and bvFTD (lower panel) compared to CNT.
Figure 2—figure supplement 2
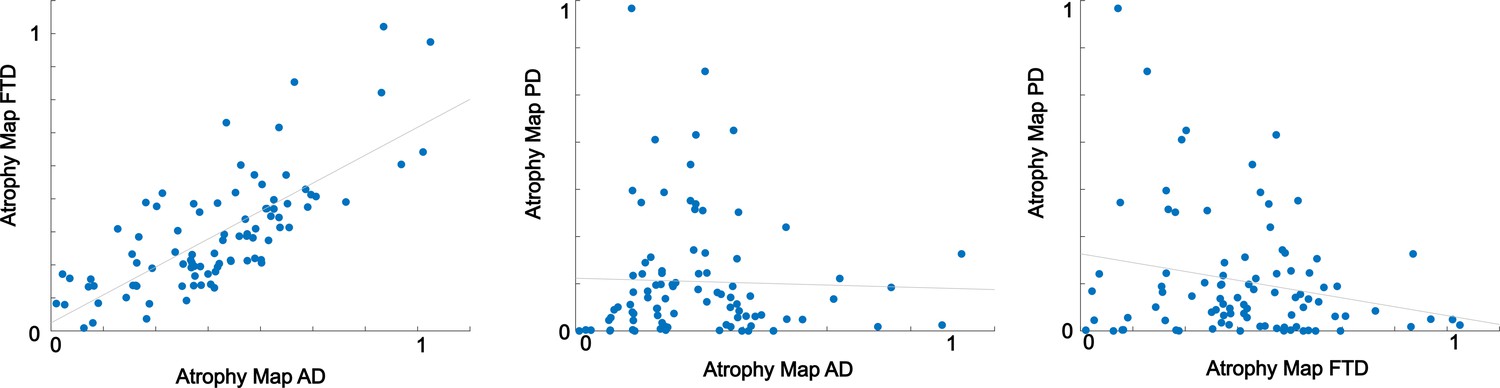
Correlations between disease-atrophy maps.
The correlation between the atrophy map of Alzheimer’s disease (AD) and frontotemporal dementia (FTD) is high (R = 0.75, p<0.001), left panel; while the correlations between the FTD and AD maps and the Parkison’s disease (PD) maps are lower (PD vs. AD; R = −0.03, p=0.76; PD vs. FTD; R = −0.22, p=0.05).
Figure 2—figure supplement 3
Fitting the whole-brain model to the empirical data.
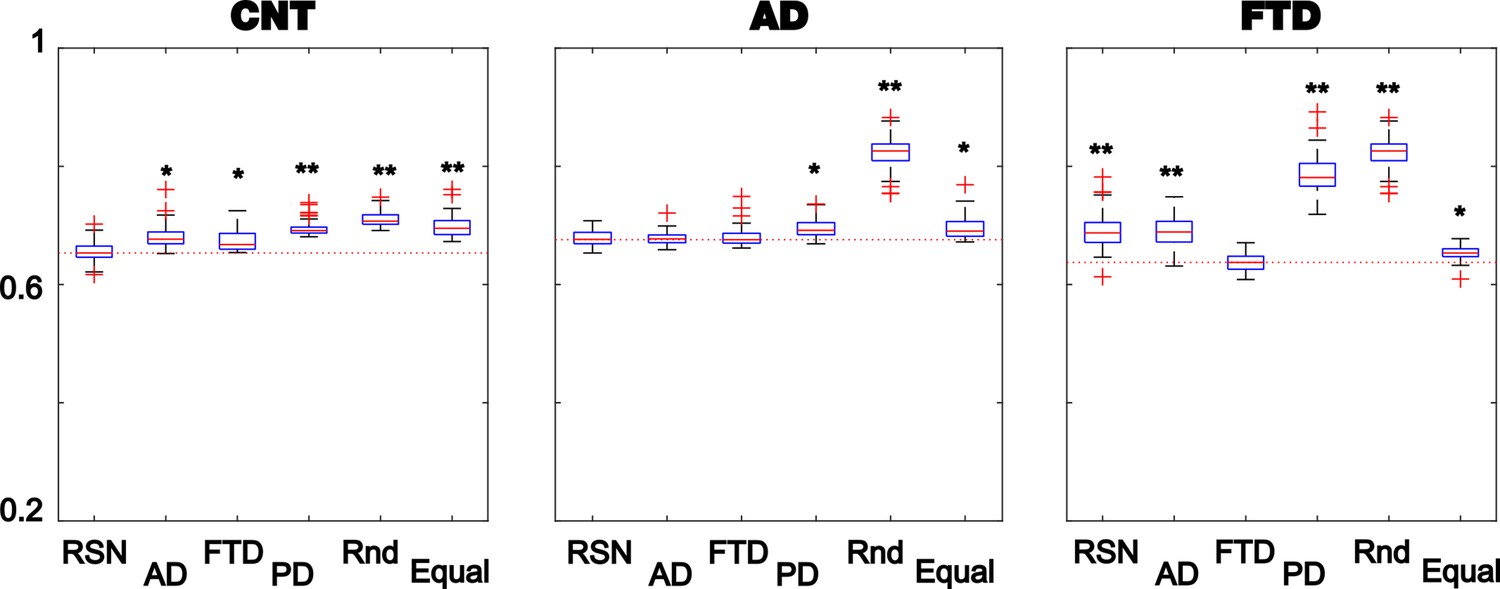
The violin plots display 1 – GoF values (300 independent realizations of parameter fitting) for CNT, Alzheimer’s disease (AD), and behavioral variant frontotemporal dementia (bvFTD) using anatomical priors based on resting state networks (RSN), AD, bvFTD (separately), and Parkinson’s disease atrophy maps (PD), random assignment (Random), and equally sized groups of nodes defined by anatomical proximity (Equal) (* and ** indicate large [ >0.8] and very large [ >1.3] effect sizes according to Cohen’s d computed against the best fitting prior of each model).
Figure 3
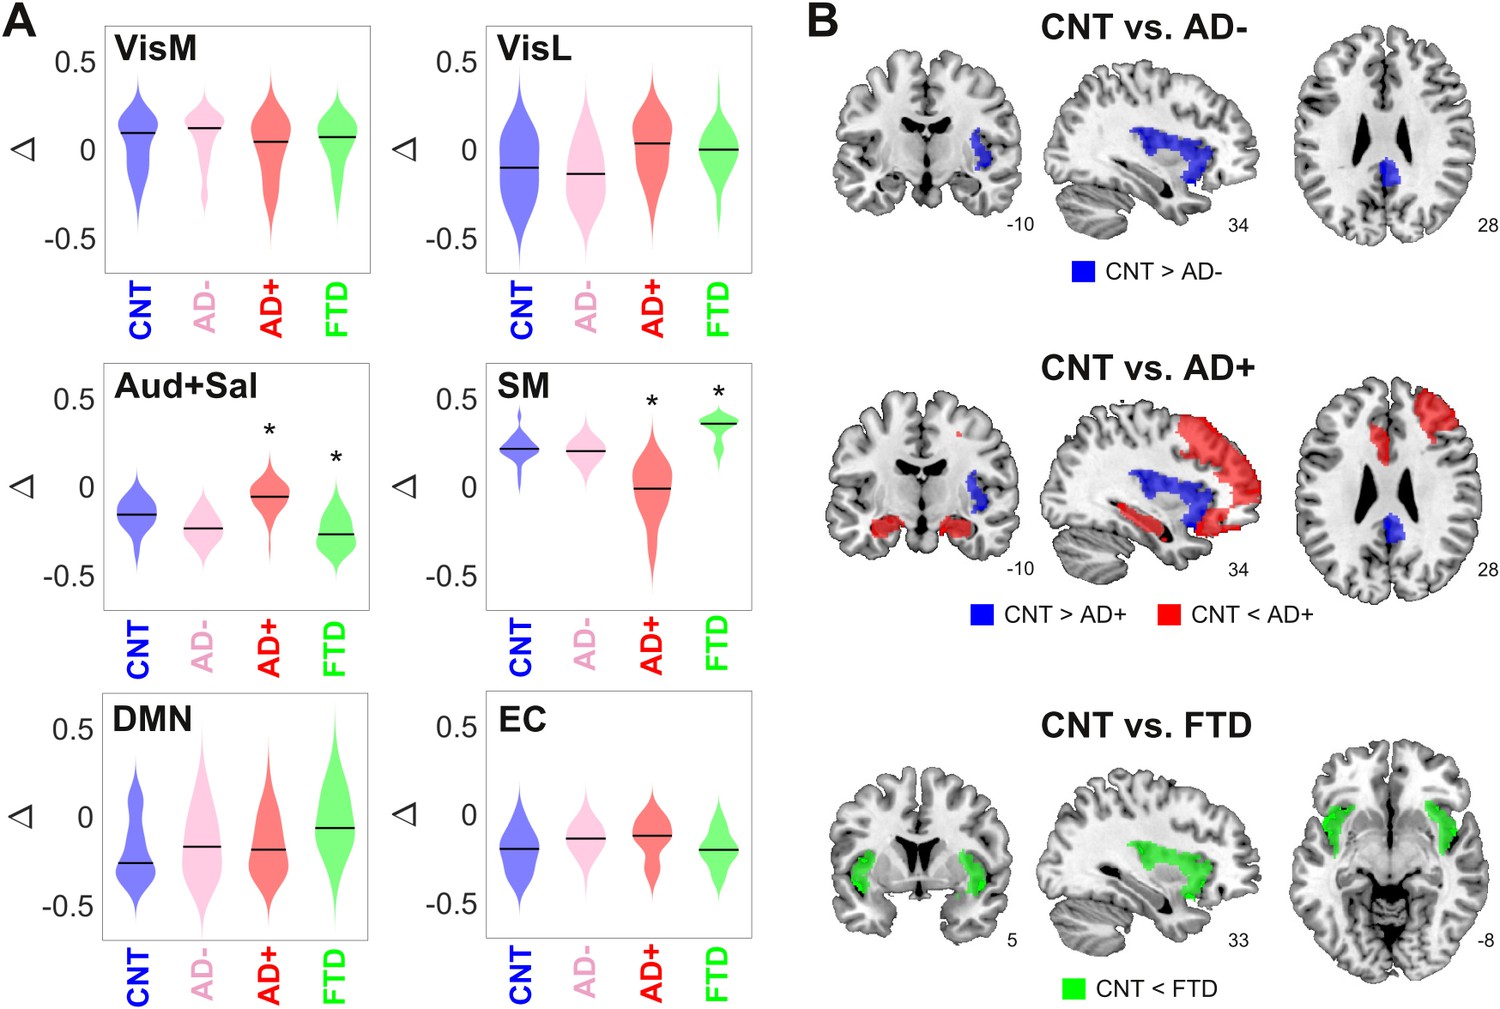
Changes in dynamical stability underlie differences in whole-brain functional connectivity (FC) between controls and patients diagnosed with neurodegenerative diseases.
(A) Distribution of parameters Δ (which encode the contribution of each resting state networks (RSN) towards the local bifurcation parameter) across 300 runs of parameter optimization for CNT, Alzheimer’s disease (AD-), AD+, and behavioral variant frontotemporal dementia (bvFTD) (* indicates > 0.8 between distributions). (B) Brain regions with values > 0.8 between the local distribution of bifurcation parameters of CNT vs. AD-, AD+, and bvFTD.
Figure 4
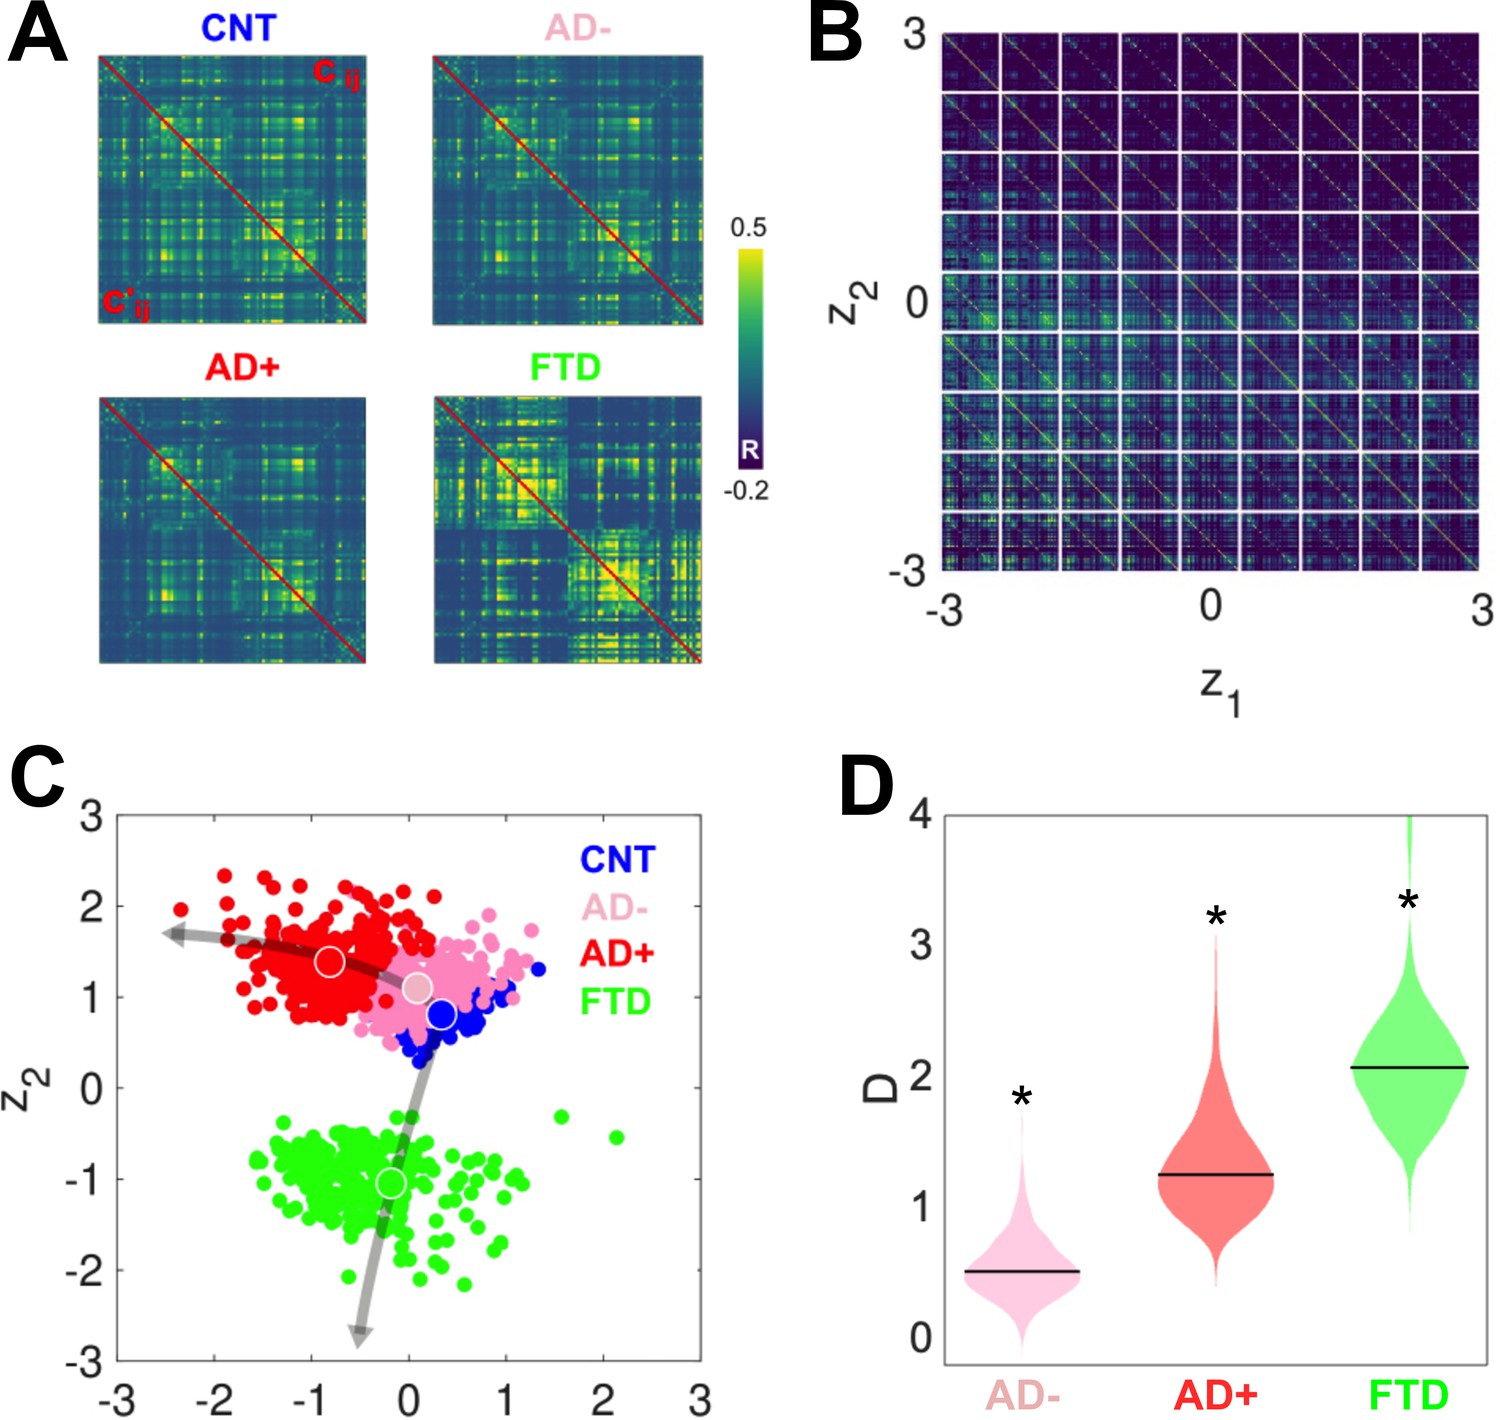
Latent space encoding of whole-brain functional connectivity (FC) reflects the different neurodegenerative diseases and the severity of Alzheimer’s disease (AD) in terms of white-matter hyperintensity (WHMI) scores.
(A) Original (above diagonal) and reconstructed (below diagonal) FC matrices. (B) Illustration of the FC matrix encoded at each point of the latent space by the variational autoencoder (VAE). (C) Latent space encoding of 300 independent runs of the model fitted to empirical CNT, AD-, AD+, and behavioral variant frontotemporal dementia (bvFTD) data. The larger circles represent the average of the positioning of all encoded points for each group. (D) Distribution of distances (D) to CNT for each condition (*indicates >0.8 between distributions).
Figure 5 with 1 supplement
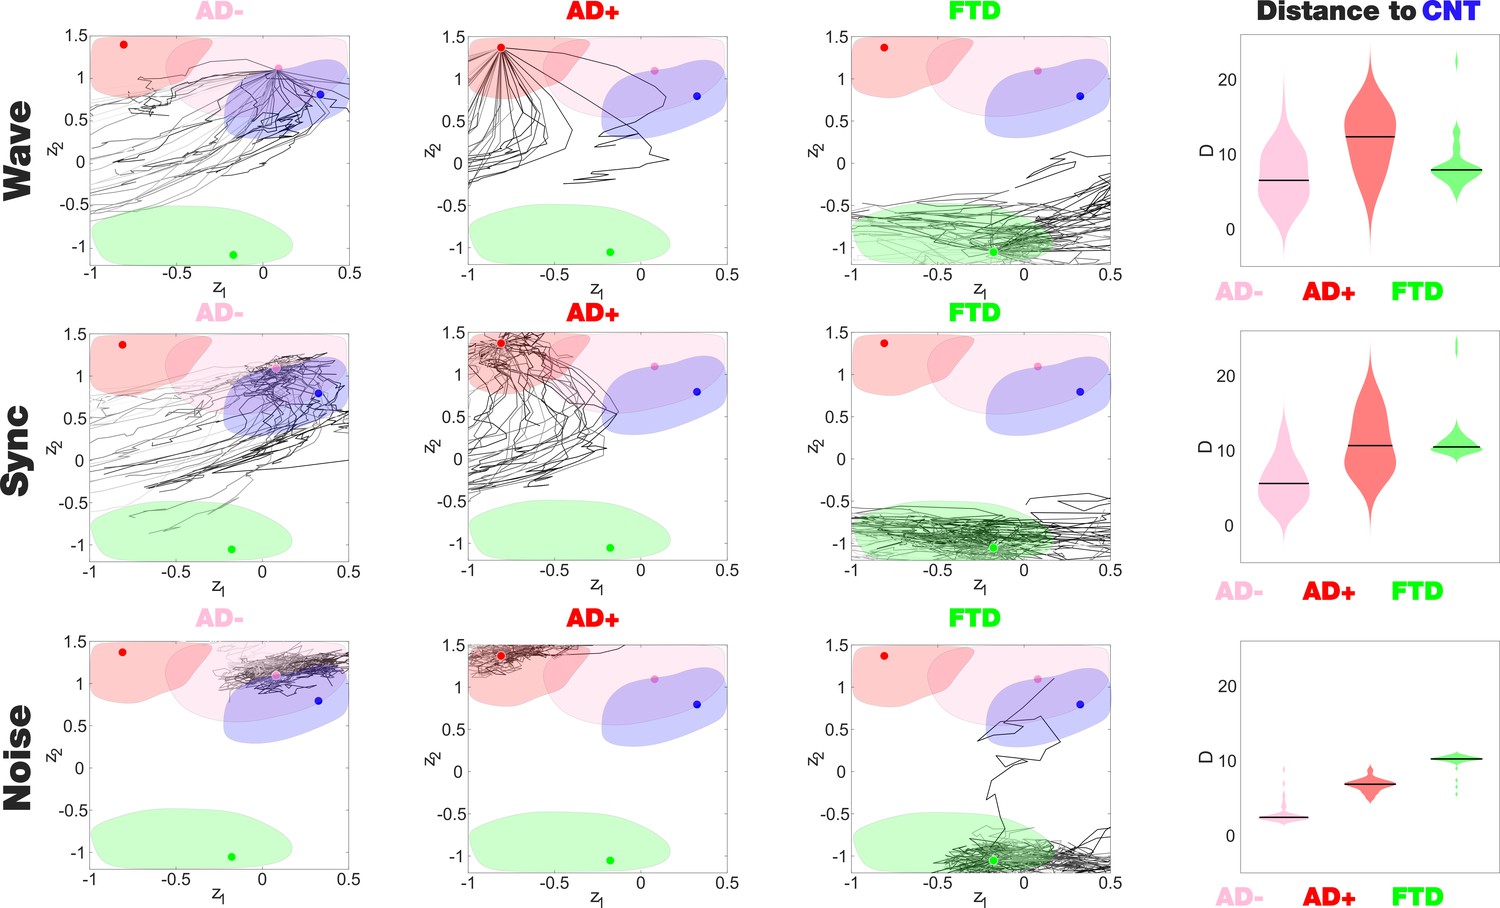
Perturbational landscapes of neurodegenerative diseases.
Each row corresponds to a different simulated stimulation protocol (Wave, Sync, and Noise), while each column corresponds to a different group (Alzheimer’s disease [AD-], AD+, and behavioral variant frontotemporal dementia [bvFTD]). Trajectories represent the encoded sequence of functional connectivity (FC) matrices obtained as a result of parametrically increasing the perturbation. Individual trajectories represent the outcome of the stimulation applied at different pairs of homotopic Automated Anatomical Labeling (AAL) regions, with darker tones indicating higher proximity to the target state, CNT. The rightmost column presents the minimum distances of the trajectories to CNT, with AD- being the closest in this sense.
Figure 5—figure supplement 1
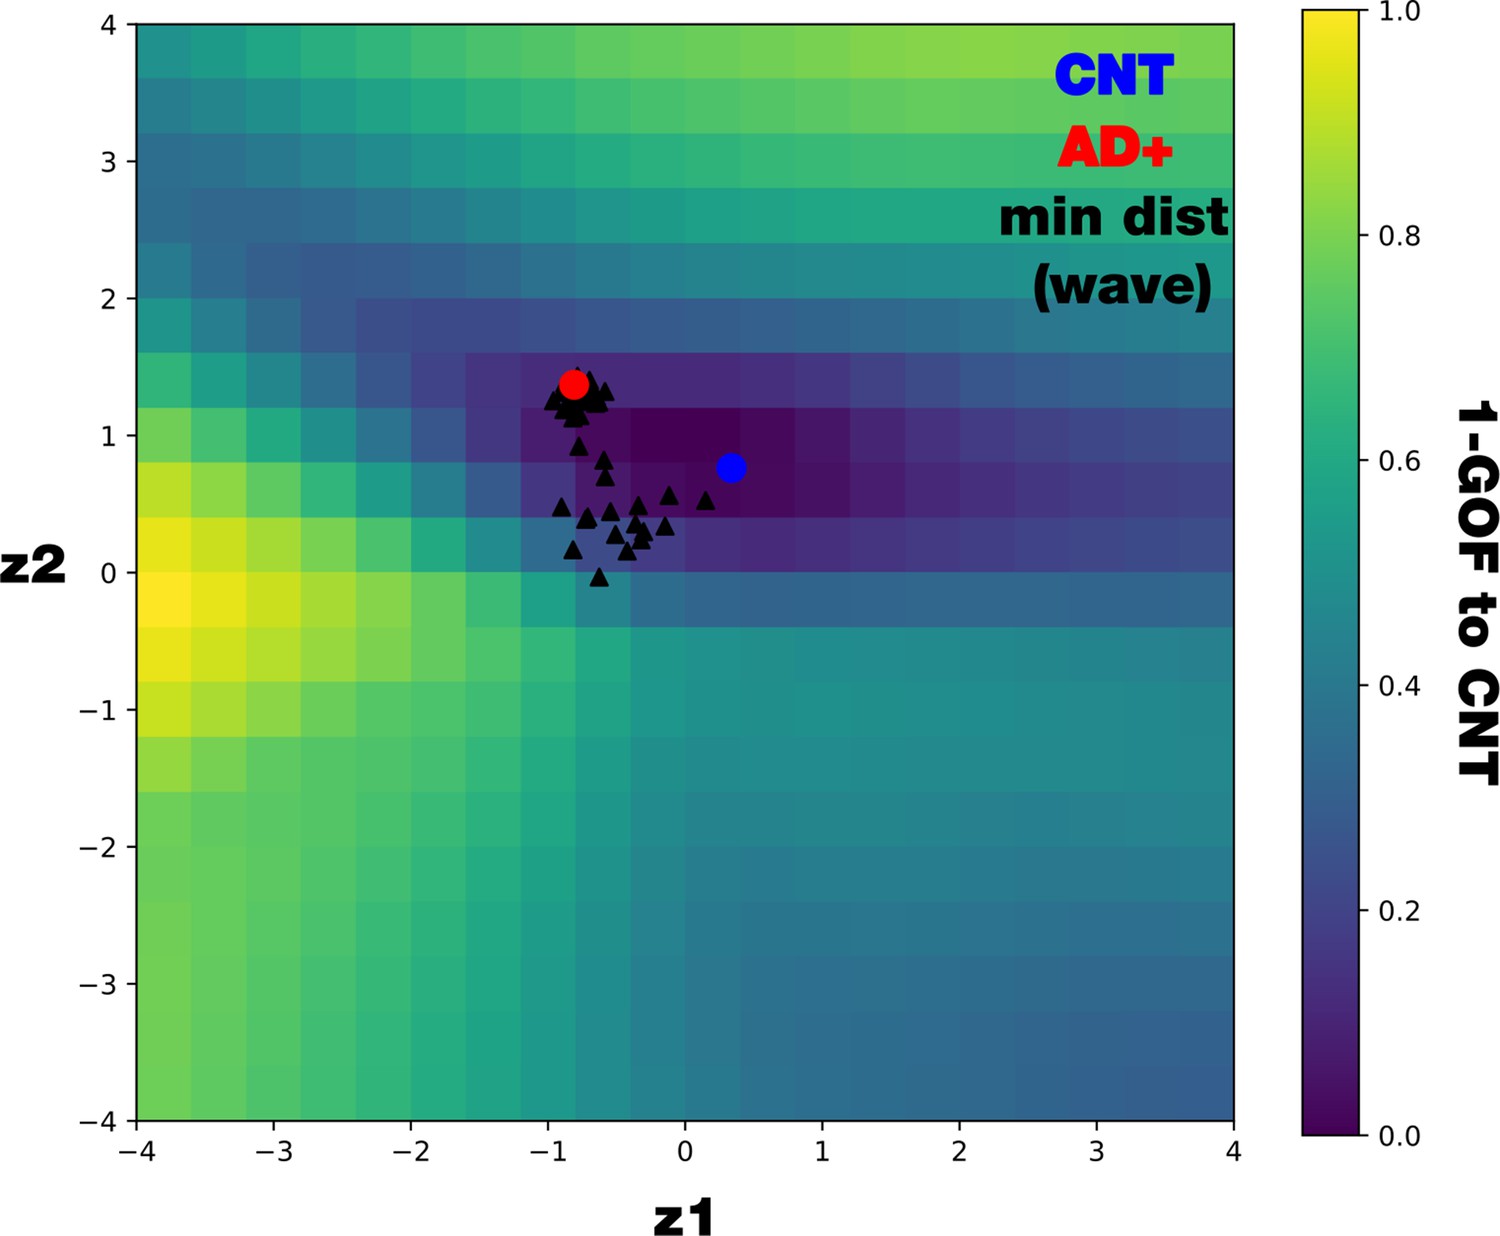
Mapping 1 – GOF in the latent space comparing with distance to CNT.
We systematically decoded points within a 20 × 20 grid in the latent space and compute the GOF between the decoded functional connectivity (FCs) and the controls’ FC. We display the GOF map together with the controls’ center (blue circle), AD+ center (red circle), and all the minimal distance of all the possible perturbations of the AD+ condition (in the wave perturbative approach, black triangles). As is noticeable, not equal distances representing equal GOF, this is due to the two-dimensional nature of the latent space representation.
Figure 6
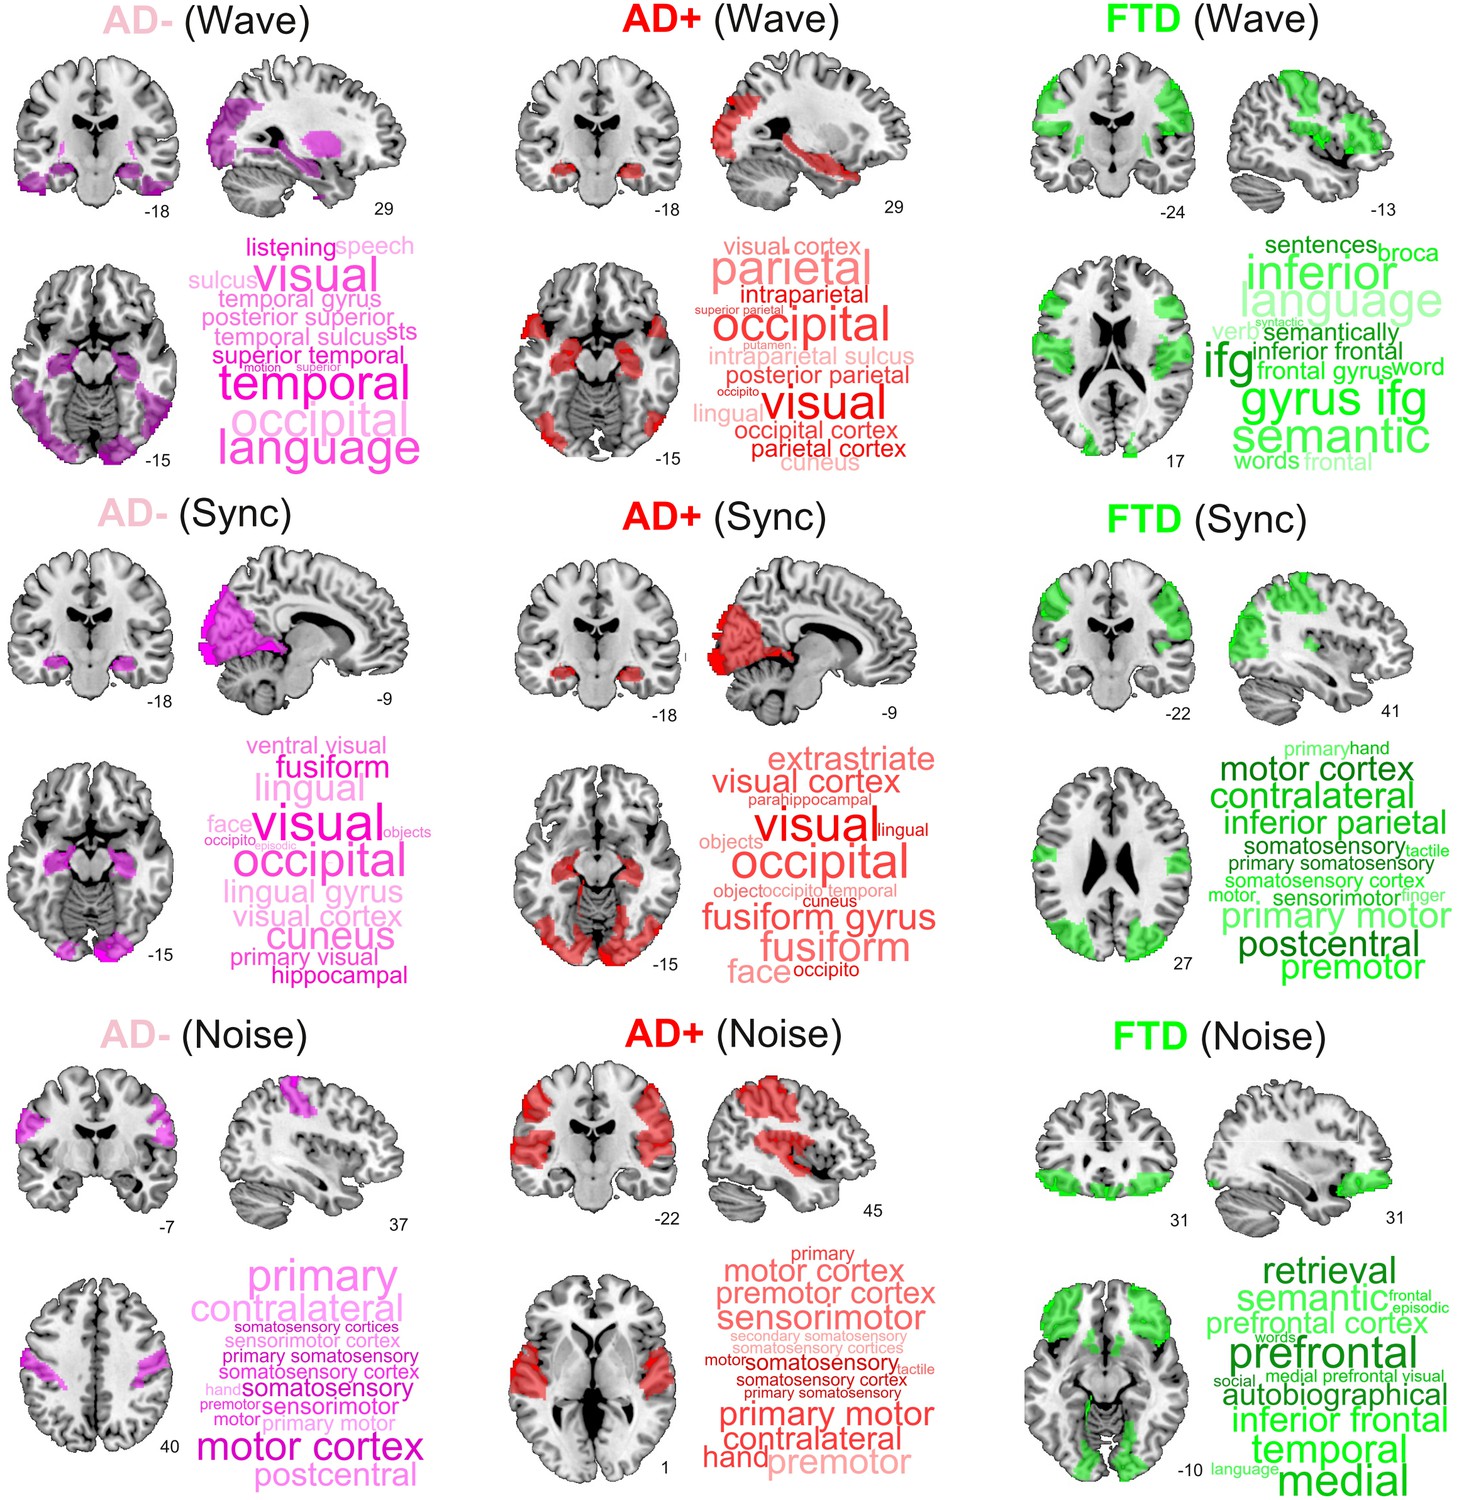
Top brain regions ranked according to the proximity of their corresponding trajectories to CNT.
Columns correspond to disease subgroups (Alzheimer’s disease [AD-], AD+, and behavioral variant frontotemporal dementia [bvFTD]), while rows correspond to the three explored simulated stimulation protocols (Wave, Sync, and Noise).
Additional files
-
Supplementary file 1
The demographic information of the participants (CNT, AD, and FTD): gender, education level, age, and the results of cognitive assessments.
- https://cdn.elifesciences.org/articles/83970/elife-83970-supp1-v2.xlsx
-
Supplementary file 2
Gray matter atrophy for AD and FTD.
(a) Gray matter atrophy areas of participants with AD (p<0.001, FWE-cluster-corrected for multiple comparisons). (b) Gray matter atrophy areas of participants with FTD (p<0.001, FWE-cluster-corrected for multiple comparisons).
- https://cdn.elifesciences.org/articles/83970/elife-83970-supp2-v2.docx
-
MDAR checklist
- https://cdn.elifesciences.org/articles/83970/elife-83970-mdarchecklist1-v2.pdf
Download links
A two-part list of links to download the article, or parts of the article, in various formats.
Downloads (link to download the article as PDF)
Open citations (links to open the citations from this article in various online reference manager services)
Cite this article (links to download the citations from this article in formats compatible with various reference manager tools)
Model-based whole-brain perturbational landscape of neurodegenerative diseases
eLife 12:e83970.
https://doi.org/10.7554/eLife.83970


