Targeted sensors for glutamatergic neurotransmission
- Institute of Biology, Cellular Biophysics, Humboldt-Universität zu Berlin, Germany
- Leibniz-Forschungsinstitut für Molekulare Pharmakologie, Germany
- Institute for Neurophysiology, Charité - Universitätsmedizin Berlin, Germany
- NeuroCure Cluster of Excellence, Germany
Figures
Figure 1 with 3 supplements
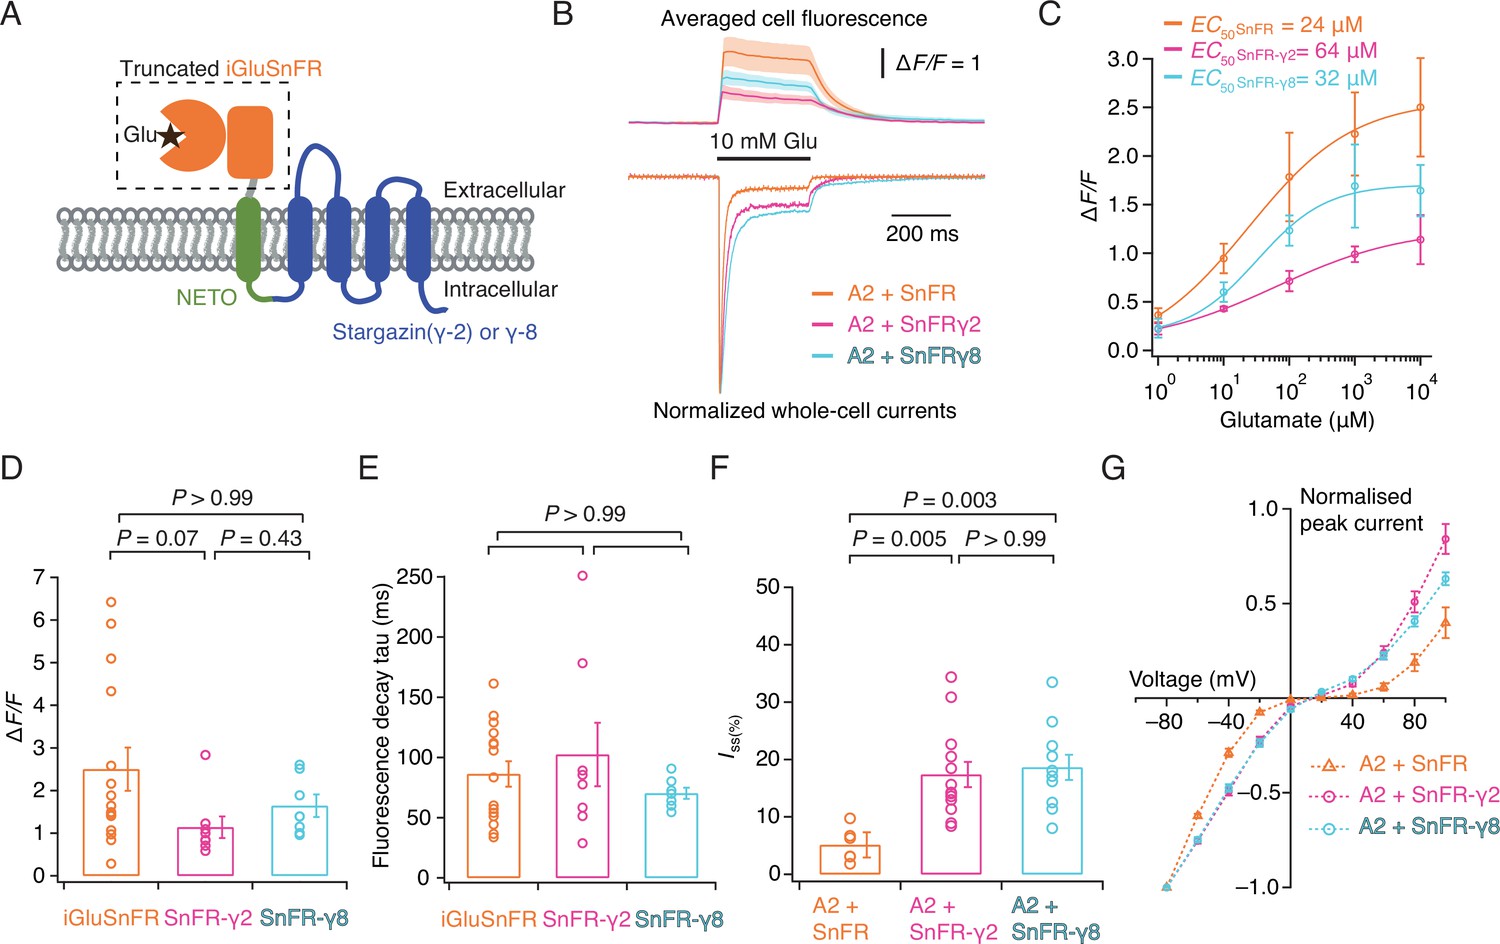
Patch-clamp fluorometry of SnFR-γ2 and SnFR-γ8 in HEK cells.
(A) Schematic view of SnFR-γ2 and SnFR-γ8 chimeras, comprised of the truncated extracellular part of iGluSnFR (orange) to signal glutamate binding (black star), NETO as transmembrane linker (green) and Stargazin (γ-2) or γ-8 (blue) to act as a postsynaptic anchor. (B) Average fluorescent responses and normalised representative traces of currents for iGluSnFR (orange, n = 15), SnFR-γ2 (magenta, n = 8), and SnFR-γ8 (cyan, n = 7) during 10 mM glutamate application. GluA2 receptors were co-expressed with iGluSnFR, SnFR-γ2, or SnFR-γ8. The current recording from whole-cell patch-clamp fluorometry acts as a fiduciary for membrane expression, normal auxiliary protein function, and fast solution exchange. (C) Glutamate concentration–fluorescence response relationships for iGluSnFR (n = 4), SnFR-γ2 (n = 4), and SnFR-γ8 (n = 5) in HEK cells. (D, E) Statistics of peak fluorescent response and decay time constants (tau) for iGluSnFR (n = 15), SnFR-γ2 (n = 8), and SnFR-γ8 (n = 7), recorded as in panel (B). (F, G) Steady-state currents (normalised to peak response) and I–V relations for peak currents elicited by 10 mM glutamate for GluA2 and iGluSnFR cotransfection (n = 6), and for SnFR-γ2 (n = 10) and SnFR-γ8 (n = 10) complexes. Error bars represent standard deviation of the mean. Probabilities of no difference are from Dunn’s non-parametric multiple comparisons test.
Figure 1—figure supplement 1
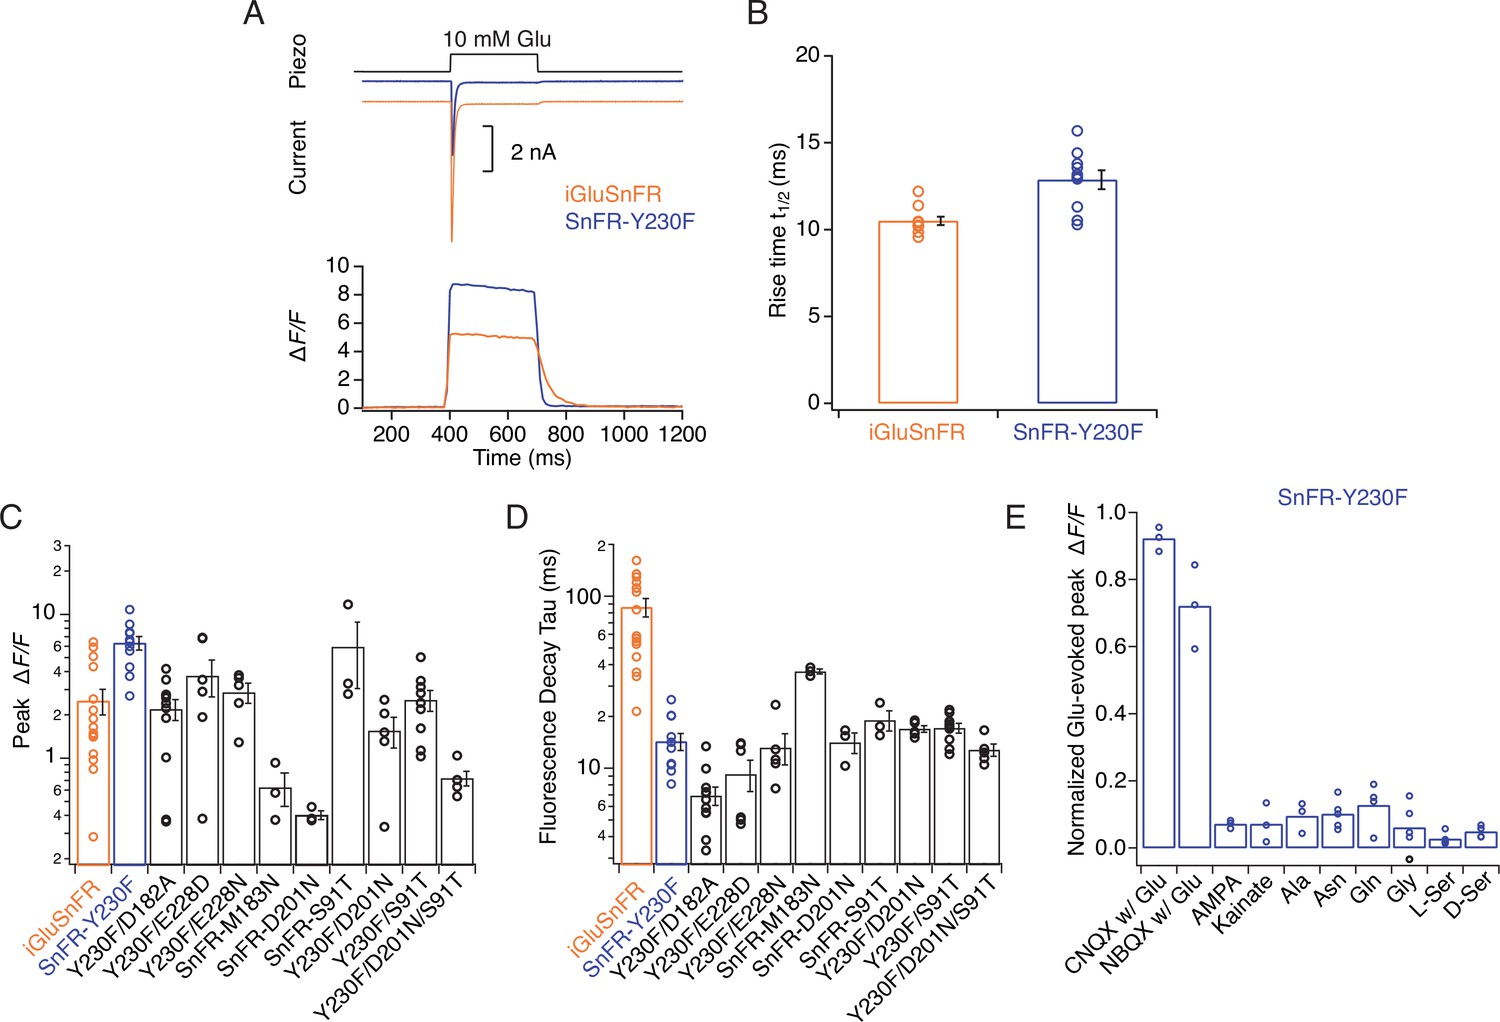
Kinetic properties and selectivity of iGluSnFR variants in HEK cells.
(A) Patch-clamp fluorometry of iGluSnFR (orange traces) and the SnFR-Y230F variant (blue traces) in whole lifted cells revealed a stronger fluorescence response and faster off kinetics for Y230F than the iGluSnFR parent construct. Representative current traces show the independent response to 10 mM glutamate from co-transfected GluA2 AMPA receptors, indicating the fast solution exchange (~5 ms). (B) Rise time to peak fluorescent response of iGluSnFR for 10 mM glutamate application (n = 10) and Y230F (n = 10). (C, D) Statistics of peak fluorescent response and decay time constant at the end of the glutamate pulse of iGluSnFR and mutants. (E) Statistics of normalised effects of GluA2 inhibitors, agonists, and amino acids on SnFR-Y230F variant in patch-clamp fluorometry, indicating it retains the excellent specificity of the parent construct.
Figure 1—figure supplement 2
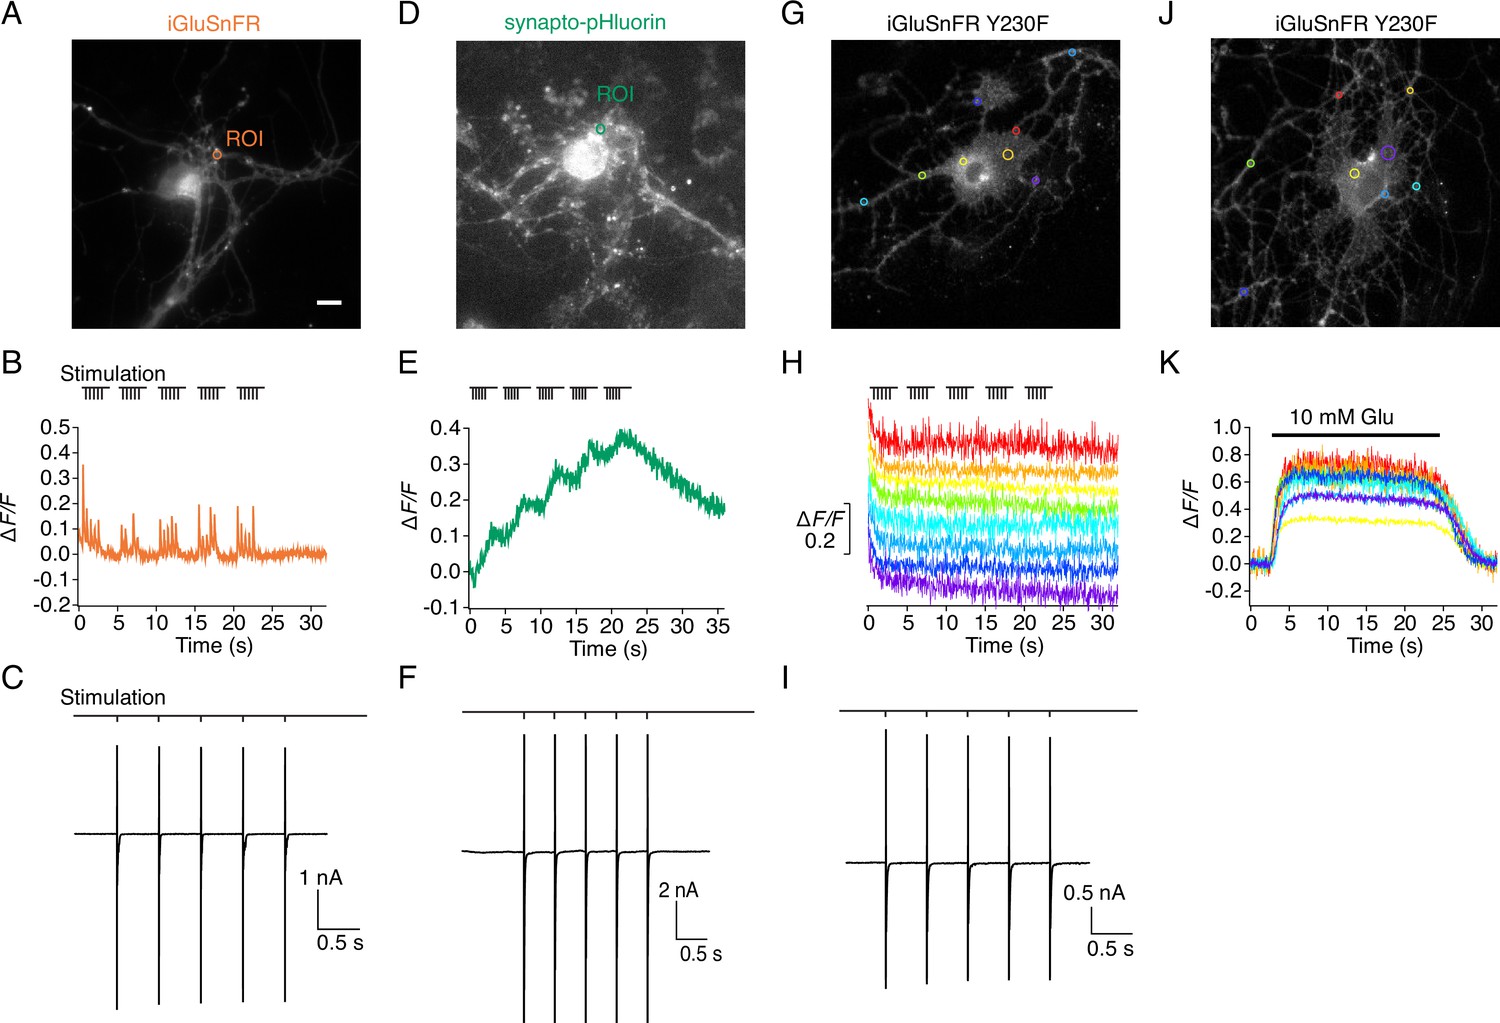
Evoked currents and fluorescence signals of iGluSnFR, SnFR-Y230F variant, and synapto-pHluorin on autaptic neurons.
(A) Representative fluorescence micrograph (scale bar, 5 μm) for an autaptic neuron expressing iGluSnFR with a region of interest (ROI) marked. (B) Fluorescence time series from the ROI recorded during a patch-clamp experiment. (C) Excitatory postsynaptic currents were evoked by escaping action potentials (also drawn). Stimulation of five pulses at 2 Hz shows robust iGluSnFR responses. (D–F) As for panels (A–C) but for an autaptic neuron expressing synapto-pHluorin, showing an accumulating fluorescence increase from the ROI marked with a green circle in (D) that returned much more slowly to the baseline. (G–I) As for panels (A–C) but for an autaptic neuron expressing the SnFR Y230F mutant. Evoked currents of Y230F variant were similar to those seen for iGluSnFR and synapto-pHluorin, but there were no fluorescence signals at any ROI during stimulation with the same protocol. Eight colour-coded time series are shown, corresponding to the coloured circles in panel G. (J, K) Direct application of 10 mM glutamate close to the neuron gave robust fluorescence increases at multiple sites, indicating that the SnFR Y230F mutant was membrane expressed and was functional.
Figure 1—figure supplement 3
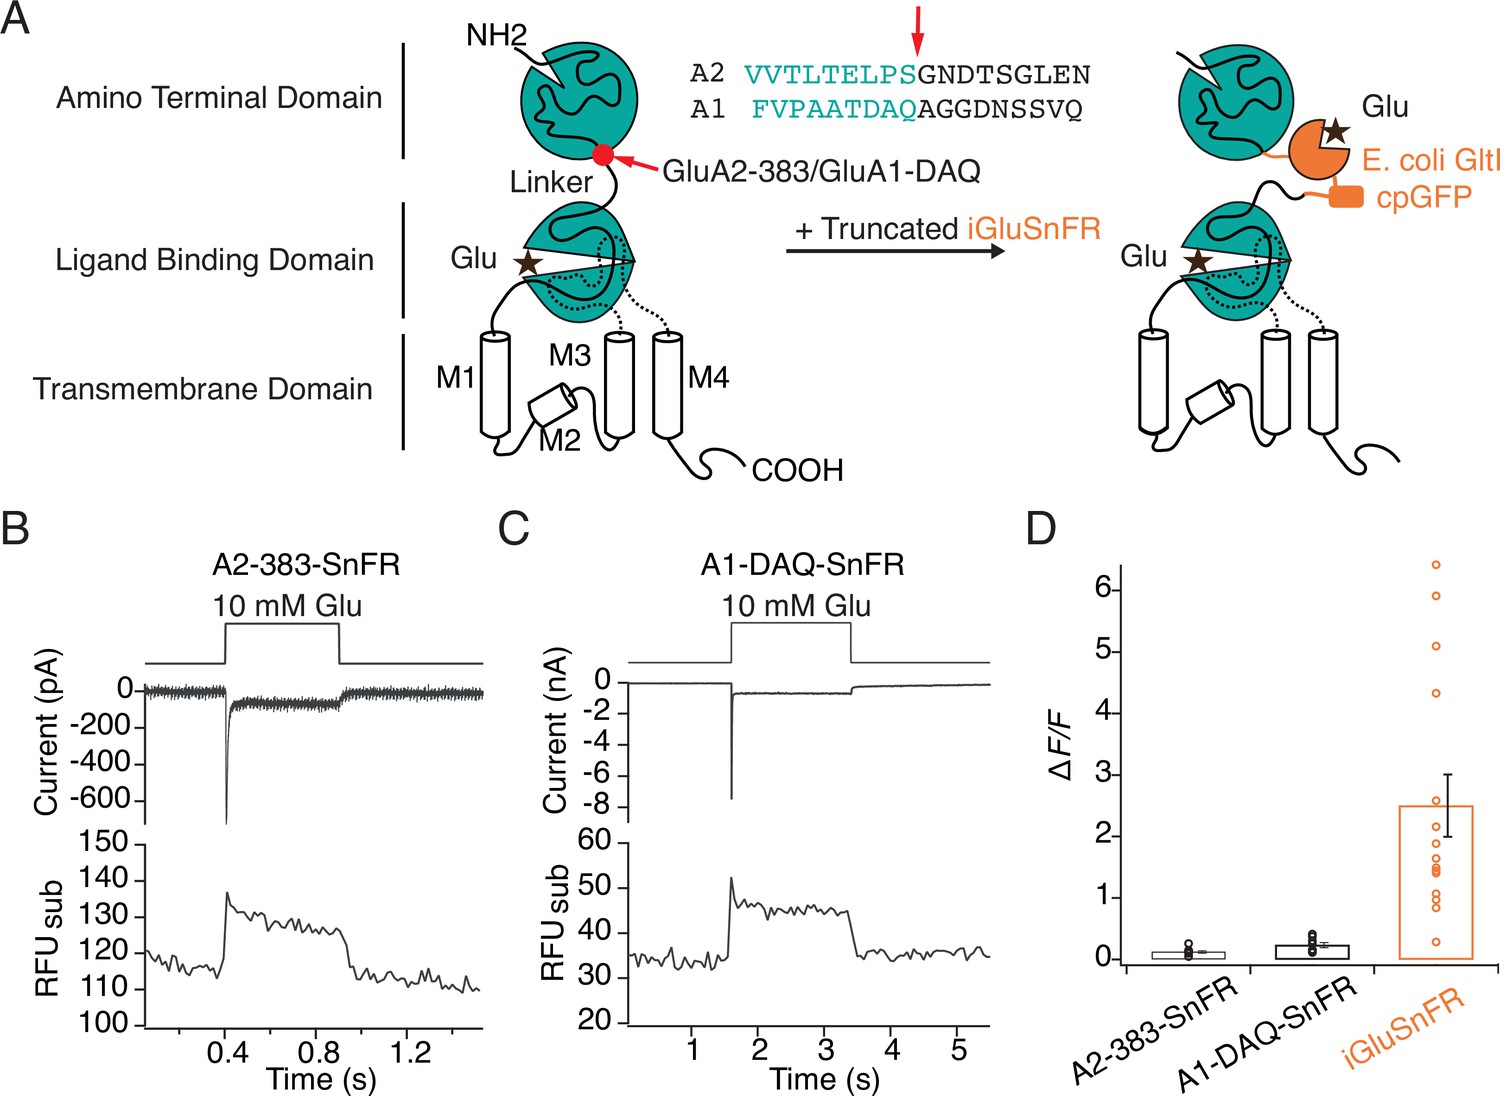
Poor optical performance of truncated SnFR insertions to chimeric AMPA receptors.
(A) Engineering of GluA—iGluSnFR chimeras. Truncated iGluSnFR (GltI and cpGFP), flanked by short linker sequences was inserted at 383 and DAQ sites at the beginning of the linker between ATD and LBD domains of GluA2 and GluA1. Insertion points in the amino acid sequences of GluA2 and GluA1 receptors are indicated in red. (B, C) Representative whole-cell current and subregion fluorescent traces for GluA2-383-SnFR and GluA1-DAQ-SnFR, showing normal current responses but very small fluorescence changes upon glutamate (10 mM) perfusion. (D) Bar graph showing that fluorescence responses to glutamate for GluA2/A1 SnFR chimeras are far weaker than those of iGluSnFR in patch-clamp fluorometry.
Figure 2
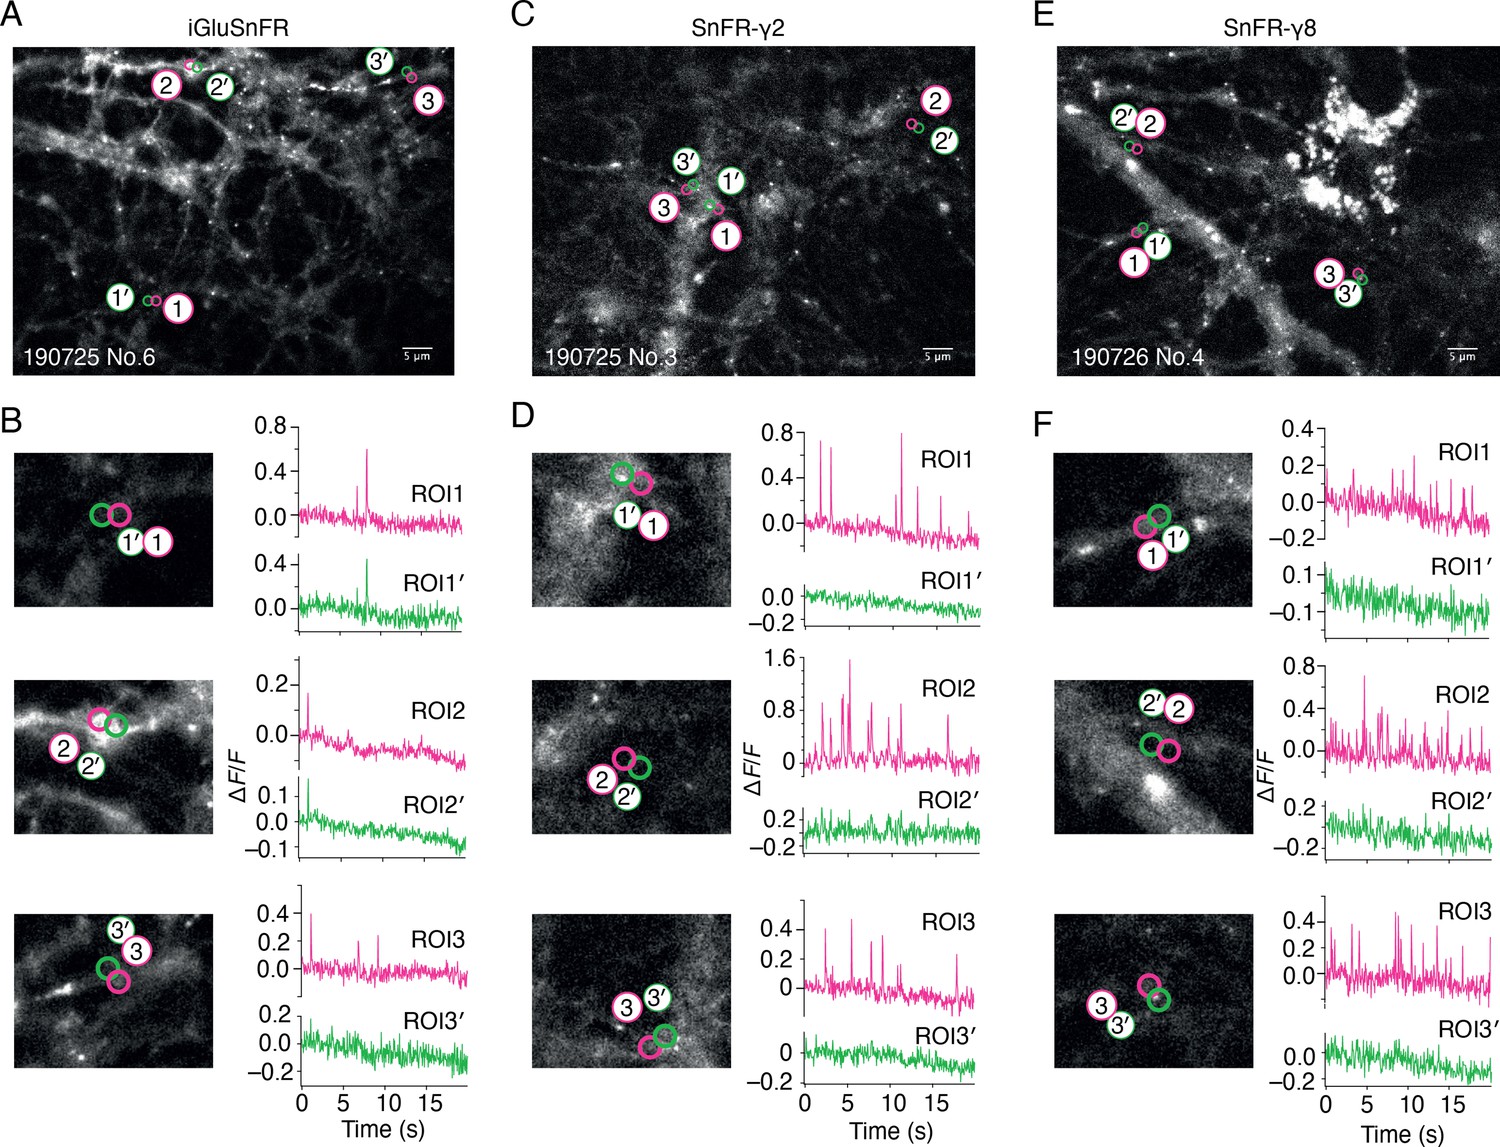
Spontaneous responses of iGluSnFR, SnFR-γ2, and SnFR-γ8 expressed in cultured rat hippocampal neurons.
(A) Fluorescence micrograph of neurons expressing iGluSnFR with three typical regions of interest marked (ROIs, indicated as magenta circles) and compared with adjacent ROIs of the same size (shown as green circles, with prime). Scale bar, 5 μm. (B) Higher magnification views (2.2-fold zoom) around the individual ROIs and the corresponding colour-coded fluorescence time series. Vertical deflections correspond to spontaneous responses. Note similarity between magenta and green traces. All fluorescence time series were collected at 20 Hz. (C, D) As in panels A and B, but for neurons expressing SnFR-γ2. Note the lack of features in the green traces. (E, F) As in panels A and B, but for neurons expressing SnFR-γ8.
Figure 3
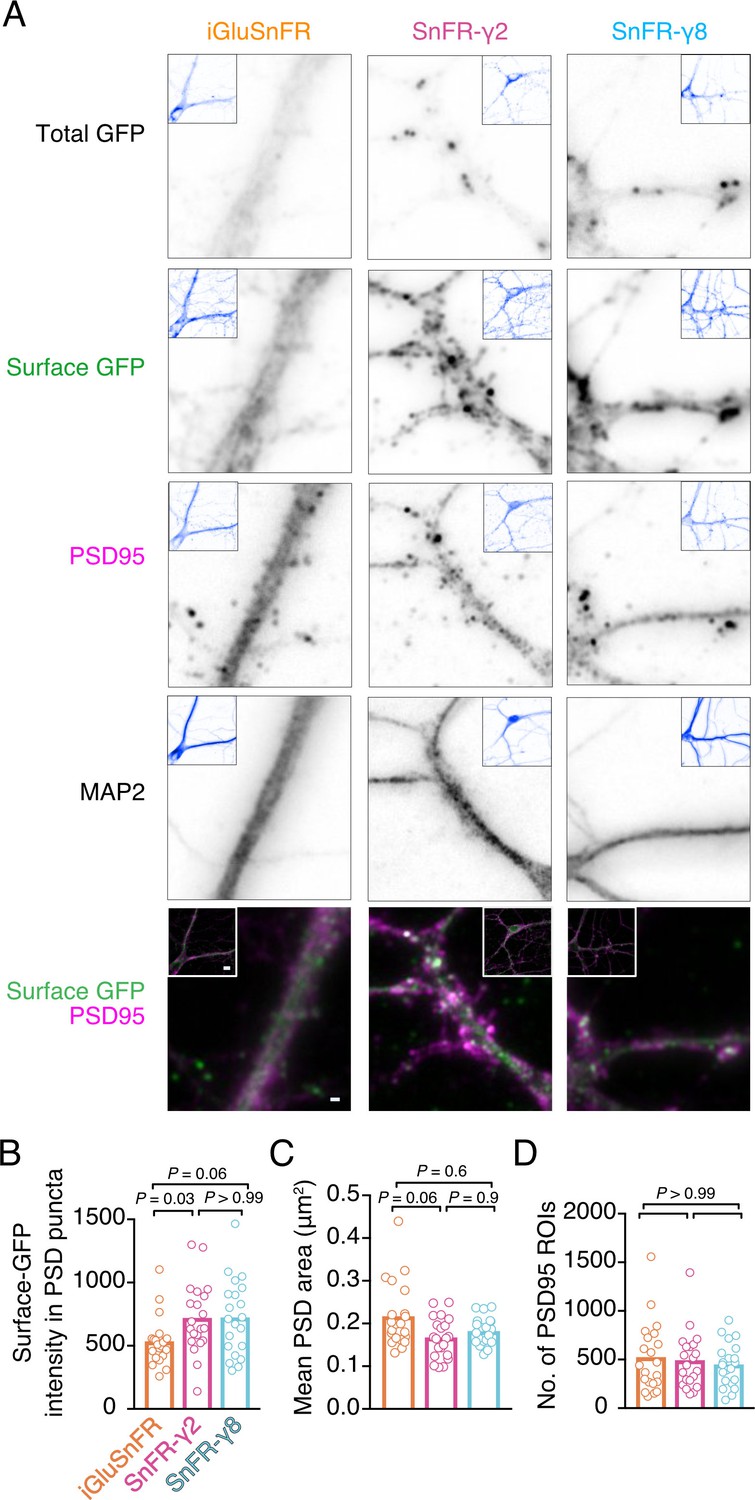
Localisation of iGluSnFR variants at synapses.
(A) Representative images of hippocampal neurons infected with iGluSnFR, SnFR-γ2, and SnFR-γ8 and live immunostained with antibodies against GFP for surface labelling. After fixation, cells were stained for the postsynaptic marker protein PSD95 and neuronal marker MAP2. Top row shows the total GFP signal from the SnFR constructs in quiescent conditions. Bottom panels show merge of Surface GFP (green) and PSD95 (magenta) labelling for synaptic localisation. Scale bar, 1 μm. Inset images represent full field of view of each representative imaged neuron, with scale bar corresponding to 5 μm. Quantification of fluorescence intensity of surface GFP in PSD95 puncta, which was larger for SnFR-γ2 (B), mean area of PSD95 puncta on a per cell basis (C), and number of PSD95 puncta per field of view (D) in neurons infected with iGluSnFR, SnFR-γ2, and SnFR-γ8 (n = 21 neurons for each condition). Data shown are individual points and means. Three independent neuronal cultures were assessed, and probabilities of no difference were determined from Dunn’s non-parametric multiple comparisons test.
Figure 4

SnFR-γ2 and SnFR-γ8 give a more spatially precise signal than iGluSnFR.
(A) Time-lapse with 40-Hz frame rate of representative spontaneous fluorescence responses for iGluSnFR and SnFR-γ2 (separate recordings from separate neurons). For SnFR-γ2, the signal coincides with Homer-tdTomato. The cell boundary (dashed line) was drawn by hand. Scale bars, 1 μm. (B) Background-subtracted heat maps of spontaneous fluorescence signals from the frame marked with the blue star. (C) Line profile (orange) and mean fluorescence time series from this line profile over 5 s. The second peak response was chosen for line profile and width analysis. (D) Fluorescence line profiles and Gaussian fits (dashed line) of individual peak response and average of the peak and the two consecutive frames. The widths of the fitted Gaussian profiles were 0.45 and 0.30 μm for individual peak and average three frames, respectively. (E) Fitted width profiles for SnFR-γ2 (n = 30, 5 neurons) and SnFR-γ8 (n = 25, 6 neurons) are substantially narrower than SnFR (n = 24, 8 neurons). (F) SnFR-γ2 (n = 30) showed larger relative fluorescence changes than SnFR (n = 24) for the peak normalised fluorescence change. (G) Over the average three frames around the peak, both SnFR-γ2 and SnFR-γ8 showed larger responses. Data represent single fluorescent spots and mean ± standard deviation of the mean. Probabilities of no difference were determined from Dunn’s non-parametric multiple comparisons test.
Figure 5 with 2 supplements
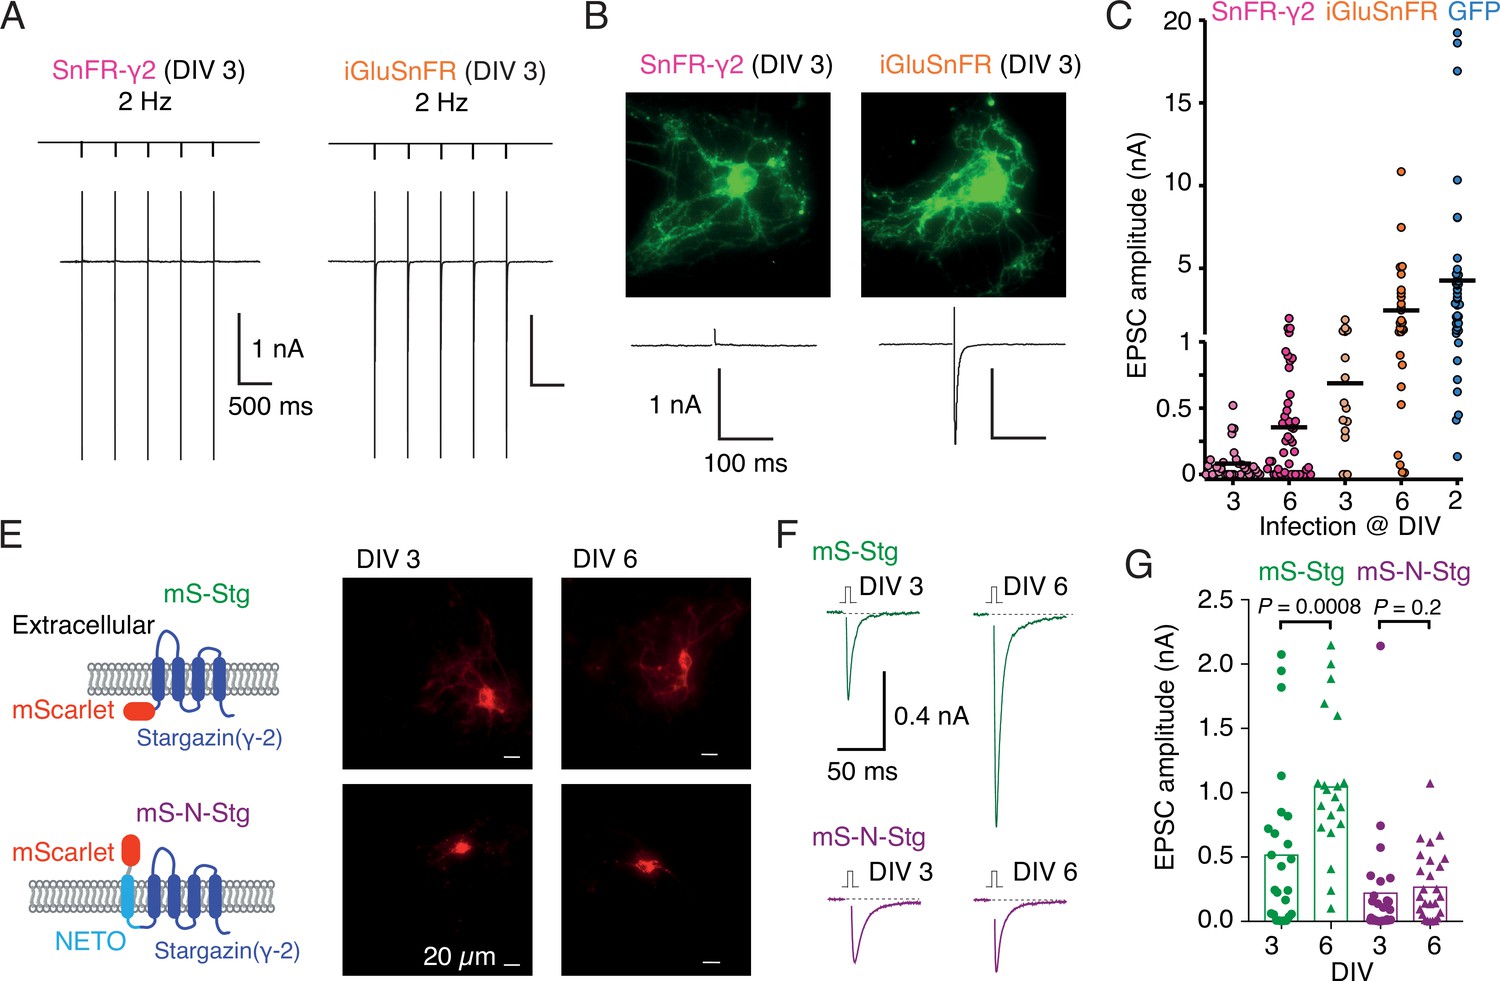
Early infection with SnFR-γ2 or Stargazin disrupts glutamatergic currents in autaptic hippocampal neurons.
(A) Responses of autaptic neurons infected with SnFR-γ2 or iGluSnFR to a five pulse train at 2 Hz. (B) The maximum projections of the fluorescence Eilers and Boelens, 2005 from each cell in panel (A), and the first response in the train with the action potential partially blanked. Both cells showed fluorescent responses to 2-Hz stimulation (not shown), but only the iGluSnFR-infected cell showed an excitatory postsynaptic current (EPSC). (C) Summary graph of the EPSC amplitudes in autaptic hippocampal neurons expressing SnFR-γ2 or iGluSnFR, infected on DIV 3 or before, and DIV 6 or after. EPSCs from cells infected with AAV-eGFP on DIV 2 are included for comparison (blue). (E) Cartoon of Stargazin constructs tagged on the N-terminal with mScarlet (mS-Stg, green, upper row) or extracellular mScarlet with NETO2 helix (mS-N-Stg, magenta, bottom row) and representative fluorescence images of autaptic hippocampal neurons infected at DIV 3 (left pair) or DIV 6 (right pair). (F) Representative EPSCs evoked by one action potential in autaptic hippocampal neurons expressing mS-Stg (green traces) or mS-N-Stg (magenta traces) infected at DIV 3 (left trace) or DIV 6 (right trace). (G) Summary graph of the EPSC amplitudes in autaptic hippocampal neurons expressing mS-Stg (green) or mS-N-Stg (magenta) at either DIV 3 (circles) or DIV 6 (triangles) (n = 25, 24, 20, and 26, respectively). Data shown are individual points, bars are means. Three independent neuronal cultures were examined, with recording and analysis performed blind. Probabilities of no difference are from the Mann–Whitney non-parametric test.
Figure 5—figure supplement 1
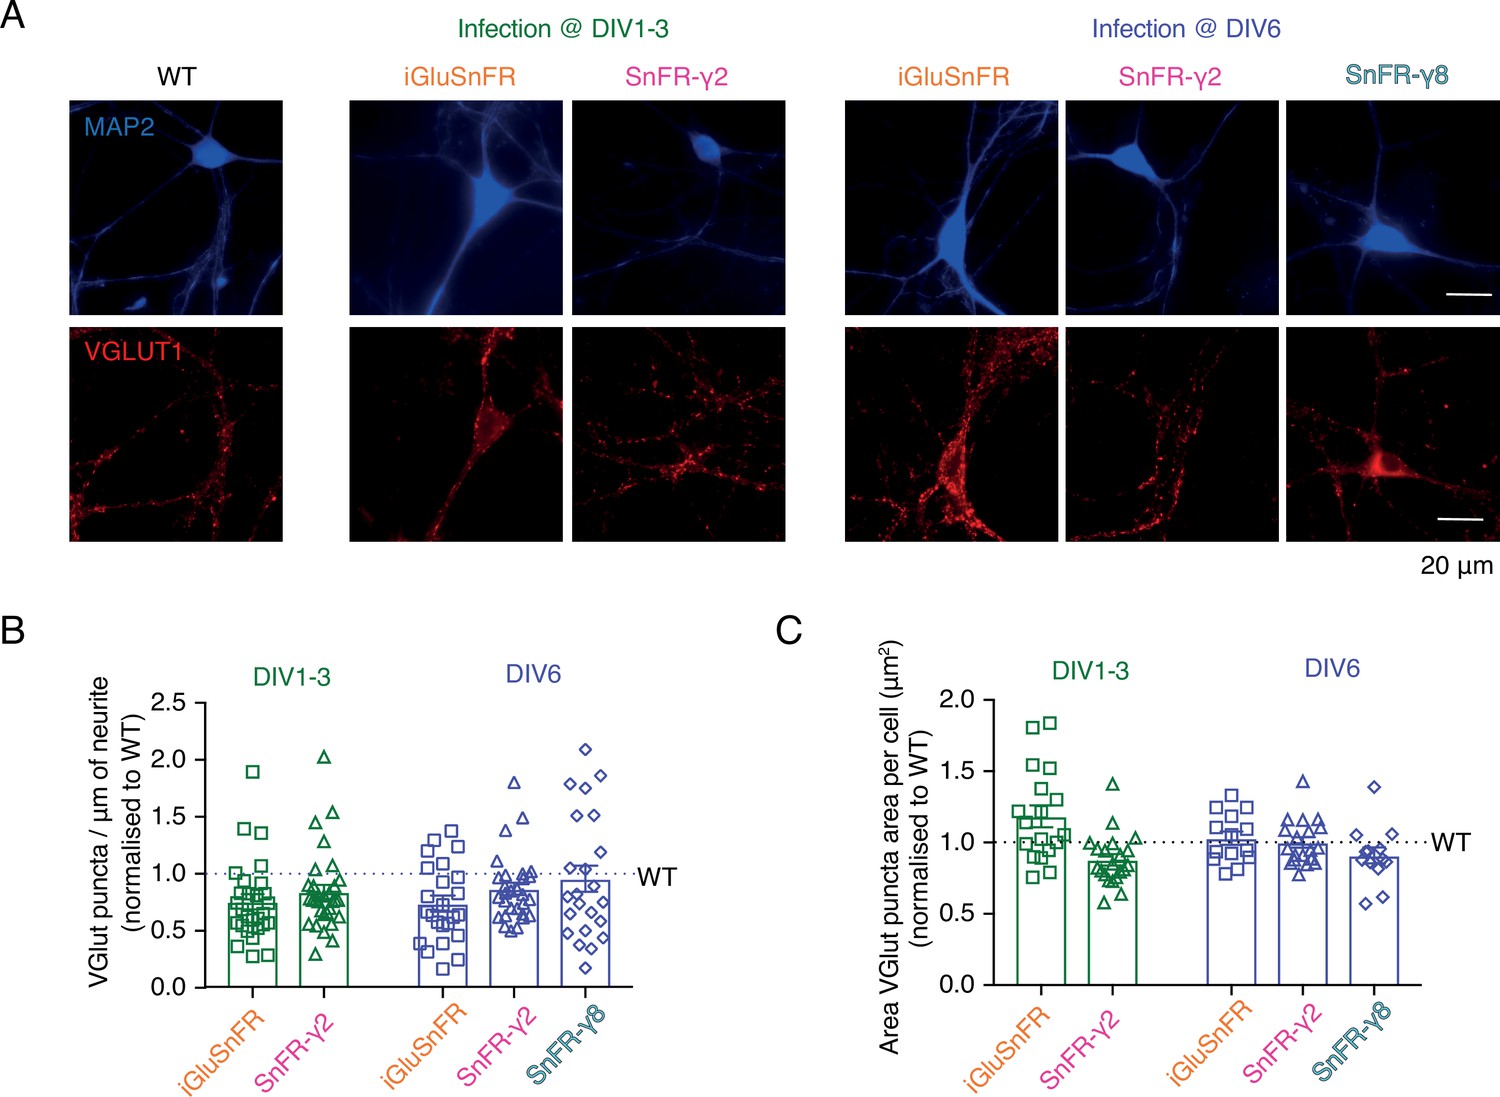
Neither SnFR-γ2 nor SnFR-γ8 influences synapse density or size in hippocampal neuron cultures.
(A) Representative images of synapse density in control (WT), iGluSnFR, SnFR-γ2, and SnFR-γ8 expressed in bulk hippocampal neuron cultures infected at DIV 1–3 (middle panel) or DIV 6 (right panel). Synapse density was assessed by double immunofluorescence labelling for MAP2 (blue, top images) and VGLUT1 (red, bottom images). Scale bar, 20 μm. Quantification of synapse density per μm of neurite (B) and area of VGLUT puncta per cell (C) in neurons infected with iGluSnFR and SnFR-γ2 at DIV 1–3 (n = 18 and 21, respectively, green bars) and neurons infected with iGluSnFR, SnFR-γ2, and SnFR-γ8 at DIV 6 (n = 14, 19, and 13, respectively, purple bars) normalised to WT (n = 16). Data shown are individual points and means with standard deviation of the mean. Three independent neuronal cultures were assessed, and the statistical test of no difference was the Mann–Whitney non-parametric test.
Figure 5—figure supplement 2
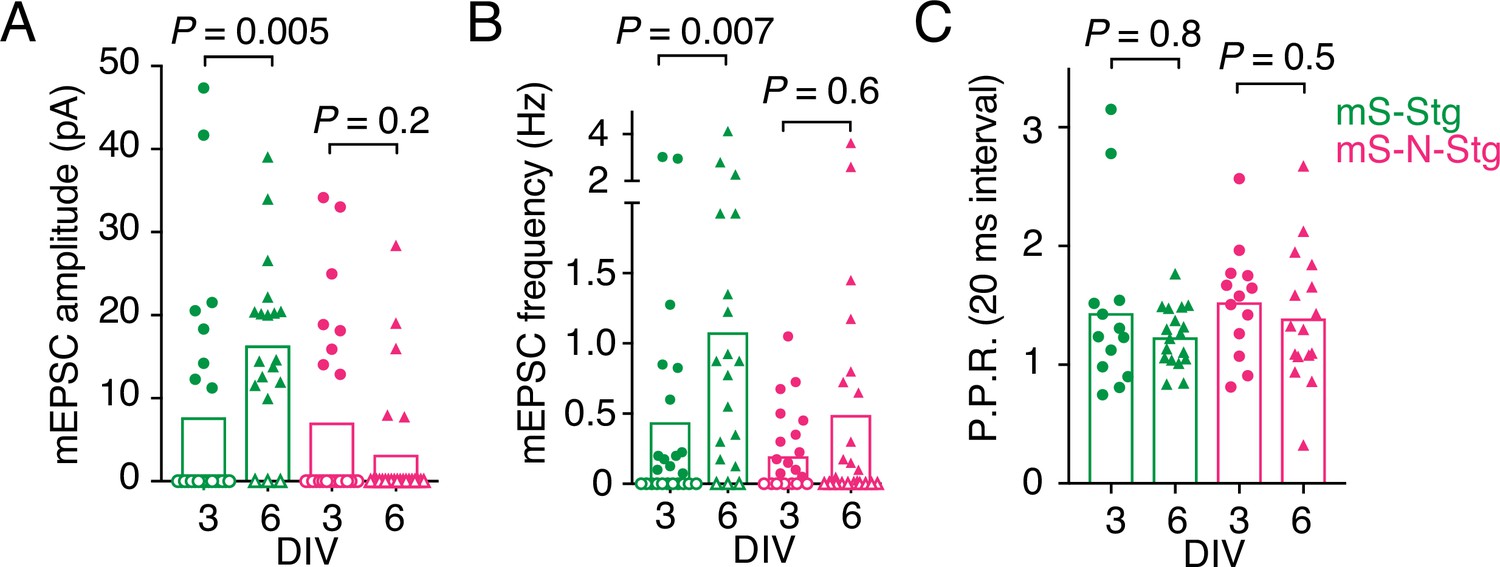
Electrophysiological parameters of autapses overexpressing Stargazin constructs.
Miniature excitatory postsynaptic current (EPSC) amplitude (A), mEPSC frequency (B), and paired-pulse ratio (P.P.R.) (C) for neurons expressing mScarlet-Stg (green) or mScarlet-NETO-Stg (magenta) that were infected at either 3 (circles) or 6 (triangles) days in vitro (DIV). For (A) and (B), three independent neuronal cultures were examined (from left to right, n = 25, 24, 20, and 26 cells, respectively), with recording and analysis performed blind to the construct used. Open symbols correspond to zero values from cells that could not be analysed (see Methods for criteria). These zero values were included in the means and statistical comparisons for (A) but not for (B). For (C), across the four conditions (mS-Stg, DIV 3 and DIV 6 and mS-N-Stg, DIV 3 and DIV 6), 10/23, 2/20, 11/24, and 3/24 cells were non-responsive. Data shown are individual points, bars represent means. Probabilities of no difference are from the Mann–Whitney non-parametric test.
Figure 6
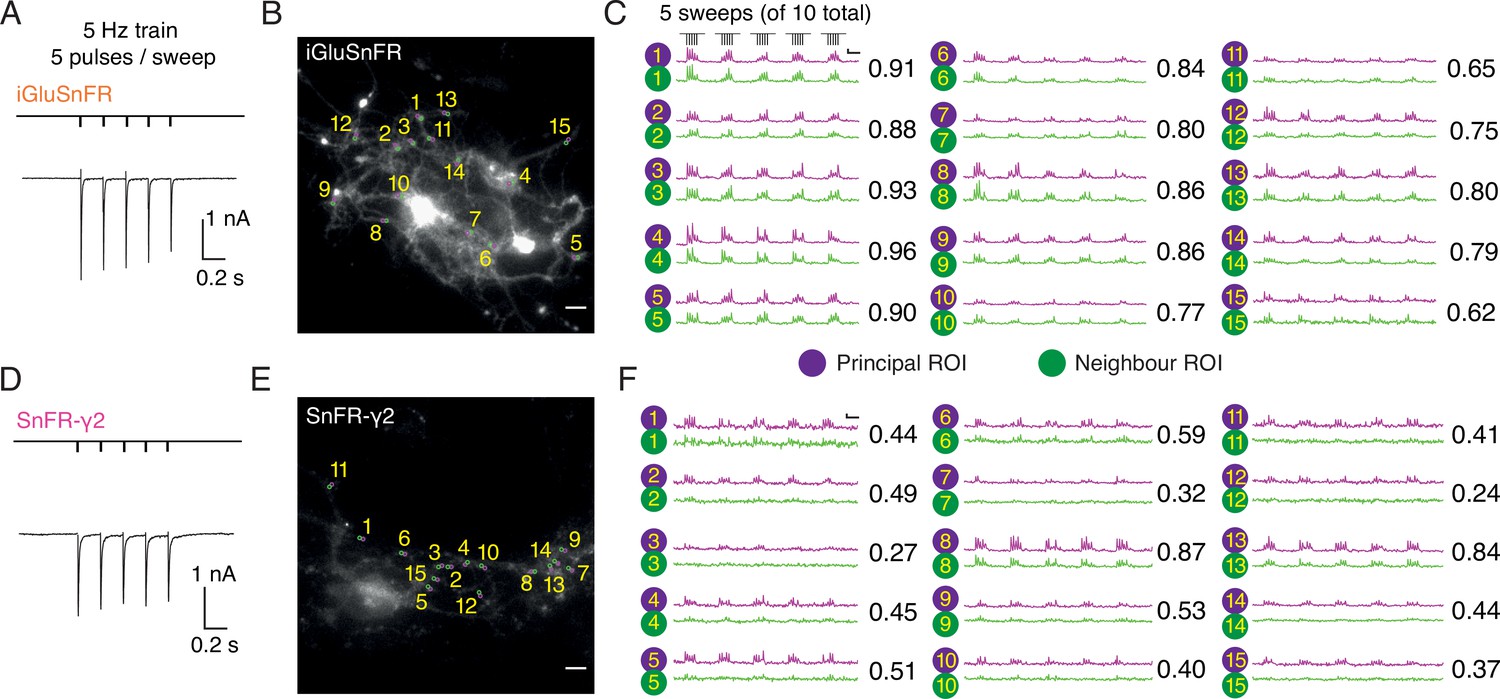
Evoked currents and fluorescent responses of iGluSnFR and SnFR-γ2 from autaptic neurons.
(Α) A train of five action potentials (APs) evoked five glutamatergic currents (excitatory postsynaptic currents, EPSCs) from an autaptic neuron infected with iGluSnFR (infected after DIV 6) in 2 mM calcium. The depolarisation and single AP are blanked to reveal the EPSC. This stimulus was repeated 10 times. (B) Fluorescence micrograph of the autapse recorded in (A) with 15 principal regions of interest (ROIs) (purple circles) against neighbouring ROIs of the same size (green circles). Scale bar, 5 μm. (C) Fluorescence time series from the principal and neighbour ROIs for five sets of stimuli (indicated above trace 1). Note similarity between purple and green traces in each case, indicating a broad signal. The correlation coefficient for each pair of optical recordings is indicated. For this set of recordings, the mean Pearson coefficient was 0.82 ± 0.02 for paired iGluSnFR ROIs and 0.48 ± 0.05 for paired SnFR-γ2 ROIs. Scale bar ΔF/F is 0.2 and timebase 1 s. (D–F) Equivalent data from an autapse expressing SnFR-γ2 (infected after DIV 6). Note that most green traces from neighbour ROIs do not respond (ROIs 8 and 13 are exceptions). Scale bars match those in panels (B) and (C).
Figure 7 with 2 supplements
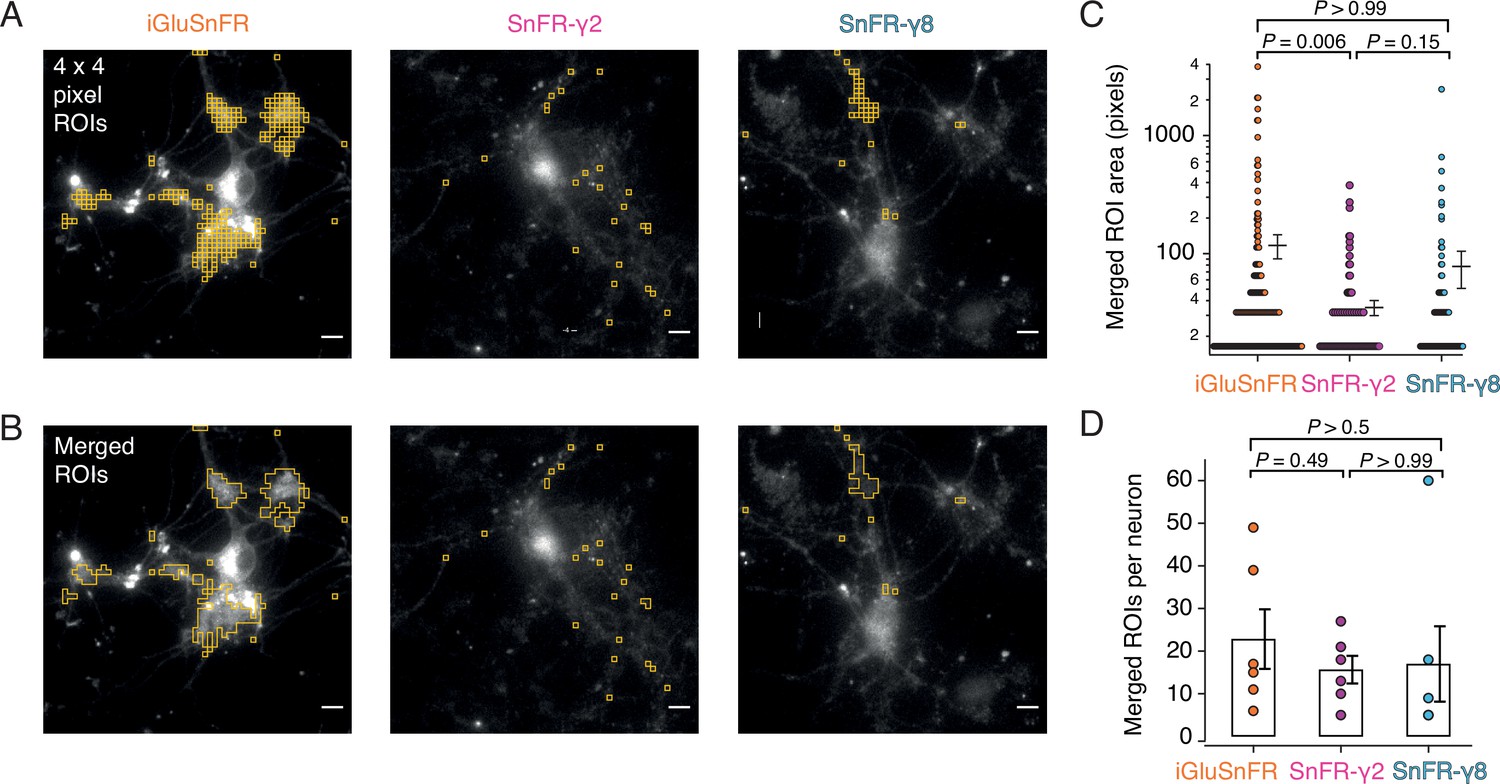
Targeted sensors give smaller and more reliable regions of interest (ROIs).
(A) ROI size analysis for evoked fluorescent responses of SnFR, SnFR-γ2, and SnFR-γ8 οn autaptic neurons. ROIs (orange outlines) automatically selected by a custom-written Fiji script (Source code 1) fulfilling the following conditions: 4 × 4 pixel ROI, intensity increase for each event ≥10%, SNR ≥3, and number of expected peaks in a movie >20. Scale bars, 5 μm. (B) As panel A but with contiguous ROIs merged. (C) Statistics of ROI sizes after merging for iGluSnFR (n = 207), SnFR-γ2 (n = 107) and SnFR-γ8 (n = 97) for six cells in each case. SnFR-γ2 shows smaller ROIs than iGluSnFR. (D) On average, the counts of ROIs per neuron were statistically indistinguishable between iGluSnFR, SnFR-γ2, and SnFR-γ8 (single field of view, ×60 objective). For panels C and D, probabilities of no difference were determined from Dunn’s non-parametric multiple comparisons test.
Figure 7—figure supplement 1
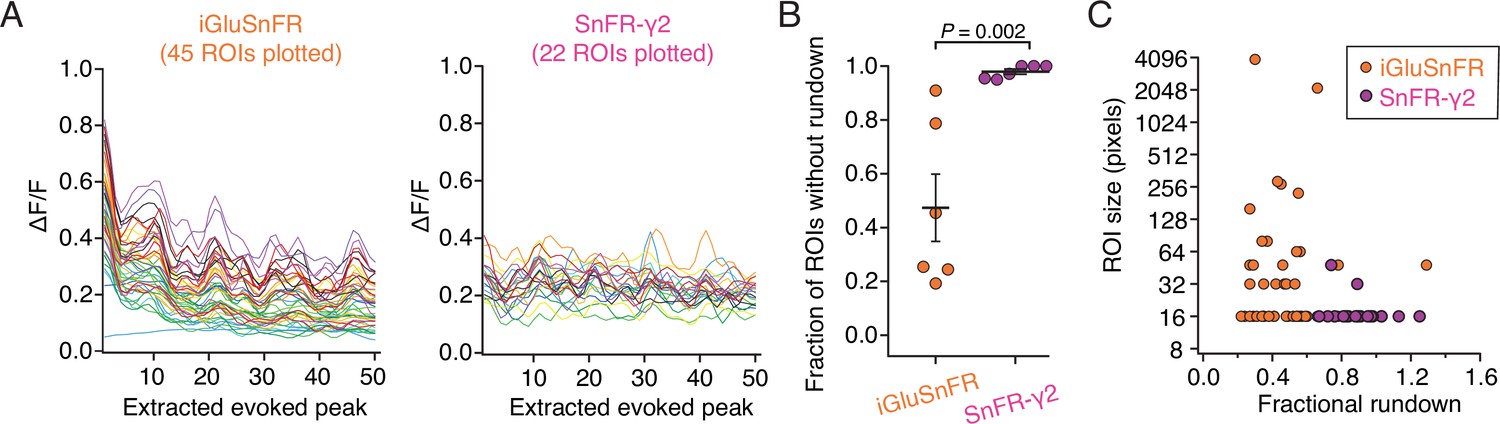
Illustrative analysis of rundown of the fluorescence signal.
(A) The smoothed amplitudes of 50 peaks extracted from movies of two neurons, one expressing iGluSnFR and one expressing SnFR-γ2. Forty-five regions of interest (ROIs) were extracted for SnFR and 22 for SnFR-γ2. Stimulation was 10 groups of 5 action potentials at 5 Hz. Correlated changes in these records likely represent similar responses of neighbouring ROIs. (B) Summary over cells included in analysis. If the signal in an ROI was reduced more than twofold across the 50 stimuli, we classified the trace as affected by rundown. This classification of rundown, although not statistically rigorous, illustrates the much greater tendency of iGluSnFR ROIs to decline in signal. On average, more than 50% of SnFR ROIs were prone to rundown whereas SnFR-γ2 ROIs were not. Probability of no difference is from the Mann–Whitney non-parametric test. (C) Rundown of SnFR responses was unrelated to the size of the automatically determined compound ROI. Error bars represent standard deviation of the mean.
Figure 7—figure supplement 2
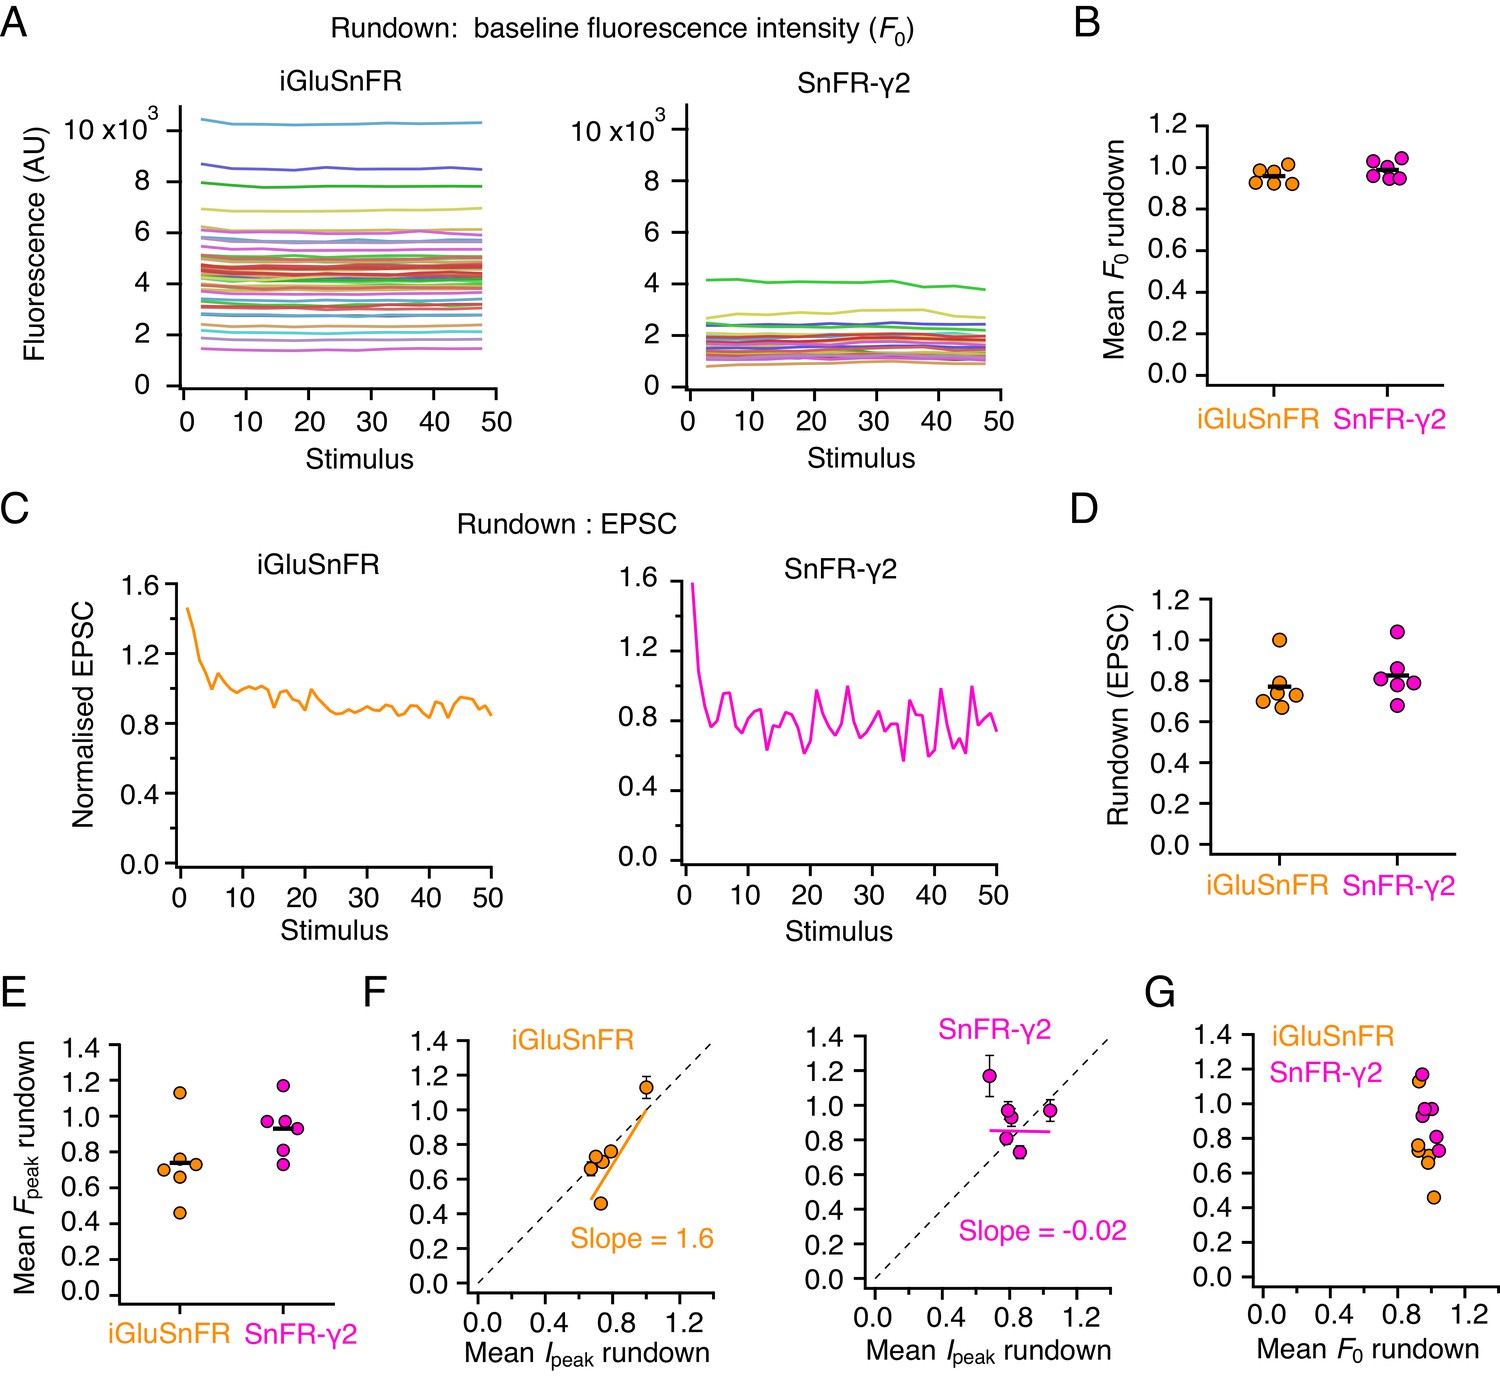
Comparing rundown between electrophysiological responses and optical report.
(A) Stable baseline fluorescence intensities (in arbitrary units, AU) for individual regions of interest (ROIs) in a single-cell expressing iGluSnFR (left) and one expressing SnFR-γ2 (right). Baseline values from 50 stimulus epochs are shown. (B) Summary of baseline fluorescence intensity stability over 50 stimuli (n = 6 cells for each construct). (C) Rundown of the evoked excitatory postsynaptic current (EPSC) response over 50 stimuli for the same two cells as in panels (A). (D) Summary of EPSC rundown over 50 episodes (same n = 6 cells as in panel (B) for each construct). (E) The rundown of the peak fluorescence averaged over all ROIs in the cell (same n = 6 cells as in panel (B) for each construct). (F) Correlation between fluorescence rundown and peak current rundown. Dashed line has slope of unity. (G) No relation between fluorescence baseline rundown and peak rundown.
Figure 8
Correlations and variance of fluorescence responses.
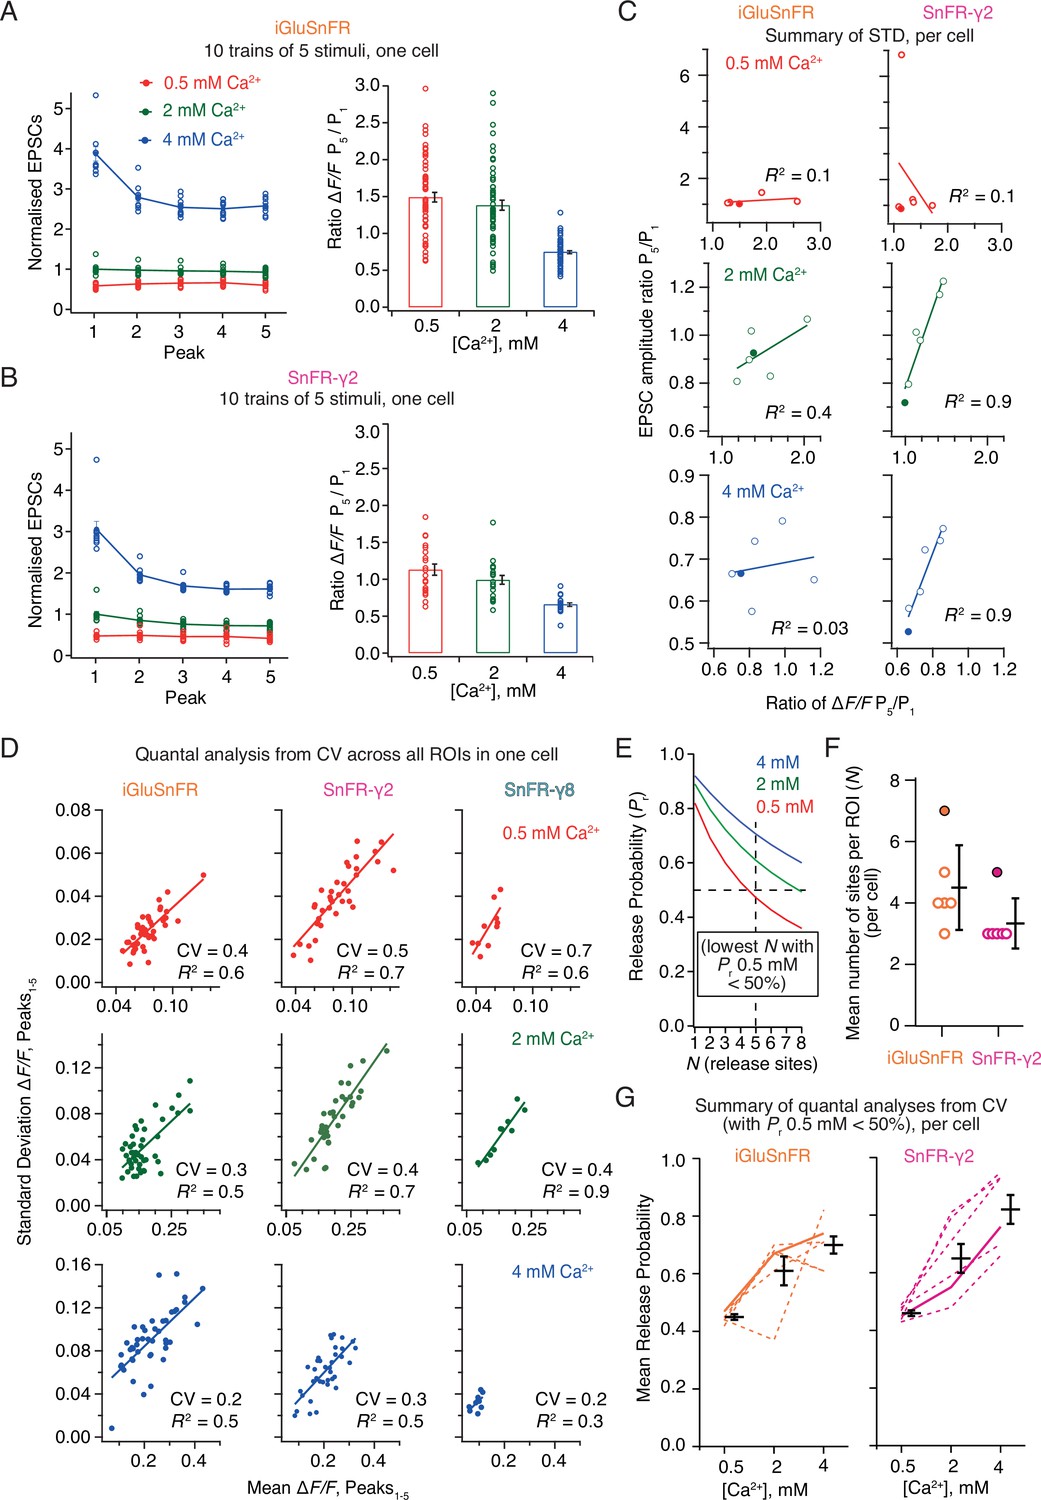
(A) Short-term plasticity of a train of five excitatory postsynaptic currents (EPSCs) evoked at 5 Hz for a single neuron (left, single responses to 10 trains and mean, normalised to the amplitude of the first response in 2 mM calcium). ∆F/F for multiple regions of interest in the same cell (right panel, bar shows mean and standard deviation of the mean). (B) As panel A but for a cell expressing SnFR-γ2. (C) Correlation between short-term depression (ratio between responses to fifth and first stimulus) from electrophysiology and fluorescence. The cells from panels (A) and (B) are indicated as filled circles. (D) To estimate population coefficient of variation (CV), the mean fluorescence response across 10 groups of 5 stimuli at 5 Hz is plotted against the standard deviation of these responses. Each point corresponds to a single region of interest (ROI). The data correspond to one cell at the three different calcium concentrations for each of the three different constructs. The CV (slope of the fitted line) was used in (E–G) to estimate population quantal parameters, except for SnFR-γ8 where the range was too small. (E) The goodness of fit was similar for a range of release site values (N, results of fit for SnFR-γ2 from panel D with N = 1–8 are shown) but only larger values gave release probability less than 50% for 0.5 mM Ca2+. These generous criteria were used to select the most conservative N values. (F) The fewest effective release sites (per ROI) that gave release probability less than 50% for 0.5 mM Ca2+ per cell. Solid symbols show the cells shown in panel D. Mean and standard deviation of the mean are indicated. (G) Dashed lines indicate release probabilities estimated over the population of responses for six cells (using N values as in panel F). Note that the increase in release probability was monotonic for SnFR-γ2 for every cell but only for 2/6 cells for iGluSnFR. The solid line indicates the cells in panel D. Mean and standard deviation of the mean are indicated.
Figure 9 with 3 supplements
Quantal analysis in autaptic neurons.
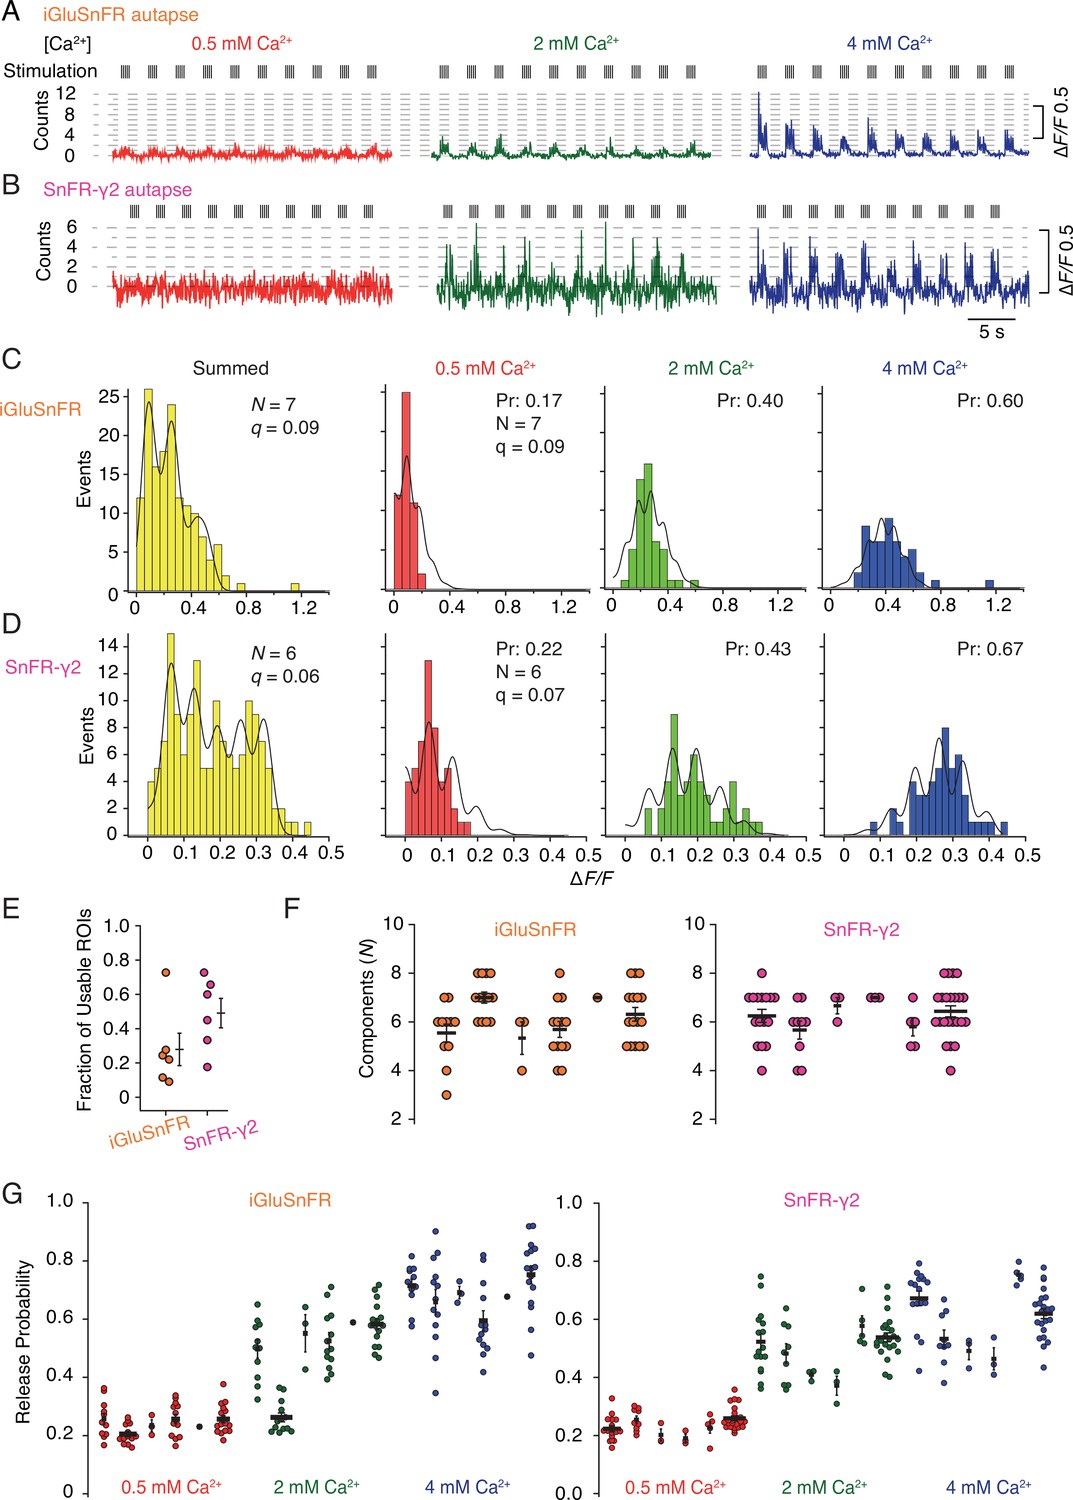
(A) Background subtracted fluorescence time series from one region of interest (ROI) from an iGluSnFR-expressing neuron at different calcium concentrations. Nominal quantal levels are indicated by dashed lines. The first response in 4 mM calcium is disproportionately large (and was usually ignored), and that steady-state responses accumulate during each train. (B) As in (A) but for a cell expressing SnFR-γ2, which showed smaller but more consistent signals. A detailed analysis of these two time series, and others recorded in parallel, is in Figure 9—figure supplement 1. (C) Histograms of peak fluorescence responses from the iGluSnFR ROI in panel A. The summed histogram (yellow) represents 150 pooled responses, fitted with a mixed Gaussian model. Other histograms were separately fitted with the binomial model, where the quantal size (here ∆F/F = 9%) was globally optimised, with the scale. The release probabilities (Pr) were optimised for each calcium concentration. The number of release sites (N = 7) was chosen to give the best fit (highest Kolmogorov–Smirnov probability). (D) As panel C but for the SnFR-γ2 ROI. (E) Only 25% of ROIs from the total were suitable for histogram fitting for iGluSnFR, whereas on average half of the SnFR-γ2 ROI were useable. (F) The distributions of N chosen to give the best fit, from all the useable ROIs from each cell for iGluSnFR and SnFR-γ2 (six cells each). (G) The distributions of release probability for each ROI, grouped by cell and calcium condition.
Figure 9—figure supplement 1
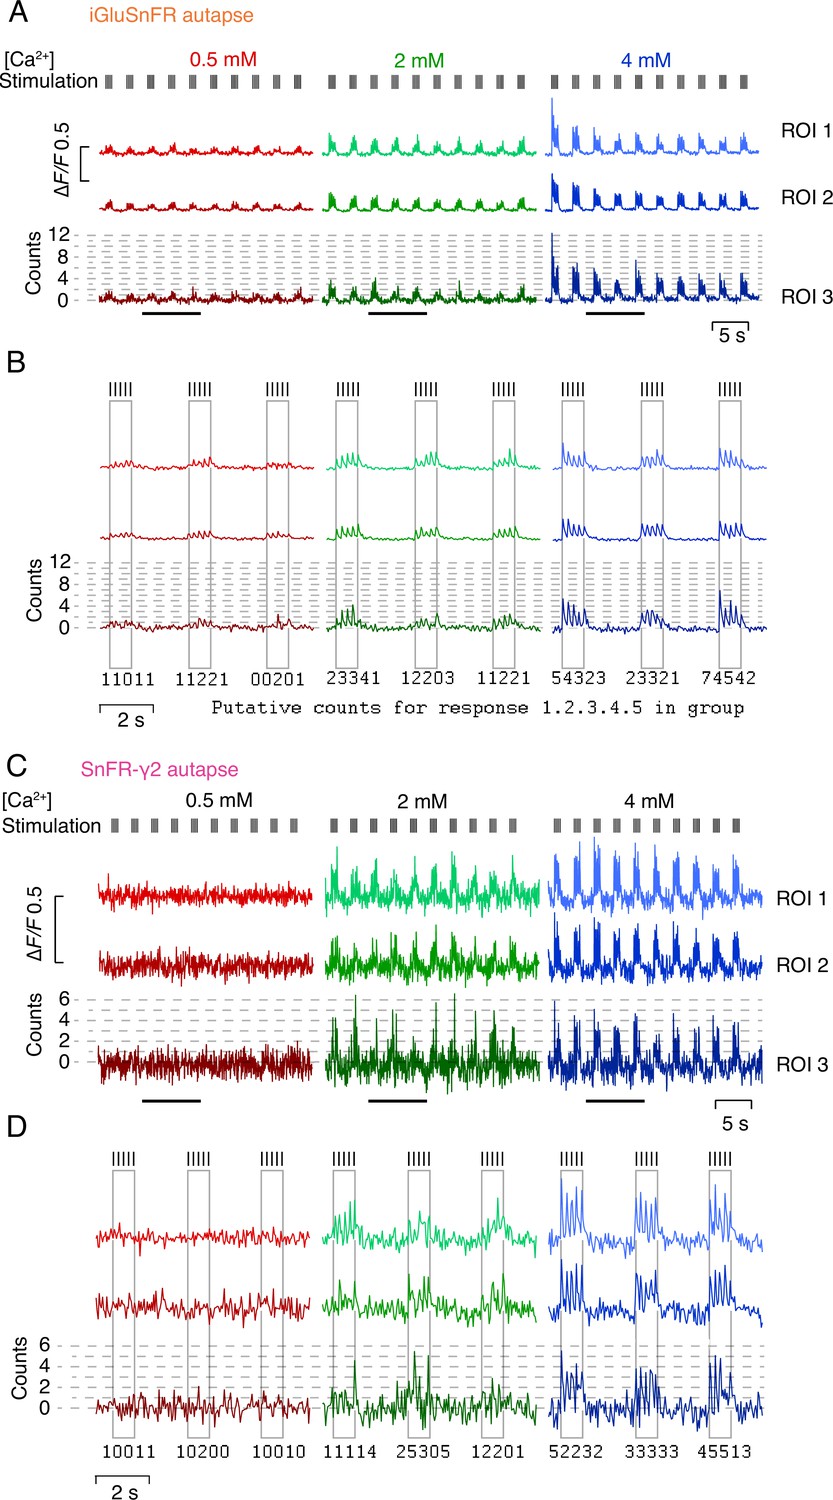
Quantal nature of indicator responses.
(A) Fluorescence time series at three calcium concentrations from three regions of interest (ROIs) in an autapse expressing iGluSnFR. Quantal analysis for ROI 3 is shown in Figure 8. Note the development of steady-state responses and mild rundown. (B) Zoom in to three groups of responses indicated by bars in panel (A). For each stimulation, a putative quantal count is given. We did not count quanta in this way, rather binning peak amplitudes into histograms. Note that the agreement of the peaks to the dashed lines is imperfect. (C) As for panel A but for a cell-expressing SnFR-γ2. Responses have smaller signal-to-noise ratio but are more consistent, showing no rundown and better quantal nature. Again, ROI 3 is analysed in Figure 8. (D) As for panel B but for the same cell as in panel (C).
Figure 9—figure supplement 2
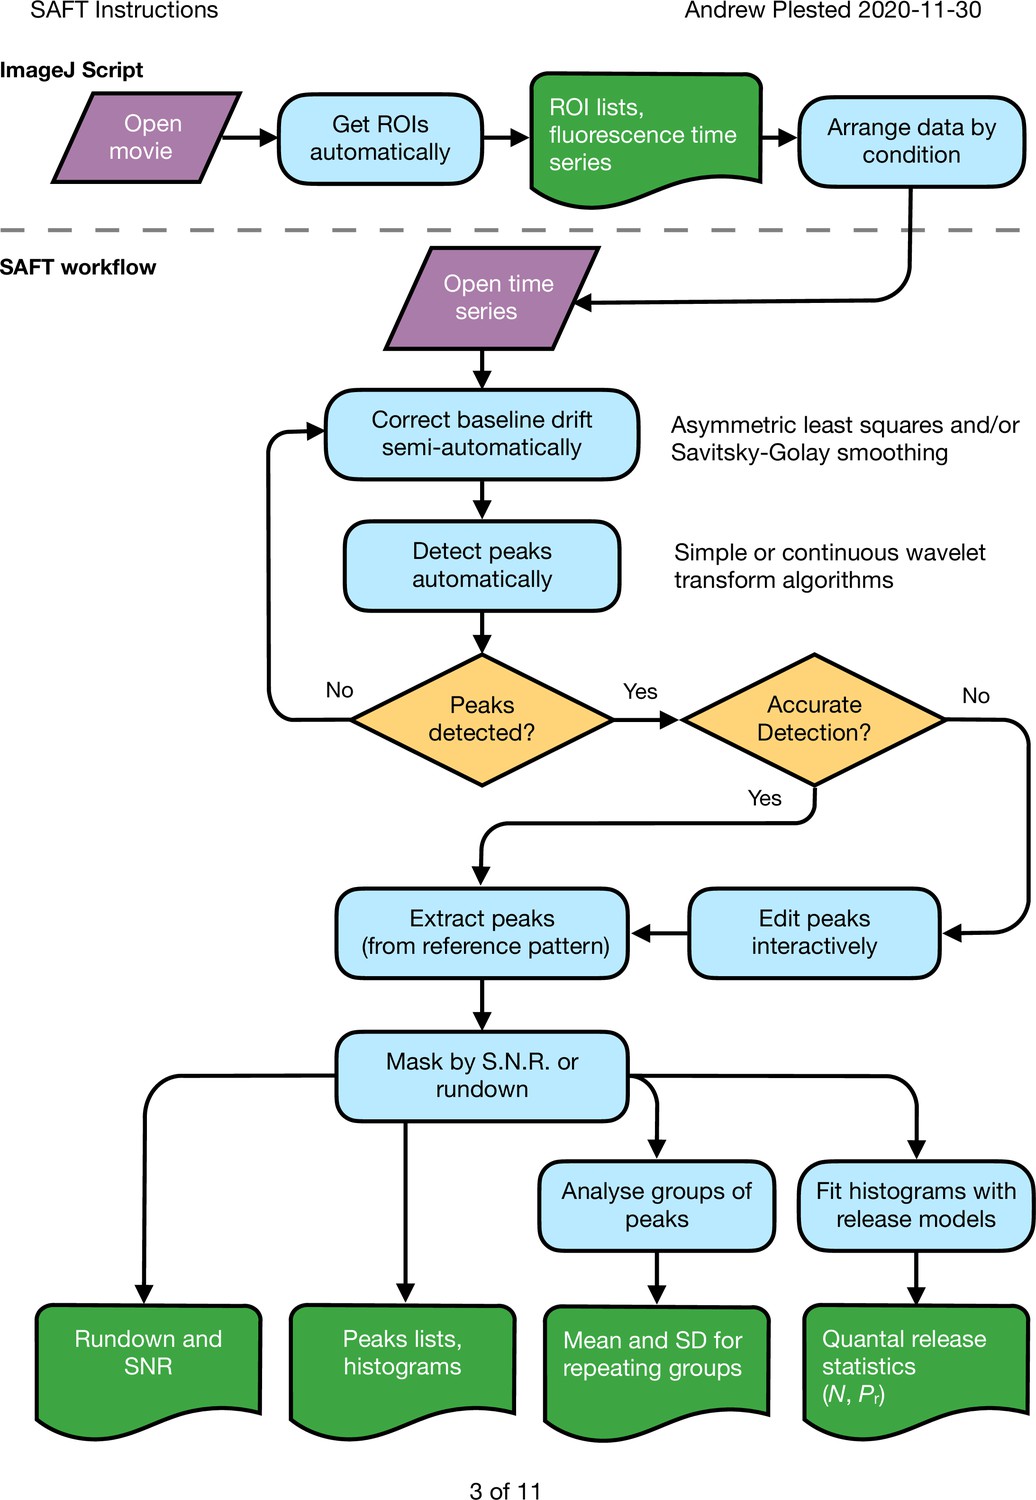
Workflow for peak response extraction and analysis of fluorescent report of glutamate release from synapses.
A script in imageJ is used to detect regions of interest (ROIs) with changes in fluorescence over the course of movies. This determination exploits information about the number of expected responses if it is available. The data are organised into spreadsheets of time series, with each sheet corresponding to a different condition in the same experiment. These data are loaded into the PYTHON application SAFT. Baseline drift and peak detection are automated but supervised and interactive for the user. SAFT generates a ‘mean’ trace to enable precise identification of the expected peak locations. These peak locations are used to extract the responses from an arbitrary number of ROIs. The output can be masked according to rundown or low signal to noise, and the listed peak responses can be analysed in groups or individually to determine quantal parameters for each putative synaptic site.
Figure 9—figure supplement 3
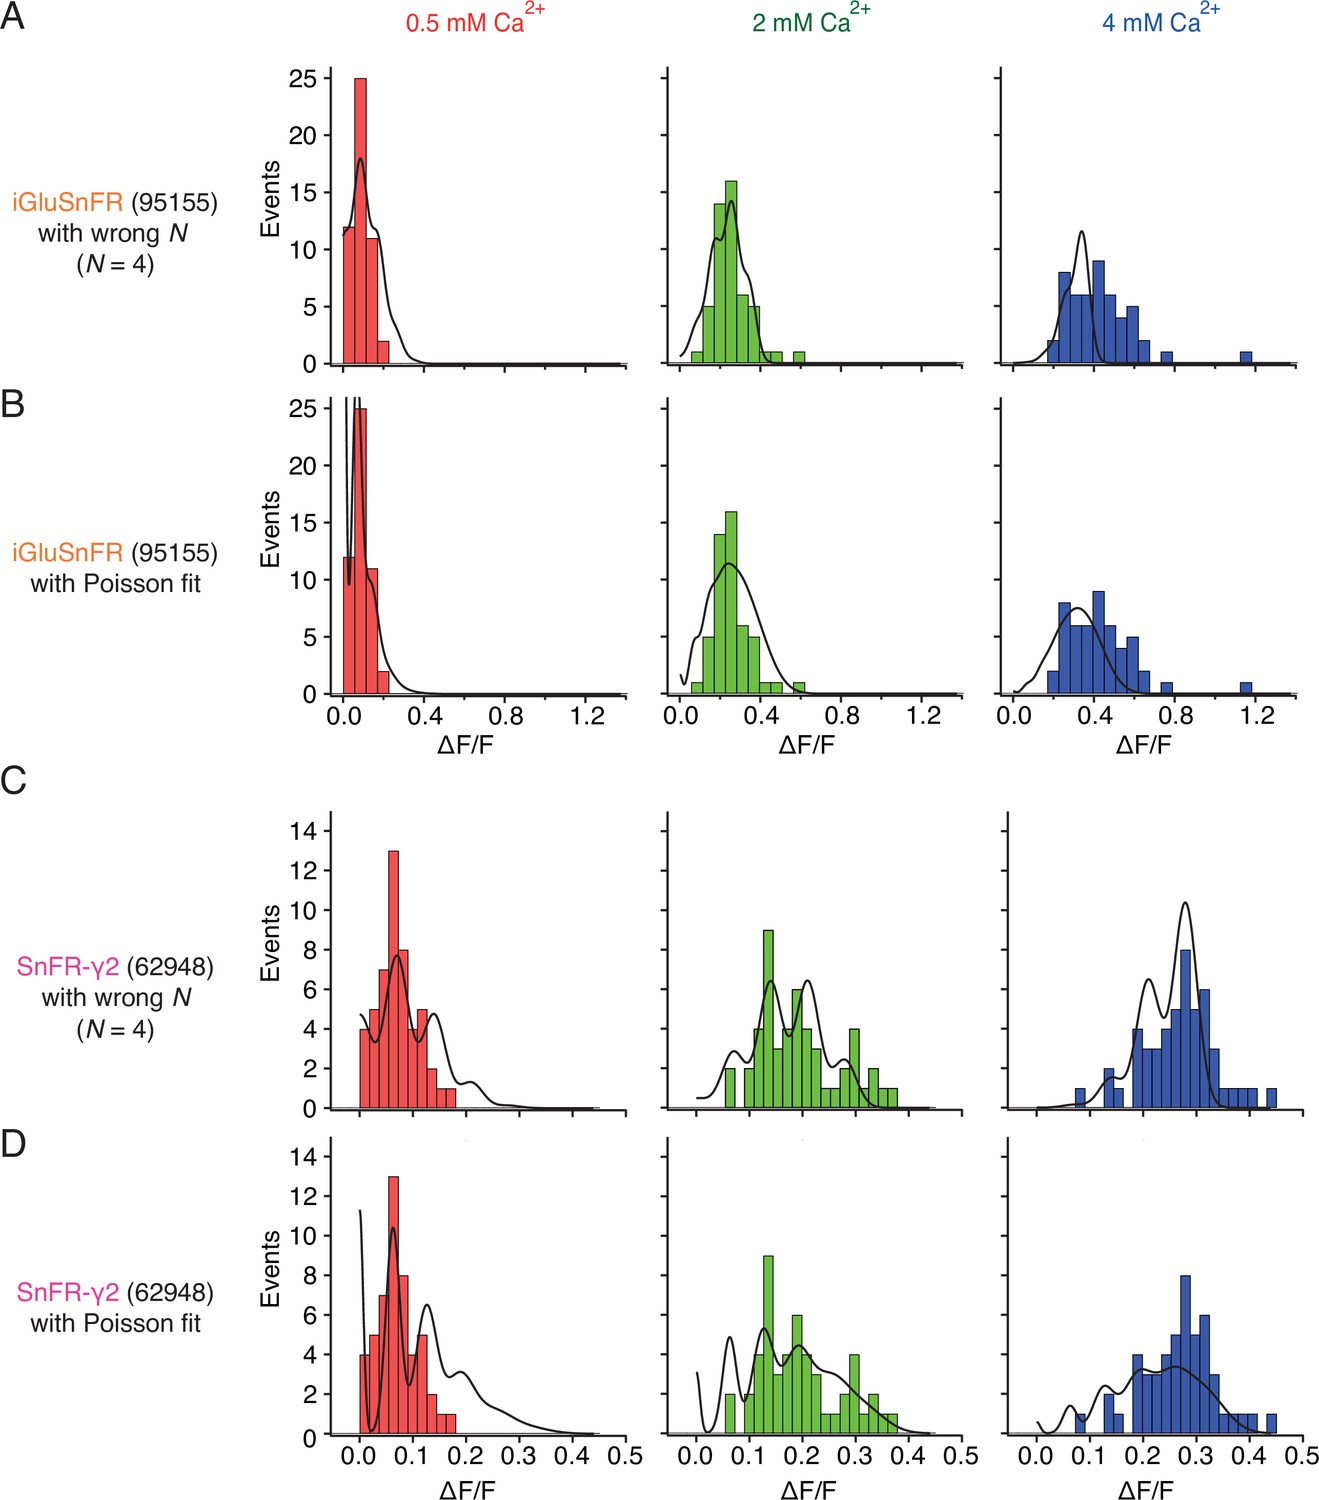
Examples of imperfect fits to peak response histograms.
(A) For a binomial model, setting the number of releasable vesicles (N) to a too small value fails to describe the full width of the amplitude distribution at 4 mM Ca2+. At 4 mM Ca2+, the release probability was erroneously determined to be 89% in this fit, because the full width of the data was not fit properly. (B) Poisson fit to the same data as in panel (A) is featureless, due to small optimised quantal size. Also, the number of failures (∆F/F ≈ 0) is overestimated at 0.5 mM Ca2+ (because release rate was optimised to be 0.96 for this condition). (C) A fit to SnFR-γ2 data with N too small overestimates PR in all conditions (29%, 60%, and 85% in 0.5, 2, and 4 mM Ca2+, respectively), without describing the full range of observed responses. (D) Poisson fit to the same data as in panel (C) erroneously overestimates failures at 0.5 mM and 2 mM Ca2+, erroneously predicts multivesicular release at 0.5 mM and underestimates large amplitude events at 4 mM Ca2+.
Figure 10
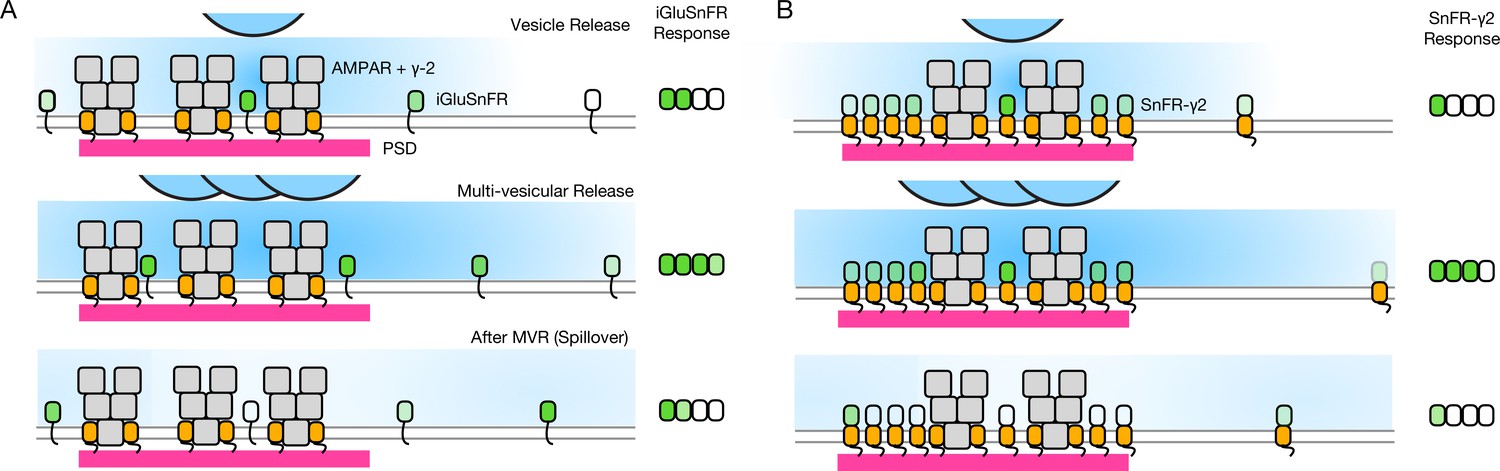
Factors affecting the responses of iGluSnFR and SnFR-γ2.
(A) Three scenarios following glutamate release from vesicles (blue). iGluSnFR is not localised to the postsynaptic density (PSD, magenta) opposite release sites, where AMPA receptors are docked through their auxiliary proteins like γ-2 (orange). Therefore iGluSnFR integrates a wide glutamate signal (green response) because of its high affinity for glutamate compared to AMPA receptors. This summation gives a larger amplitude signal, and probably incorporates a robust response to extrasynaptic spillover after MVR. Note, in a fluorescence micrograph, the point spread function is larger than the scene depicted here. Also, the camera integration time is longer than the interval between MVR and spillover. These factors do not provide an obvious explanation for the rundown of SnFR responses. (B) Assuming that SnFR-γ2 is concentrated at synapses, relative to iGluSnFR, the principal contribution following release of either one vesicle or multiple vesicles (MVR), is from synaptic sites. This limits the signal in amplitude, in space, and in time. SnFR-γ2 probably competes with postsynaptic AMPA receptors for sites in the PSD. The ratio of extrasynaptic to synaptic membrane area is large, we do not intend to indicate a ratio between abundances at these different sites. Overall, SnFR-γ2 is more abundant outside synapses than within them.
Videos
Video 1
Spontaneous responses of iGluSnFR expressed in bulk culture.
Video 2
Spontaneous responses of SnFR-γ2 expressed in bulk culture.
Video 3
Evoked responses of iGluSnFR expressed in autaptic neuron culture.
Video 4
Evoked responses of SnFR-γ2 expressed in autaptic neuron culture.
Additional files
-
MDAR checklist
- https://cdn.elifesciences.org/articles/84029/elife-84029-mdarchecklist1-v2.pdf
-
Source code 1
imageJ macro to find regions of interest.
- https://cdn.elifesciences.org/articles/84029/elife-84029-code1-v2.zip
Download links
A two-part list of links to download the article, or parts of the article, in various formats.
Downloads (link to download the article as PDF)
Open citations (links to open the citations from this article in various online reference manager services)
Cite this article (links to download the citations from this article in formats compatible with various reference manager tools)
Targeted sensors for glutamatergic neurotransmission
eLife 12:e84029.
https://doi.org/10.7554/eLife.84029


