Npr3 regulates neural crest and cranial placode progenitors formation through its dual function as clearance and signaling receptor
- Department of Molecular Pathobiology, New York University, College of Dentistry, United States
Figures
Figure 1 with 1 supplement
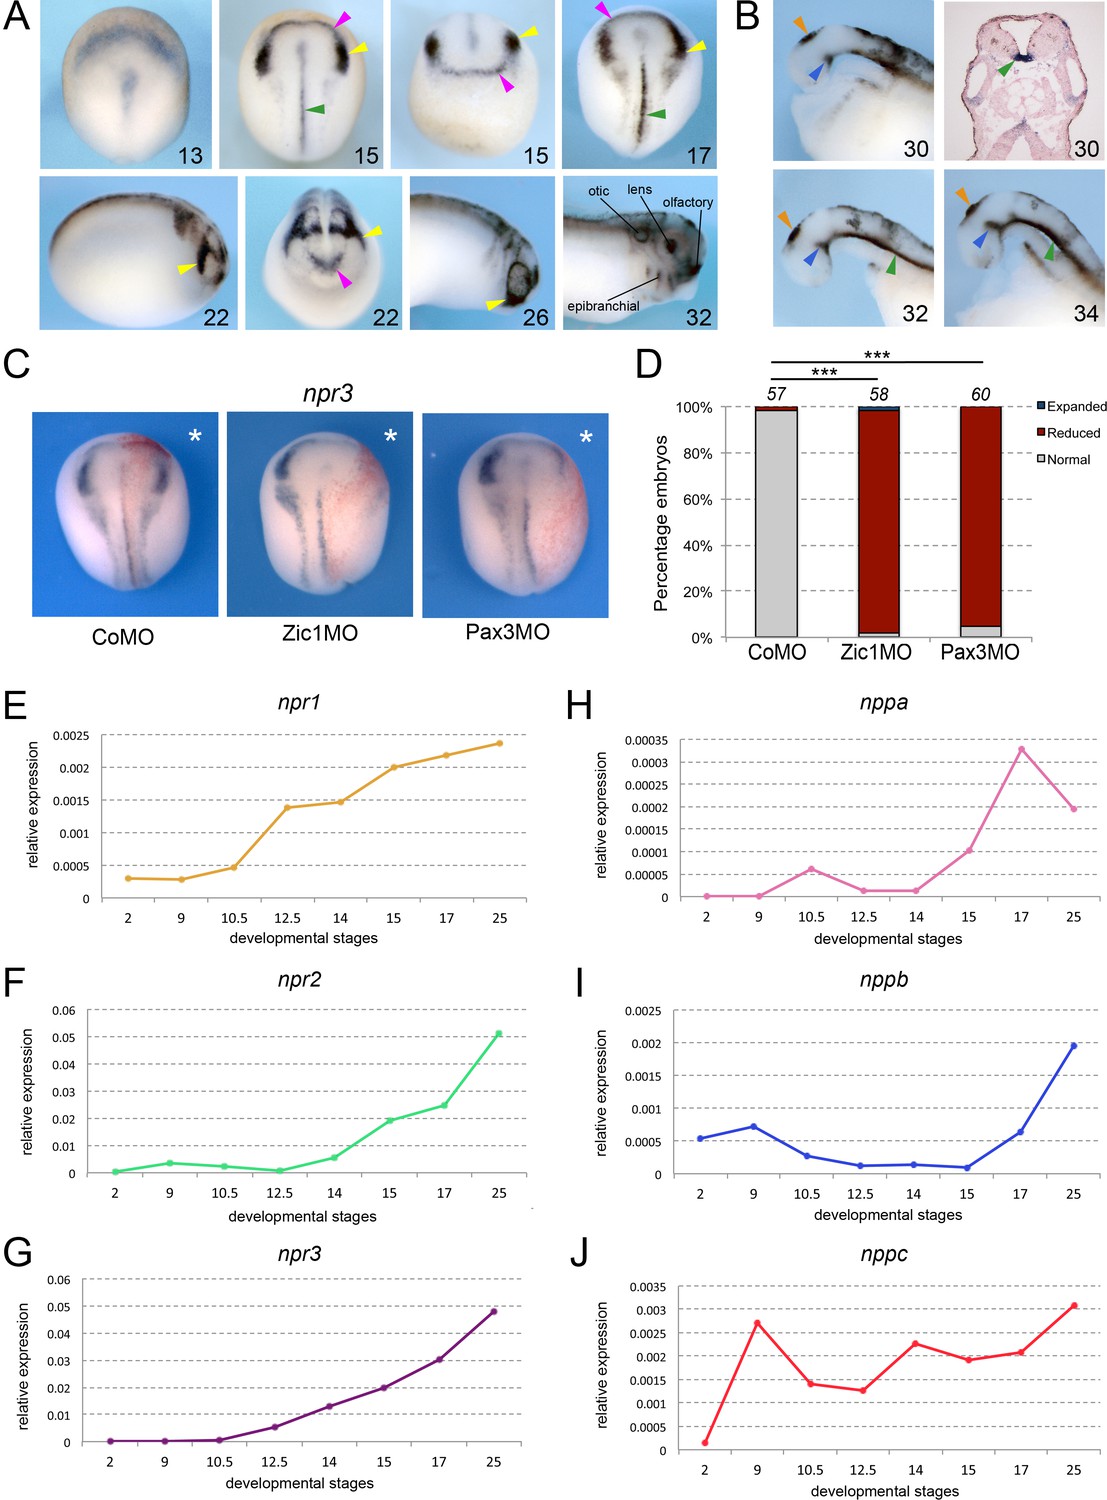
Npr3, a target of Pax3 and Zic1, is expressed in developing NC and CP.
(A) By ISH, npr3 is detected at the neural plate border at neurula stages (NF stage 13–17), and persists in the NC (yellow arrowheads) and CP (purple arrowheads) forming regions (NF stage 22–26). npr3 expression is maintained in most CP-derivatives at NF stage 32. (B) Dissected brain regions at NF stages 30–34 show additional npr3 expression domains in the floor plate (green arrowheads), zona limitans intrathalamica (blue arrowheads) and pineal gland (orange arrowheads). Upper right shows a transverse section through the hindbrain of a NF stage 30 embryo highlighting the floor plate expression of npr3 (green arrowhead). The embryonic stages are indicated in the lower right corner of each panel. (C) Zic1 (Zic1MO) or Pax3 (Pax3MO) knockdown reduces npr3 expression at the NPB. Injection of a CoMO did not affect npr3 expression. The asterisks (*) mark the injected side, also visualized by the lineage tracer Red-gal. Dorsal views, anterior to top. (D) Frequency of the phenotypes. The number of embryos analyzed is indicated at the top of each bar. ***p<0.0005, χ2 test.(E–J) Developmental qRT-PCR expression profile of npr1 (E), npr2 (F), npr3 (G), nppa (H), nppb (I) and nppc (J) in Xenopus. NF developmental stages are indicated on the x-axis, values are normalized to ornithine decarboxylase (odc). A representative experiment is shown. Two additional biological replicates are shown in Figure S1.
Figure 1—figure supplement 1
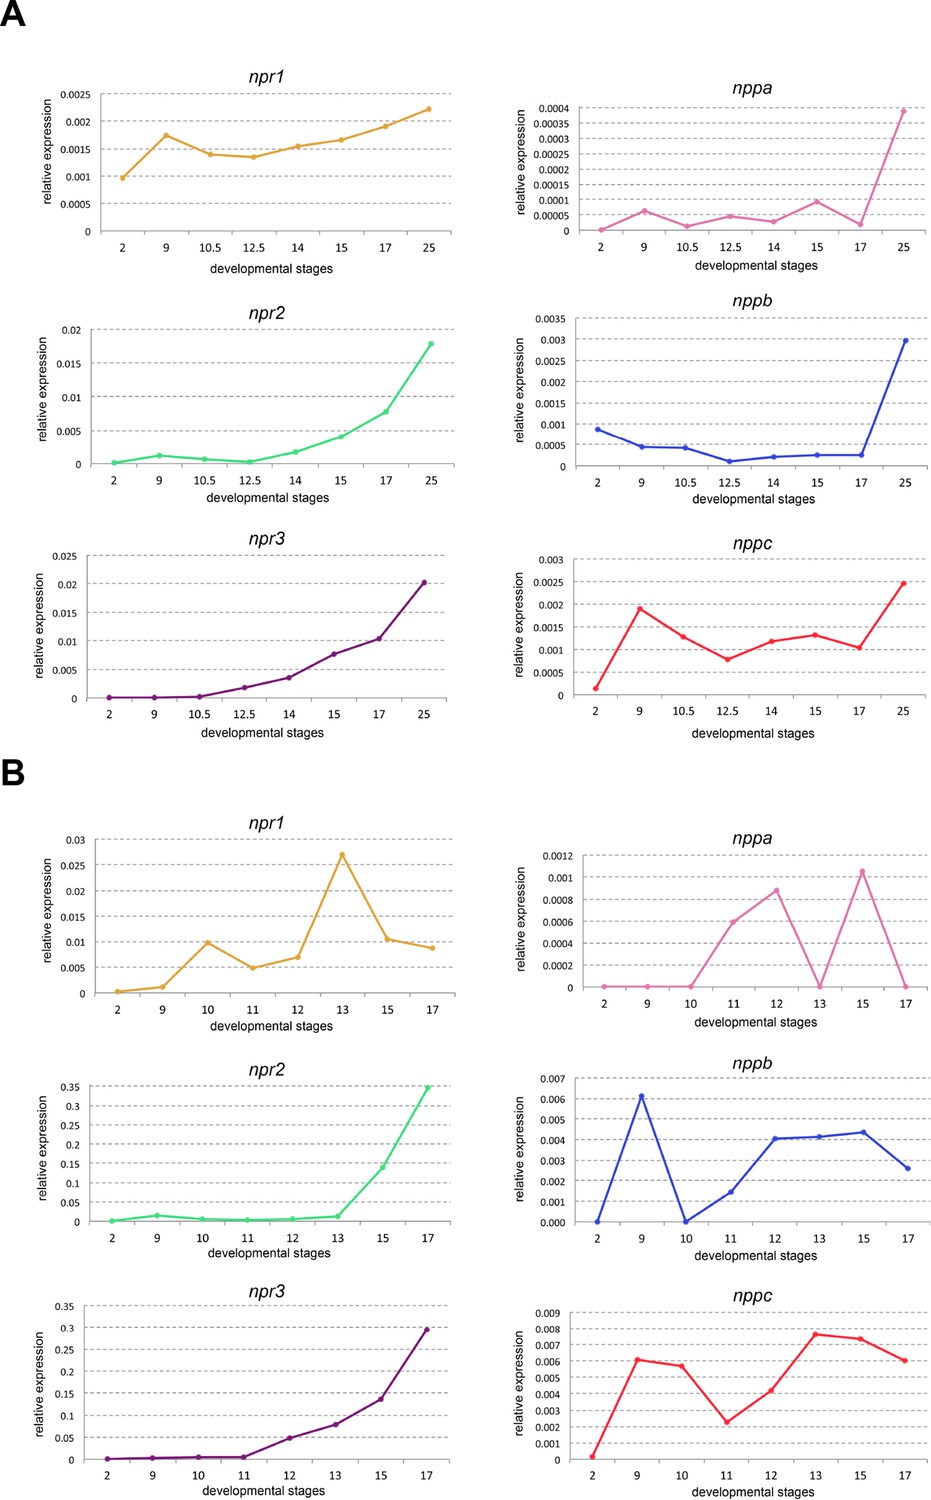
Developmental RT-PCR of natriuretic peptide signaling pathway components.
Developmental qRT-PCR expression profile of npr1, npr2, npr3, nppa, nppb and nppc in two biological replicates (A and B) of WT Xenopus embryos. NF stages are indicated on x-axis, values are normalized to odc.
Figure 2 with 2 supplements
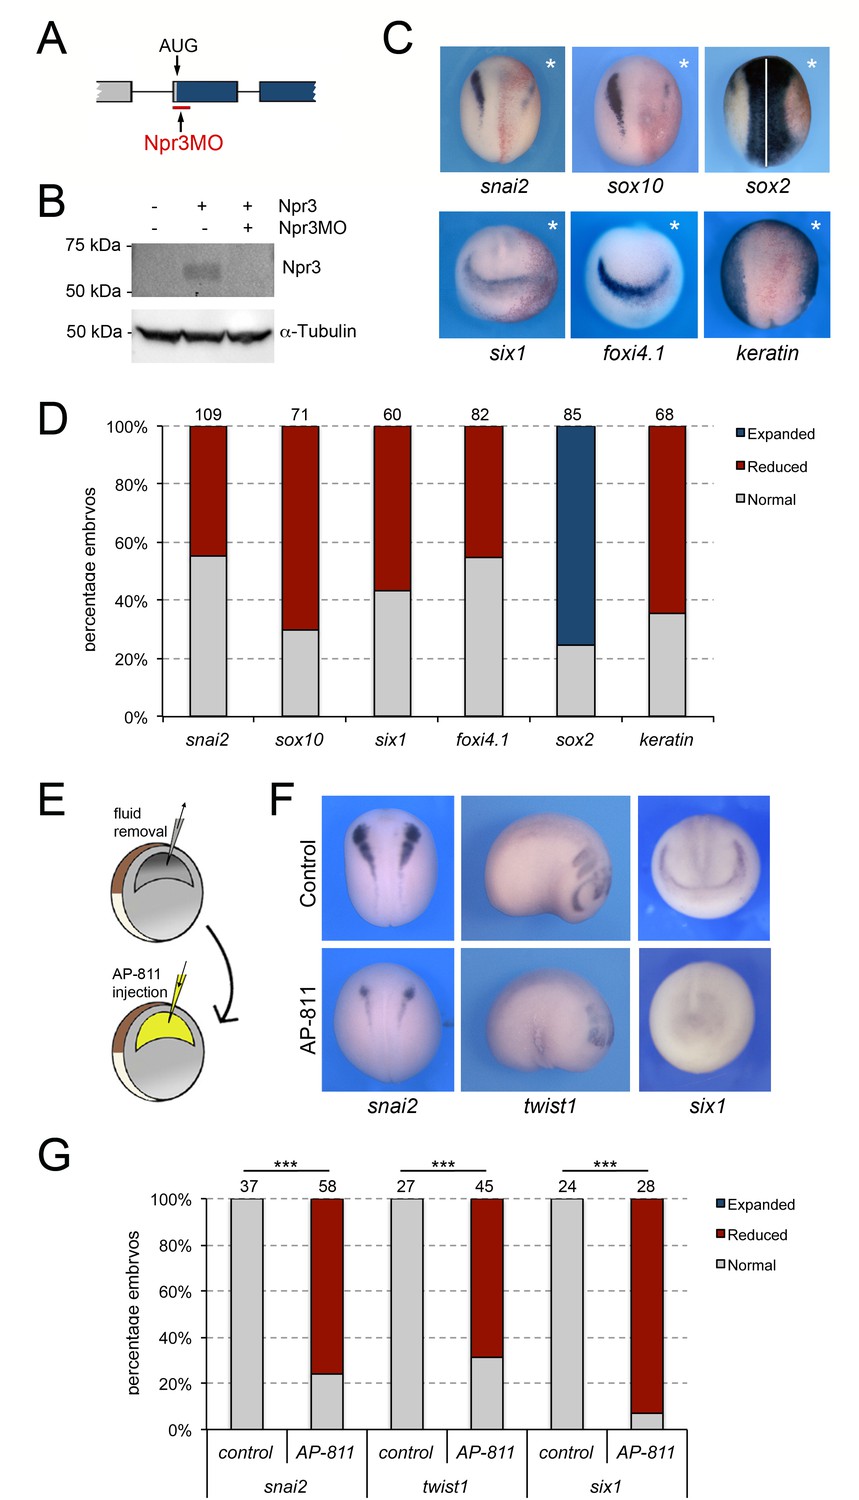
Npr3 is required for both NC and CP development.
(A) Schematic representation of the npr3 gene structure showing the target site of Npr3 translation blocking morpholino (Npr3MO; red). (B) Western blot analysis of protein lysates from control embryos and embryos injected with npr3 mRNA (1 ng) alone or in combination with Npr3MO, using an anti-Npr3 antibody. α-Tubulin is shown as a loading control. (C) Phenotype of Npr3MO (30 ng) injected embryos. Npr3 knockdown differentially affect the expression of snai2, sox10, six1, foxi4.1, sox2 and keratin. The asterisks (*) mark the injected side, also visualized by the lineage tracer Red-gal. Dorsal views, anterior to top, except for six1 and foxi4.1, which show anterior views, dorsal to top. (D) Frequency of the phenotypes. The number of embryos analyzed for each condition is indicated at the top of each bar. (E) Experimental design for the microinjection of Npr3 antagonist, AP-811, in the blastocoel cavity of blastula stage embryos. (F) The expression of snai2, twist1 and six1 is reduced in AP-811-treated embryos. Dorsal views, anterior to top (snai2). Lateral views, anterior to right (twist1). Anterior views, dorsal to top (six1). (G) Frequency of the phenotypes. The number of embryos analyzed is indicated at the top of each bar. ***p<0.0005, χ2 test.
Figure 2—figure supplement 1

Manipulation of the blastocoel fluid does not affect snai2 and six1 expression.
(A) The expression of snai2 and six1 is unaffected in embryos in which the blastocoel fluid was replaced by 100–120 nl of water at NF stage 9. Dorsal views, anterior to top. (B) Frequency of the phenotypes. The number of embryos analyzed is indicated at the top of each bar.
Figure 2—figure supplement 2
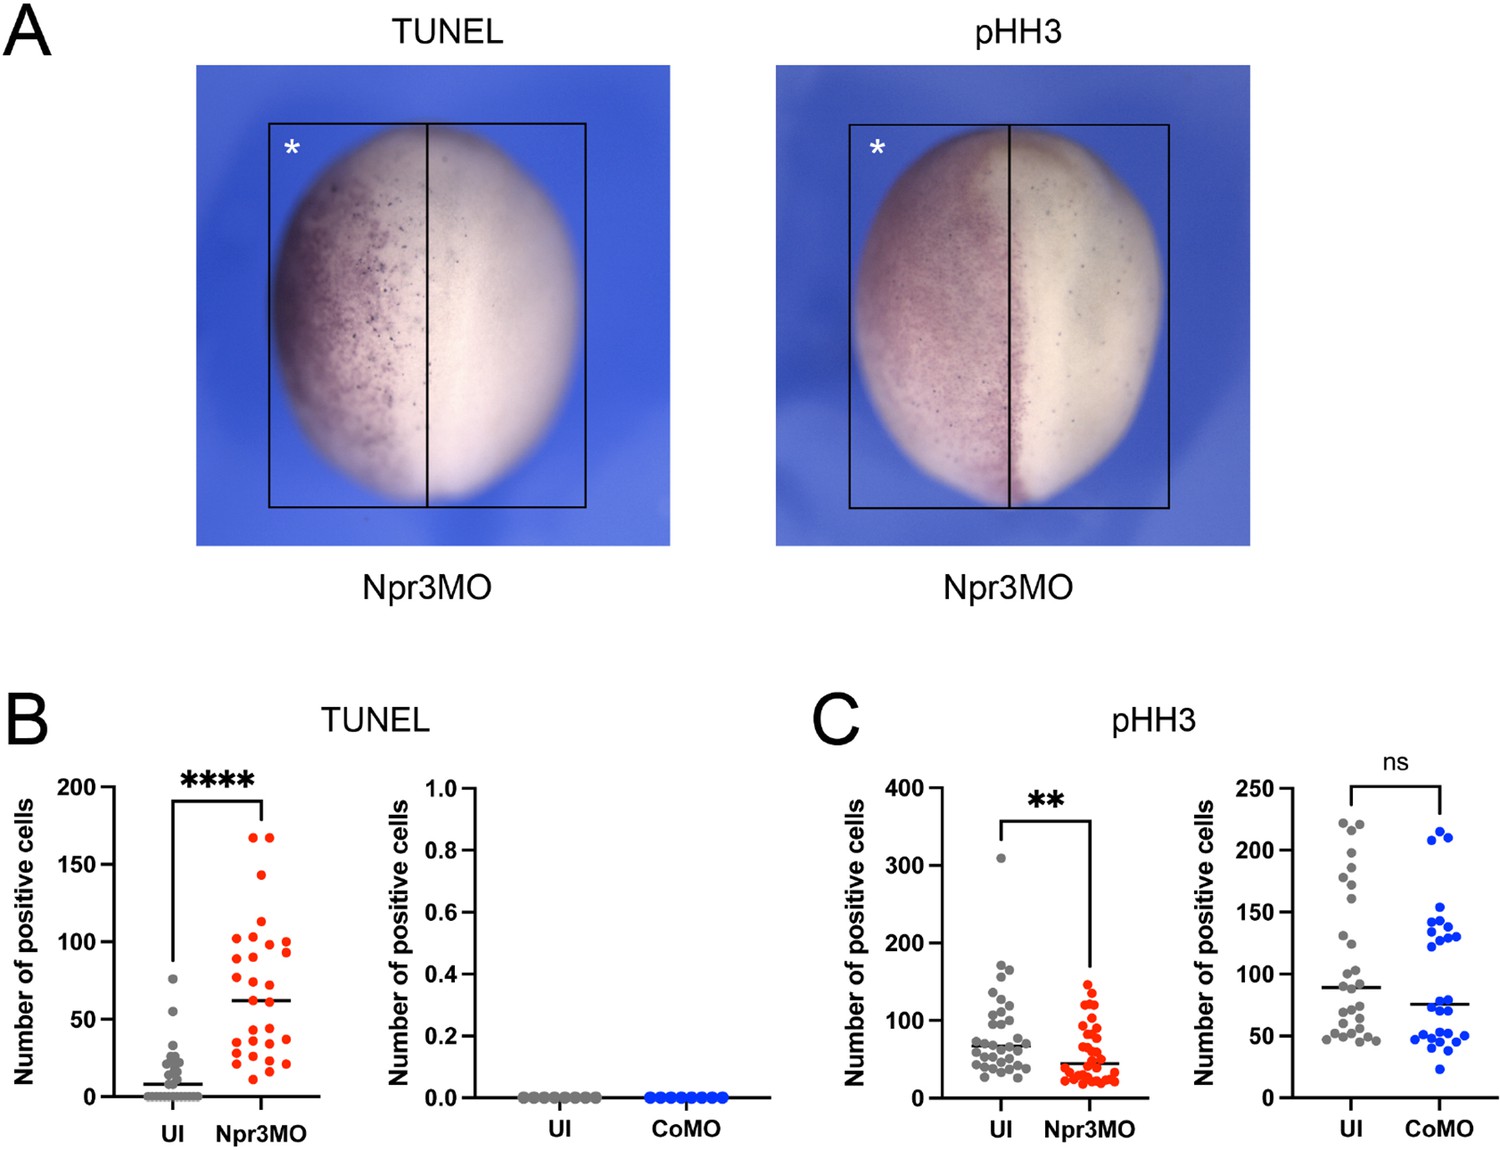
Npr3-depletion affects the rate of cell death or proliferation in the dorsal ectoderm.
(A) Whole-mount TUNEL (left panel) and pHH3 (right panel) staining of stage 15 embryos injected with Npr3MO on the left side (asterisk). Dorsal views, anterior to top. The black boxes outline the area of the dorsal ectoderm in which TUNEL- and pHH3-positive cells were quantified for each half of the embryo. (B–C) Quantification of the number of TUNEL-positive (B) and pHH3-positive (C) cells in the dorsal ectoderm of CoMO- or Npr3MO-injected embryos comparing injected vs. uninjected sides (UI). Combined data from three biological replicates are shown. Each dot represents one embryo. p- values were calculated using paired t-test, ** p<0.0095, **** p<0.0001; ns: not significant. Note: We observed variability in the number of TUNEL-positive cells at the uninjected side. In their original report describing the dynamic of programmed cell death during Xenopus development, Hensey and Gautier, 1998 also reported considerable variation in the degree of TUNEL staining and patterns between embryos, including left-right asymmetries. The authors speculated that the presence of a fraction of TUNEL-negative embryos during gastrulation and neurulation might reflect the rapid clearance of dead cells from the embryo.
Figure 3
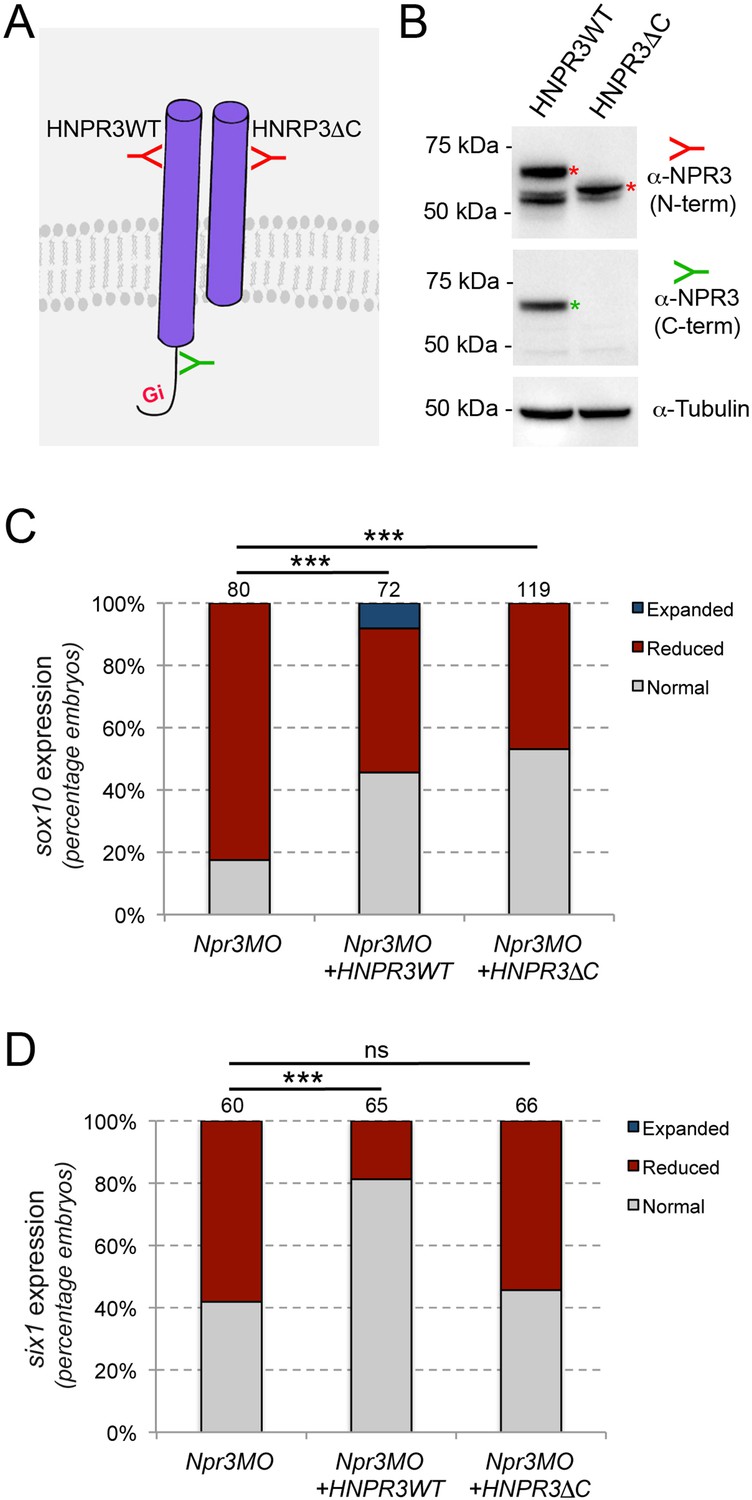
Npr3 regulates NC and CP fate through different mechanisms.
(A) Two expression constructs were generated, a wild-type human NPR3 (HNPR3WT) and a truncated version of HNPR3 lacking the C-terminal Gi activator sequence (HNPR3ΔC). (B) Validation of the two constructs. Embryos injected with HNRP3WT or HNRPCΔC mRNA were analyzed by Western blot using antibodies directed against the C-terminal (ProSciΨ, Cat#42–909; green) or N-terminal (Santa Cruz Biotechnology, Cat#sc-515449; red) domains of NPR3. α-Tubulin is shown as a loading control. The second band in the HNPR3WT lane may represent a cleaved version of HNPR3 lacking the cytoplasmic tail (not recognized by anti-NPR3 C-term), or alternatively a secreted version of NPR3 lacking the transmembrane domain. (C) HNPR3WT and truncated HNRP3ΔC are equally efficient at rescuing sox10 expression in Npr3-depleted embryos. (D) In contrast, only HNPR3WT is capable of restoring six1 expression in Npr3-depleted embryos. (C,D) Phenotypes quantification is as described in Figure 2. The number of embryos analyzed is indicated at the top of each bar. ***p<0.0005, χ2 test. ns, not significant.
Figure 4 with 1 supplement
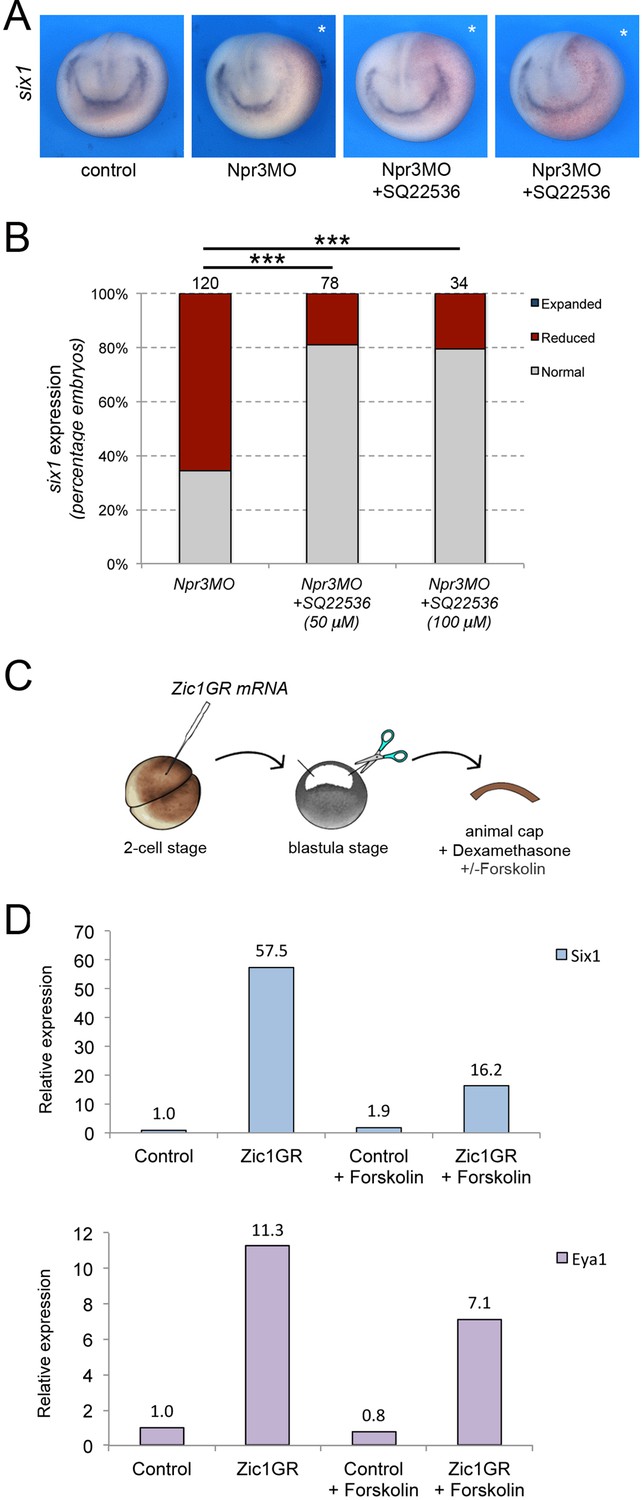
Npr3 requires adenylyl cyclase inhibition to promote CP fate.
(A) Inhibition of adenylyl cyclase by treatment with SQ22536 restores six1 expression in Npr3-depleted (Npr3MO) embryos. Two representative embryos are shown to illustrate the range of phenotypes. The asterisks (*) mark the injected side, also visualized by the lineage tracer Red-gal. Anterior views, dorsal to top. (B) Frequency of the phenotypes. The number of embryos analyzed is indicated at the top of each bar. ***p<0.0005, χ2 test. (C) Experimental design to test the effect of adenylyl cyclase activation by Forskolin on the CP-inducing activity of Zic1. (D) qRT-PCR analysis of six1 and eya1 expression in animal cap explants injected with Zic1GR mRNA and cultured in the presence of dexamethasone +/-forskolin (50 μM). Values are normalized to odc. A representative experiment is shown. Two additional biological replicates are shown in Figure 2.
Figure 4—figure supplement 1

Forskolin treatment interferes with six1 and eya1 induction by Zic1GR.
qRT-PCR analysis of six1 and eya1 expression in Zic1GR-injected animal caps untreated or treated with 50 μM Forskolin, from two biological replicates (A and B). Expression levels are normalized to odc.
Figure 5 with 1 supplement
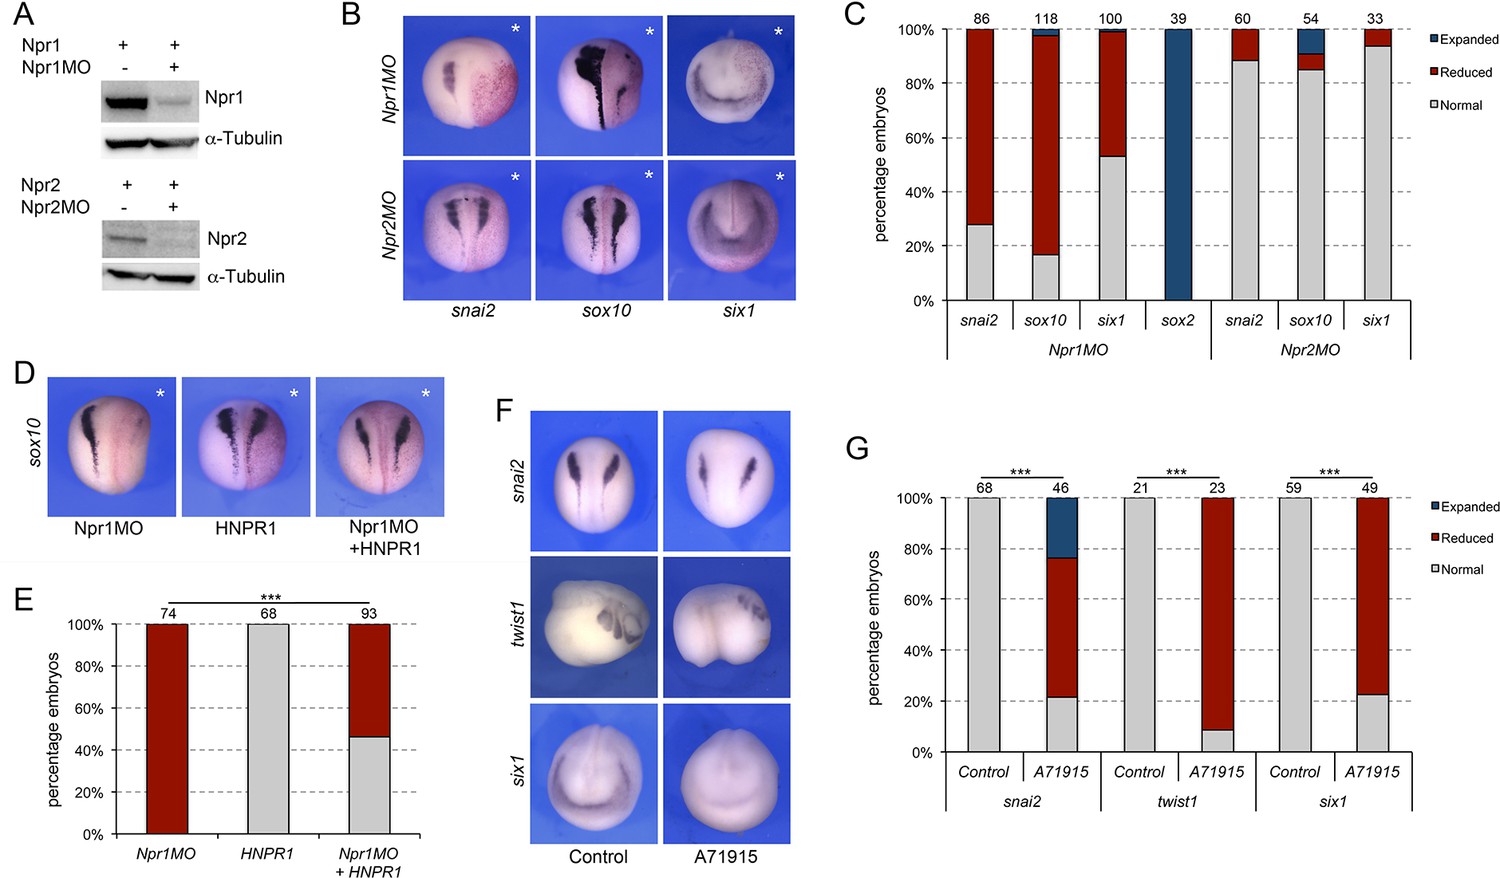
Signaling through Npr1 regulates NC and CP formation.
(A) Western blot analysis of protein lysates from control embryos and embryos injected with npr1 or npr2 mRNA (1 ng) alone or in combination with the corresponding translation blocking MO, Npr1MO and Npr2MO, respectively. α-Tubulin is shown as a loading control. (B) ISH for snai2, sox10 and six1 expression in Npr1MO- and Npr2MO-injected embryos. The asterisks (*) mark the injected side, also visualized by the lineage tracer Red-gal. Dorsal views, anterior to top, except for six1, which shows anterior views, dorsal to top. (C) Frequency of the phenotypes. The number of embryos analyzed for each condition is indicated at the top of each bar. (D) Rescue of Npr1 knockdown phenotype (sox10) by expression of human NPR1 (HNPR1). The asterisks (*) mark the injected side, also visualized by the lineage tracer Red-gal. (E) Frequency of the phenotypes. The number of embryos analyzed is indicated at the top of each bar. ***p<0.0005, χ2 test. (F) The expression of snai2, twist1, and six1 is reduced upon treatment with A71915, a potent Npr1 antagonist. Dorsal views, anterior to top (snai2). Lateral views, anterior to right (twist1). Anterior views, dorsal to top (six1). (G) Frequency of the phenotypes. The number of embryos analyzed is indicated at the top of each bar. ***p<0.0005, χ2 test.
Figure 5—figure supplement 1
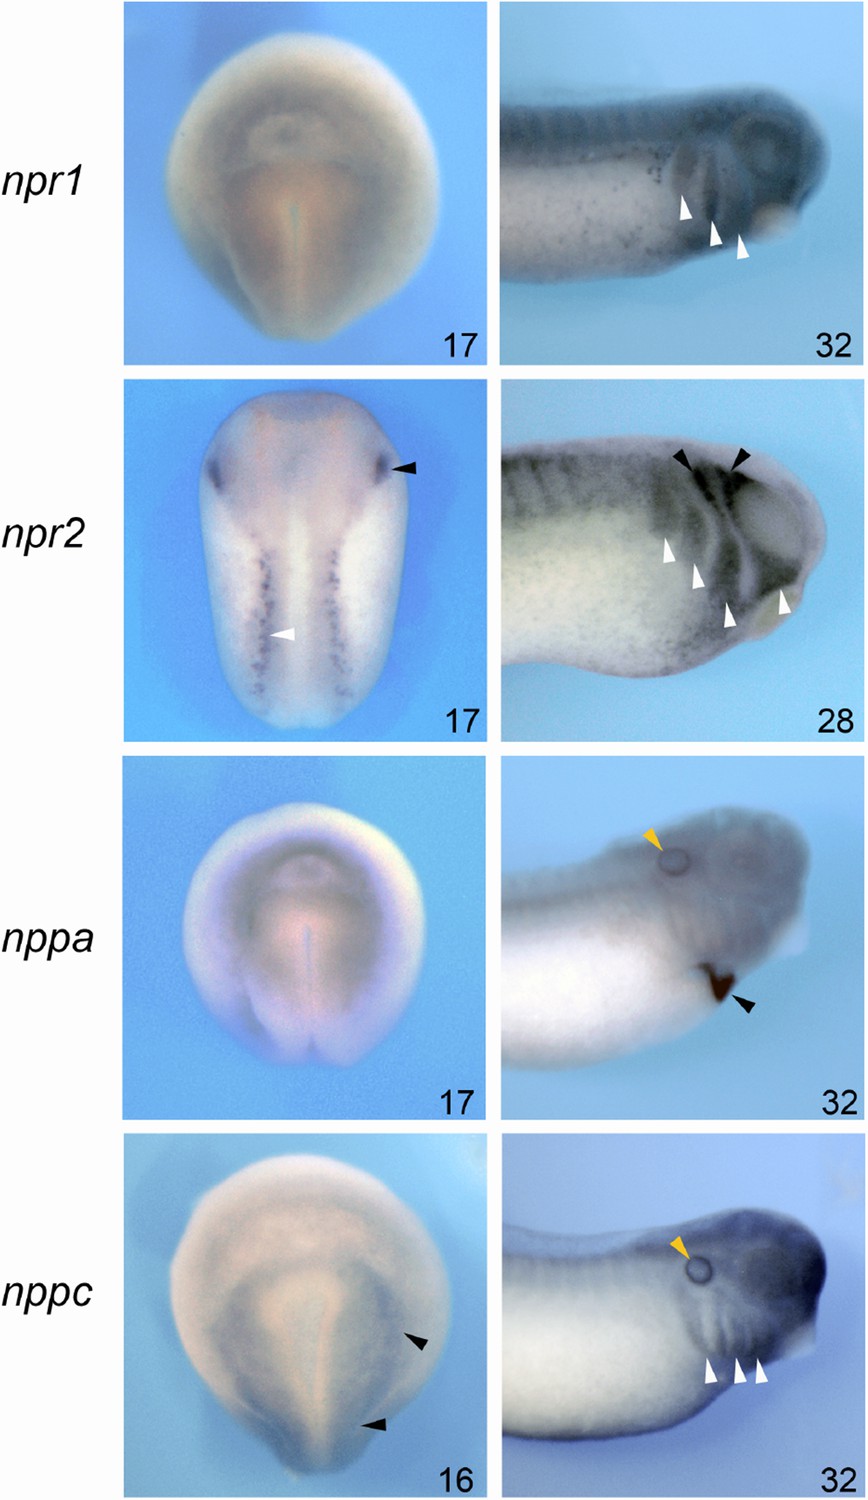
Spatial expression of npr1, npr2, nppa and nppc by whole-mount ISH.
Spatial expression of npr1, npr2, nppa, and nppc by whole-mount ISH at neurula (NF stage 15/16) and tailbud (NF stage 28/32) stages. The embryonic stages are indicated in the lower right corner of each panel. npr1 is broadly expressed at the neurula stage, and becomes enriched dorsally and anteriorly at the tailbud stage. In the head region it is detected in the branchial arches (white arrowheads). At neurula stage, npr2 is detected in the trigeminal placode (black arrowhead) and Rohon-Beard neurons (white arrowhead). Later in development, npr2 is detected in the trigeminal/profundal ganglion complex (black arrowhead) and in the branchial arches (white arrowheads). nppa appears to be diffusely expressed at neurula stage, and at tailbud stage nppa is exclusively restricted to the developing heart (black arrowhead) and otic vesicle (yellow arrowhead). At neurula stage, nppc is enriched at the neural plate border (black arrowheads), and at tailbud stage it is enriched in the prospective epibranchial placodes (white arrowheads) and otic vesicle (yellow arrowhead). Left column, dorsal views anterior to top. Right column, lateral views, anterior to right dorsal to top.
Figure 6

Natriuretic peptides activity during NC and CP formation.
(A) ISH for snai2, sox10, six1 and sox2 expression in NppaMO-, NppbMO-, and NppcMO-injected embryos. The asterisks (*) mark the injected side, also visualize by the lineage tracer Red-gal. Dorsal views, anterior to top, except for six1, which shows anterior views, dorsal to top. (B) Frequency of the phenotypes. The number of embryos analyzed for each condition is indicated at the top of each bar. (C) To rescue the phenotype of Nppc morphant embryos, recombinant NPPC was microinjected in the blastocoel cavity of Nppc-depleted embryos. (D) NPPC can restore six1 expression in NppcMO-injected embryos. Anterior views, dorsal to top. (E) Frequency of the phenotypes. The number of embryos analyzed is indicated at the top of each bar. ***p<0.0005, χ2 test.
Additional files
-
Transparent reporting form
- https://cdn.elifesciences.org/articles/84036/elife-84036-transrepform1-v2.pdf
-
Source data 1
- https://cdn.elifesciences.org/articles/84036/elife-84036-data1-v2.xlsx
Download links
A two-part list of links to download the article, or parts of the article, in various formats.
Downloads (link to download the article as PDF)
Open citations (links to open the citations from this article in various online reference manager services)
Cite this article (links to download the citations from this article in formats compatible with various reference manager tools)
Npr3 regulates neural crest and cranial placode progenitors formation through its dual function as clearance and signaling receptor
eLife 12:e84036.
https://doi.org/10.7554/eLife.84036


