Brain and molecular mechanisms underlying the nonlinear association between close friendships, mental health, and cognition in children
- Institute of Science and Technology for Brain-Inspired Intelligence, Fudan University, China
- Key Laboratory of Computational Neuroscience and Brain-Inspired Intelligence (Fudan University), Ministry of Education, China
- State Key Laboratory of Medical Neurobiology and MOE Frontiers Center for Brain Science (Fudan University), Ministry of Education, China
- Department of Computer Science, University of Warwick, United Kingdom
- Oxford Centre for Computational Neuroscience, United Kingdom
- Department of Psychiatry, University of Cambridge, United Kingdom
- Behavioural and Clinical Neuroscience Institute, University of Cambridge, United Kingdom
- Fudan ISTBI—ZJNU Algorithm Centre for Brain-Inspired Intelligence, Zhejiang Normal University, China
- Shanghai Medical College and Zhongshan Hospital Immunotherapy Technology Transfer Center, China
- Department of Neurology, Huashan Hospital, Fudan University, China
- Zhangjiang Fudan International Innovation Center, China
Figures
Figure 1
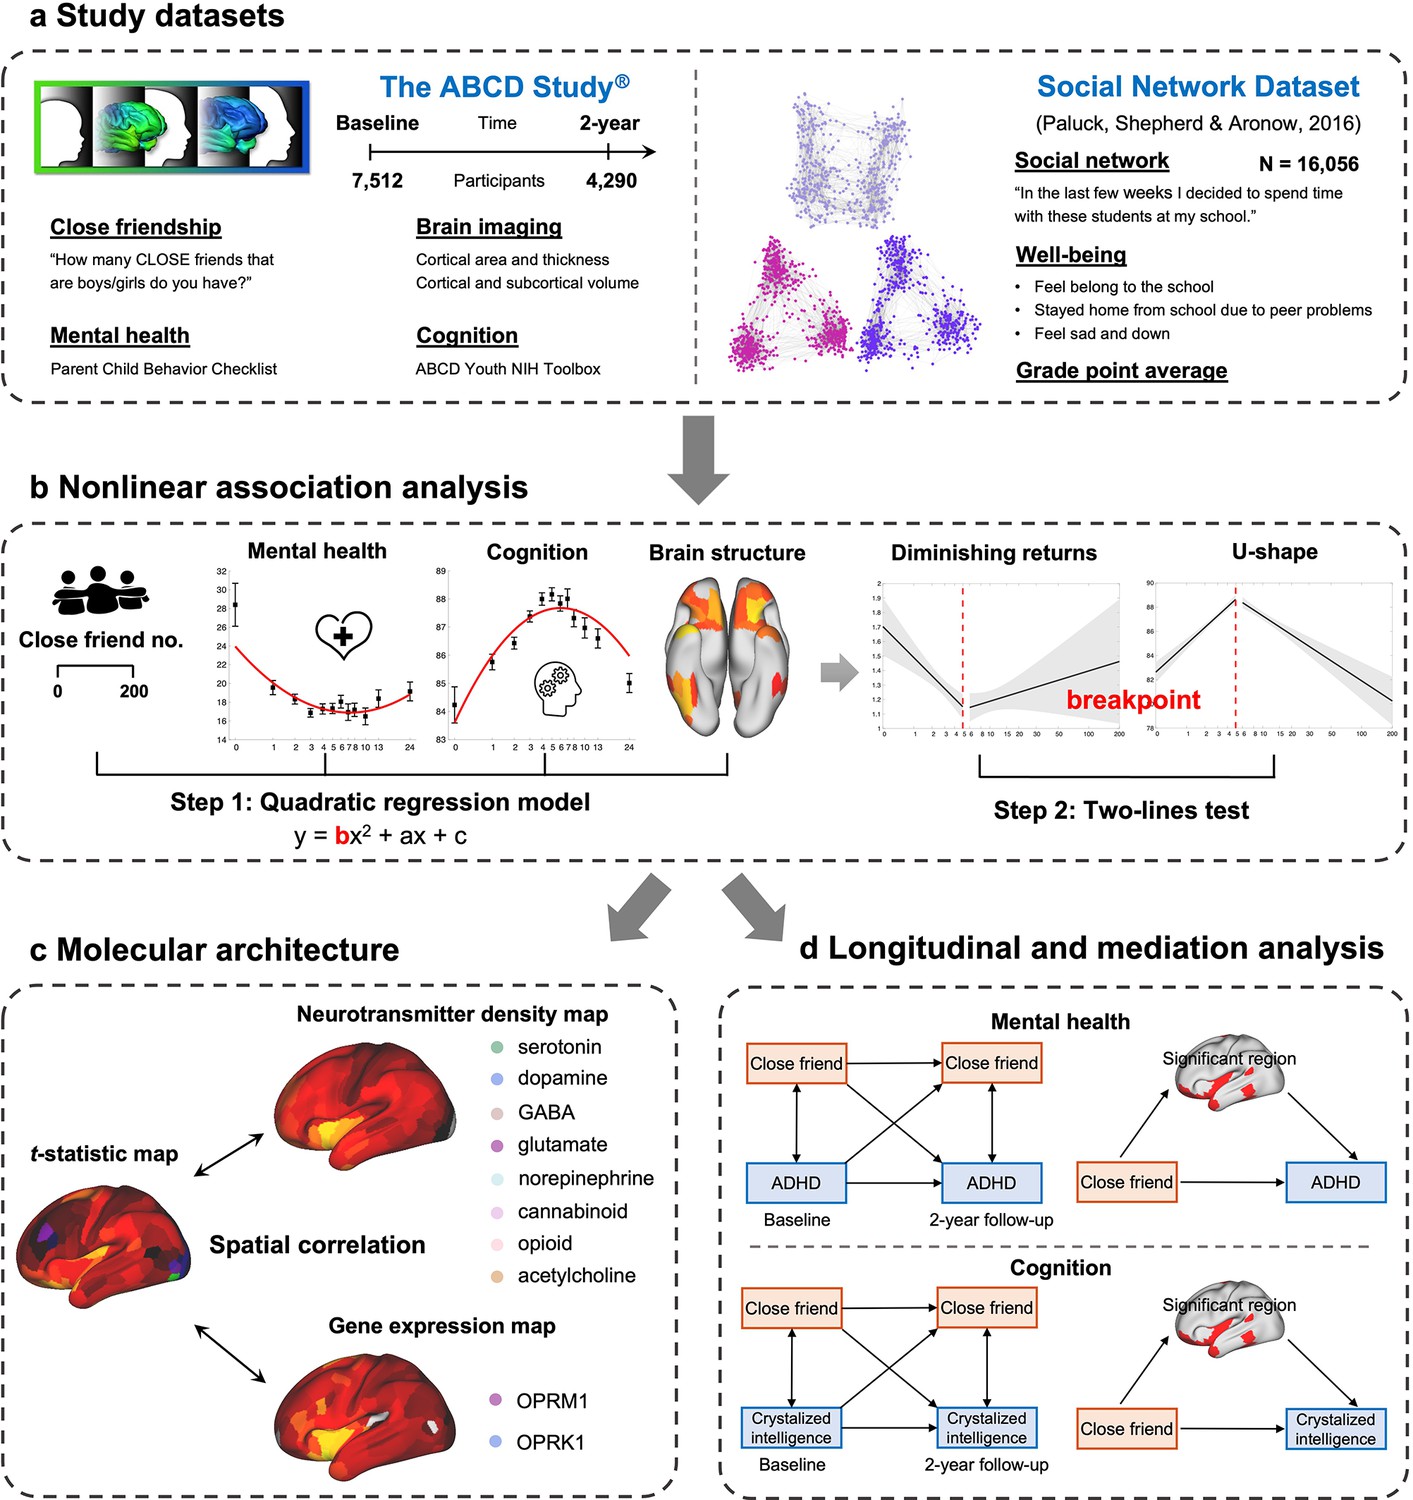
The study workflow.
(a) Study datasets and key measures used in the present study. (b) A two-step approach to evaluate the nonlinear association. The number of close friends is used as the independent variable in quadratic regression models. Once a significant squared term (‘b’) is found, a two-lines test is conducted to estimate the breakpoint. Then participants are classified into two groups according to the breakpoint. (c) Correlation of brain differences related to the number of close friends with neurotransmitter density and gene expression level. (d) Longitudinal and mediation analysis of the number of close friends, ADHD symptoms, crystalized intelligence, and the significant surface areas.
Figure 2 with 5 supplements
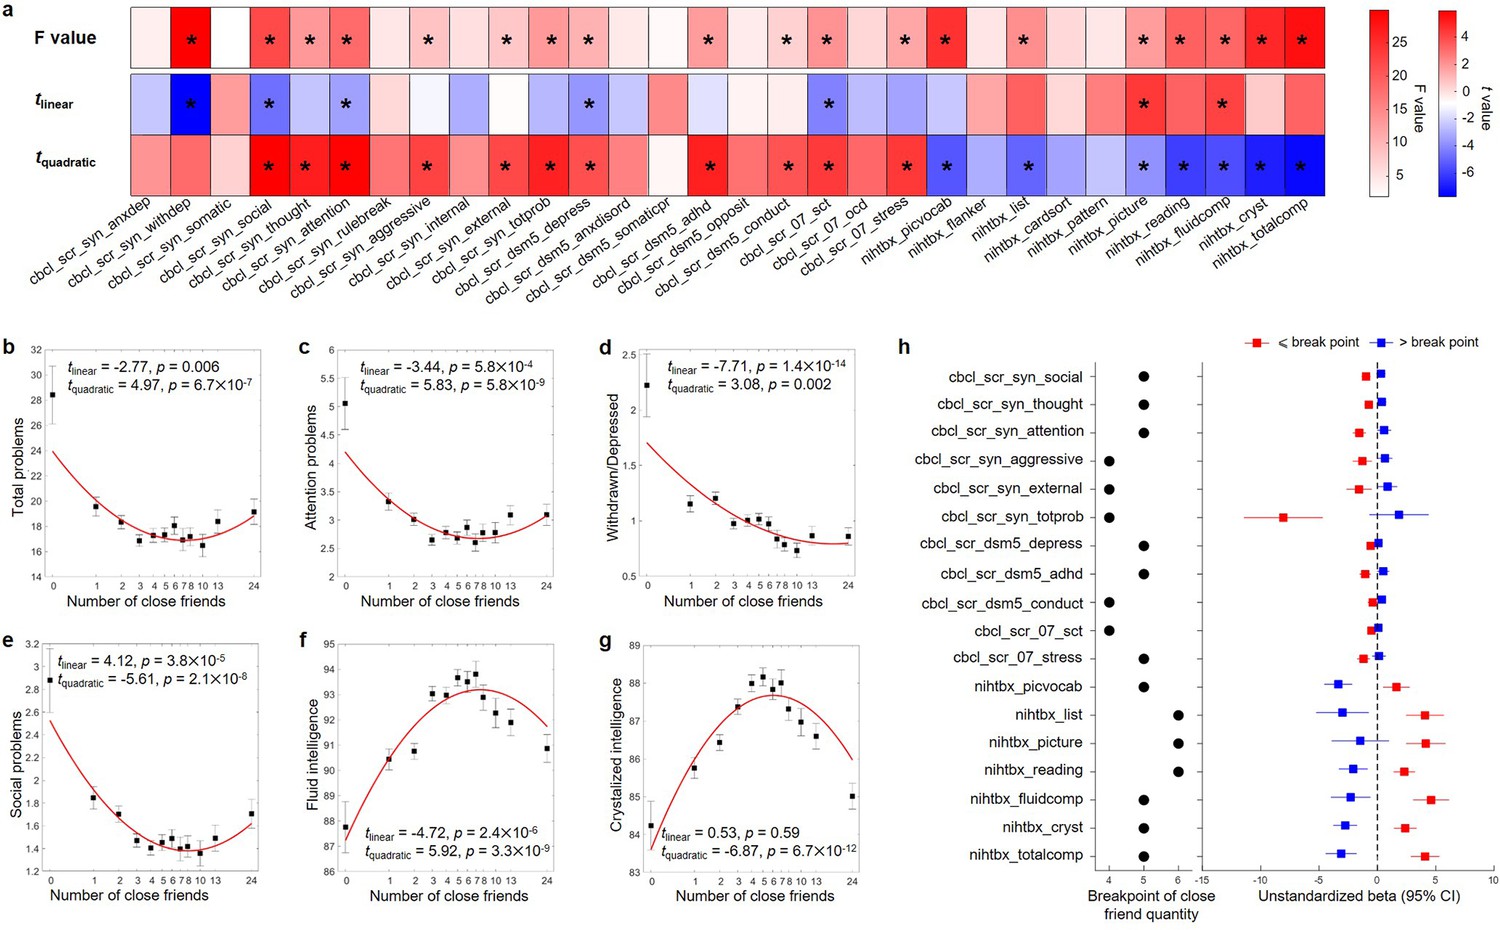
Results of behavior-level nonlinear association analyses in the Adolescent Brain Cognitive Developmental (ABCD) study at baseline.
(a) Results of quadratic regression models. The total F values of quadratic and linear terms, and the t values of linear and quadratic terms are reported. An asterisk indicates statistical significance after Bonferroni correction (i.e., p<0.05/30 for F value, and p<0.05/60 for t value). Relationship between the number of close friends and the total problems (b), attention problems (c), withdrawn/depressed (d), social problems (e), fluid intelligence (f), and crystalized intelligence (g). The number of close friends is classified into 13 bins, sample sizes of which are 107, 585, 1104, 1196, 957, 914, 631, 399, 463, 363, 416 and 477. In each bin, the mean (i.e., black dot) and standard error (i.e., error bar) of the dependent variable are shown. The x-axis is in log scale, and the median of the number of close friends in each bin was labeled in the x-axis. The red line is the fitted quadratic model. (h) Results of the two-lines tests. The breakpoint and the estimated coefficients with 95% confidence intervals of linear regressions in each group separated by the breakpoint are reported. cbcl-scr-syn-anxdep, Anxious/Depressed Syndrome Scale; cbcl-scr-syn-withdep, Withdrawn/Depressed Syndrome Scale; cbcl-scr-syn-somatic, Somatic Complaints Syndrome Scale; cbcl-scr-syn-social, Social Problems Syndrome Scale; cbcl-scr-syn-thought, Thought Problems Syndrome Scale; cbcl-scr-syn-attention, Attention Problems Syndrome Scale; cbcl-scr-syn-rulebreak, Rule-Breaking Behavior Syndrome Scale; cbcl-scr-syn-aggressive, Aggressive Behavior Syndrome Scale; cbcl-scr-syn-internal, Internalizing Problems Syndrome Scale; cbcl-scr-syn-external, Externalizing Problems Syndrome Scale; cbcl-scr-syn-totprob, Total Problems Syndrome Scale; cbcl-scr-dsm5-depress, Depressive Problems DSM-5 Scale; cbcl-scr-dsm5-anxdisord, Anxiety Problems DSM-5 Scale; cbcl-scr-dsm5-somaticpr, Somatic Problems DSM-5 Scale; cbcl-scr-dsm5-adhd, ADHD DSM-5 Scale; cbcl-scr-dsm5-opposite, Oppositional Defiant Problems DSM-5 Scale; cbcl-scr-dsm5-conduct, Conduct Problems DSM-5 Scale; cbcl-scr-07-sct, Sluggish Cognitive Tempo Scale2007 Scale; cbcl-scr-07-ocd, Obsessive-Compulsive Problems Scale2007 Scale; cbcl-scr-07-stress, Stress Problems Scale2007 Scale; nihtbx-picvocab, Picture Vocabulary Test; nihtbx-flanker, Flanker Inhibitory Control and Attention Test; nihtbx-list, List Sorting Working Memory Test; nihtbx-cardsort, Dimensional Change Card Sort Test; nihtbx-pattern, Pattern Comparison Processing Speed Test; nihtbx-picture, Picture Sequence Memory Test; nihtbx-reading, Oral Reading Recognition Test; nihtbx-fluidcomp, Fluid Composite Score; nihtbx-cryst, Crystallized Composite Score; nihtbx-totalcomp, Total Composite Score.
-
Figure 2—source data 1
Results of behavior-level nonlinear association analyses in the Adolescent Brain Cognitive Developmental (ABCD) study at baseline.
- https://cdn.elifesciences.org/articles/84072/elife-84072-fig2-data1-v1.xlsx
Figure 2—figure supplement 1
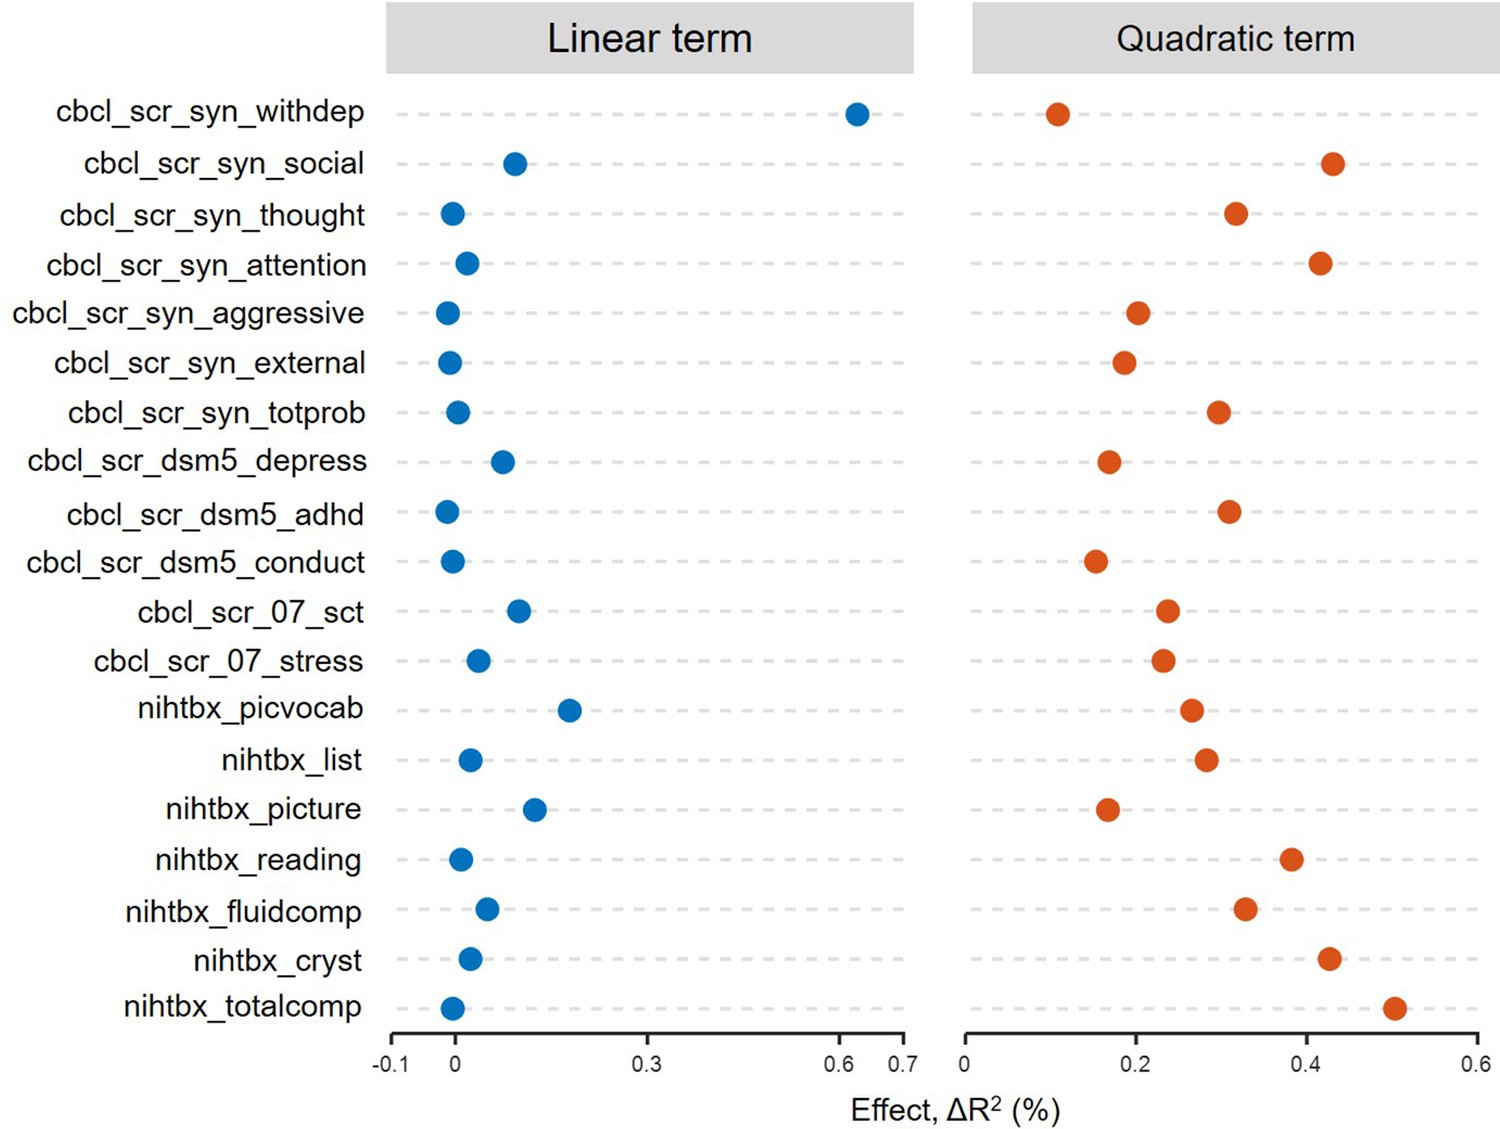
Effect sizes of linear and quadratic terms of close friend number in the Adolescent Brain Cognitive Developmental (ABCD) study at baseline.
Mental health and cognitive outcomes with a significant F value are shown here. The effect size of the quadratic term was calculated by the change of adjusted R2 between the quadratic model and the corresponding linear model, and the effect size of the linear term was the change of adjusted R2 between the linear model and the model with only covariates.
Figure 2—figure supplement 2
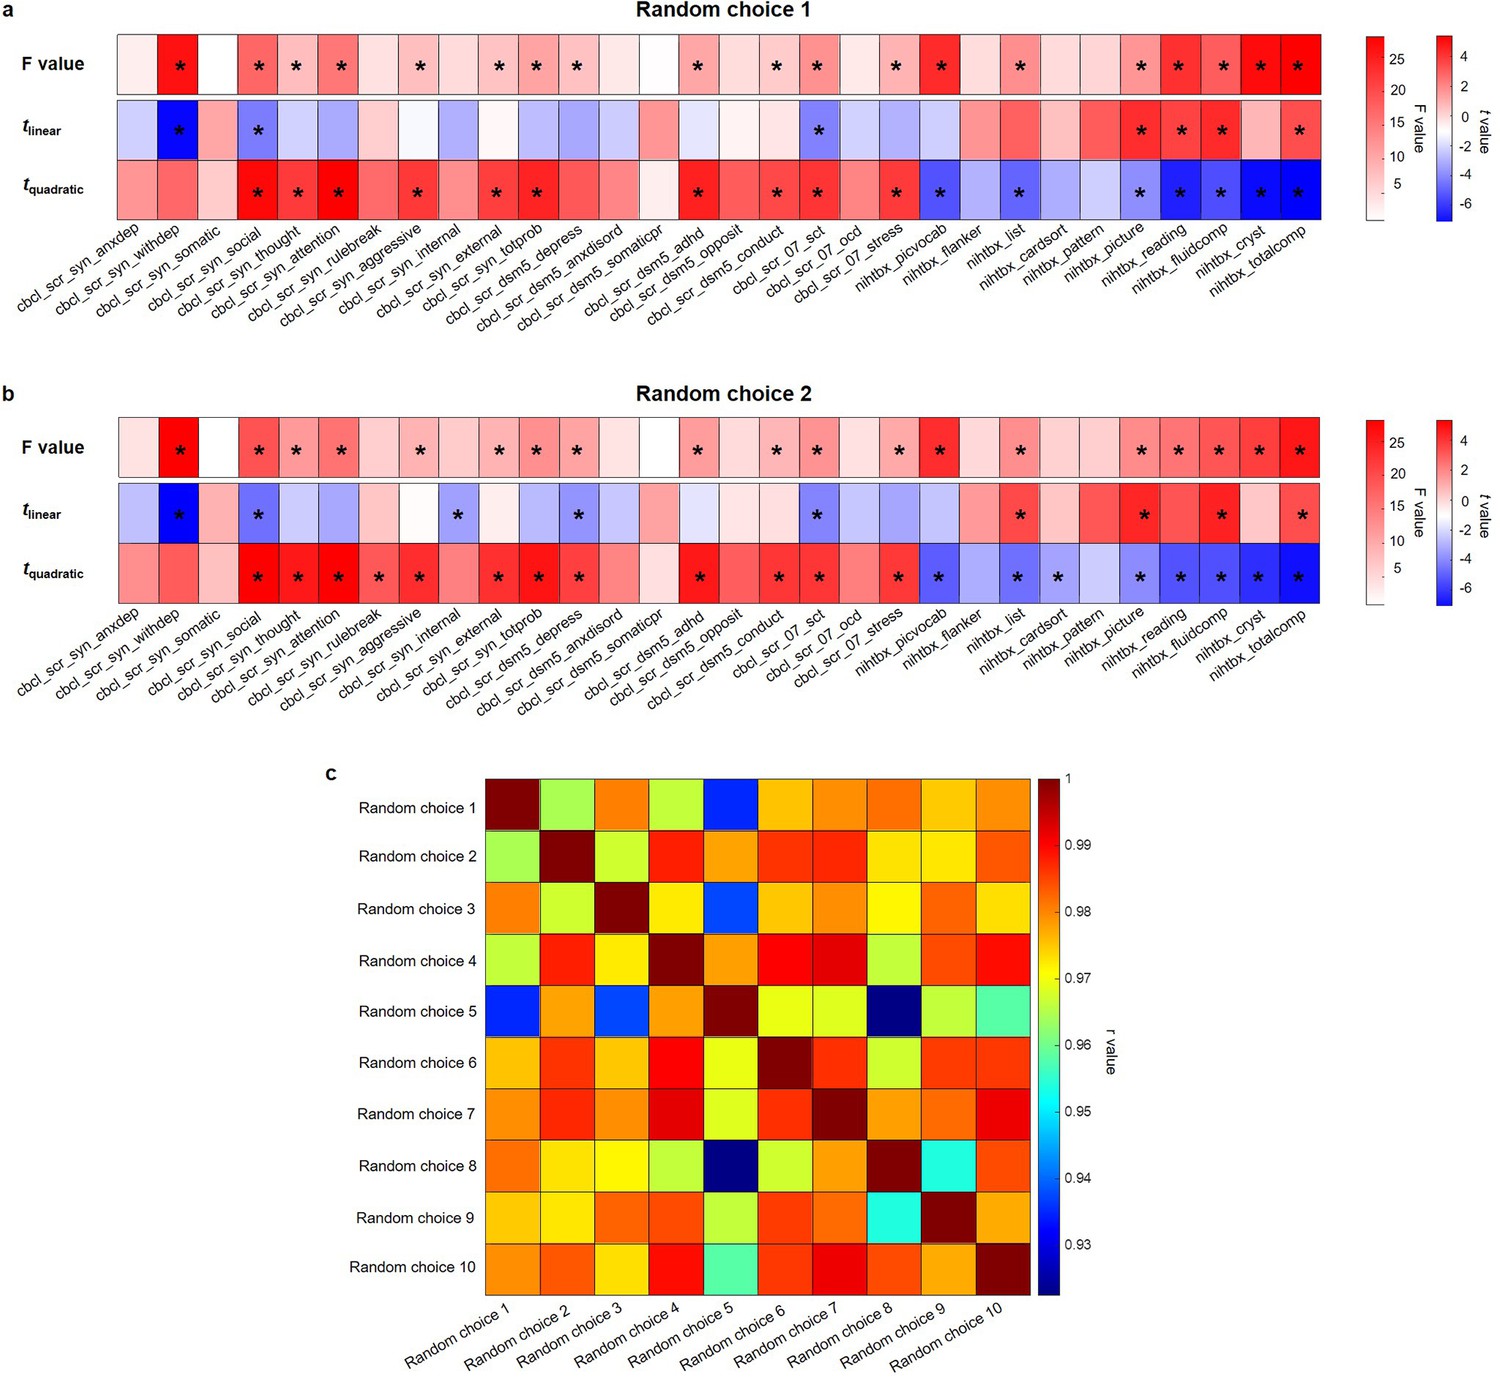
Behavior-level results of quadratic regression models by random choice of the siblings in the Adolescent Brain Cognitive Developmental (ABCD) study at baseline.
Results of quadratic regression models by randomly selecting siblings once (a) and twice (b). (c) Correlations of F values obtained by randomly selecting siblings 10 times.
Figure 2—figure supplement 3
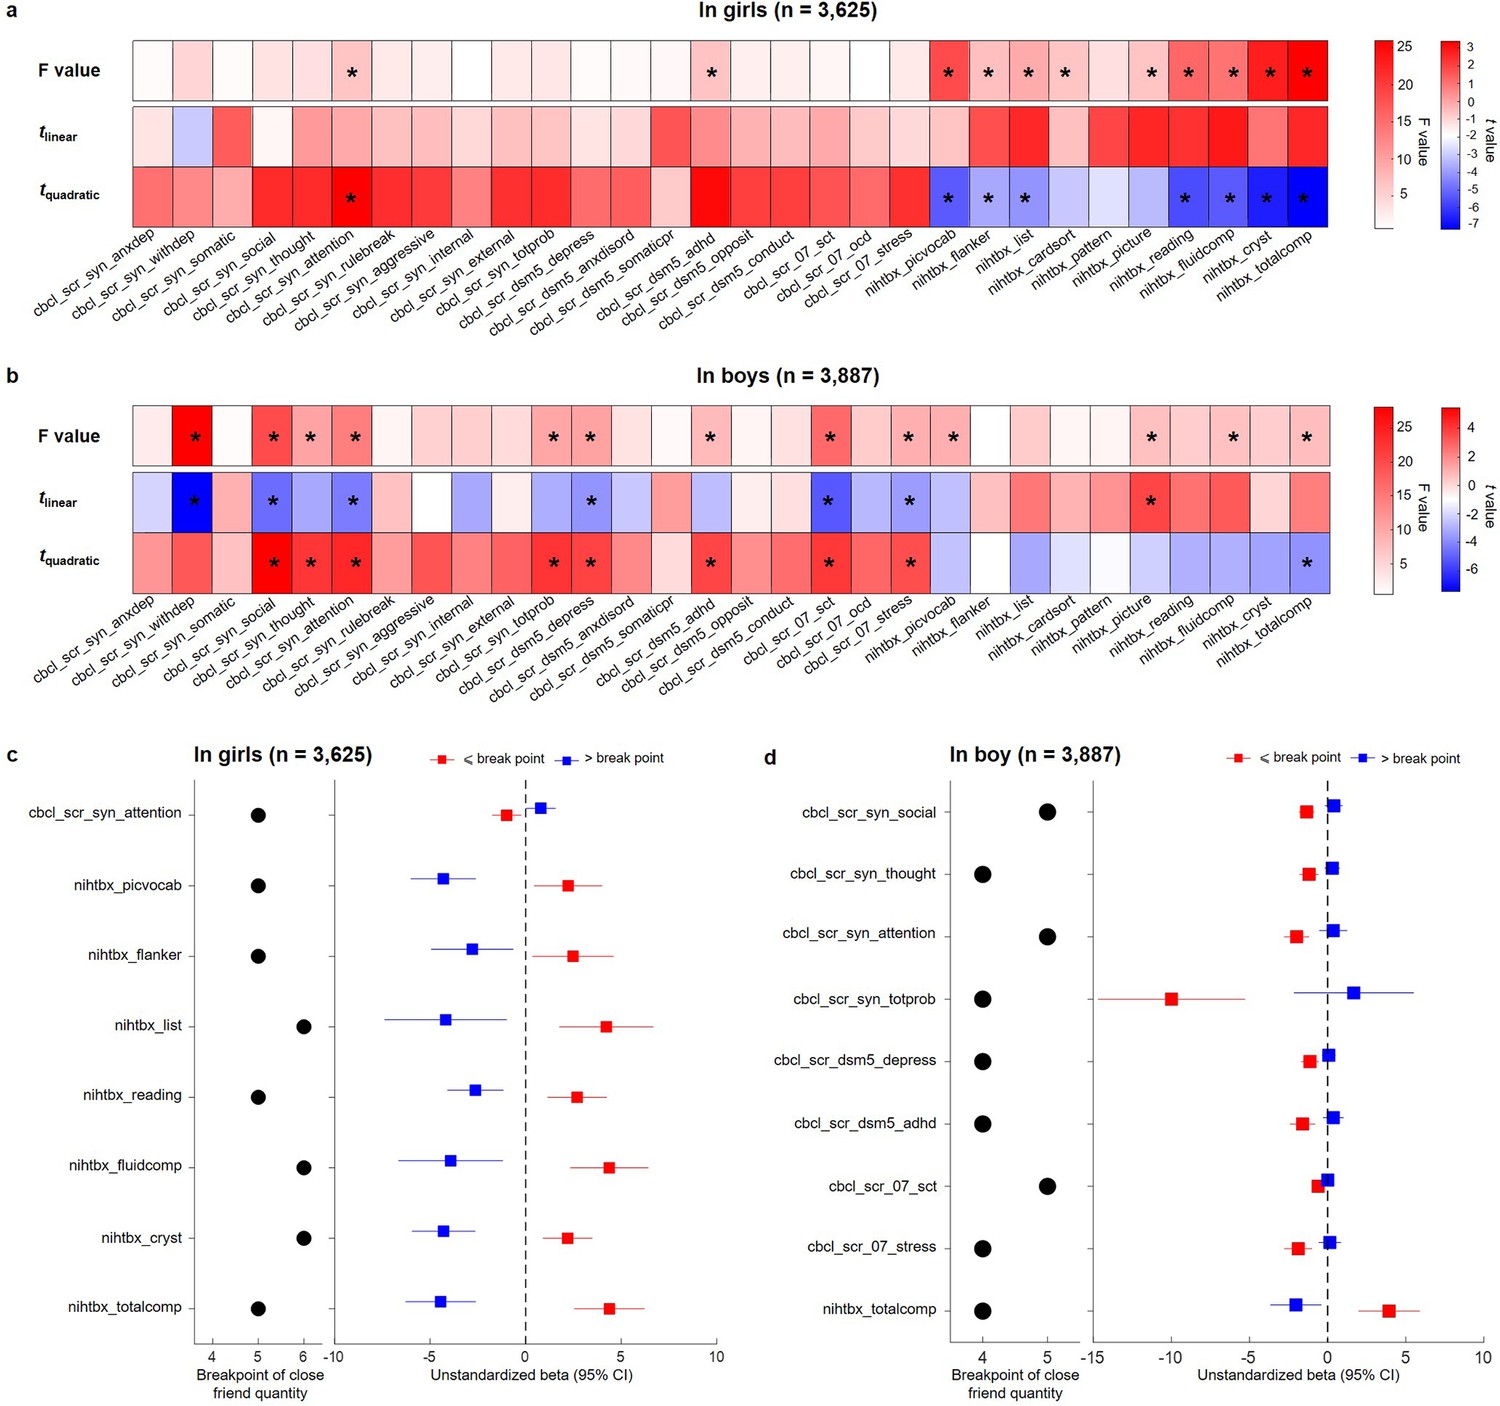
Results of behavior-level nonlinear association analyses in the Adolescent Brain Cognitive Developmental (ABCD) study at baseline in girls and boys, respectively.
(a) Results of quadratic regression models in girls (N = 3625). (b) Results of quadratic regression models in boys (N = 3887). (c) Results of two-lines tests in girls. (d) Results of two-lines tests in boys.
Figure 2—figure supplement 4
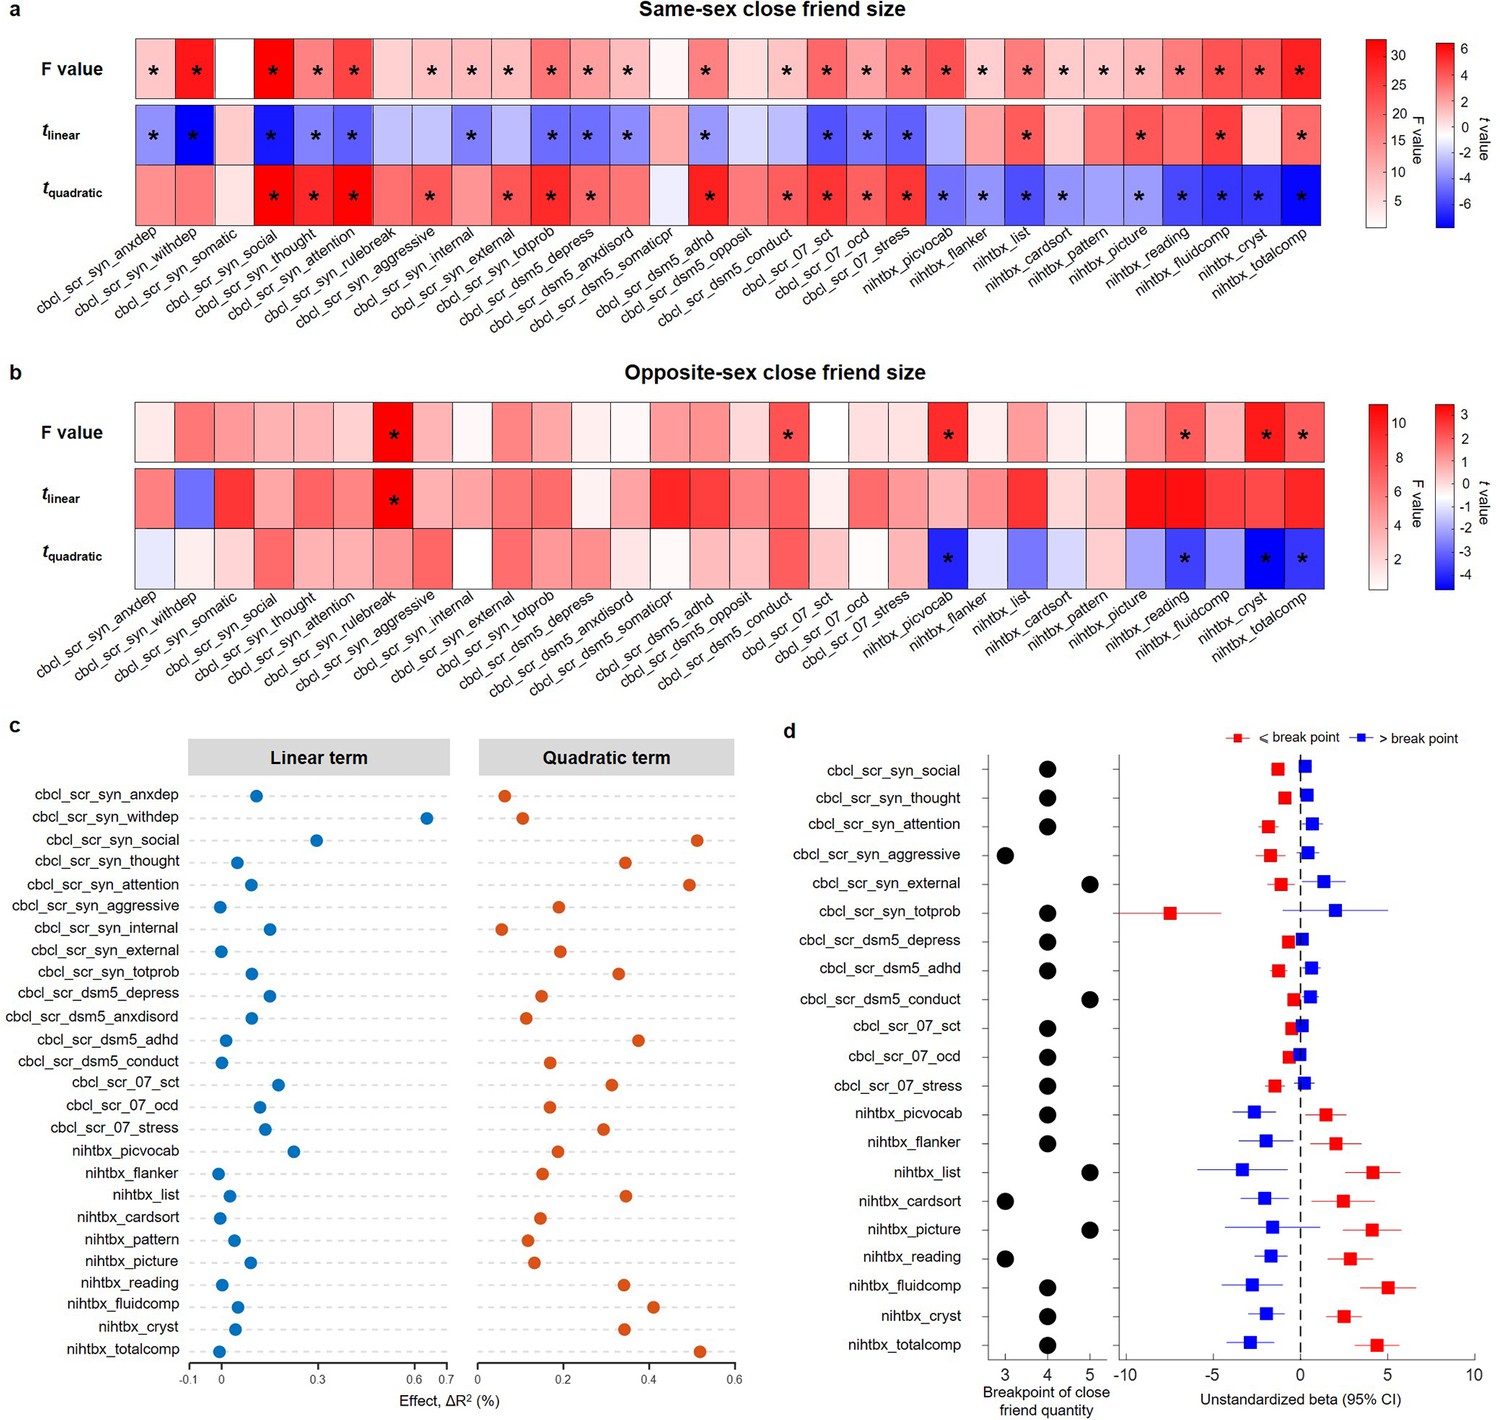
Nonlinear association of the number of same-sex and opposite-sex close friends with mental health and cognition in the Adolescent Brain Cognitive Developmental (ABCD) study at baseline.
Results of mental health and cognitive outcomes quadratically regressed on the number of same-sex close friends (a) and opposite-sex close friends (b). (c) Effect sizes of linear and quadratic terms of same-sex close friend number. (d) Results of two-lines tests of same-sex close friend number.
Figure 2—figure supplement 5
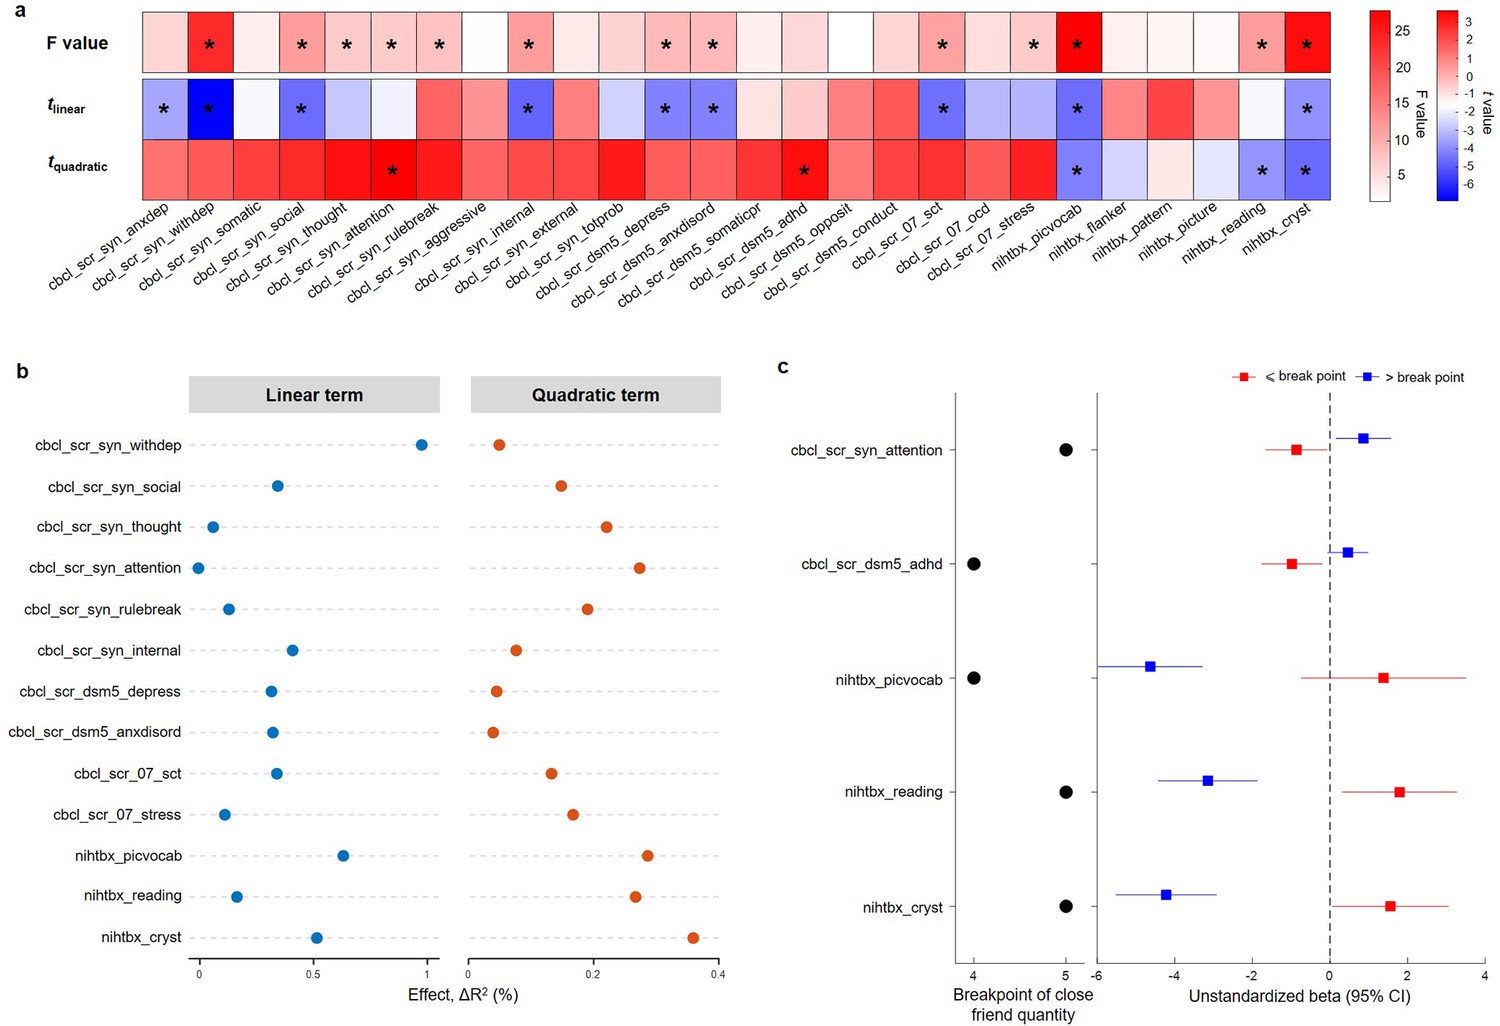
Results of behavior-level nonlinear association analyses in the Adolescent Brain Cognitive Developmental (ABCD) study at 2-year follow-up.
(a) Results of quadratic regression models using cross-sectional 2-year follow-up data. An asterisk indicates statistical significance after Bonferroni correction (i.e., p<0.05/26 for F value, and p<0.05/52 for t value). (b) Effect sizes of linear and quadratic terms of close friend number. (c) Results of two-lines tests. The breakpoint of close friend quantity and the estimated coefficients with 95% confidence intervals of linear regressions in each group separated by the breakpoint are reported.
Figure 3 with 5 supplements
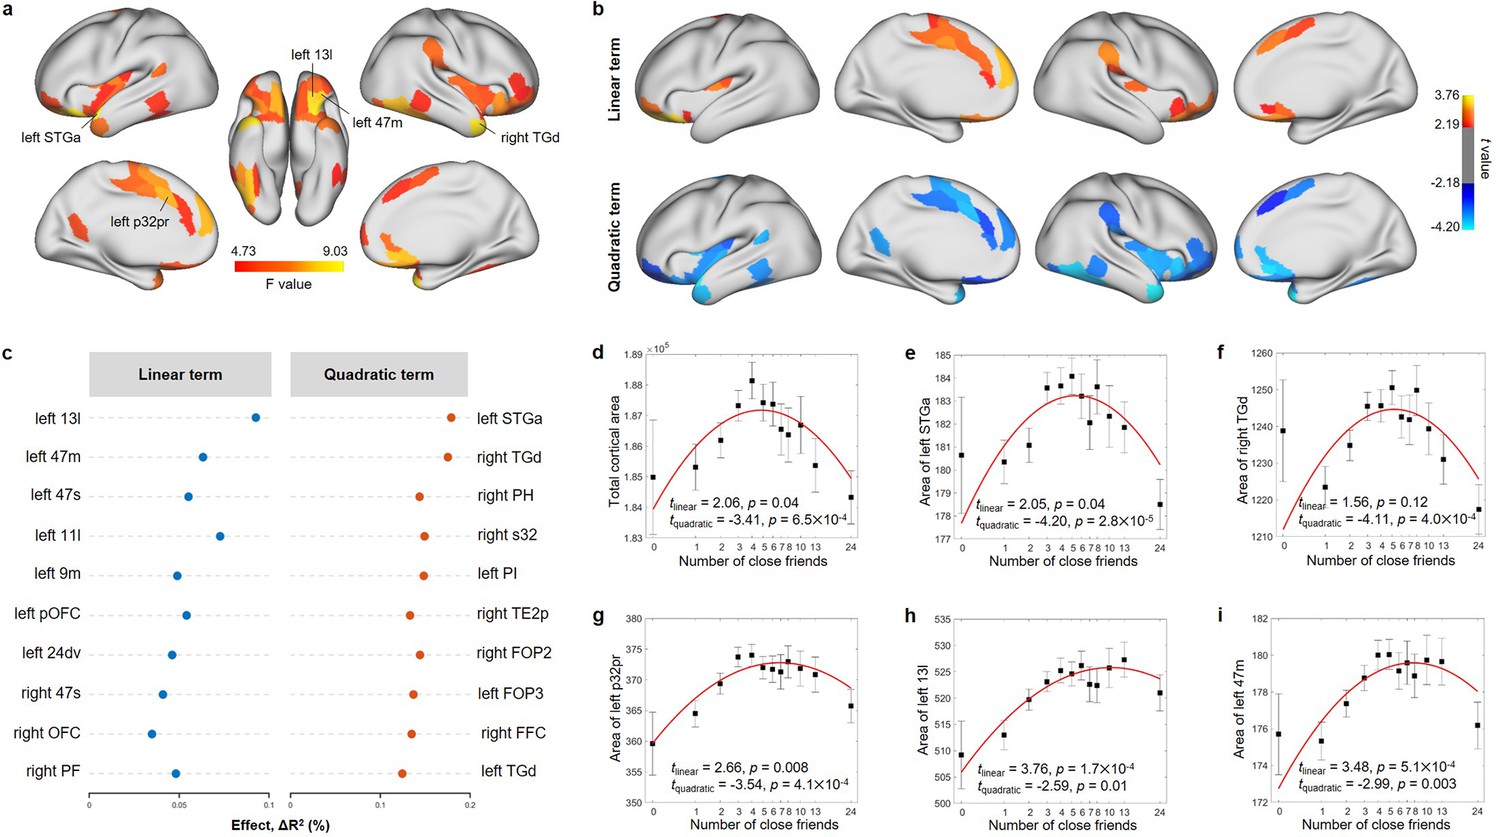
Nonlinear association between the number of close friends and cortical area in the Adolescent Brain Cognitive Developmental (ABCD) study at baseline.
(a) Cortical areas significantly associated with the number of close friends after FDR correction (i.e., 360 regions) based on the total F values of linear and quadratic terms. (b) Cortical areas with a significant linear or quadratic term. FDR correction was performed within the significant regions obtained in (a). (c) Top 10 regions with the strongest effect sizes of linear and quadratic terms, respectively. Relationship between the number of close friends and the total cortical area (d), left STGa (e), right TGd (f), left p32pr (g), left 13l (h), and left 47m (i). The number of close friends is classified into 13 bins, sample sizes of which are 107, 585, 1104, 1196, 957, 914, 631, 399, 463, 363, 416 and 377. In each bin, the mean (i.e., black dot) and standard error (i.e., error bar) of the dependent variable are shown. The x-axis is in log scale, and the median of the number of close friends in each bin was labeled in the x-axis. The red line is the fitted quadratic model. The names of the brain regions are from the HCP-MMP atlas.
-
Figure 3—source data 1
Results of nonlinear association analyses between the number of close friends and cortical area in the Adolescent Brain Cognitive Developmental (ABCD) study at baseline.
- https://cdn.elifesciences.org/articles/84072/elife-84072-fig3-data1-v1.xlsx
Figure 3—figure supplement 1
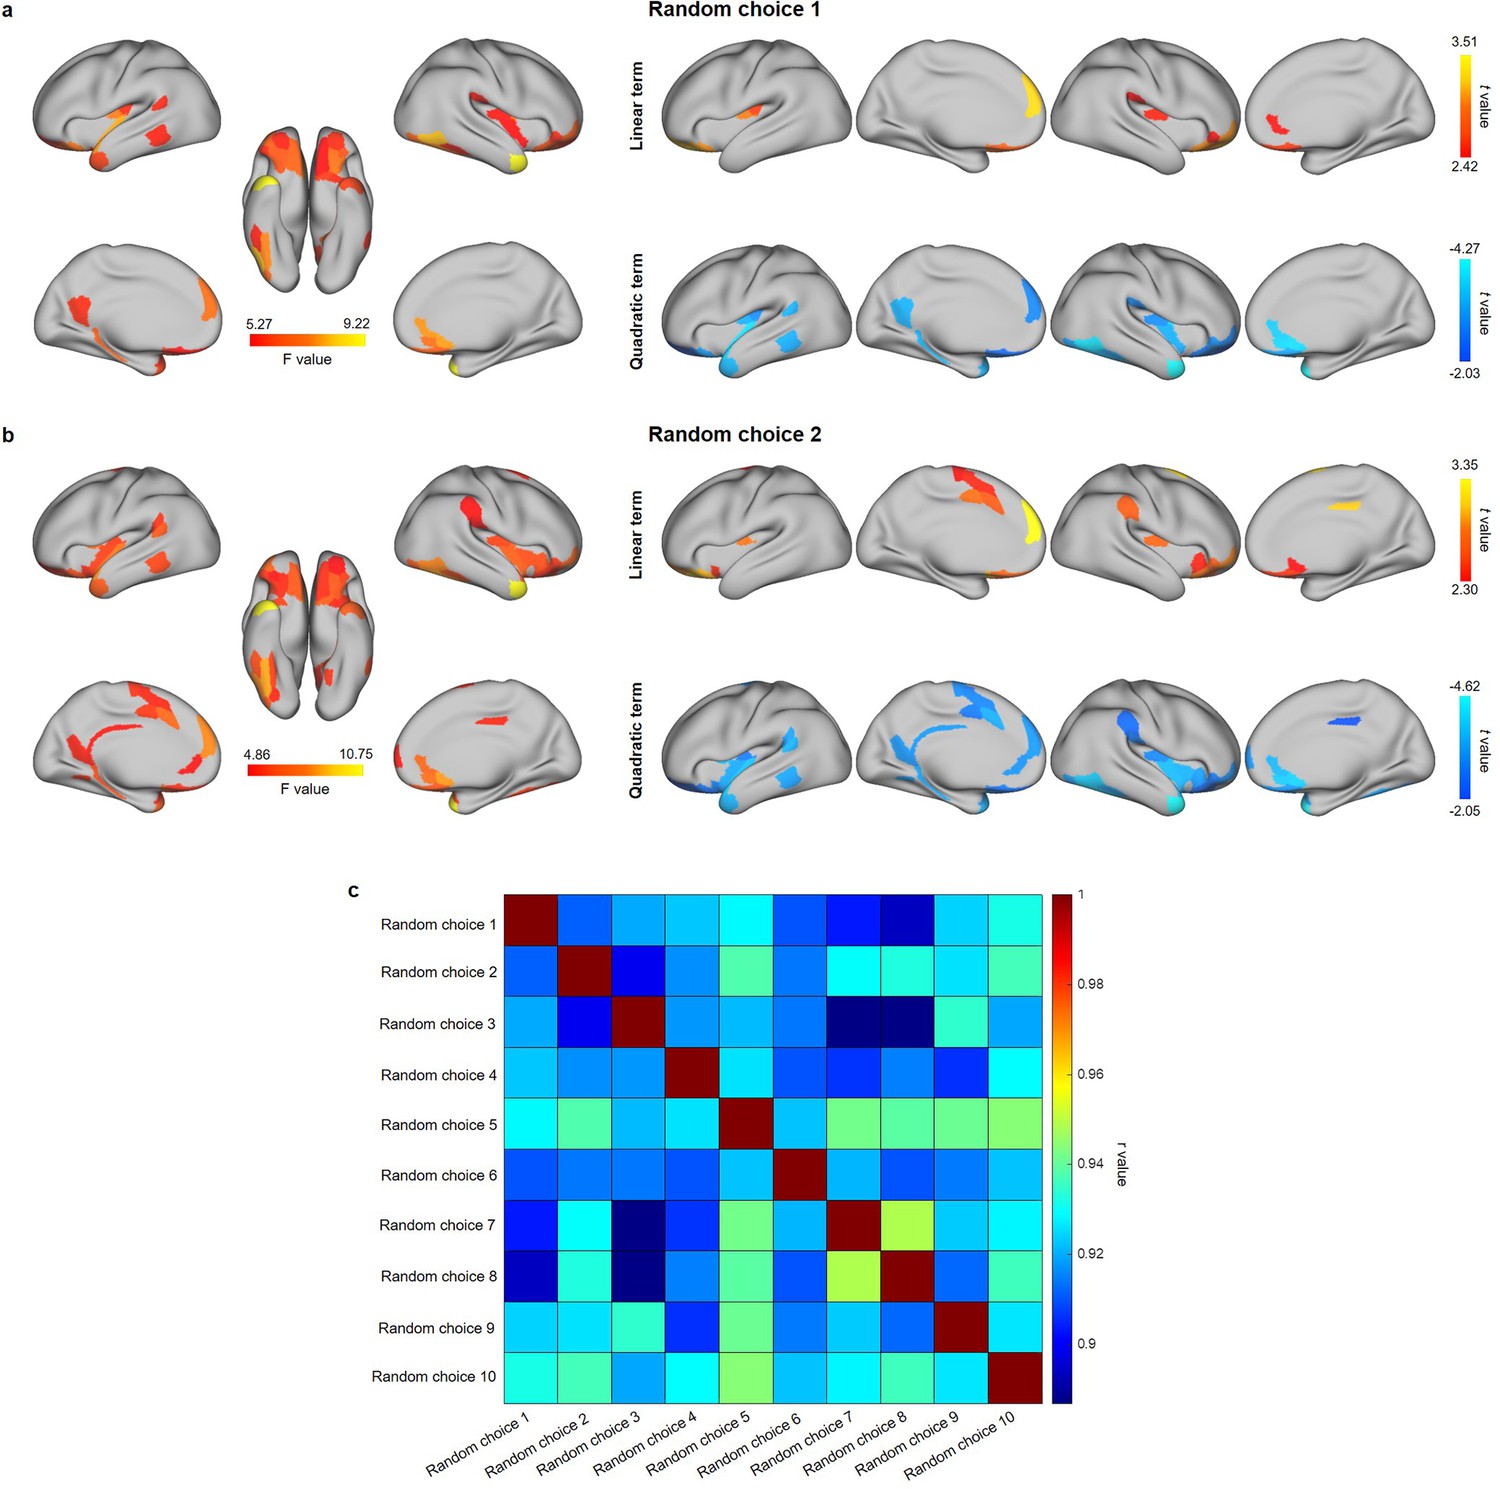
Nonlinear association between the number of close friends and cortical areas by random choice of the siblings.
Cortical areas significantly associated with the number of close friends by randomly selecting siblings once (a) and twice (b). (c) Correlations of F values obtained by randomly selecting siblings 10 times. Pairwise Pearson correlation score ranging from 0.89 to 0.95.
Figure 3—figure supplement 2
Nonlinear association between the number of close friends and cortical volumes.
(a) Cortical volumes significantly associated with the number of close friends after FDR correction (i.e., 360 regions) based on the total F values of linear and quadratic terms. (b) Cortical volumes with a significant quadratic term. FDR correction was performed within the significant regions obtained in (a). No region with a significant linear term after FDR correction.
Figure 3—figure supplement 3
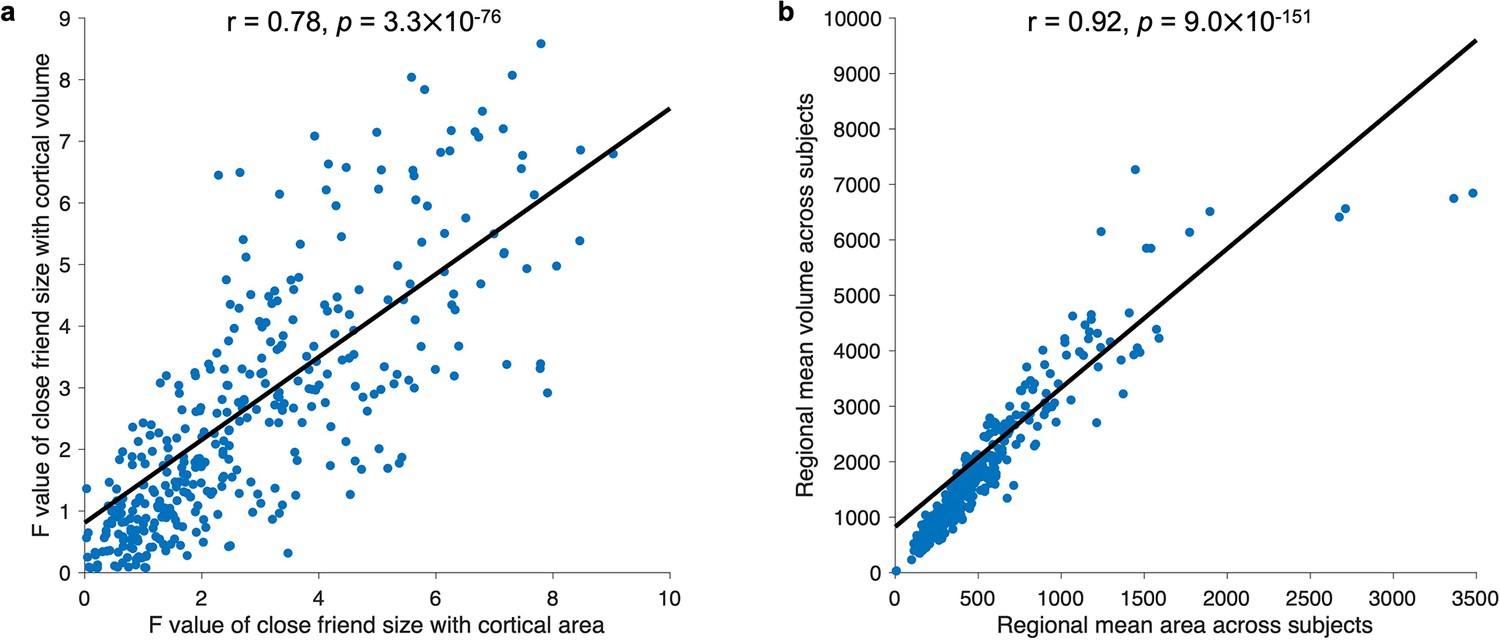
Relationship between cortical area and cortical volume.
(a) Association between the F-statistics of close friend number with cortical area and the F-statistics of close friend number with cortical volume. (b) Association between regional mean area and regional mean volume across subjects.
Figure 3—figure supplement 4
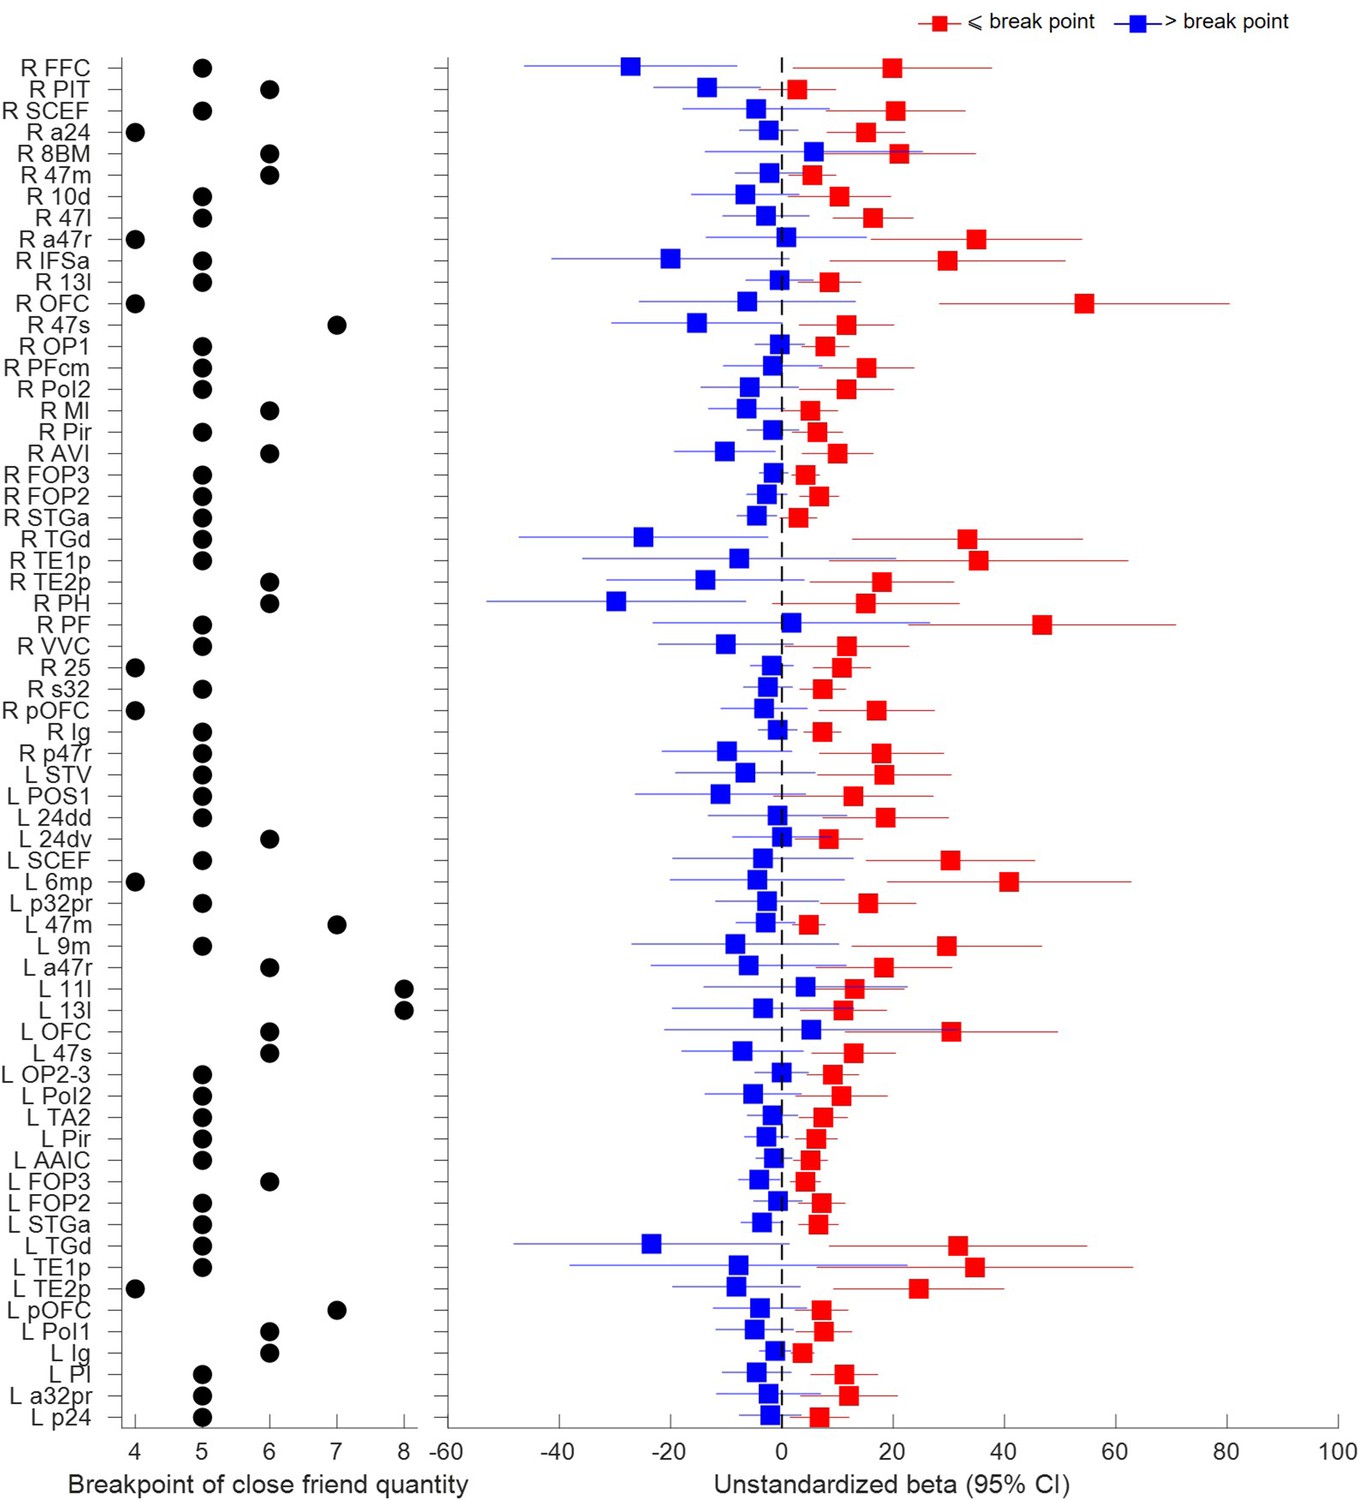
Results of two-lines tests for significant cortical areas.
The breakpoint of close friend quantity and the estimated coefficients with 95% confidence intervals of linear regressions in each group separated by the breakpoint are reported.
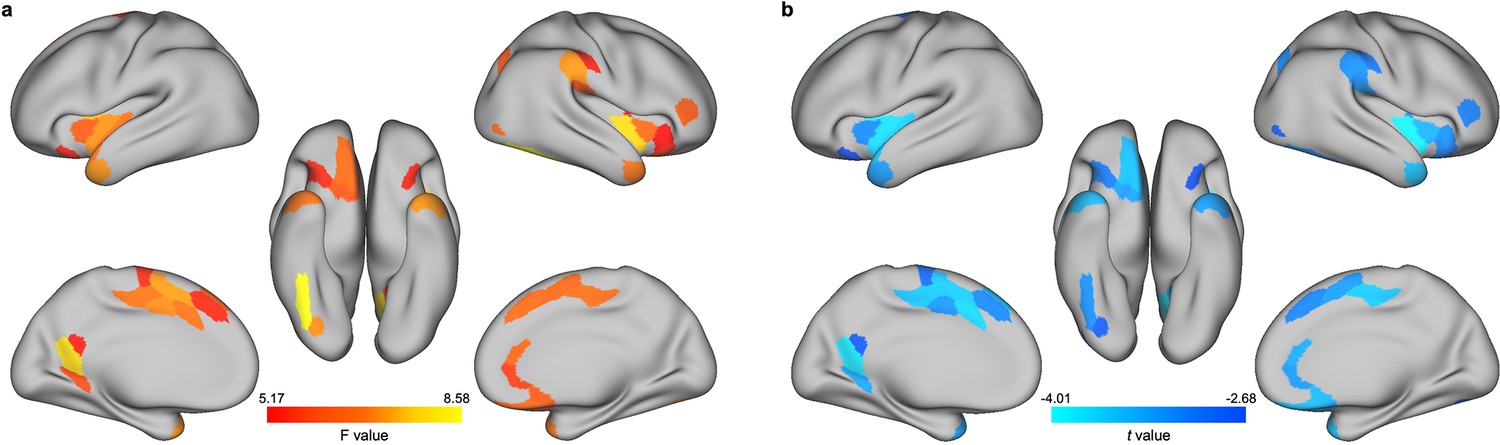
Figure 3—figure supplement 5
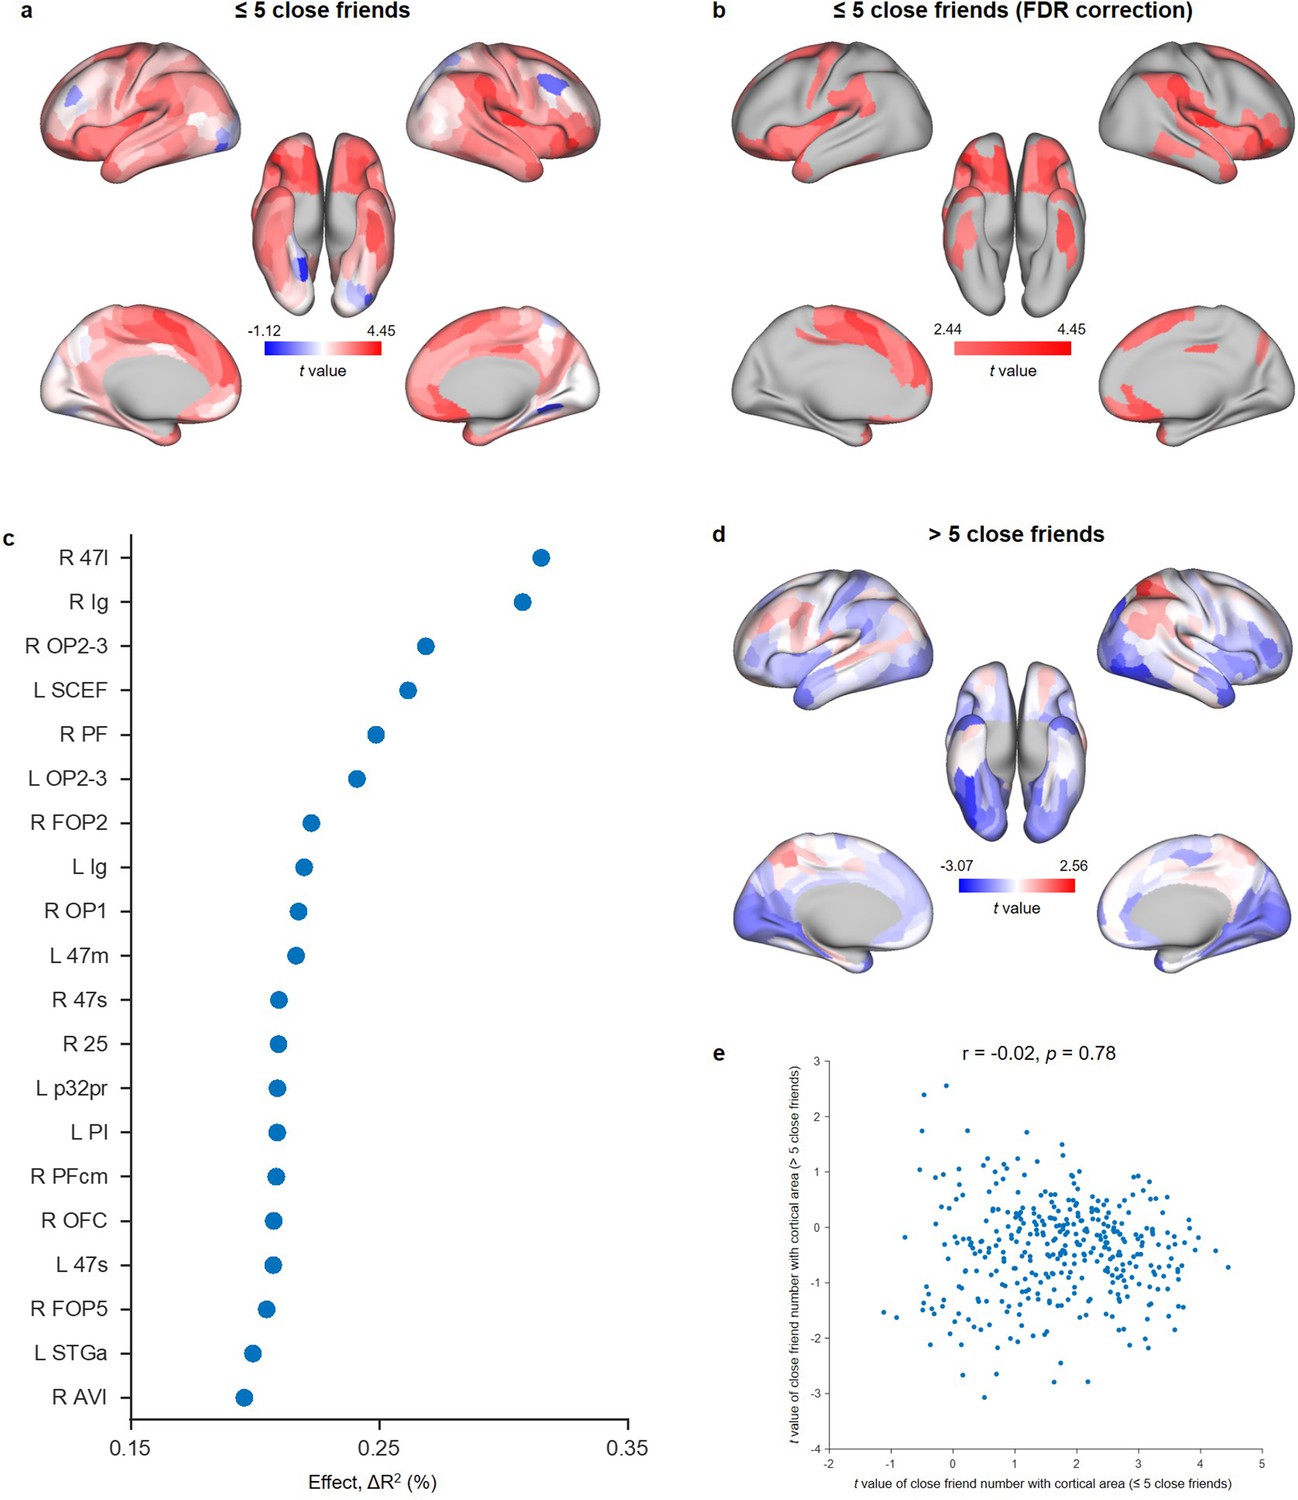
Results of linear association analyses between close friend quantity and cortical area in ≤5 and >5 groups, respectively.
(a) Unthresholded t-statistic map of cortical areas associated with the number of close friends in the ≤5 group (N = 4863). (b) Significant cortical areas associated with the number of close friends after FDR correction in the ≤5 group. (c) Effect sizes of the top 20 areas associated with the number of close friends in the ≤5 group. The effect size was calculated by the change in the overall proportion of variance (adjusted R2) between the linear model and the model with only covariates. (d) Unthresholded t-statistic map of cortical areas associated with the number of close friends in the >5 group (N = 2649). No region survived after FDR correction. (e) Association between t-statistic maps of cortical areas associated with the number of close friends in the ≤5 and >5 groups.
Figure 4
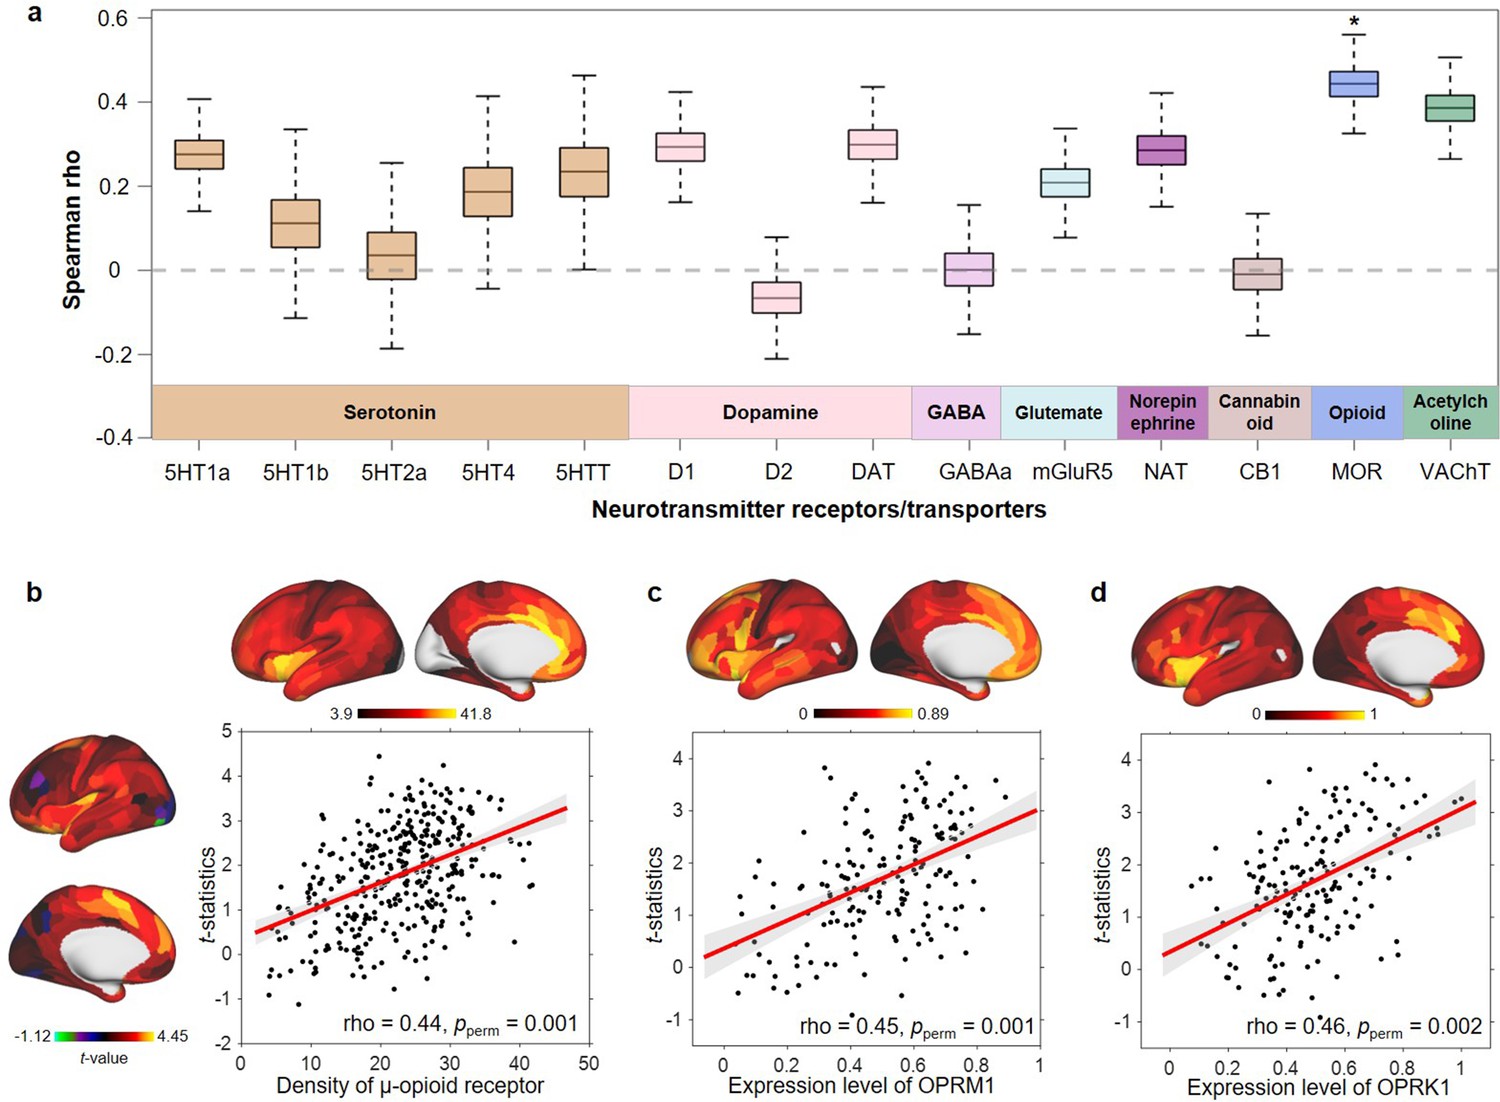
Spatial correlation between cortical area differences related to the number of close friends in children with ≤5 close friends and density of neurotransmitters and gene expression level.
(a) Bootstrapped Spearman correlations (10,000 times) between t-statistics of close friendship quantity and densities of 14 neurotransmitter receptors or transporters. In each box, the line indicates the median and the whiskers indicate the 5th and 95th percentiles. p-Values were estimated by 5000 times permutation. *: Bonferroni corrected pperm < 0.05. MOR: μ-opioid receptor. (b) The scatter map of t-statistics of close friendship quantity and the density of the μ-opioid receptor. (c) The scatter map of t-statistics of close friendship quantity and the expression level of OPRM1 gene. (d) The scatter map of t-statistics of close friendship quantity and the expression level of OPRK1 gene.
Figure 5 with 1 supplement
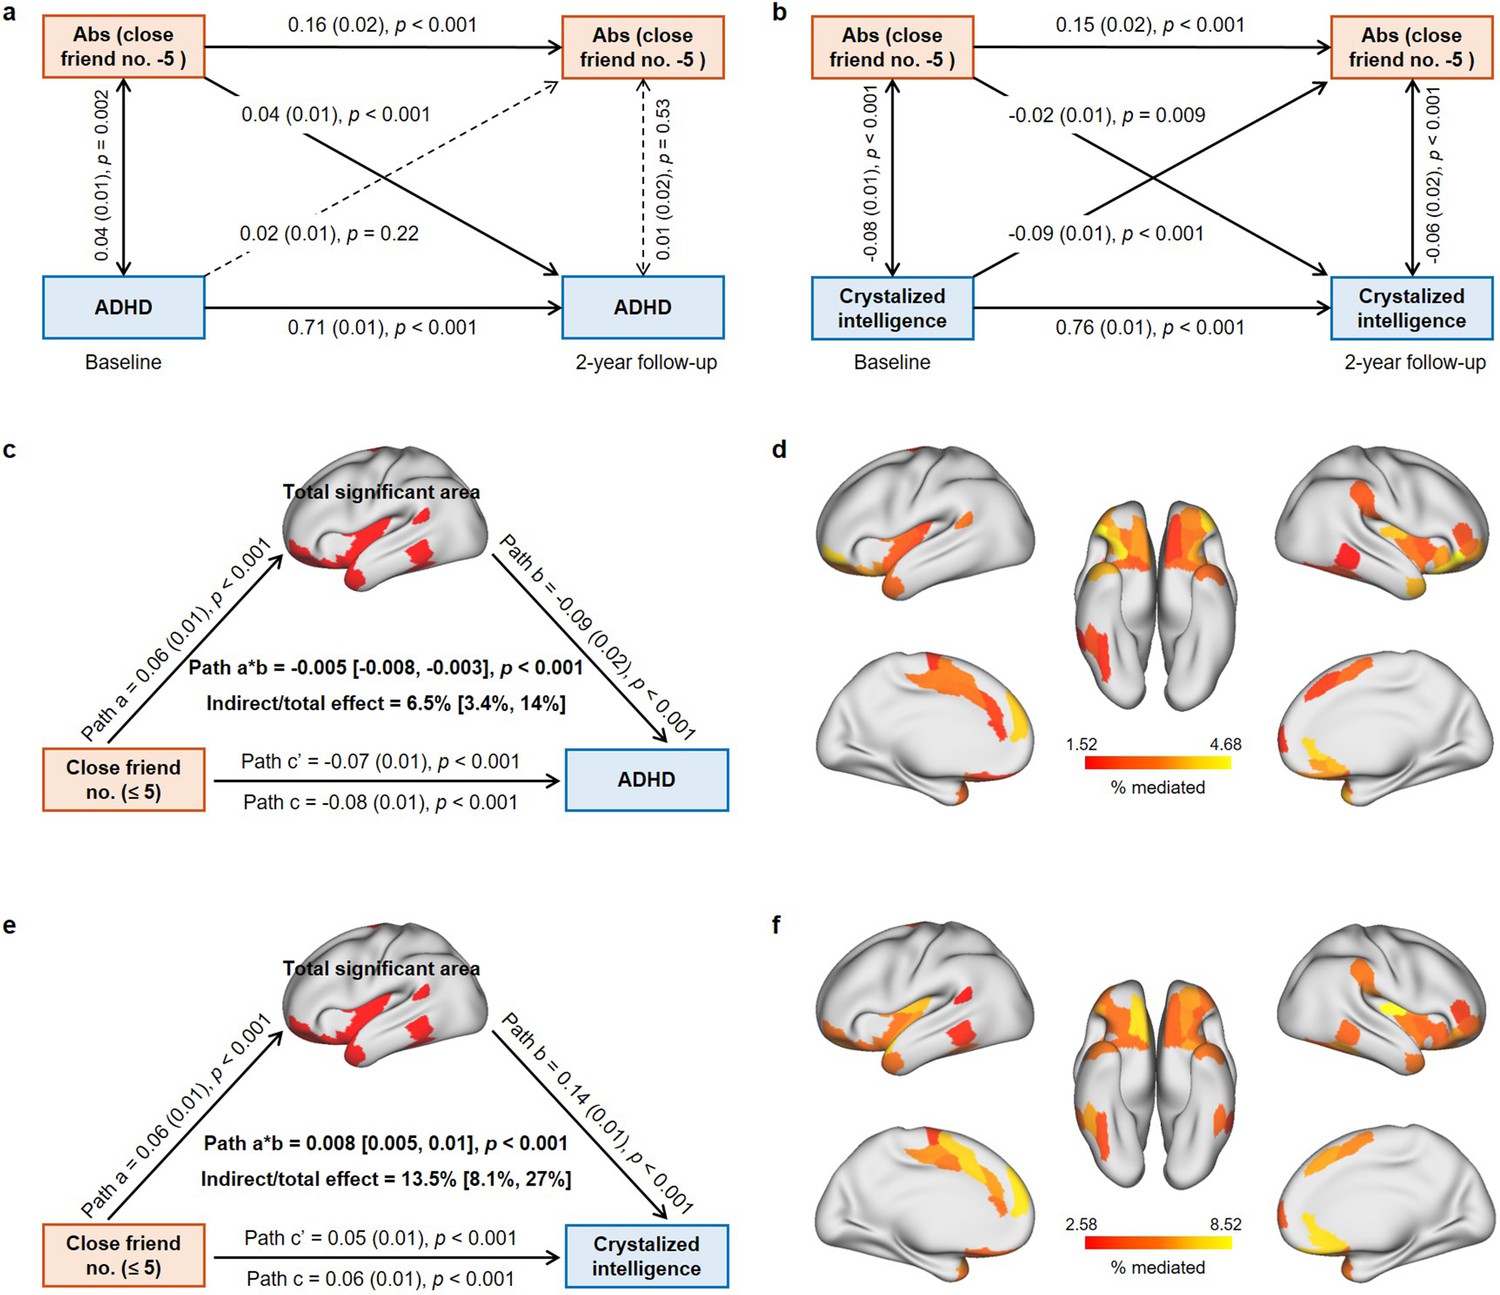
Results of longitudinal and mediation analysis in the Adolescent Brain Cognitive Developmental (ABCD) study.
(a) Cross-lagged panel model (CLPM) of the absolute value of close friendship quantity to 5 and ADHD symptoms (N = 6013). Comparative fit index (CFI) = 0.996, Tucker–Lewis index (TFI) = 0.97, standardized root mean squared residual (SRMR) = 0.002, root mean square error of approximation (RMSEA) = 0.015. (b) CLPM of the absolute value of close friendship quantity to 5 and crystalized intelligence (N = 6013). CFI = 0.994, TFI = 0.96, SRMR = 0.003, RMSEA = 0.025. (c) Mediation analysis of close friendship quantity, the total area of significant regions, and ADHD symptoms. (d) The effect of individual significant cortical areas that mediated the association between close friendship quantity and ADHD symptoms after FDR correction. (e) Mediation analysis of close friendship quantity, the total area of significant regions and crystalized intelligence. (f) The effect of individual significant cortical areas that mediated the association between close friendship quantity and crystalized intelligence after FDR correction.
Figure 5—figure supplement 1
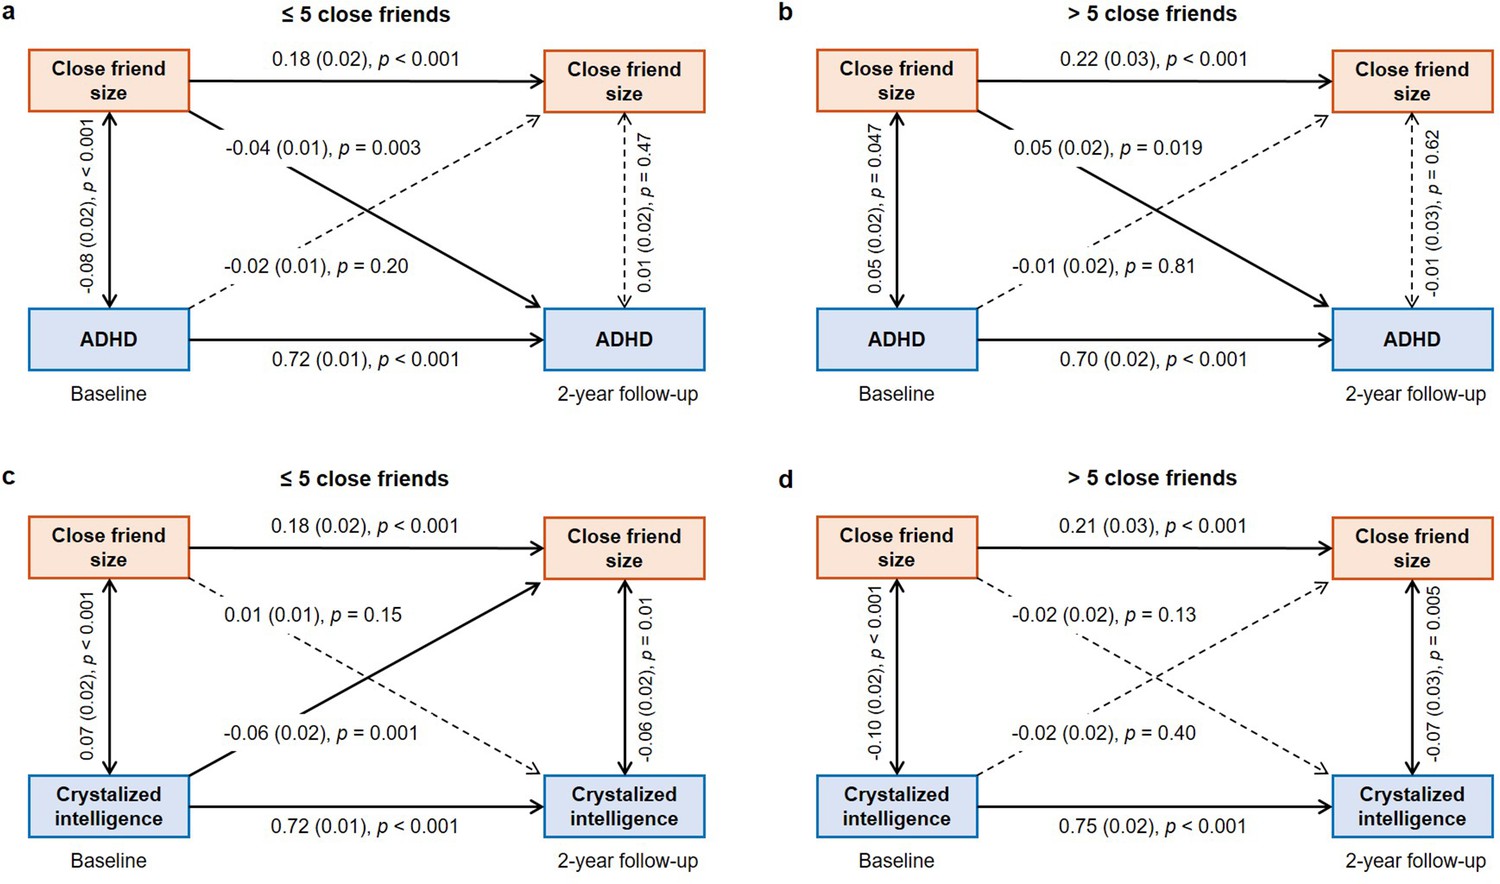
Cross-lagged panel models (CLPMs) of close friend number and Adolescent Brain Cognitive Developmental (ADHD) symptoms, and crystalized intelligence in ≤5 and >5 groups, respectively.
CLPMs of close friend number and ADHD symptoms in the ≤5 group (a) and in the >5 group (b). CLPM of close friend number and crystalized intelligence in the ≤5 group (c) and in the >5 group (d).
Figure 6 with 1 supplement
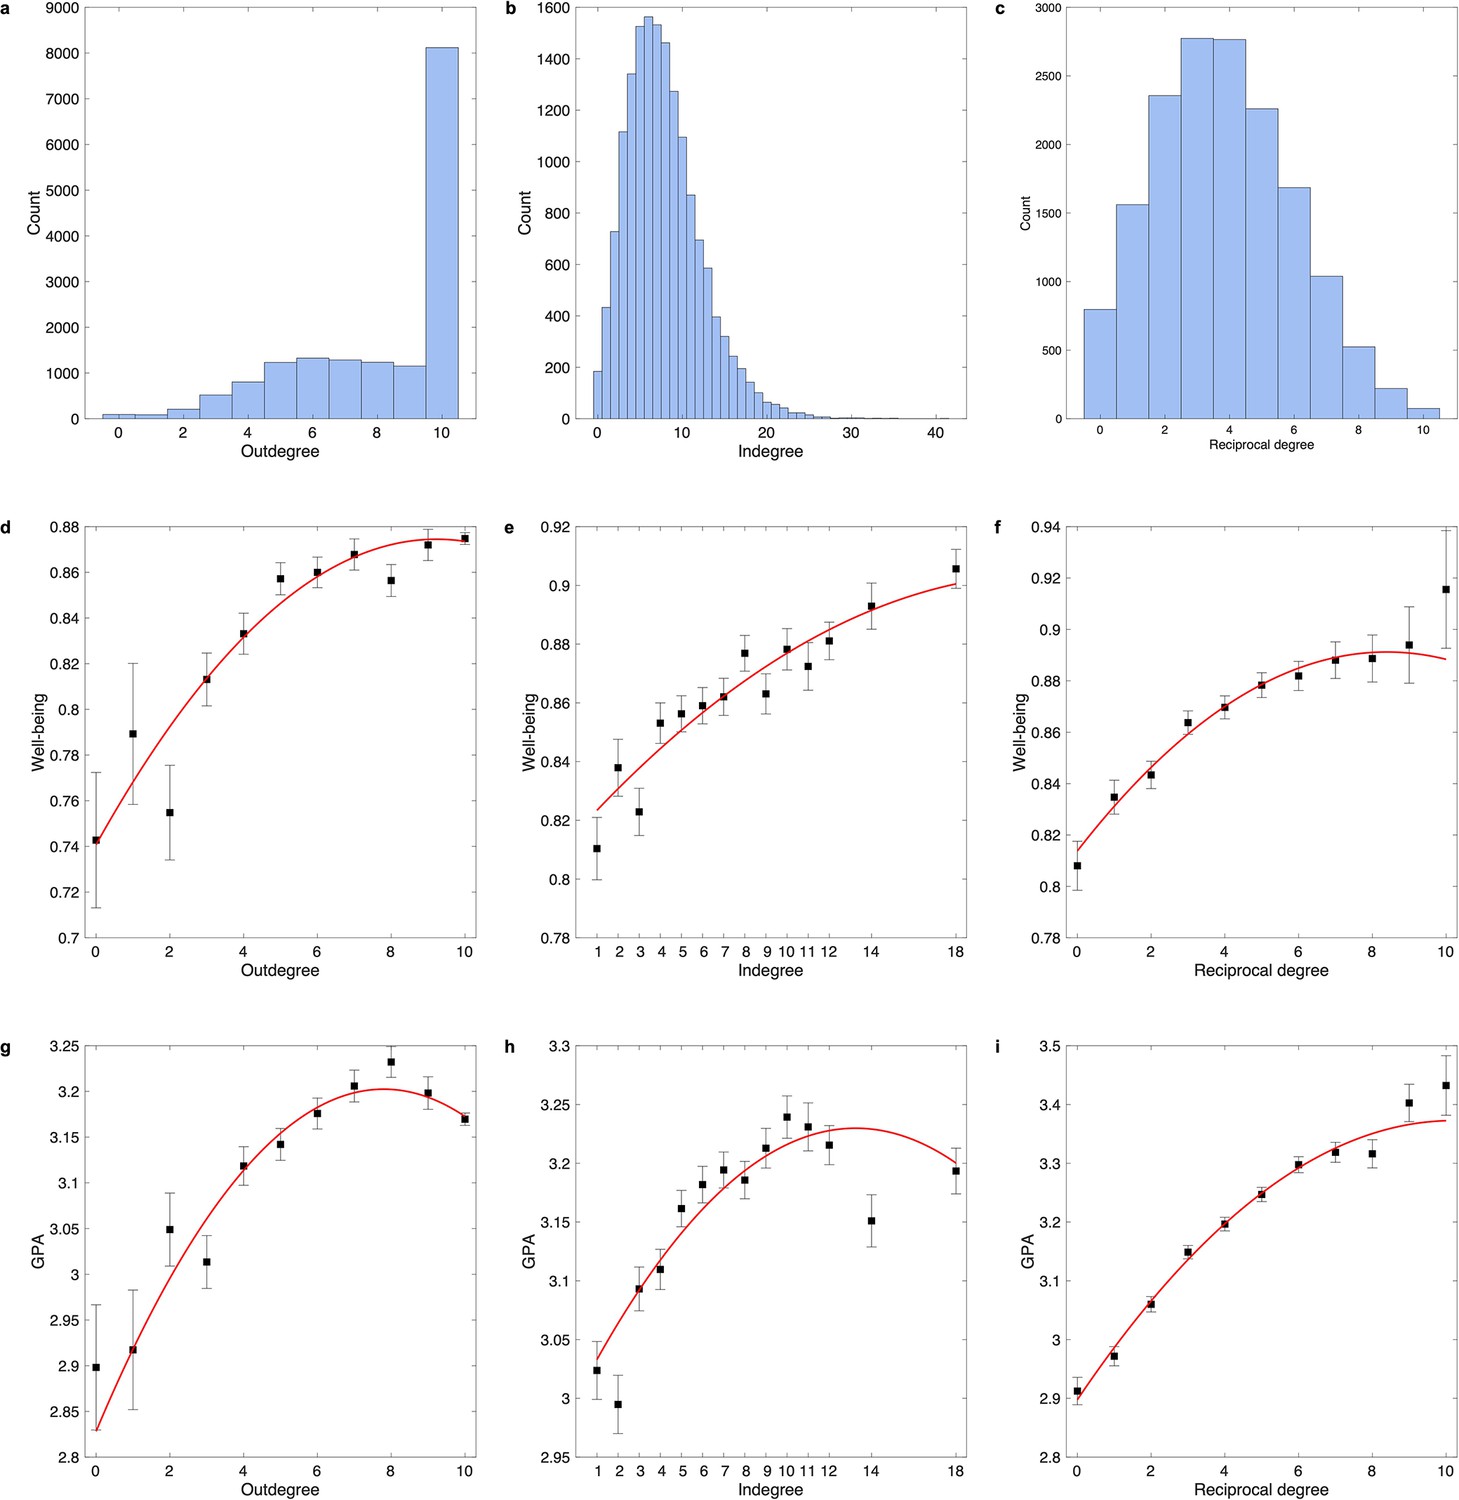
Distribution of outdegree, indegree, and reciprocal degree in the social network dataset.
(a) Distribution of outdegree which is the number of outward nominations. (b) Distribution of indegree which is the number of inward nominations. (c) Distribution of reciprocal degree which is the number of reciprocal nominations. Relationship of well-being with outdegree (d), indegree (e), and reciprocal degree (f). Relationship of grade point average (GPA) with outdegree (g), indegree (h), and reciprocal degree (i). In each bin, the mean (i.e., black dot) and standard error (i.e., error bar) of the dependent variable are shown. The red line is the fitted quadratic model. For outdegree, sample sizes of bins 1-11 are 92, 87, 208, 519, 803, 1230, 1326, 1286, 1235, 1151 and 8119. For indegree, sample sizes of bins 1-14 are 617, 728, 1116, 1341, 1526, 1563, 1532, 1462, 1273, 1095, 870, 1281, 716 and 936. For reciprocal degree, sample sizes of bins 1-11 are 797, 1561, 2356, 2774, 2765, 2260, 1685, 1039, 524, 220 and 75.
Figure 6—figure supplement 1
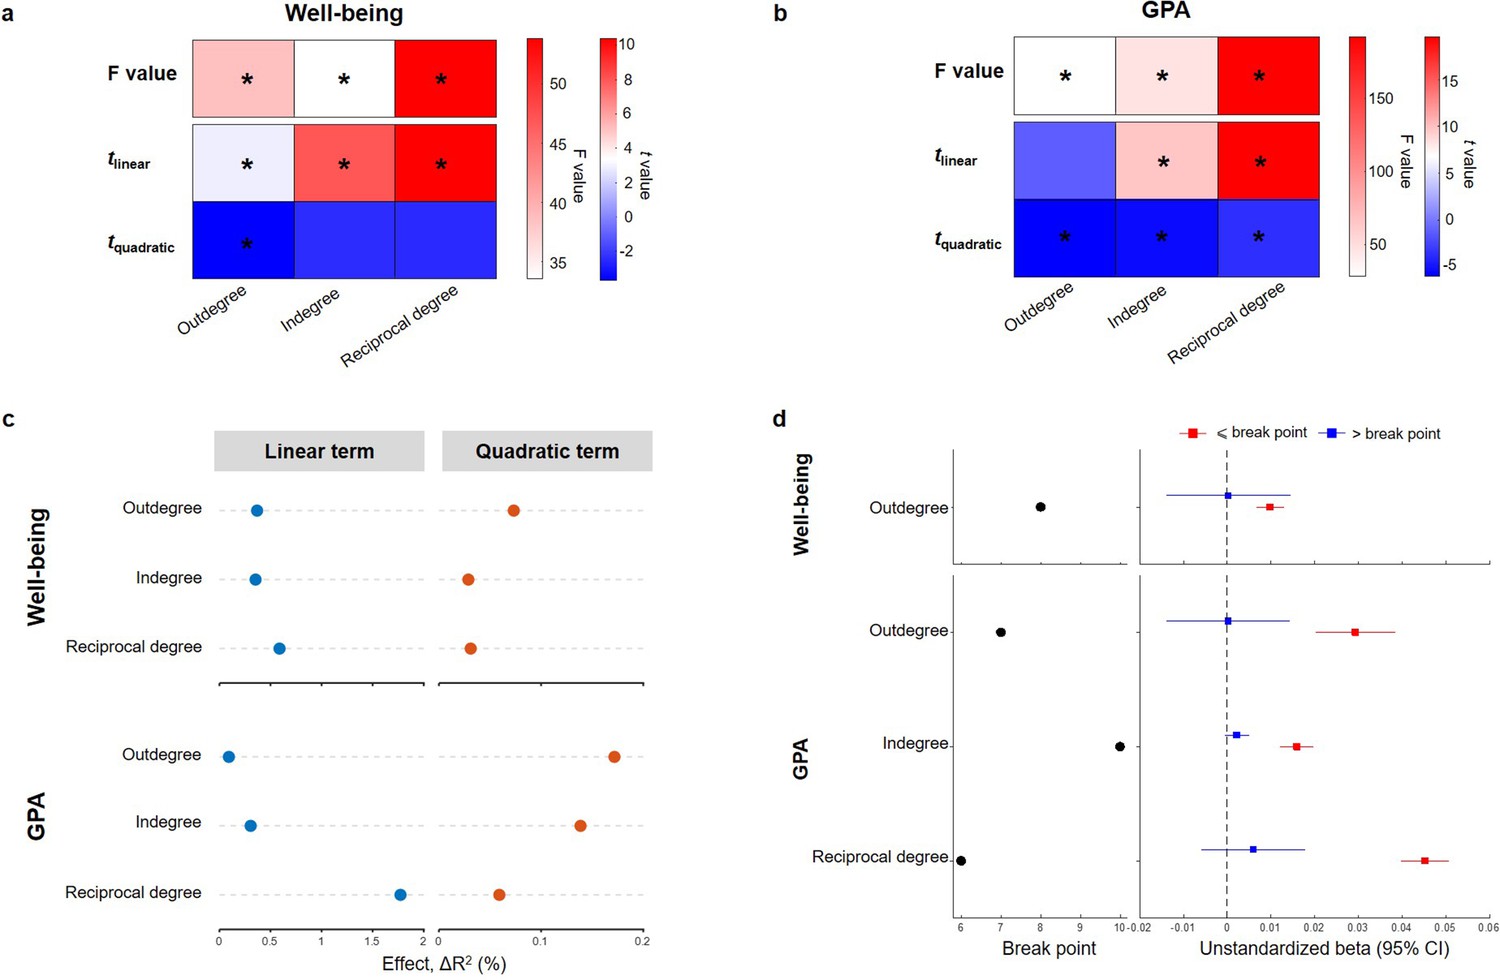
Results of nonlinear association analysis in the social network dataset.
(a) Results of well-being quadratically regressed on outdegree, indegree, and reciprocal degree, respectively. (b) Results of grade point average (GPA) quadratically regressed on outdegree, indegree, and reciprocal degree, respectively. The total F values of quadratic and linear terms, and the t values of linear and quadratic terms are reported. An asterisk indicates statistical significance after Bonferroni correction (i.e., p<0.05/6 for F value, and p<0.05/12 for t value). (c) Effect sizes of linear and quadratic terms of social network indicators for well-being and GPA. (d) Results of two-lines tests. The breakpoint and the estimated coefficients with 95% confidence intervals of linear regressions in each group separated by the breakpoint are reported.
Tables
Table 1
Characteristics of the study population in the Adolescent Brain Cognitive Developmental (ABCD) study at baseline*.
| ≤5 close friends(N = 4863) | >5 close friends(N = 2649) | p-value† | |
|---|---|---|---|
| Age | 9.91 ± 0.61 | 9.93 ± 0.63 | 0.08 |
| Sex | 0.02 | ||
| Female | 2299 (47.3%) | 1326 (50.1%) | |
| Male | 2564 (52.7%) | 1323 (49.9%) | |
| Race | 0.001 | ||
| White | 2672 (54,9%) | 1497 (56.5%) | |
| Black | 561 (11,5%) | 370 (14.0%) | |
| Hispanic | 1015 (20.9%) | 485 (18.3%) | |
| Asian | 109 (2.2%) | 45 (1.7%) | |
| Other | 506 (10.4%) | 252 (9.5%) | |
| Family size ‡ | 4.69 ± 1.82 | 4.58 ± 1.84 | 0.01 |
| Family income | 7.28 ± 2.34 | 7.4 ± 2.35 | 0.03 |
| Parental education | 16.82 ± 2.62 | 16.97 ± 2.53 | 0.02 |
| Body mass index | 18.71 ± 4.11 | 18.73 ± 4.11 | 0.77 |
| Puberty | 1.73 ± 0.86 | 1.78 ± 0.88 | 0.02 |
| Urbanization § | 0.12 | ||
| Rural | 395 (8.5%) | 220 (8.7%) | |
| Urban clusters | 167 (3.6%) | 68 (2.7%) | |
| Urbanized area | 4,074 (87.9%) | 2,229 (88.6%) | |
| Total close friends | 3.04 ± 1.36 | 12.19 ± 13.14 | <0.001 |
| Same-sex close friends | 2.41 ± 1.22 | 9.13 ± 9.82 | <0.001 |
| Opposite-sex close friends | 0.63 ± 0.79 | 3.05 ± 5.79 | <0.001 |
-
*
Values are mean ± SDor N (%).
-
†
For continuous data, t-test was performed; for categorical data, chi-square test was performed.
-
‡
4780 and 2624 participants in ≤5 and >5 close friends groups have family size data, respectively.
-
§
4636 and 2517 participants in ≤5 and >5 close friends groups have urbanization data, respectively.
Table 2
Characteristics of the study population in the Adolescent Brain Cognitive Developmental (ABCD) study at 2-year follow-up (N = 4290).
| Value* | |
|---|---|
| Age | 11.49 ± 0.66 |
| Sex | |
| Female | 2044 (47.7%) |
| Male | 2246 (52.4%) |
| Race | |
| White | 2612 (60.9%) |
| Black | 385 (9.0%) |
| Hispanic | 791 (18.4%) |
| Asian | 89 (2.1%) |
| Other | 413 (9.6%) |
| Family income | 7.83 ± 2.04 |
| Parental education | 17.11 ± 2.44 |
| Body mass index | 20.35 ± 4.63 |
| Puberty | 2.53 ± 1.05 |
| Total close friends | 6.82 ± 8.37 |
| Same-sex close friends | 4.99 ± 5.92 |
| Opposite-sex close friends | 1.83 ± 3.66 |
-
*
Values are mean ± SDor N (%).
Table 3
Characteristics of the study population in the social network dataset (N = 16,056).
| Variable | Value * |
|---|---|
| Age | 12.00 ± 1.03 |
| Sex | |
| Female | 8068 (50.3%) |
| Male | 7988 (49.8%) |
| Grade | |
| 5th grade | 1107 (6.9%) |
| 6th grade | 4190 (26.1%) |
| 7th grade | 5279 (32.9%) |
| 8th grade | 5480 (34.1%) |
| New to the school | |
| New to school | 4315 (26.9%) |
| Returning to school | 11,741 (73.1%) |
| Most friends go to this school | |
| Yes | 14,429 (89.9%) |
| No | 1627 (10.1%) |
| Outdegree | 8.08 ± 2.43 |
| Indegree | 7.83 ± 4.42 |
| Reciprocal degree | 3.82 ± 2.14 |
| Well-being | 0.86 ± 0.24 |
| Grade point average | 3.17 ± 0.61 |
-
*
Values are mean ± SD or N (%).
Additional files
-
MDAR checklist
- https://cdn.elifesciences.org/articles/84072/elife-84072-mdarchecklist1-v1.docx
-
Supplementary file 1
Detailed information of neurotransmitter density data.
- https://cdn.elifesciences.org/articles/84072/elife-84072-supp1-v1.xlsx
Download links
A two-part list of links to download the article, or parts of the article, in various formats.
Downloads (link to download the article as PDF)
Open citations (links to open the citations from this article in various online reference manager services)
Cite this article (links to download the citations from this article in formats compatible with various reference manager tools)
Brain and molecular mechanisms underlying the nonlinear association between close friendships, mental health, and cognition in children
eLife 12:e84072.
https://doi.org/10.7554/eLife.84072


