Concurrent decoding of distinct neurophysiological fingerprints of tremor and bradykinesia in Parkinson’s disease
- Department of Neuroscience, Brown University, United States
- Robert J. and Nancy D. Carney Institute for Brain Science, Brown University, United States
- The Warren Alpert Medical School, Brown University, United States
- Norman Prince Neurosciences Institute, Rhode Island Hospital, United States
- Department of Neurosurgery, Rhode Island Hospital, United States
- Department of Neurosurgery, Brigham and Women’s Hospital, United States
- Department of Neurology, Rhode Island Hospital, United States
Figures
Figure 1
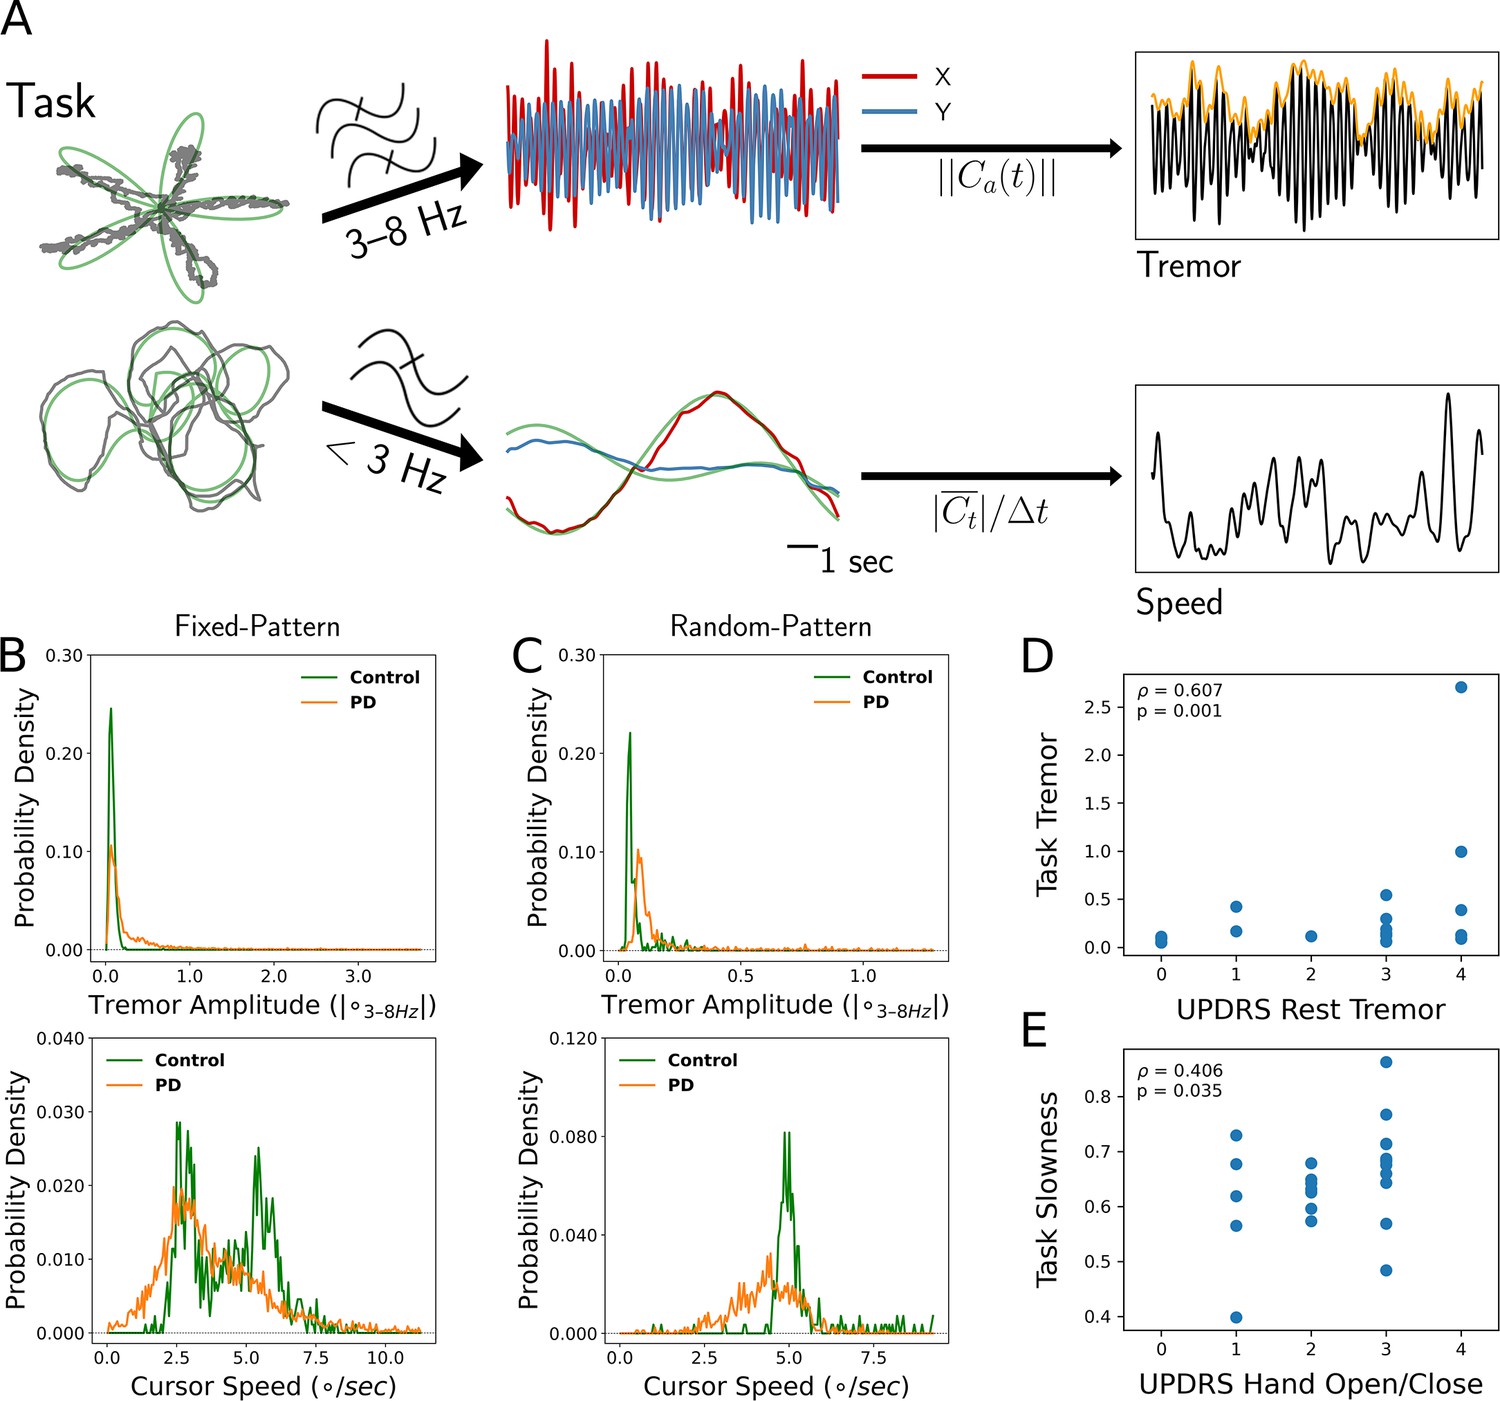
Tremor and movement speed calculated from fixed- and random-pattern intraoperative visual-motor tasks.
(A) Left: Schematic of task target (green) and cursor (gray) traces from a single trial of the fixed- (top) or random- (bottom) pattern task. Center-top: Bandpass filtered cursor traces from a task trial. refers to the amplitude of the analytic signal (a) of the cursor trace (C). Center-bottom: Lowpass filtered cursor traces from a task trial. Right-top: One-dimensional projection of bandpass filtered traces (black), with tremor amplitude measured from the envelope (orange). Right-bottom: Cursor speed measured from lowpass filtered traces (black). Figure adapted from Figure 1 of Ahn et al., 2020. (B, C) Distributions of 7 s tremor amplitude (top) and cursor speed (bottom) epochs for control subject and Parkinson's disease (PD) patient populations in the fixed-pattern (B) (n=5375 epochs across 35 subjects) and random-pattern (C) (n=1123 epochs across 9 subjects) task. ° – degrees of visual angle. (D, E) Task-based tremor amplitude (D) and slowness (E) corresponded to UPDRS measures of tremor (D) or bradykinesia (E) (n=24 subjects). ρ=Spearman correlation statistic.
Figure 2
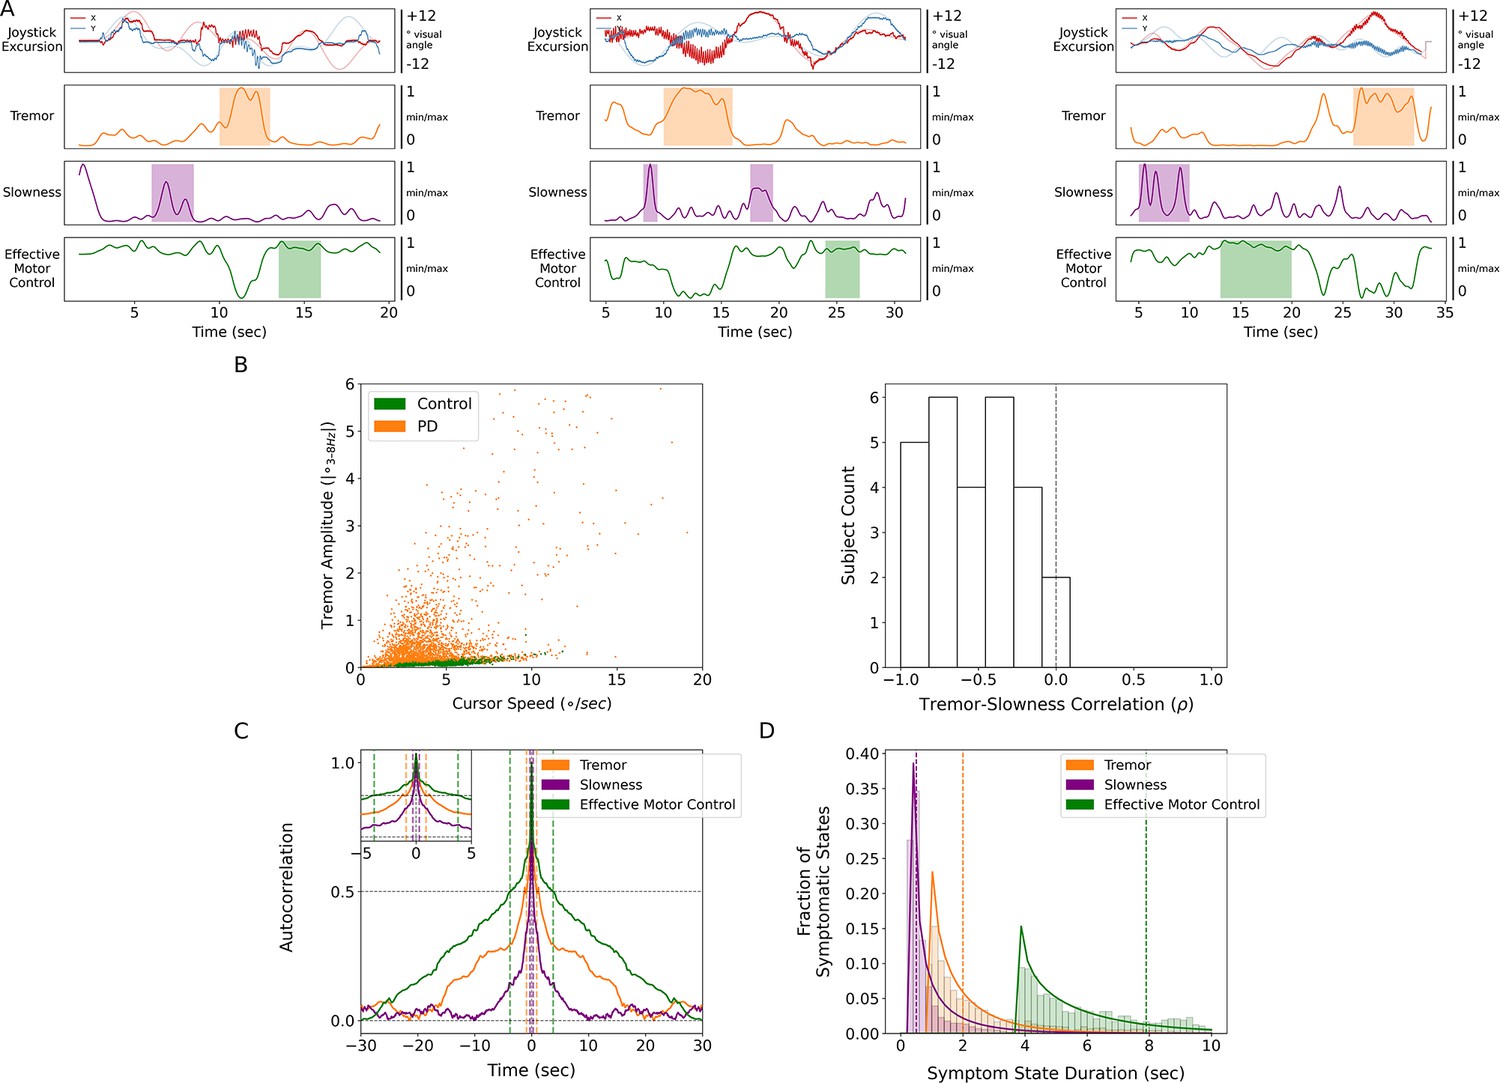
Tremor and slowness represented two non-overlapping motor states with differing timescales.
(A) Examples from three individual subjects of cursor (solid lines) and target (translucent lines) traces (top row) and calculated motor metrics (bottom three rows) within single trials. Periods of increased expression of individual motor metrics are highlighted by their respective color. (B) (Left) Scatter plot of all cursor speed and tremor measurements in 7 s epochs across subjects. (Right) Histogram of subject-wide behavioral Spearman correlation with tremor and slowness metrics (n=27 subjects). (C) Autocorrelograms of symptomatic (tremor, slowness) and non-symptomatic (effective motor control) metrics. Colored vertical dashed lines indicate full-width half-maximum (FWHM) for each metric. Top-left inset depicts a zoomed-in window of the autocorrelogram. (D) Histogram of sustained motor metric period duration (i.e., symptomatic state duration) across subjects. Solid lines indicate gamma distribution fit to each motor metric state histogram, while dashed vertical lines indicate the median symptomatic state length for each metric.
Figure 3
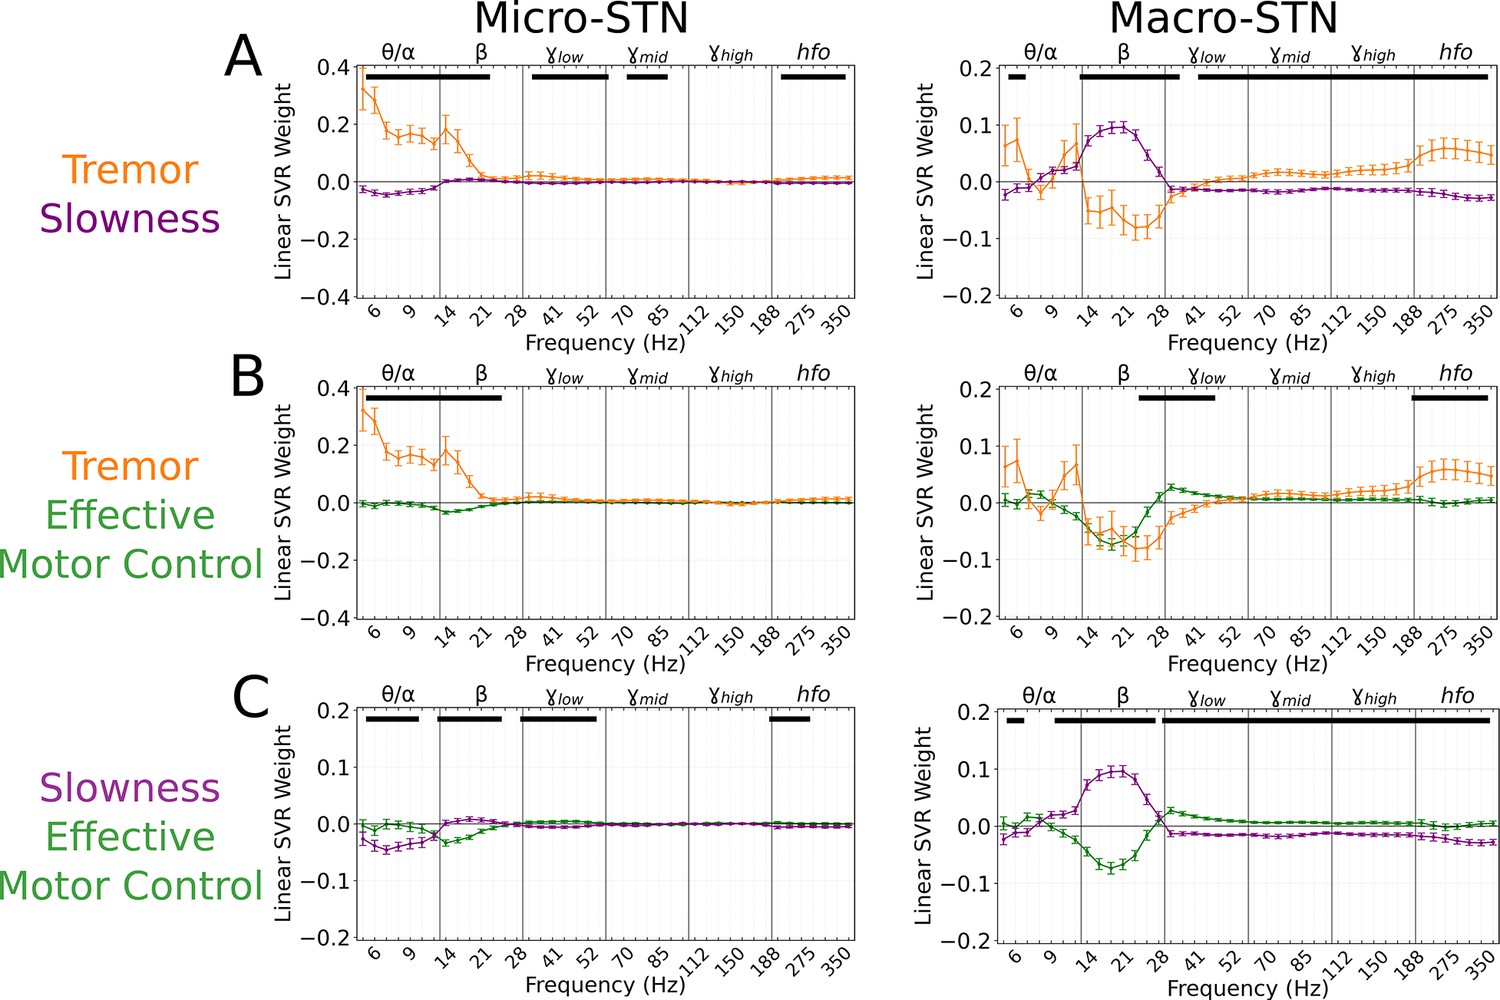
Subthalamic tremor decoding models emphasized lower frequencies whereas slowness models emphasized higher frequencies.
(A) Average tremor decoding and slowness model coefficients for all subthalamic nucleus (STN) microelectrode (left) (n=203 microelectrode recordings, 27 subjects) and macroelectrode (right) recordings (n=176 macroelectrode recordings, 27 subjects). Solid lines indicate average weights, with positive/negative values reflecting a positive or negative relationship with the metric. Error bars indicate s.e.m. across subjects. Black lines (top) represented contiguous spectral features that significantly differed between tremor and slowness decoding models. (B) Average model coefficients for effective motor control and tremor for all STN microelectrode (left) and macroelectrode (right) recordings. (C) Average model coefficients for effective motor control and slowness for all STN microelectrode (left) and macroelectrode (right) recordings.
Figure 4
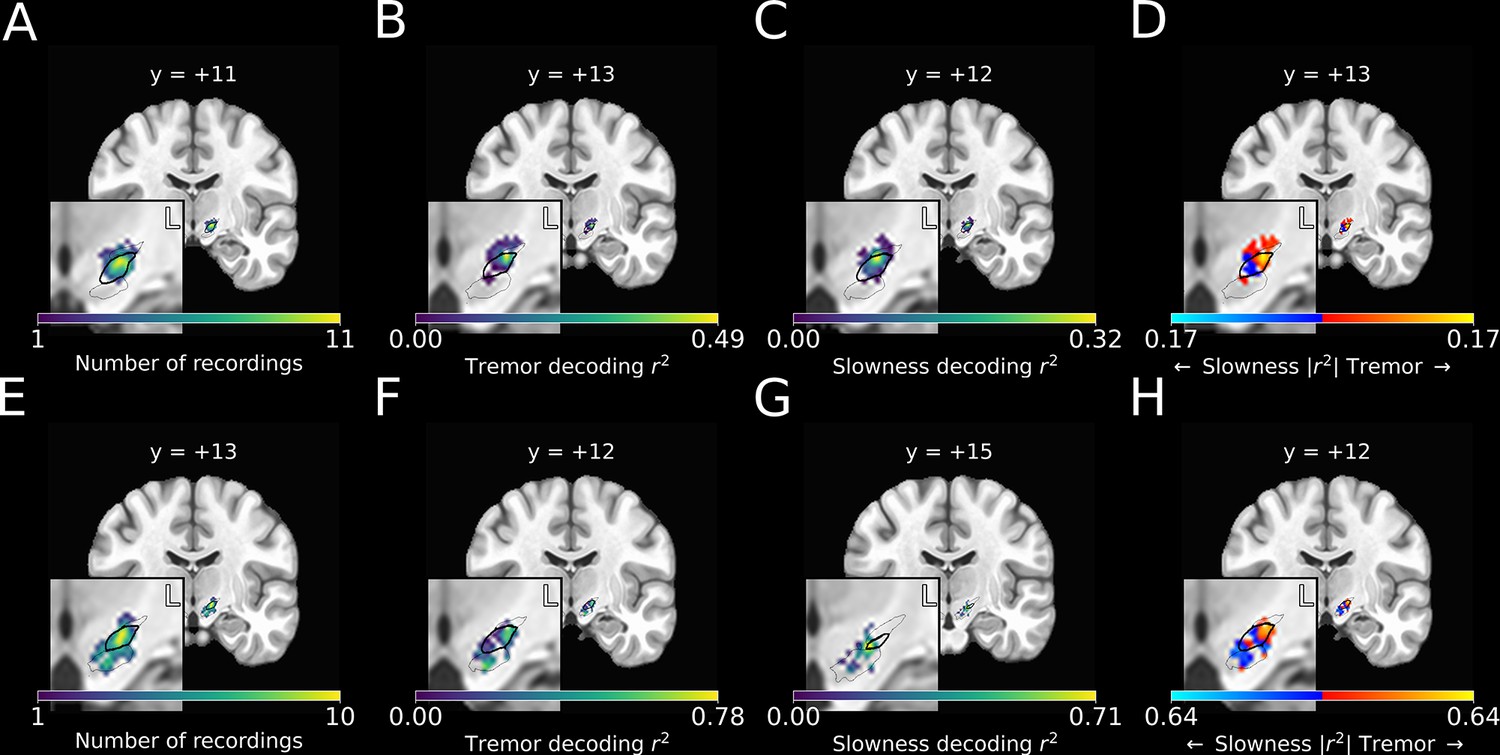
Optimal subthalamic tremor decoding sites were dorsolateral to optimal slowness decoding sites.
(A) Recording density of stationary microelectrode recordings across patients (n=182 microelectrode recording sites, 25 subjects) and task sessions overlaid on an MNI reference volume (approximate outline of the subthalamic nucleus [STN] in bolded black, zona incerta outlined above, substantia nigra outlined below). L: left. y-value corresponds to coronal slice in MNI space. (B) Tremor decoding model r2-values for stationary microelectrode recordings. (C) Slowness decoding model r2-values for stationary microelectrode recordings. (D) Difference in tremor vs. slowness decoding r2-values for stationary microelectrode recordings. Warmer colors indicate voxels where tremor decoding was superior, whereas cooler colors indicate where slowness decoding was superior. (E) Recording density of moving microelectrode recordings across all patients and task sessions overlaid on an MNI reference volume. (F) Tremor decoding model r2-values for high-density STN survey recordings. (G) Slowness decoding model r2-values for high-density STN survey recordings. (H) Difference in tremor vs. slowness decoding r2-values for high-density STN survey recordings. r2-Values depicted here are site-specific r2-values generated from the whole-STN model applied to individual depth recordings. Warmer colors indicate voxels where tremor decoding was superior, whereas cooler colors indicate where slowness decoding was superior.
Figure 5
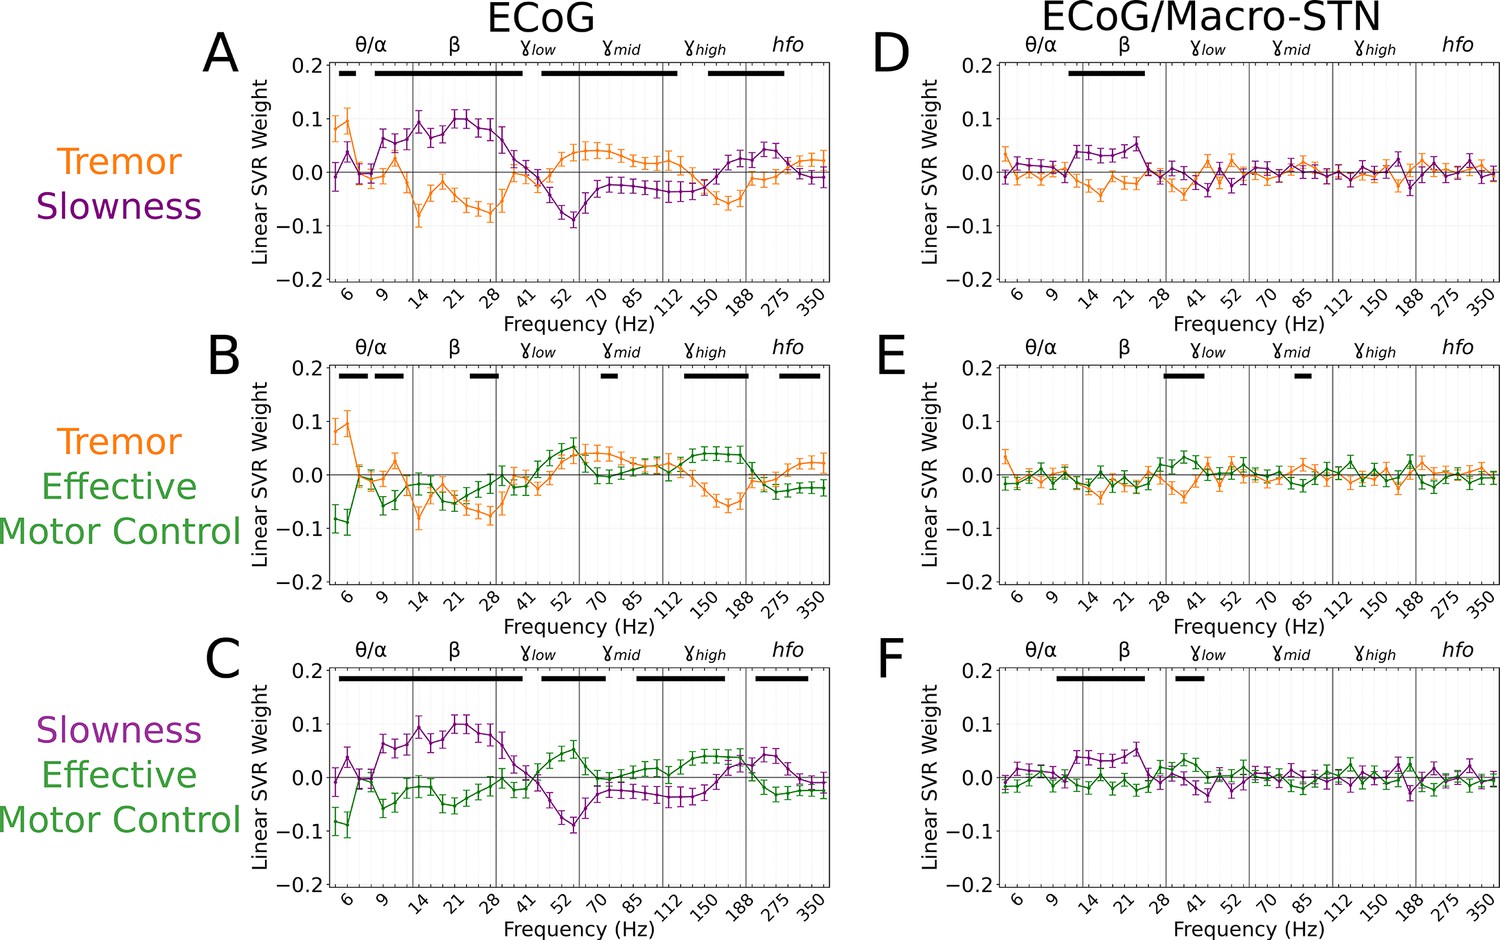
Cortical tremor and slowness decoding models exhibited opposing weights for multiple frequency bands, and co-expressed specific features with subthalamic recordings.
(A) Average cortical tremor and slowness decoding model coefficients for every recording along sensorimotor cortex (n=85 electrocorticography [ECoG] recordings, 10 subjects). Colored lines indicate average weights, with positive/negative values reflecting a positive or negative relationship with the metric. Error bars indicate s.e.m. across subjects. Black lines (top) represented contiguous spectral features that significantly differed between tremor and slowness decoding models. (B) Average model coefficients for effective motor control and tremor. (C) Average model coefficients for effective motor control and slowness. (D) Average subthalamic nucleus [STN]-cortical coherence tremor and slowness decoding model coefficients for every pairwise recording along sensorimotor cortex and macro contacts within the STN (n=85 ECoG recordings, 10 subjects). (E) Average coherence model for effective motor control and tremor. (F) Average model coefficients for effective motor control and slowness.
Figure 6
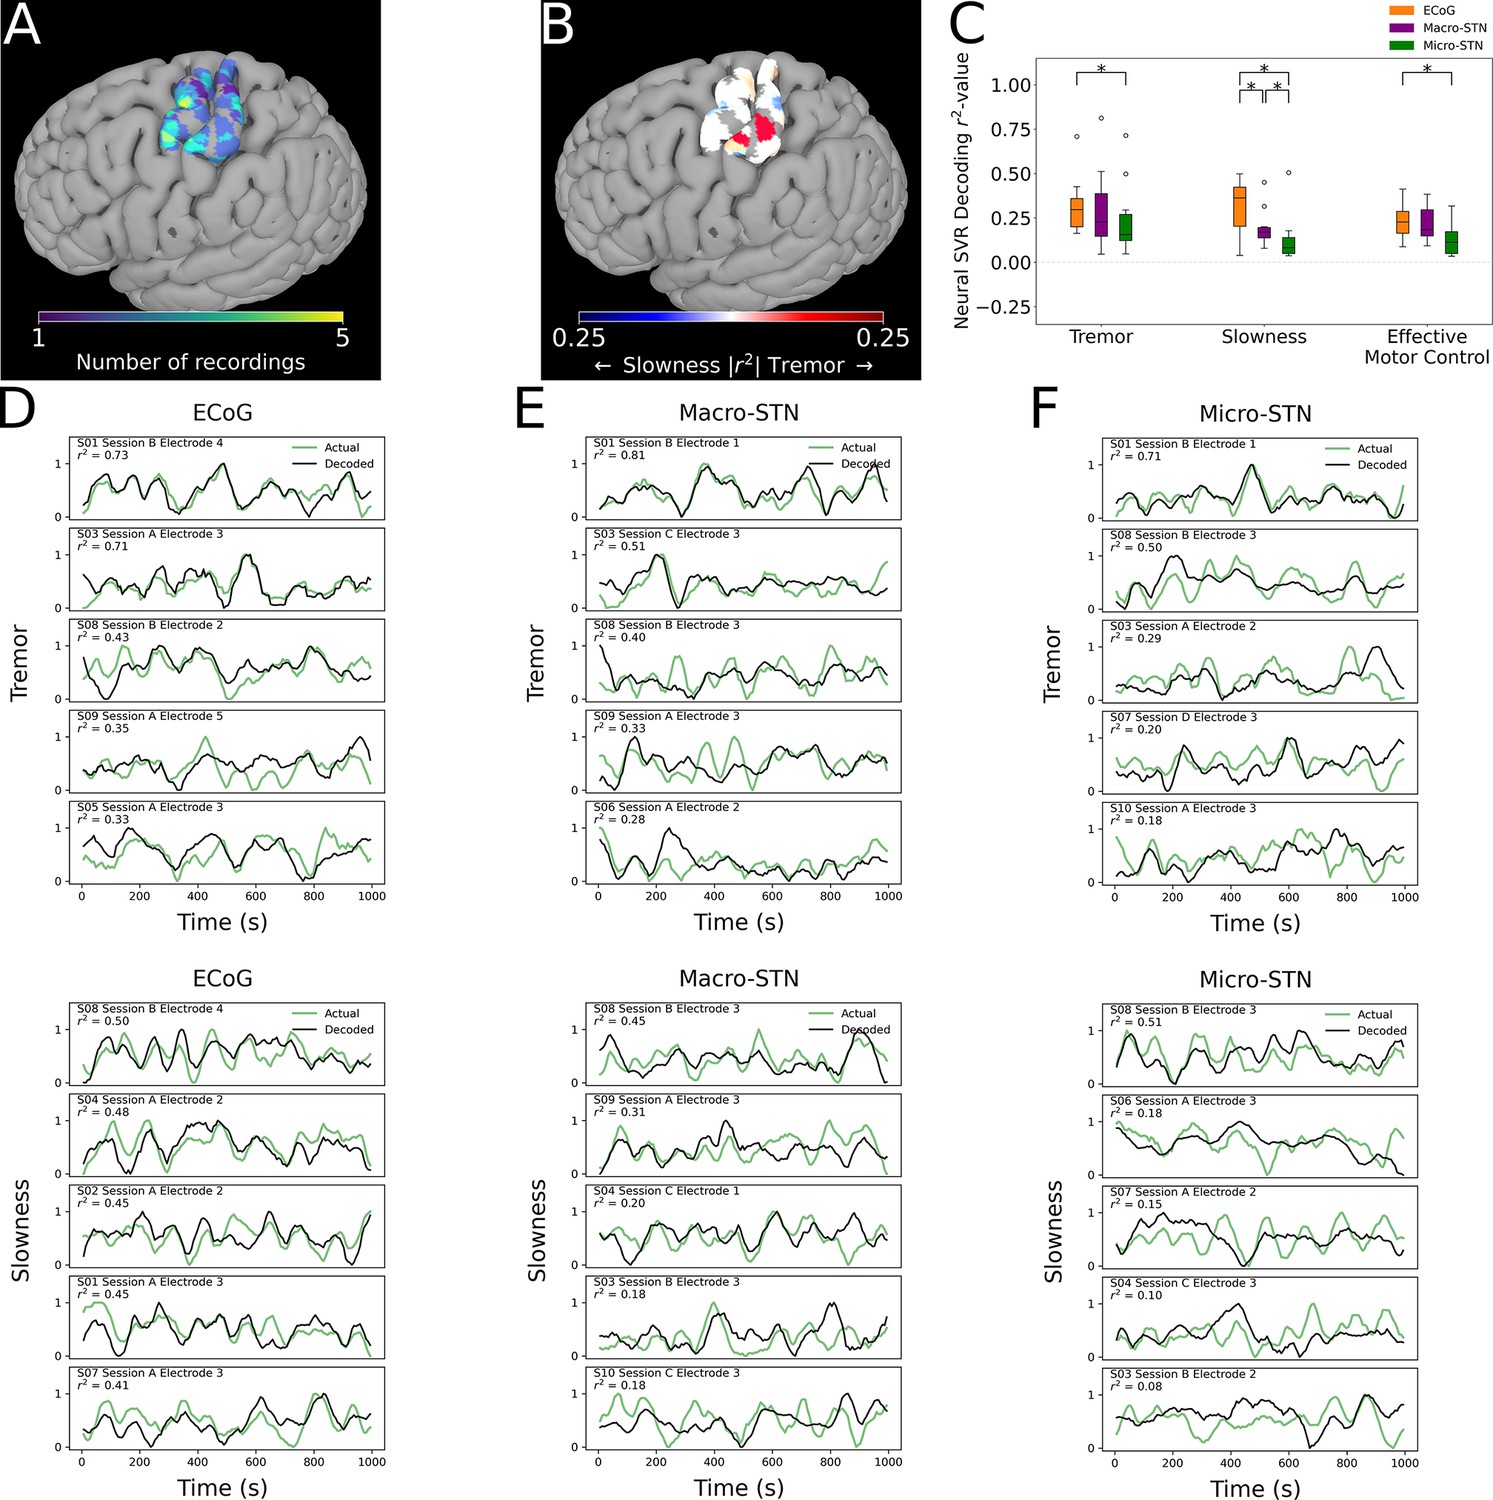
Cortical tremor and slowness decoding models were distributed throughout cortex, and generally were superior to subthalamic nucleus (STN) decoding models.
(A) Recording density of electrocorticography (ECoG) contacts (n=31 ECoG sites, 10 subjects) on an MNI reference surface. (B) Difference in tremor vs. slowness decoding r2-values for all cortical recordings. Warmer colors indicate surface vertices where tremor decoding was superior, whereas cooler colors indicate where slowness decoding was superior. (C) Decoding performance across metrics and recording types (n=85 ECoG recordings, 81 macroelectrode recordings, 81 microelectrode recordings, 10 subjects). Box represents interquartile range (25th–75th percentile), while whiskers indicate 5th–95th percentile of data range. Brackets indicate significant (*, p<0.05 in linear mixed model comparisons) differences in metric decoding r2-values. (D) Examples of tremor (top) and slowness (bottom) decoding for top-performing ECoG contacts. Each row within the panel represents a different subject. (E) Examples of tremor (top) and slowness (bottom) decoding for top-performing macroelectrodes. (F) Examples of tremor (top) and slowness (bottom) decoding for top-performing microelectrodes.
Additional files
Download links
A two-part list of links to download the article, or parts of the article, in various formats.
Downloads (link to download the article as PDF)
Open citations (links to open the citations from this article in various online reference manager services)
Cite this article (links to download the citations from this article in formats compatible with various reference manager tools)
Concurrent decoding of distinct neurophysiological fingerprints of tremor and bradykinesia in Parkinson’s disease
eLife 12:e84135.
https://doi.org/10.7554/eLife.84135


