Caveolae and Bin1 form ring-shaped platforms for T-tubule initiation
- Institut de Myologie, Sorbonne Université, INSERM, France
- Department of Physiology, Faculty of Medicine Pitié-Salpêtrière, Sorbonne Université, France
- Neuromuscular Morphology Unit, Institut de Myologie, Pitié-Salpêtrière Hospital, Sorbonne Université, France
- Sorbonne Université, CNRS, Institut de Biologie Paris-Seine (IBPS), Service de Microscopie Électronique (IBPS-SME), France
- Université Grenoble Alpes, INSERM, U1216, Grenoble Institut des Neurosciences, France
- Department of Neurology, National Reference Center for 'Rare Peripheral Neuropathies', University Hospital, France
- Institut de Recherche en Infectiologie de Montpellier, CNRS UMR 9004, Université de Montpellier, France
Figures
Figure 1 with 3 supplements
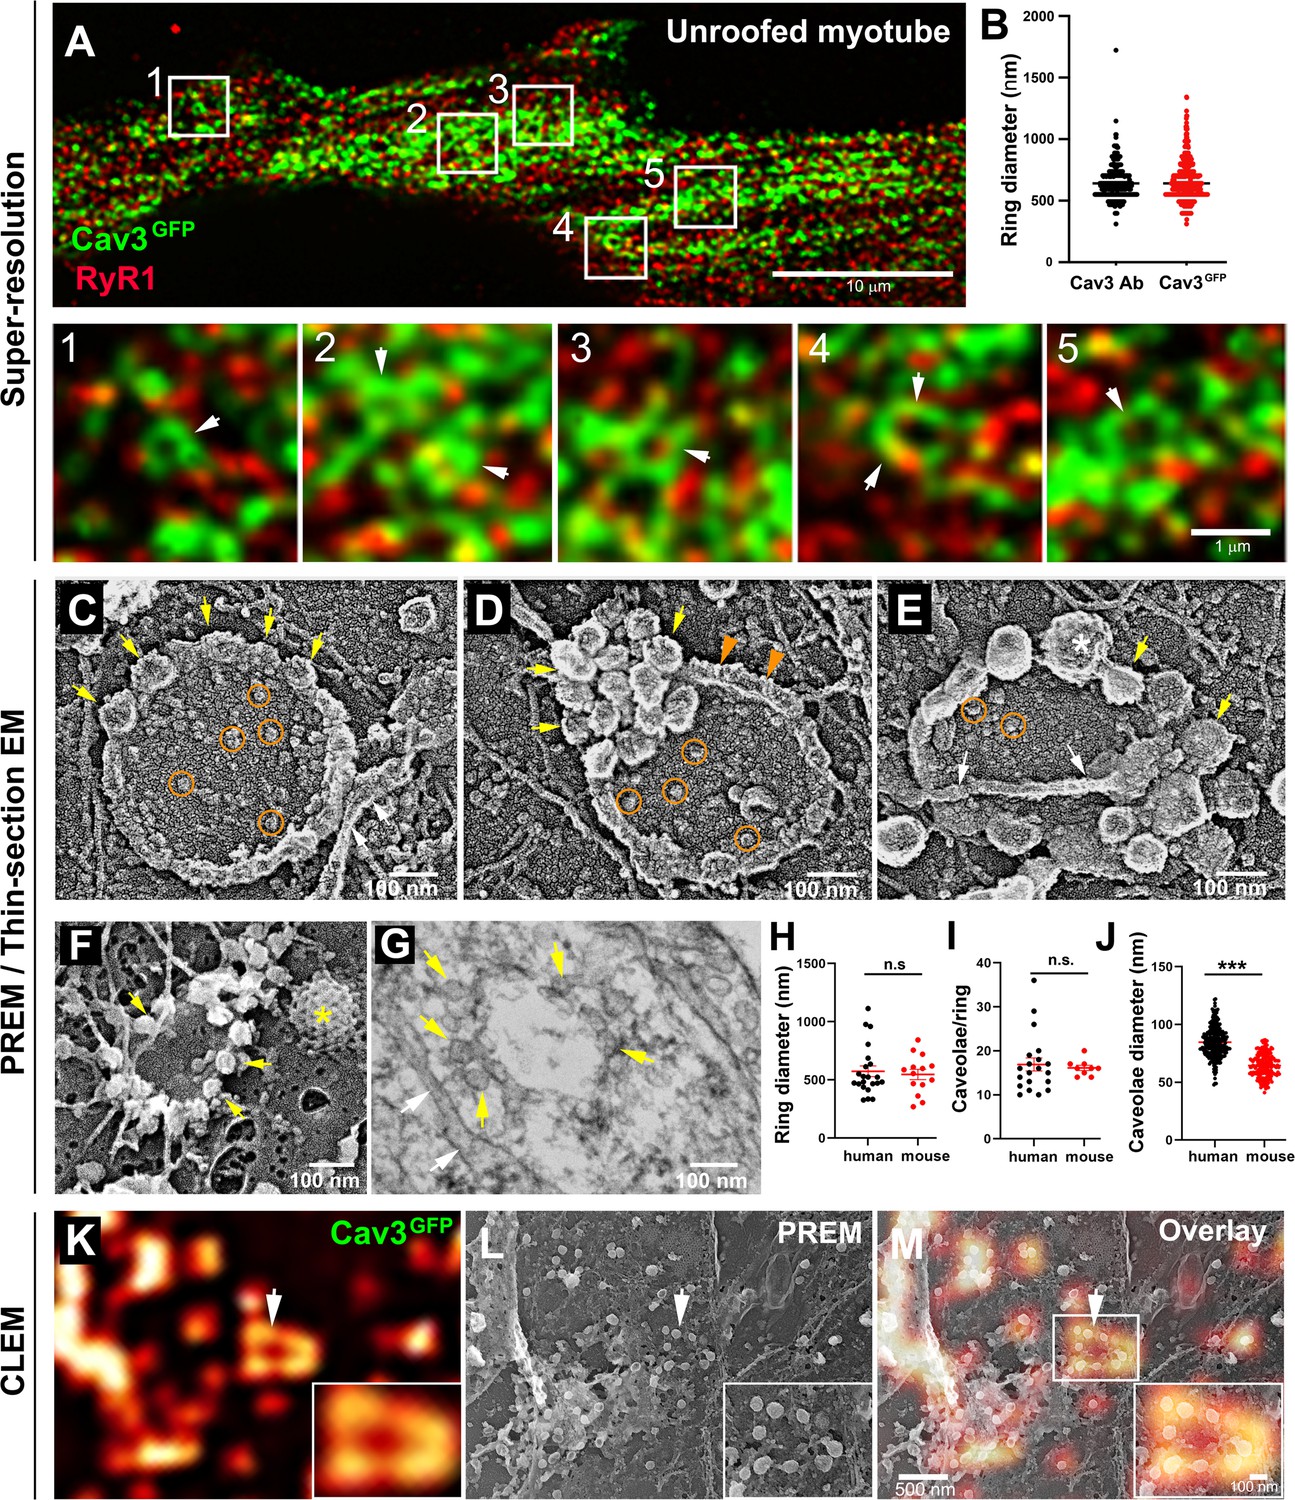
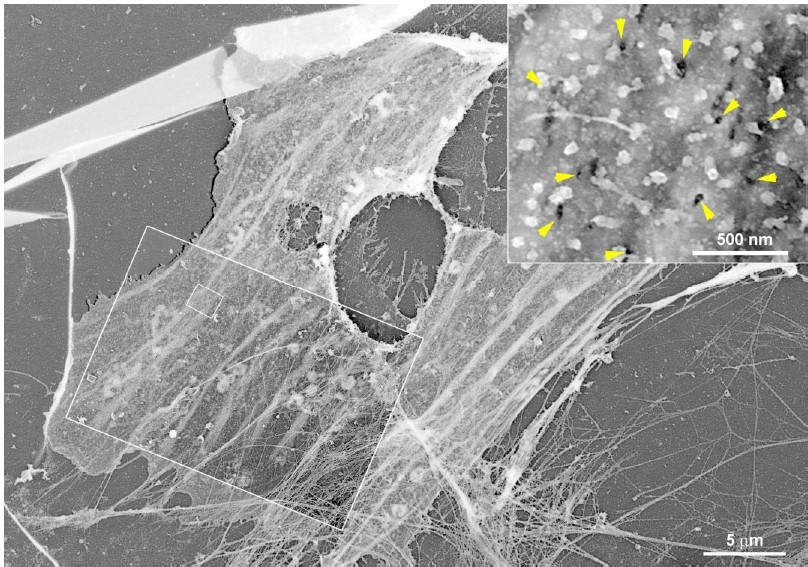
Cav3-positive caveolae form nanoscale rings in differentiated myotubes.
(A) Super-resolution images of a human myotube expressing Cav3GFP and labelled with antibodies against RyR1 (red). (B) Quantification of ring diameter from super-resolution images of differentiated myotubes either expressing Cav3GFP or labelled with antibodies against Cav3 (Cav3Ab, n=21 myotubes from three independent experiments; Cav3GFP, n=14 myotubes from three independent experiments; p=0.081). (C–E) Gallery of PREM images of rings in unroofed human myotubes. Yellow arrows indicate individual caveolae found on caveolae rings, white arrows denote cortical ER/SR cisternae and orange circles denote protein particles present inside the ring. (F) High magnification view of a ring formed by groups of caveolae in unroofed mouse primary myotubes. Yellow arrows denote caveolae. The yellow asterisk indicates a clathrin-coated pit. (G) High-magnification view of a ring formed by caveolae in unroofed mouse primary myotubes observed on thin-sections. Yellow arrows indicate groups of caveolae with a circular organization and white arrows denote cortical ER/SR. (H) Quantification of ring diameters from human and mouse myotubes on PREM images (human, n=22 images from four independent experiments; mouse, n=14 images from five independent experiments; p=0.67). (I) Quantification of the number of caveolae composing a ring from differentiated myotubes (human, n=20; mouse, n=9; p=0.63). (J) Quantification of the average caveolae diameter from differentiated mouse or human myotubes (human, 439 caveolae from n=15 images; mouse, 187 caveolae from n=12 images; p<0.0001). Quantification was performed from at least three independent experiments. (K–M) CLEM images combining Cav3GFP super-resolution microscopy with PREM of the same human myotube. (K) Cav3GFP fluorescence. (L) Same area imaged with TEM. (M) CLEM overlay. White arrow indicates a group of caveolae with a circular organization.
-
Figure 1—source data 1
Quantification of ring diameter in Cav3GFP and immunolabeled myotubes.
- https://cdn.elifesciences.org/articles/84139/elife-84139-fig1-data1-v2.zip
-
Figure 1—source data 2
Quantification of ring diameter from human and mouse myotubes on PREM.
- https://cdn.elifesciences.org/articles/84139/elife-84139-fig1-data2-v2.zip
-
Figure 1—source data 3
Quantification of the number of caveolae per ring.
- https://cdn.elifesciences.org/articles/84139/elife-84139-fig1-data3-v2.zip
-
Figure 1—source data 4
Quantification of the average caveolae diameter.
- https://cdn.elifesciences.org/articles/84139/elife-84139-fig1-data4-v2.zip
Figure 1—figure supplement 1
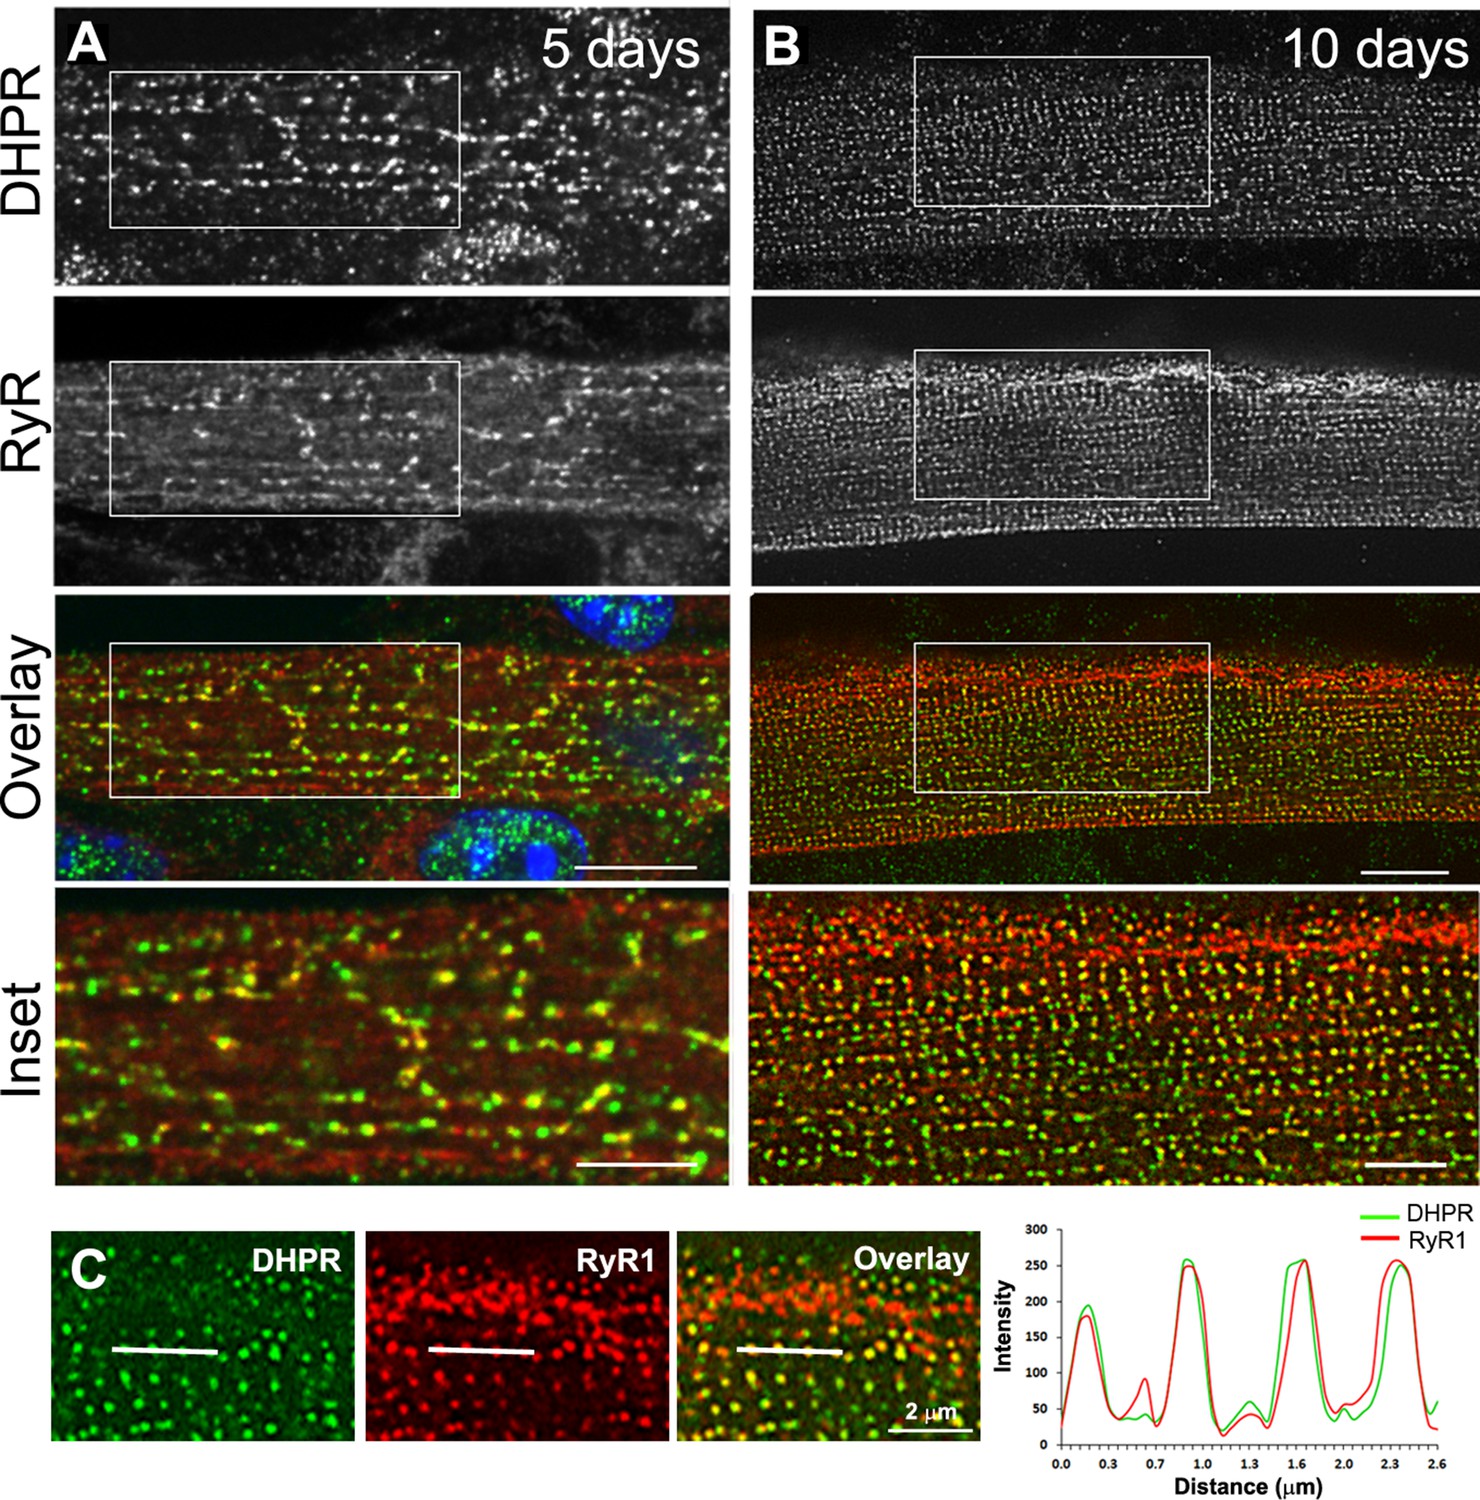
Triad markers are organized longitudinally and then transversally during in vitro differentiation of myotubes into myofibers.
(A) Immunofluorescent DHPR (green) and Ryanodine receptor (RyR1) (red) labeling in primary mouse myotubes differentiated for 5 days. Labeling shows clusters of RyR1 and DHPR that appear longitudinal. (B) Immunofluorescent labeling of DHPR (green) and RyR1 (red) in murine primary myotubes extensively differentiated for 10 days appears as double rows of dots. Scale bar: 10 µm and 5 µm for insets. (C) Line scan of indicated regions in the left panel showing average intensity for DHPR (green) and RyR1 (red) labeling in primary mouse myotubes differentiated for 10 days.
Figure 1—figure supplement 2
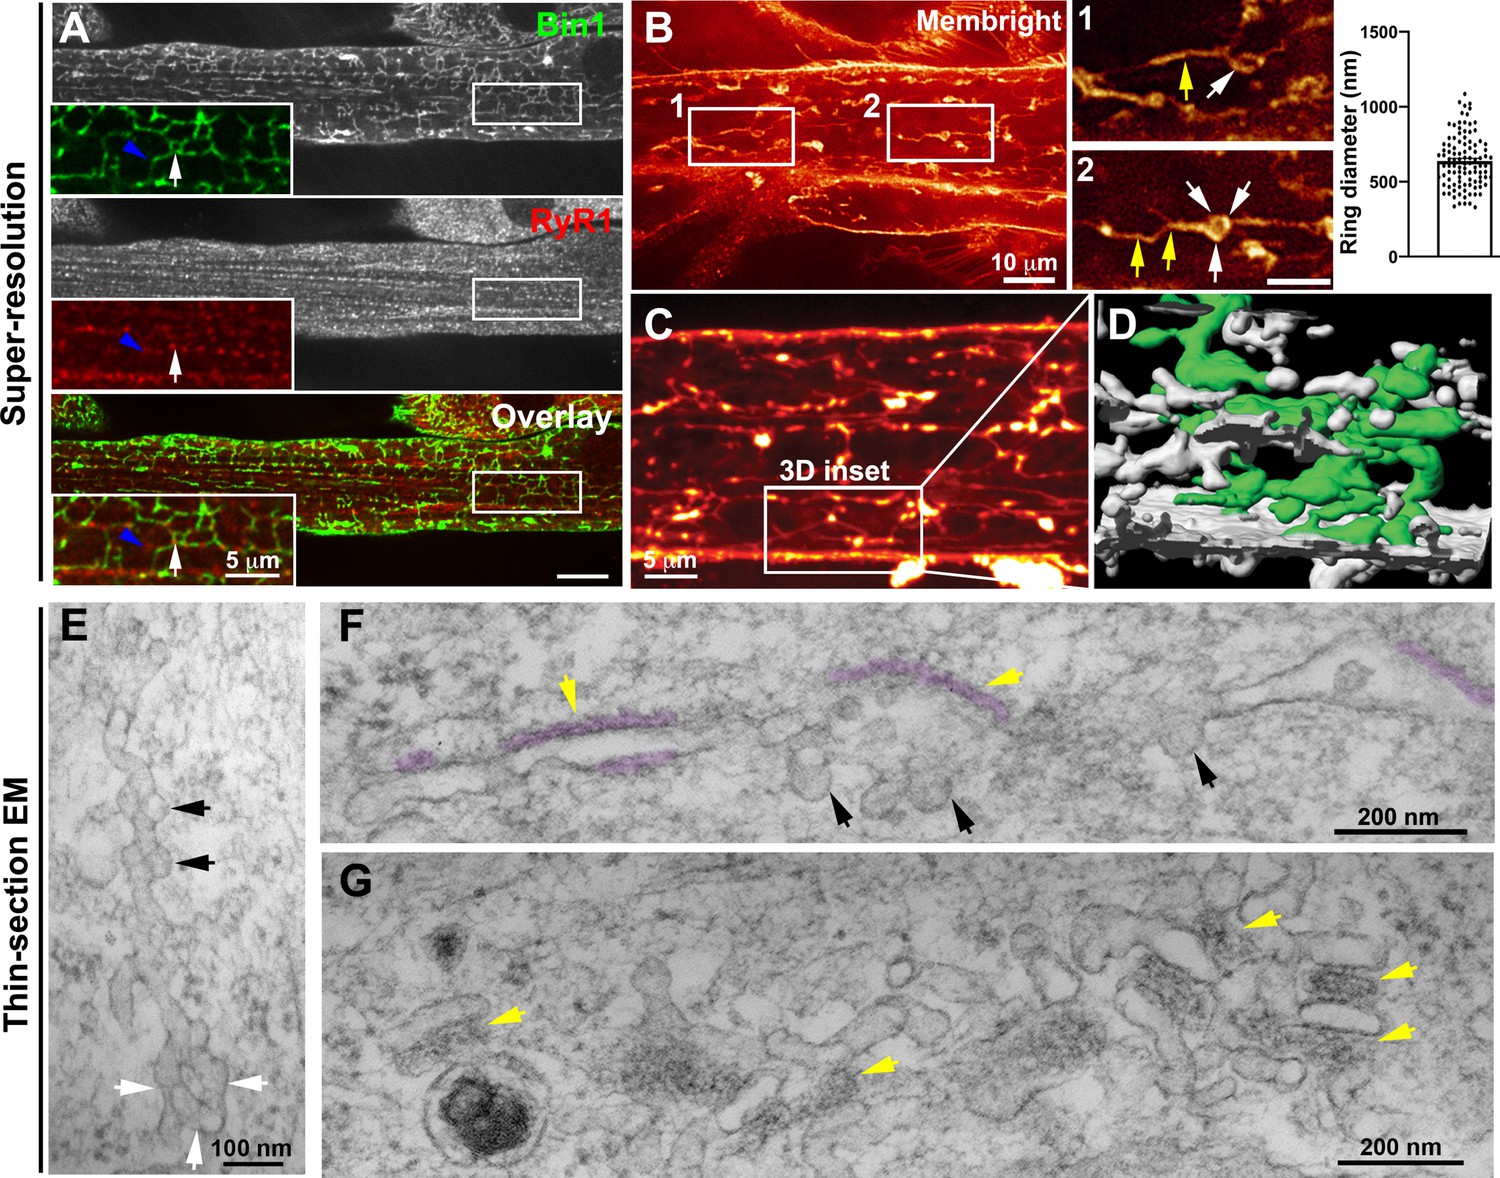
Nascent T-tubules form ring-like structures in myotubes.
(A) Bin1 antibody labels a tubular network extending from the plasma membrane forming contacts with RyR1-positive fluorescent dots. Blue arrowheads and white arrows denote tubular and circular Bin1 structures respectively. (B) T-tubule labeling with MemBright lipid probe using short (10 min) pulses on live myotubes. Tubules emanate transversely from the sarcolemma and are organized longitudinally along the length of the myotube. Note the presence of ring-like structures (white arrows) in continuity with the tubular structures (yellow arrows). Quantification of ring diameter is shown on the right panel. The average ring labeled by MemBright was 667±286 nm in diameter. (C–D) 3D reconstruction of the myotube region in (C) labeled with the MemBright lipid probe. One of the tubules is colored green from the plasma membrane for better visualization. (E–G) High-magnification views of nascent tubules observed by thin-section EM. (E) Characteristic pearled appearance with presence of 60–70 nm bumps similar to caveolae protruding from the tubule and denoted by black arrows. White arrows denote the ring at the base of the tubule. (F) and (G) SR/T-tubule junctions are denoted by yellow arrows and pseudo-colored purple in F. The tubules can form close junctions with SR cisternae recognizable by their characteristic electron density (pseudocolored in purple) (Franzini-Armstrong, 2018; Lainé et al., 2018) only in regions of the tube that do not contain caveolae.
-
Figure 1—figure supplement 2—source data 1
Quantification of ring diameter labeled by MemBright.
- https://cdn.elifesciences.org/articles/84139/elife-84139-fig1-figsupp2-data1-v2.zip
Figure 1—video 1
T-tubule staining on live myotubes corresponding to Figure 1—figure supplement 2.
T-tubules from live primary mouse myotubes were stained with the MemBright lipid probe. Tubules emanate transversely from the sarcolemma and are mostly oriented longitudinally.
Figure 2 with 2 supplements
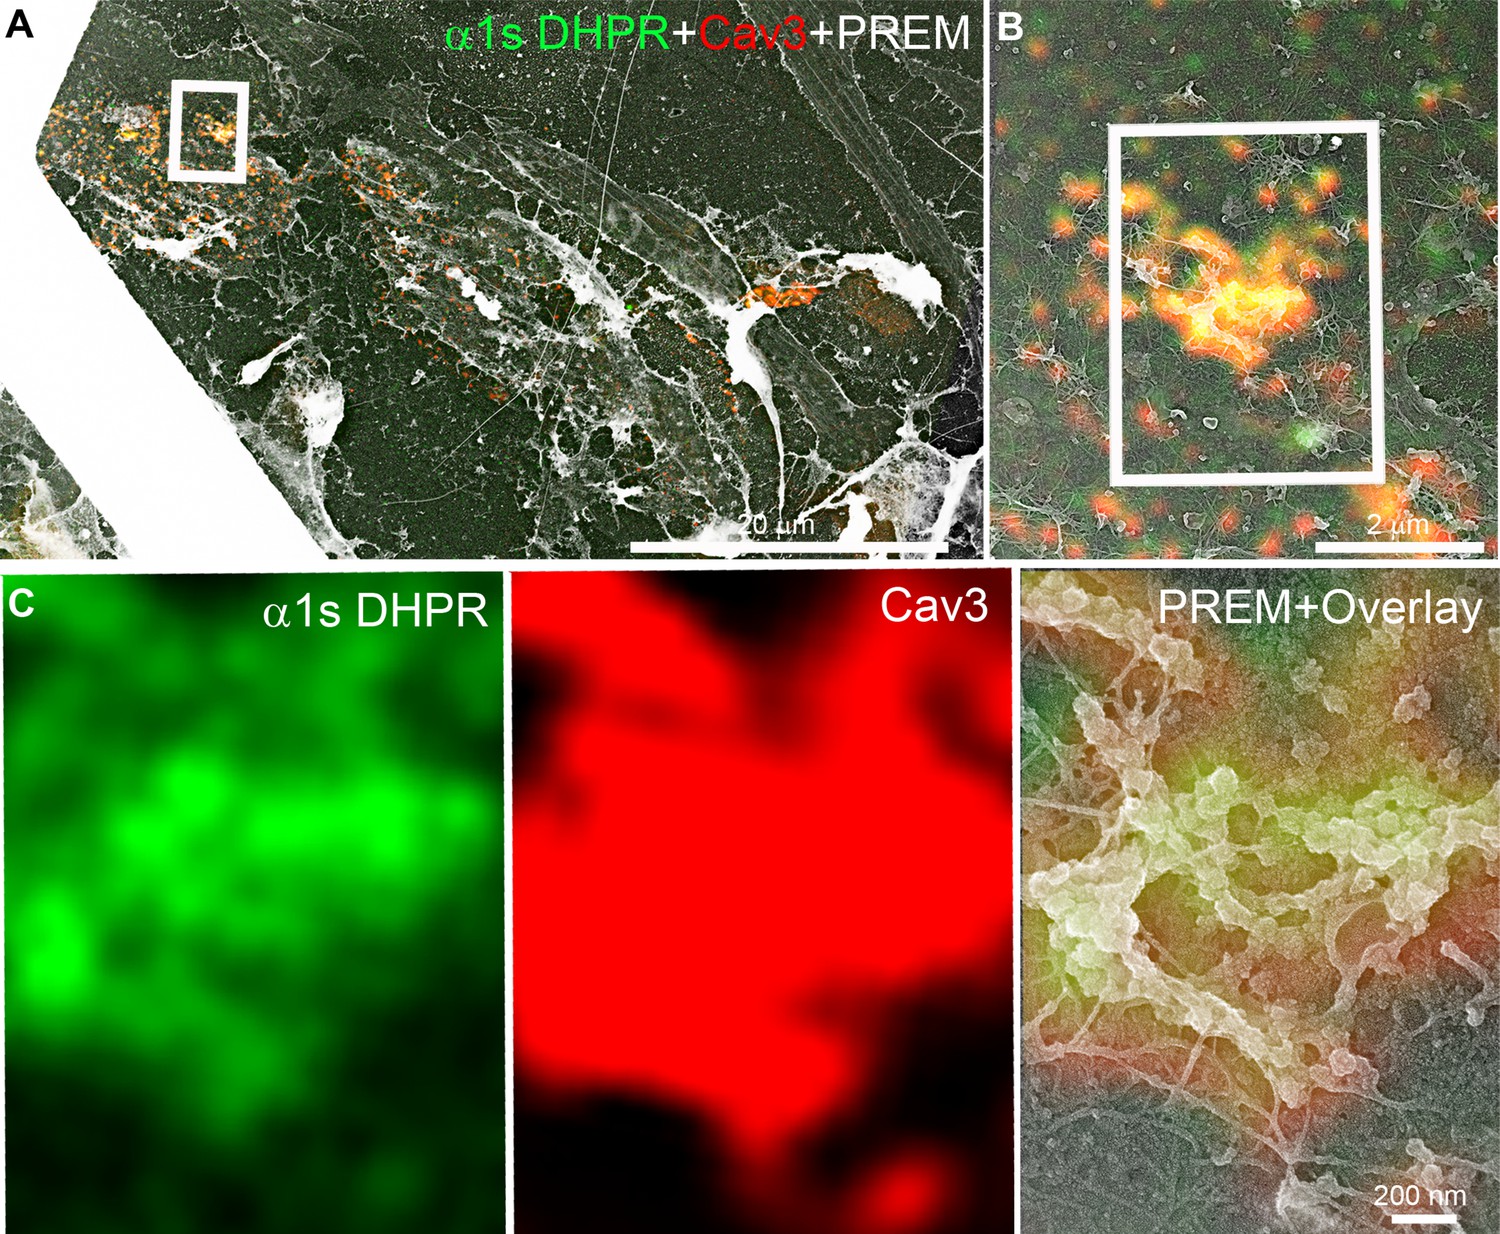
DHPR is enriched in Cav3 structures in contact with RyR1-positive SR cisternae.
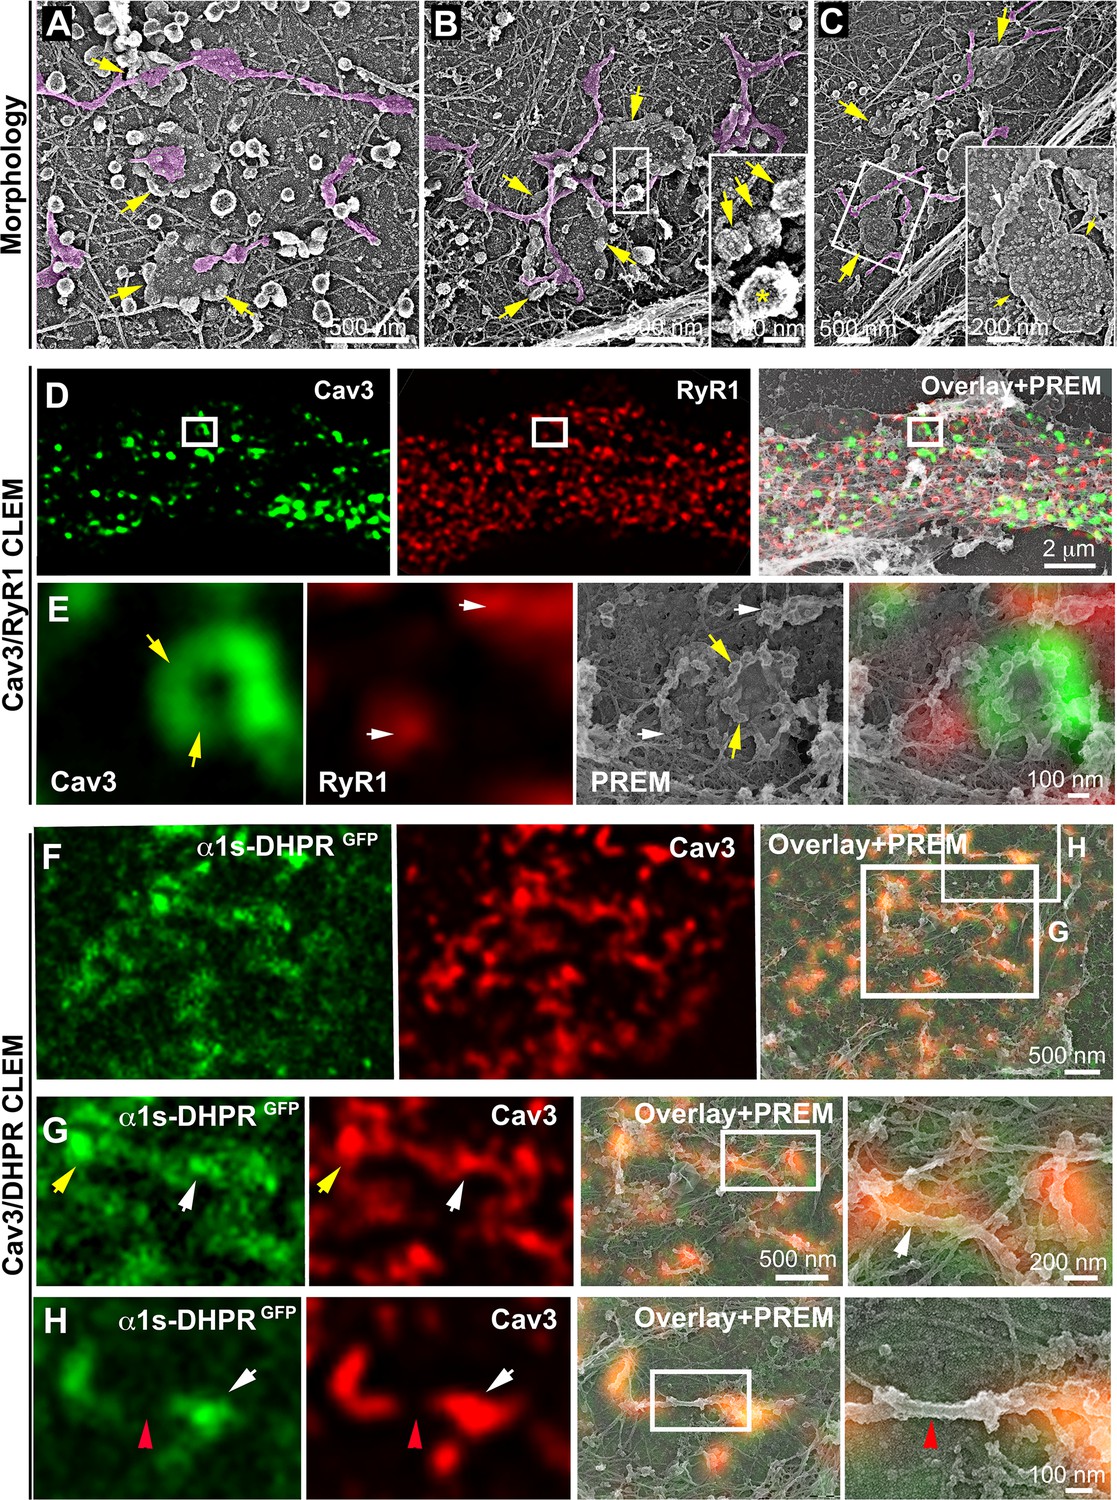
(A–C) EM images showing caveolae rings in contact with cortical endo/sarcoplasmic reticulum cisternae (pseudo-colored purple) on the cytosolic part of the adherent sarcolemma. Yellow arrows indicate caveolae rings. Caveolae rings are formed by caveolae still presenting their characteristic coat indicated by yellow arrows in B inset (yellow asterisk indicates a clathrin-coated pit). White arrows indicate endo/sarcoplasmic reticulum cisternae going over the caveolae ring. (D–E) Correlative microscopy of Cav3 (green) and RyR1 (red) labeling on myotubes. (E) Enlargement of the inset in (D). Yellow arrows indicate caveolae rings. White arrows indicate cortical endo/sarcoplasmic reticulum cisternae. (F–H) Correlative microscopy of the α1s-subunit of DHPR fused to GFP (green) and Cav3 (red) labeling on myotubes. Yellow arrows indicate a caveolae ring. White arrows indicate tubules where Cav3 and DHPR colocalize. Red arrowheads indicate a region of the tubule free of Cav3 and α1s labeling and lacking caveolar material at the ultrastructural level.
Figure 2—figure supplement 1
Additional CLEM of DHPR in caveolin-positive ring-like structures.
(A–C) Two-color CLEM analysis in unroofed primary mouse myotubes transduced with GFP-tagged α1s-subunit of the DHPR (green) and labeled with antibodies against Cav3 (red). (C) Higher magnification view of the inset in (B). DHPR and Cav3 labeling colocalize on circular structures and pearled tubes at the plasma membrane.
Figure 2—video 1
Correlative super-resolution/PREM for Cav3 and RyR1 corresponding to Figure 2D.
The unroofed myotube is shown with successive fluorescent microscopy images (Cav3 in green, RyR1 in red), low-magnification PREM image (grid appears white), super-resolution image and high-magnification PREM image of the inset. The high magnification PREM images were acquired with electron tomography by collecting images at different tilt angles up to ±25° relative to the plane of the sample with a 5° increment between each frame.
Figure 3 with 3 supplements
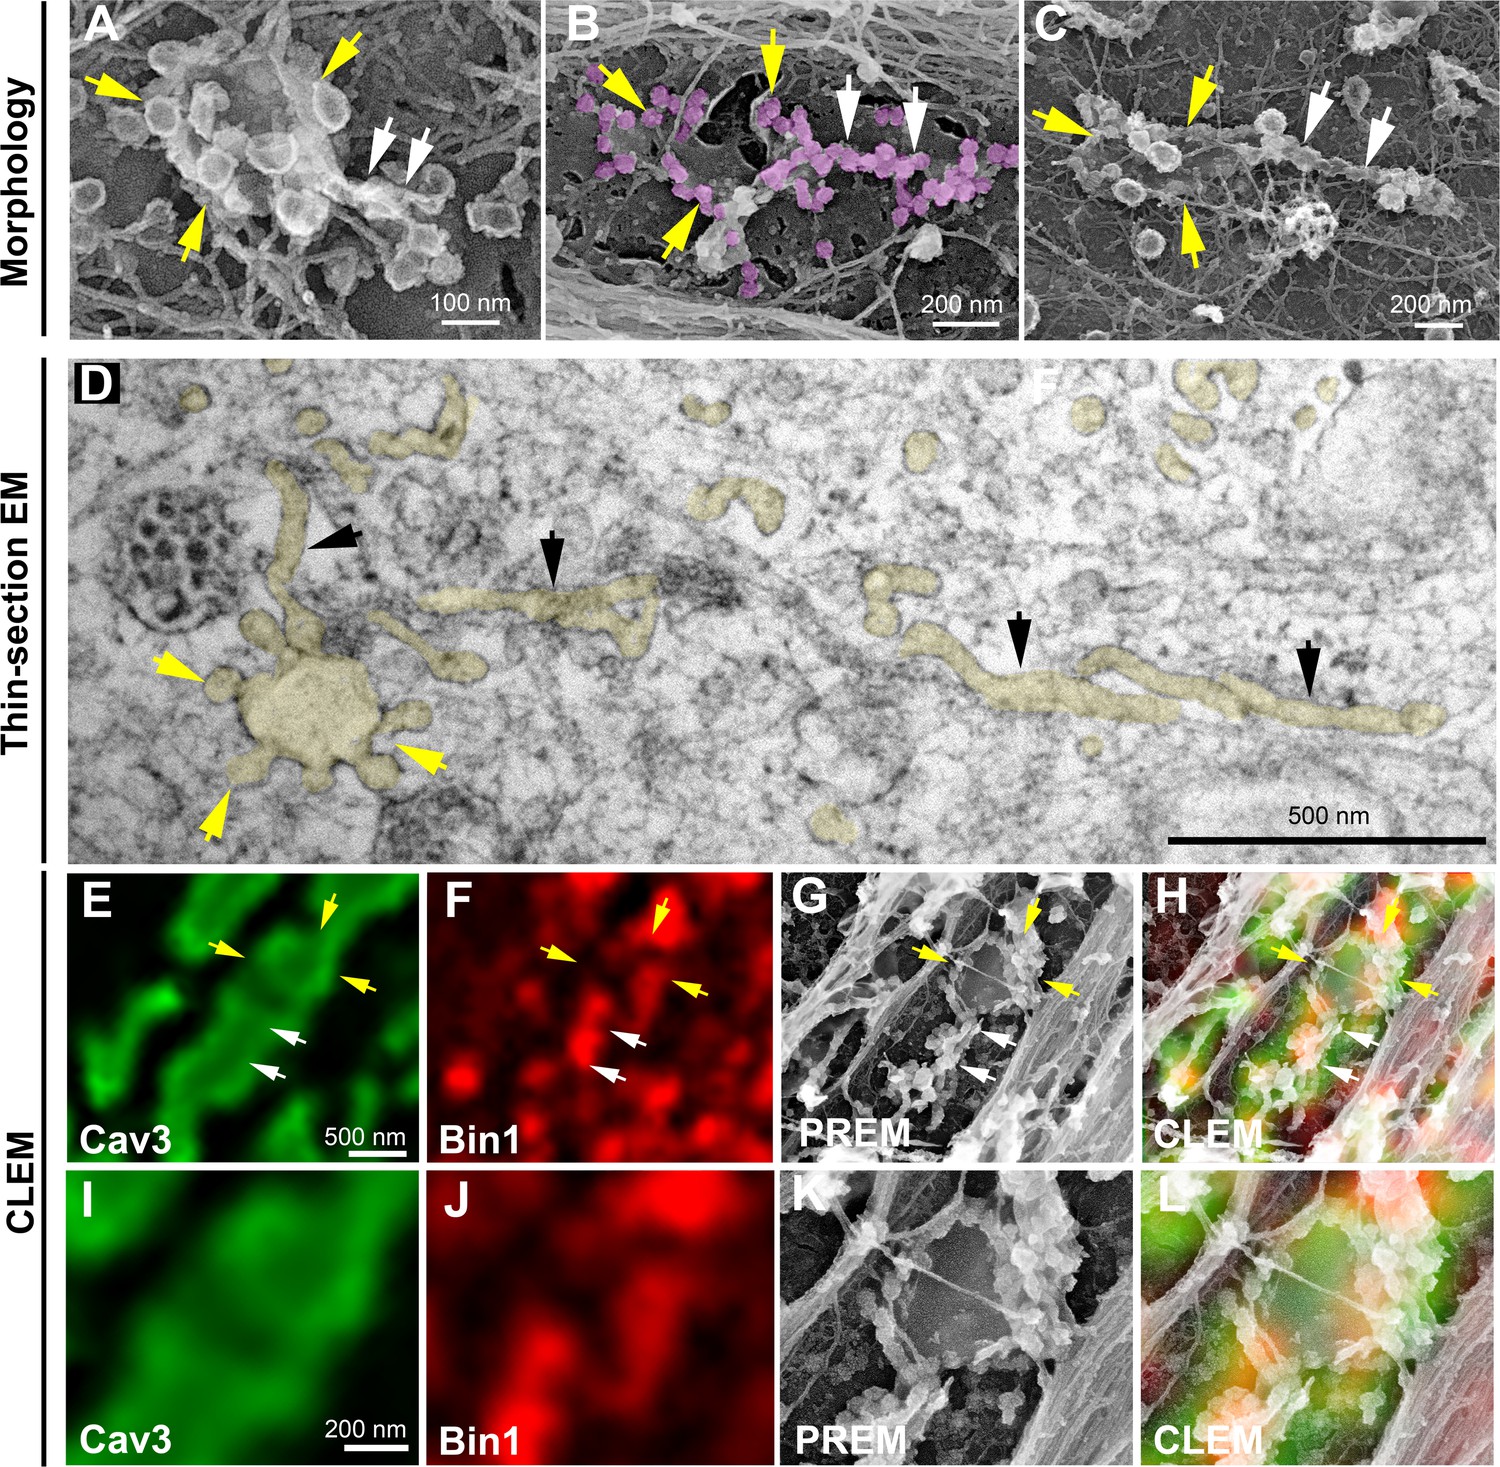
Caveolae rings extend into Bin1-positive tubules.
(A–C) High magnification PREM views of caveolae rings on unroofed myotubes from primary mouse cultures. In (B) caveolae are pseudo-colored in light purple. White arrows indicate beaded tubes emanating from structures formed by ring caveolae and yellow arrows indicate the caveolae ring. (D) High magnification view of several tubules (black arrows) protruding from a single caveolae ring (yellow arrows) observed on conventional thin-section EM. The caveolae ring and tubules are pseudo-colored pale yellow. (E–L) Correlative microscopy of Cav3 (green) and Bin1 (red) immunolabeling on an unroofed 9 day extensively differentiated murine myotube. In (E–H), white arrows indicate tubules emanating from Bin1 and Cav3 labeled rings and yellow arrows indicate the ring formed by caveolae. (I–L) Higher magnification CLEM view of the ring structure labeled with Cav3 (green) and Bin1 (red) antibodies.
Figure 3—figure supplement 1
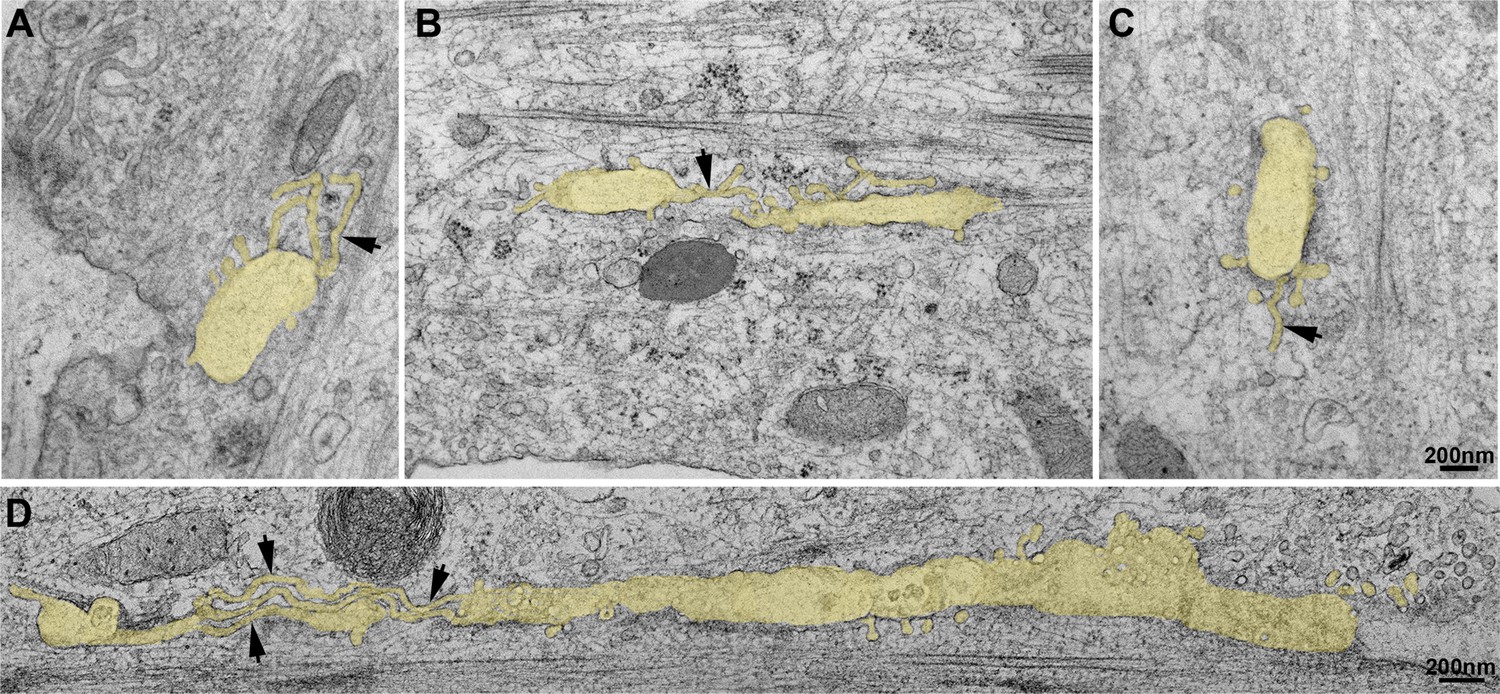
Thin-section EM analysis of extensively differentiated myotubes.
(A–D) Gallery of thin-section EM from the adherent surface of extensively differentiated mouse primary myotubes as in Figure 3D. The tubular structures emanating from the caveolae ring-like structures are pseudocolored in pale yellow. Tubules emanating from the circular structures measure 25 nm in diameter and are denoted with black arrows.
Figure 3—video 1
Correlative super-resolution/PREM of Cav3 and Bin1 corresponding to Figure 3E–L.
The unroofed myotube is shown with successive fluorescent microscopy images (Cav3 in green, Bin1 in red), low-magnification PREM image (grid appears white), super-resolution image and high-magnification PREM image of the inset. The high-magnification PREM images were acquired with electron tomography by collecting images at different tilt angles up to ±25° relative to the plane of the sample with 5° increments between each frame. The image corresponding to ±0° (no tilt) is superimposed with the super-resolution image.
Figure 3—video 2
Correlative super-resolution/PREM of Cav3 and Bin1 corresponding to Figure 3E-L.
The unroofed myotube is shown with successive fluorescent microscopy images (Cav3 in green, Bin1 in red), low-magnification PREM image (grid appears white), super-resolution image and high-magnification PREM image of the inset. The high magnification PREM images were acquired with electron tomography by collecting images at different tilt angles up to ±25° relative to the plane of the sample with 5° increments between each frame. The image corresponding to ±0° (no tilt) is superimposed with the super-resolution image.
Figure 4 with 4 supplements
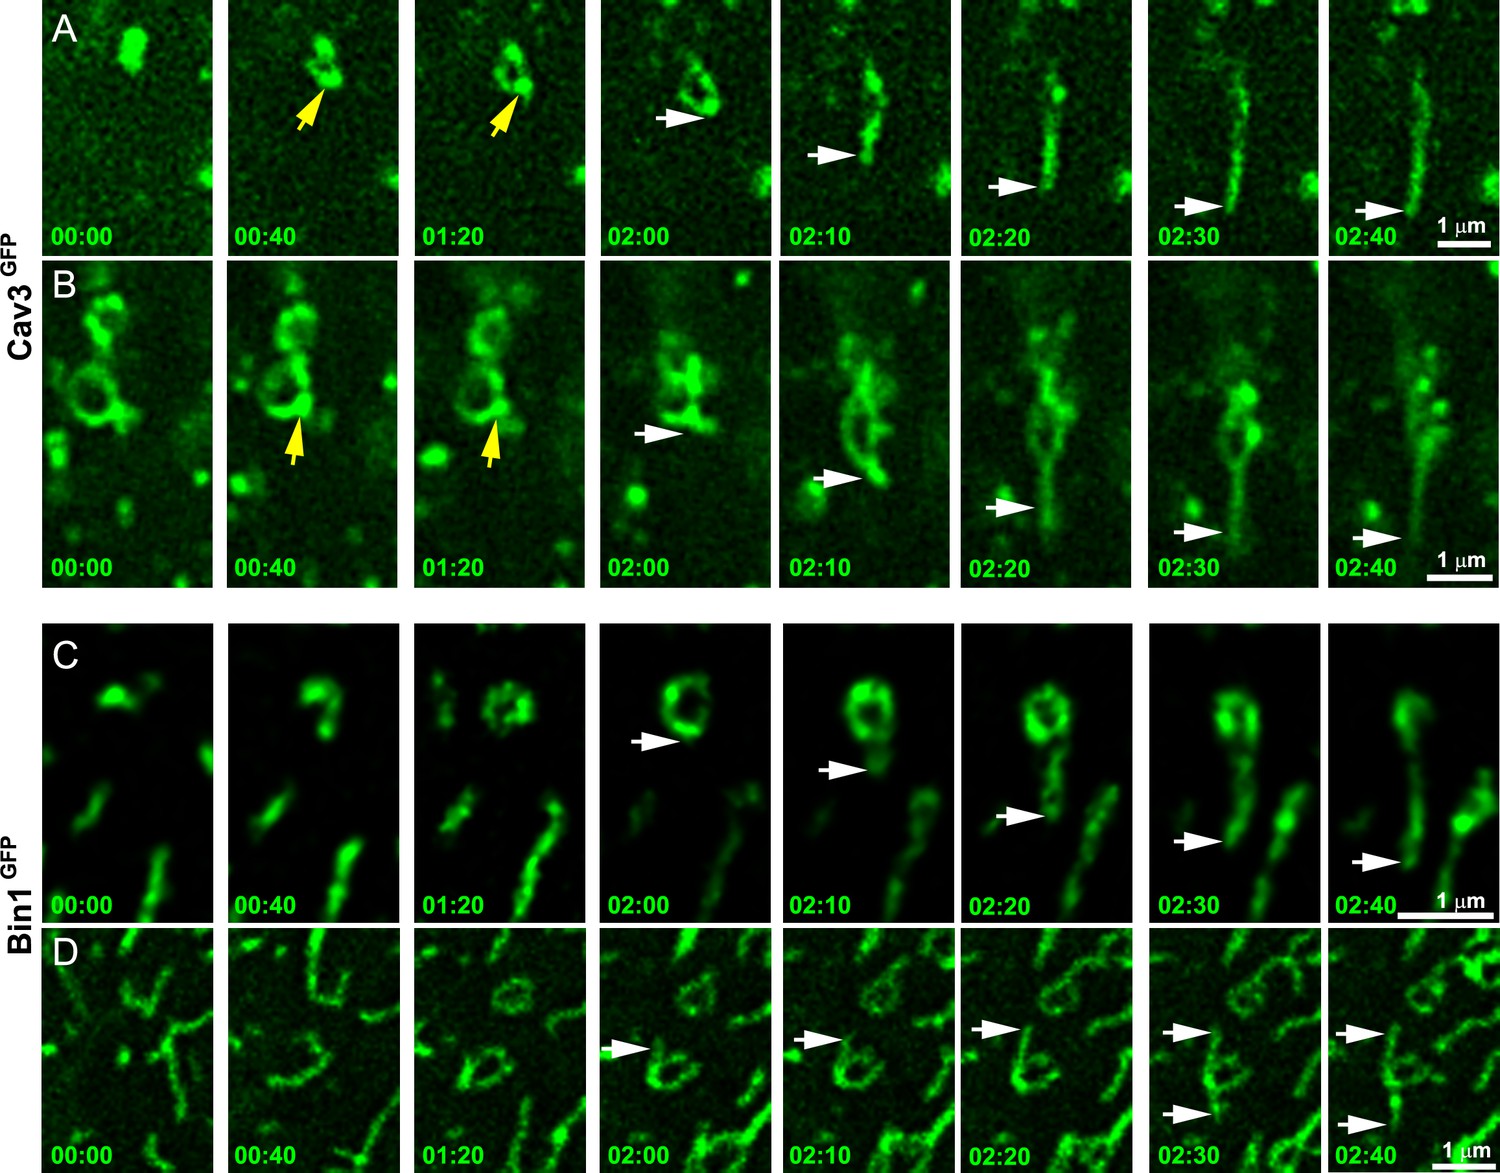
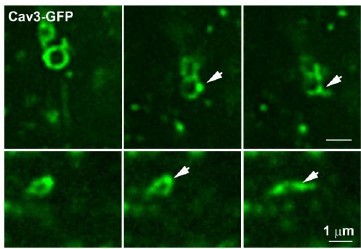
Time-lapse imaging of Cav3/Bin1 tubules extending from rings.
(A) Gallery of consecutive frames from two time-lapse sequences of Cav3GFP expressing human myotubes (green). The gallery shows four consecutive frames every 40 s followed by four consecutive frames every 10 s of a tubule emanating from a ring (see Figure 4—video 1 and Figure 4—video 2). Yellow arrows denote appearance of a Cav3 spot on the ring prior to tubulation. White arrows point to the edge of the tubule as it elongates away from the ring. (C–D) Gallery of consecutive frames from a time-lapse sequence of a Bin1GFP expressing human myotubes (green). The gallery shows a tubule emanating from a ring (see Figure 4—video 3 and Figure 4—video 4). Time is indicated for each frame as min:s.
Figure 4—video 1
Live imaging of Cav3GFP structures on the surface of human myotubes corresponding to Figure 4A and B.
Time-lapse shows a tubule emanating from a Cav3-positive ring acquired at 1 frame every 10 s using a spinning-disk microscope equipped with a SR module.
Figure 4—video 2
Live imaging of Cav3GFP structures on the surface of human myotubes corresponding to Figure 4A and B.
Time-lapse shows a tubule emanating from a Cav3-positive ring acquired at 1 frame every 10 seconds using a spinning-disk microscope equipped with a SR module.
Figure 4—video 3
Live imaging of Bin1GFP structures on the surface of human myotubes corresponding to Figure 4C and D.
Time-lapse shows show a tubule emanating from a Bin1-positive ring acquired at 1 frame every 10 s using a spinning-disk microscope equipped with a SR module.
Figure 4—video 4
Live imaging of Bin1GFP structures on the surface of human myotubes corresponding to Figure 4C and D.
Time-lapse shows a tubule emanating from a Bin1-positive ring acquired at 1 frame every 10 seconds using a spinning-disk microscope equipped with a SR module.
Figure 5 with 2 supplements
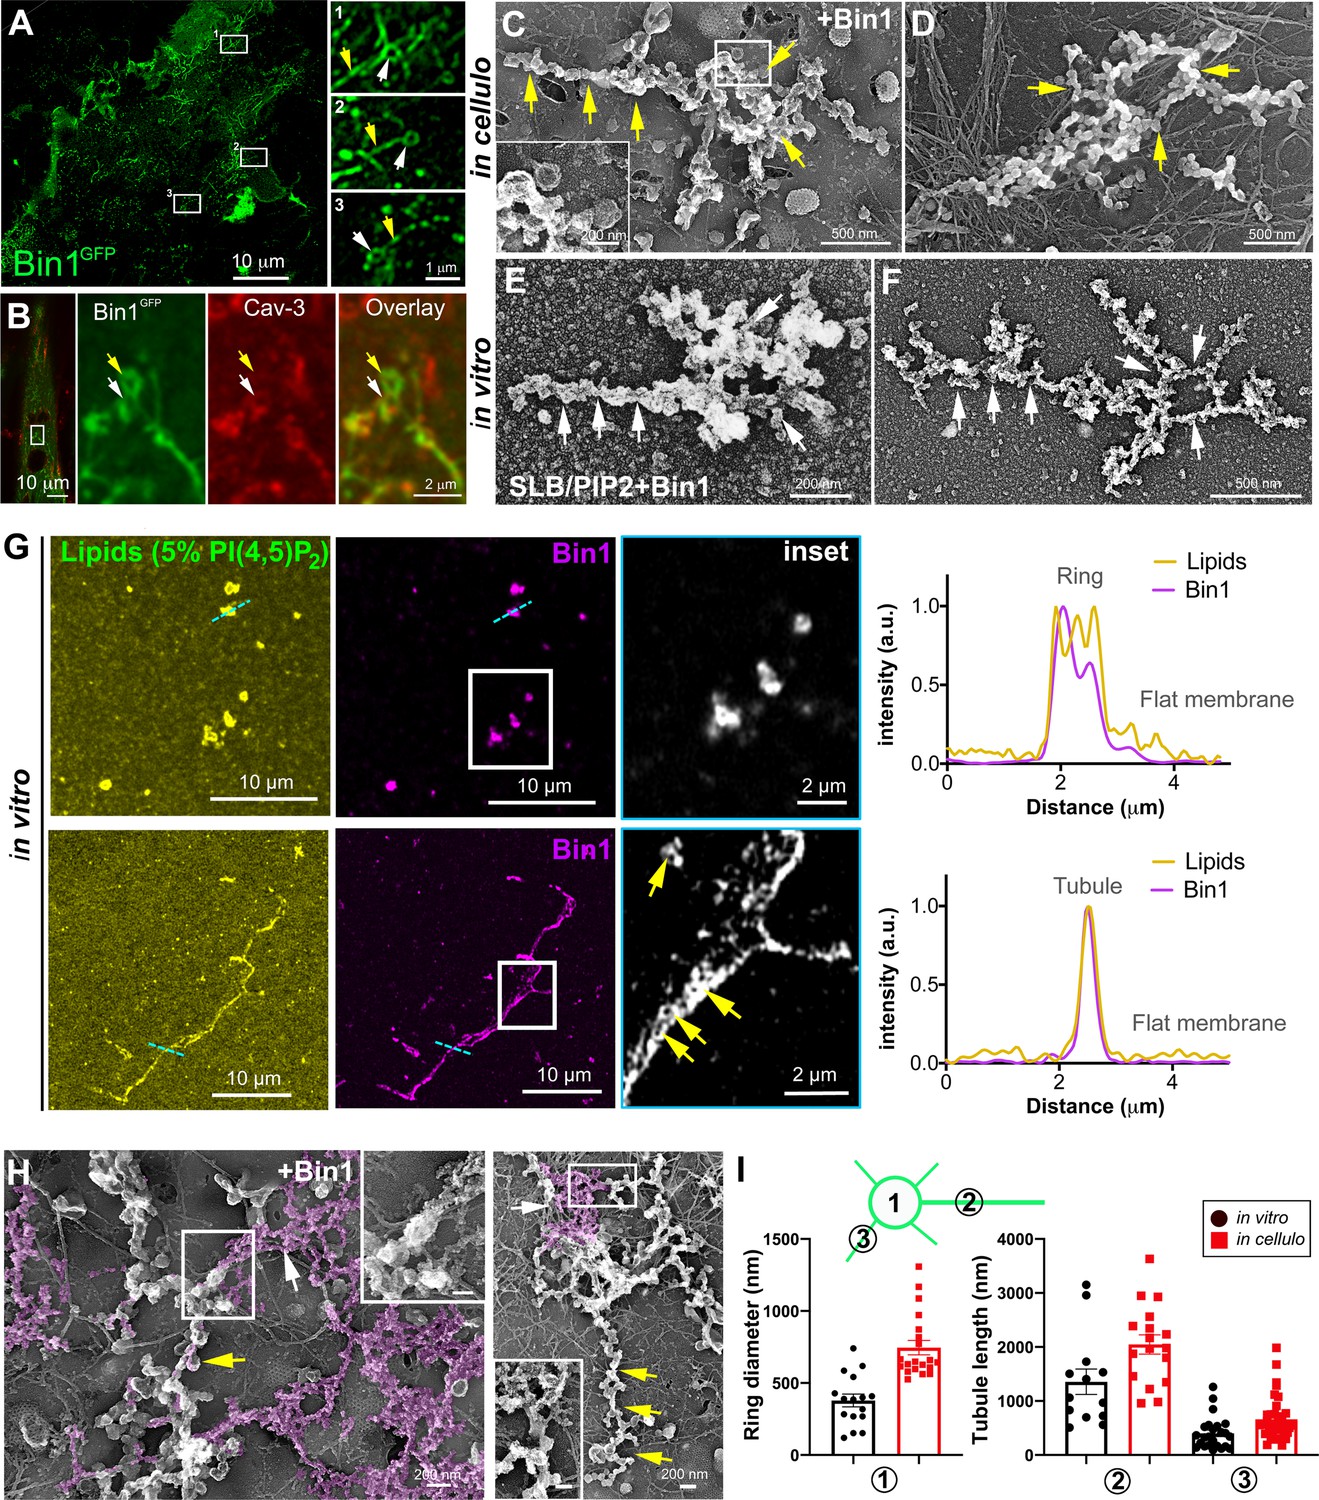
Bin1 forms rings and tubes in vitro and in cellulo.
(A) Super-resolution fluorescence microscopy image of an unroofed human myotube transduced with Bin1GFP (green). Insets numbered 1–3 show the circular organization (white arrowheads) of the structures formed by Bin1 and from which tubes emanate (yellow arrows). (B) Super-resolution microscopy image of Bin1+exon11GFP and Cav3 labeling in an intact cultured human myotube. White arrowheads show Cav3 co-localization with Bin1 on both the rings and at the base of the tubules while yellow arrowheads show rings only positive for Bin1. (C–D) PREM images of unroofed myotubes transduced with Bin1GFP. White arrows indicate the central ring-like structure and yellow arrows indicate formation of beaded tubes emanating from the central ring. (E–F) PREM images of artificial lipid bilayers incubated with recombinant full-length Bin1. (G) Representative airyscan images of supported lipid bilayers (SLBs) containing 5% mol PI4,5P2 and doped with 0.1% of fluorescent lipid dye (DHPE-Oregon green, yellow) and incubated with 1 µM of Bin1-Alexa647 (magenta). Insets show a magnification of Bin1 organization in ring-like structures and tubes (grey) from the corresponding image. Cross-section analysis along the blue dashed line in the related image highlights the intensity profile of Bin1 (magenta) and lipids (yellow) on the flat membrane. Bin1 ring-like organization is present in the membrane and tubular structures (yellow arrows). (H) PREM images of unroofed human myotubes transduced with an adenovirus expressing Bin1GFP. Yellow arrows show the formation of beaded tubular structures emanating from rings. A Bin1 scaffold similar to the one observed in vitro is pseudo-colored in purple and indicated with white arrows. (I) Cartoon of a central ring from which a central pearled tubule and numerous smaller tubules emerge radially. (1) Diameter of the rings (in vitro, 16 rings from n=13 images; in cellulo, 20 rings from n=18 images; p<0.0001). (2) Length of the longest tubule emanating from Bin1 assemblies (in vitro, 13 tubes from n=13 images; in cellulo, 17 tubes from n=17 images; p<0.05). (3) Length of the smaller tubules emanating from Bin1 assemblies (in vitro, 47 small tubes from n=13 images; in cellulo, 72 small tubes from n=18; p<0.05).
-
Figure 5—source data 1
Measurements of ring diameters and tube length in vitro.
- https://cdn.elifesciences.org/articles/84139/elife-84139-fig5-data1-v2.zip
-
Figure 5—source data 2
Measurements of ring diameters and tube length in cellulo.
- https://cdn.elifesciences.org/articles/84139/elife-84139-fig5-data2-v2.zip
Figure 5—figure supplement 1
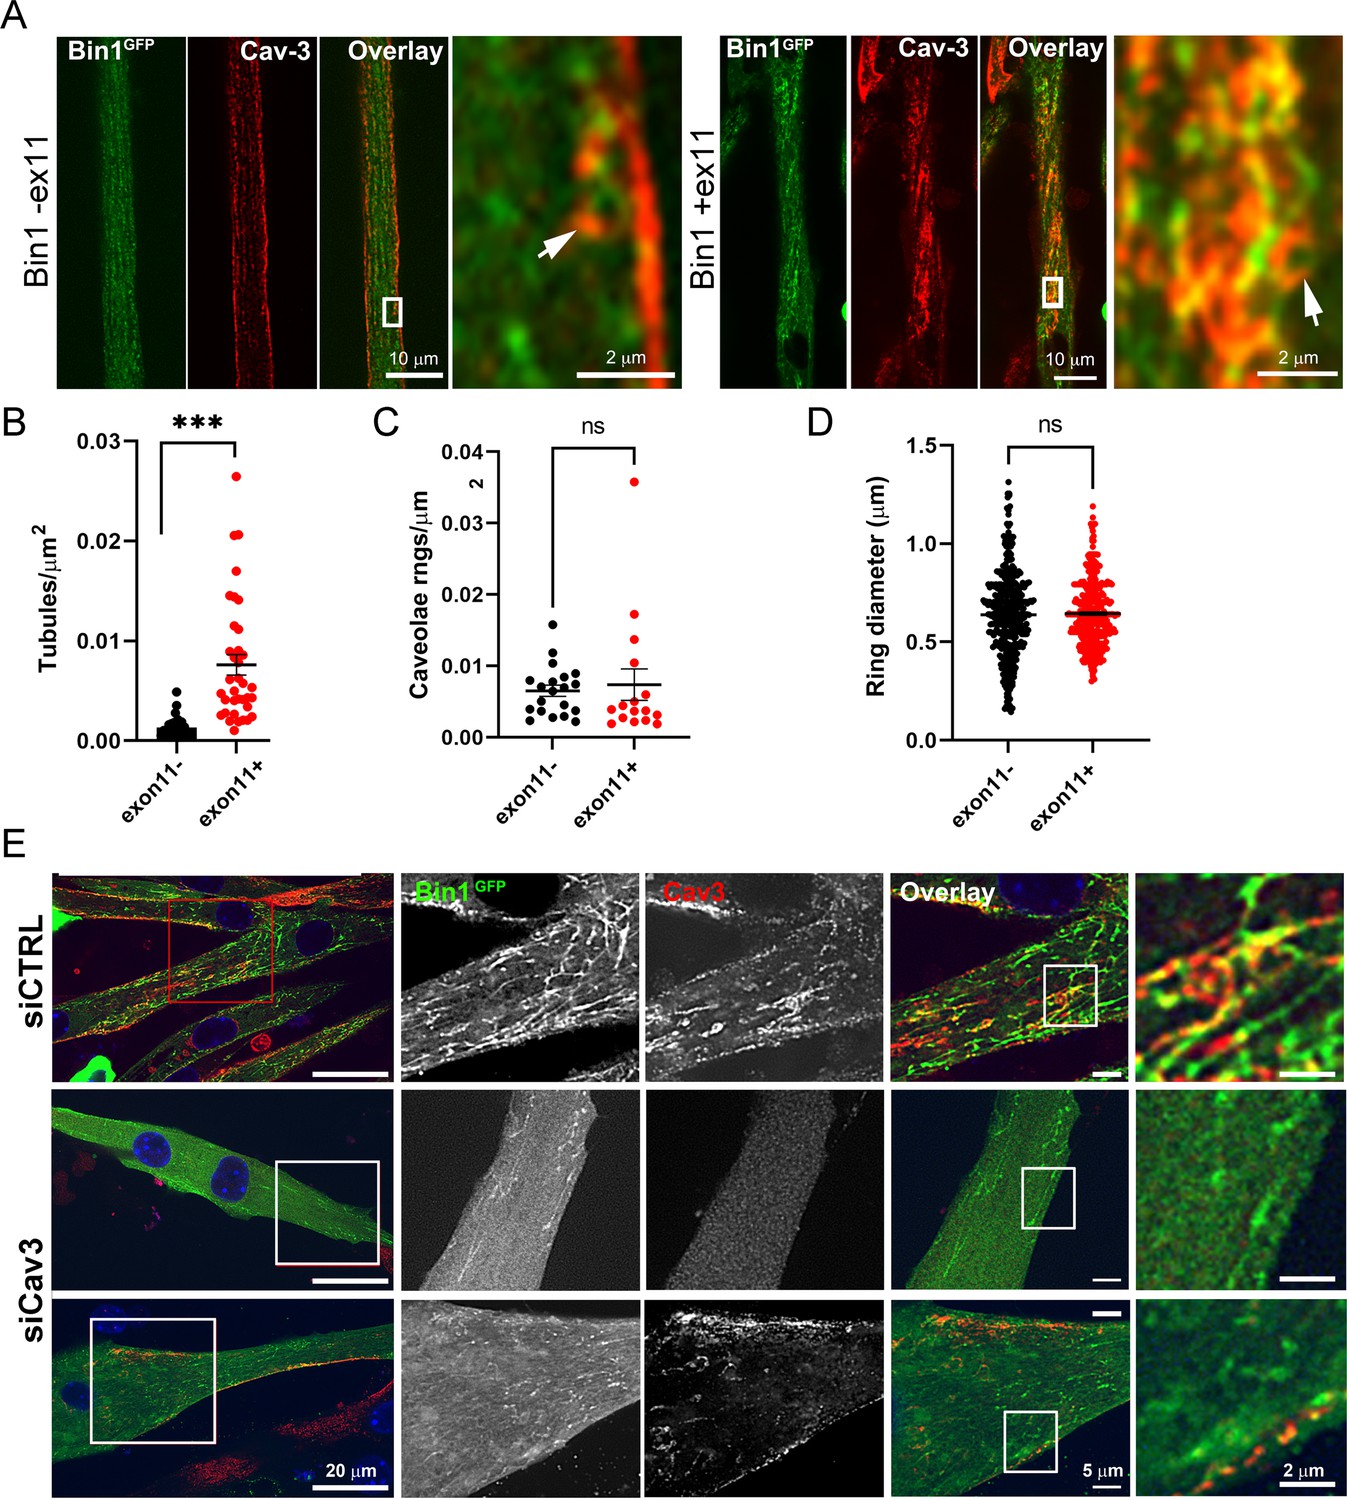
Bin1 tubulation assay in mouse myotubes.
(A) Immunofluorescence images of murine primary myotubes transduced with adenoviruses expressing either Bin1GFP or Bin1-ex11GFP and labeled with antibodies against Cav3 (red). Note the presence of rings and absence of tubes in the Bin1-exon11GFP construct (white arrows) and the abundance of tubules in myotubes expressing Bin1GFP. (B) Quantification of tubule density from super-resolution images of differentiated myotubes either expressing Bin1-exon11GFP or Bin1+exon11GFP (Bin1-exon11GFP, n=21 myotubes from three independent experiments; Bin1+exon11GFP, n=14 myotubes from three independent experiments; <0.001). (C) Quantification of caveolae density from super-resolution images of differentiated myotubes either expressing Bin1-exon11GFP or Bin1+exon11GFP (Bin1-exon11GFP, n=20 myotubes from three independent experiments; Bin1+exon11GFP, n=16 myotubes from three independent experiments; p=0.71). (D) Quantification of caveolae ring diameter from super-resolution images of differentiated myotubes either expressing Bin1-exon11GFP or Bin1+exon11GFP (Bin1-exon11GFP, n=387 rings from three independent experiments; Bin1+exon11GFP, n=357 rings from three independent experiments; p=0.66). (E) Immunofluorescence images of murine primary myotubes transfected with Bin1GFP in either control or myotubes depleted of Cav3 after siRNA treatment.
-
Figure 5—figure supplement 1—source data 1
Quantification of tubule density in Bin1-exon11 vs Bin1 +exon 11.
- https://cdn.elifesciences.org/articles/84139/elife-84139-fig5-figsupp1-data1-v2.zip
-
Figure 5—figure supplement 1—source data 2
Quantification of caveolae ring density in Bin1-exon11 vs Bin1 +exon 11.
- https://cdn.elifesciences.org/articles/84139/elife-84139-fig5-figsupp1-data2-v2.zip
-
Figure 5—figure supplement 1—source data 3
Quantification of caveolae ring diameter in Bin1-exon11 vs Bin1 +exon 11.
- https://cdn.elifesciences.org/articles/84139/elife-84139-fig5-figsupp1-data3-v2.zip
Figure 5—figure supplement 2
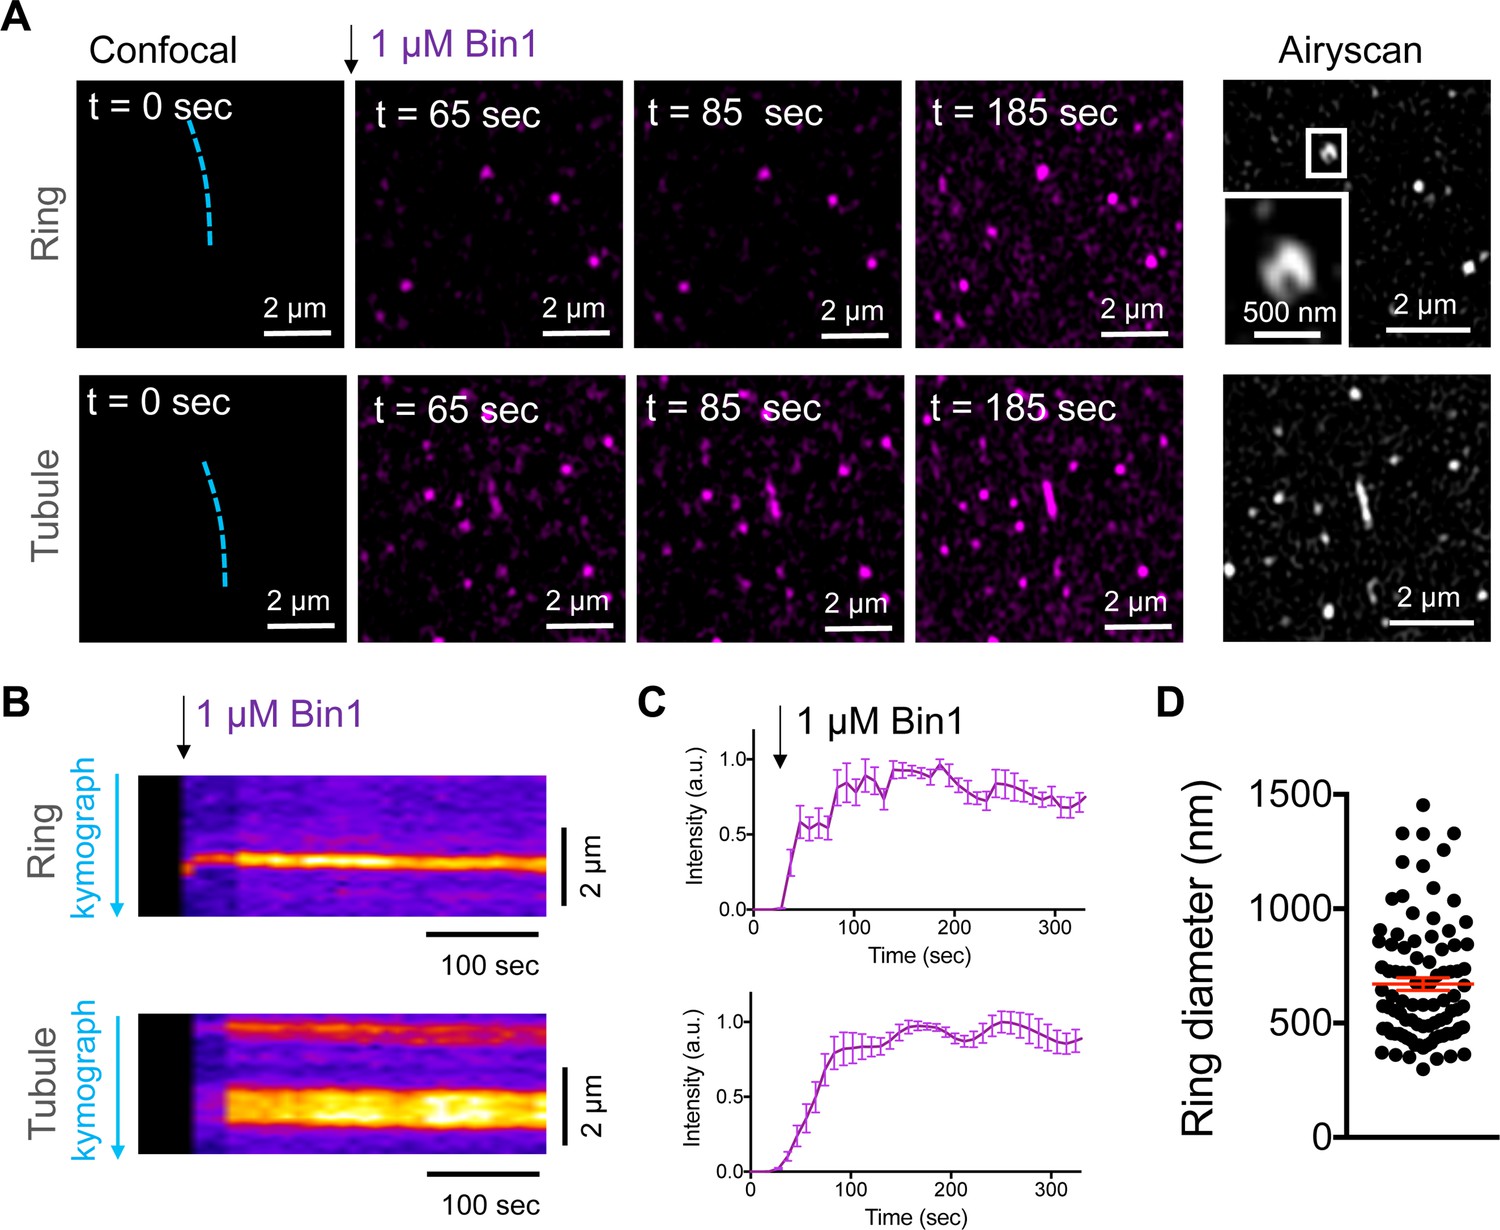
Bin1 forms persistent rings and tubules in vitro.
(A) Confocal time-lapse images showing the dynamics of 1 µM Bin1-Alexa647 (magenta) organization in rings and tubes on 5% mol PI4,5P2-containing membranes. Airyscan image acquired at the same region of the corresponding confocal image at t=185 sec. (B) Kymograph analysis along the blue dashed line in A. (C) Fluorescence quantification over time of Bin1-Alexa647 signal on a ring (top) and tubule (bottom) assemblies. Each curve represents the mean ± s.d. of n=7 kinetics from two experimental replicates. (D) Diameter distribution of Bin1 rings (in nm) on lipid bilayers containing 5 % mol of PI4,5P2. The number of rings analyzed was n=92.
Figure 6 with 1 supplement
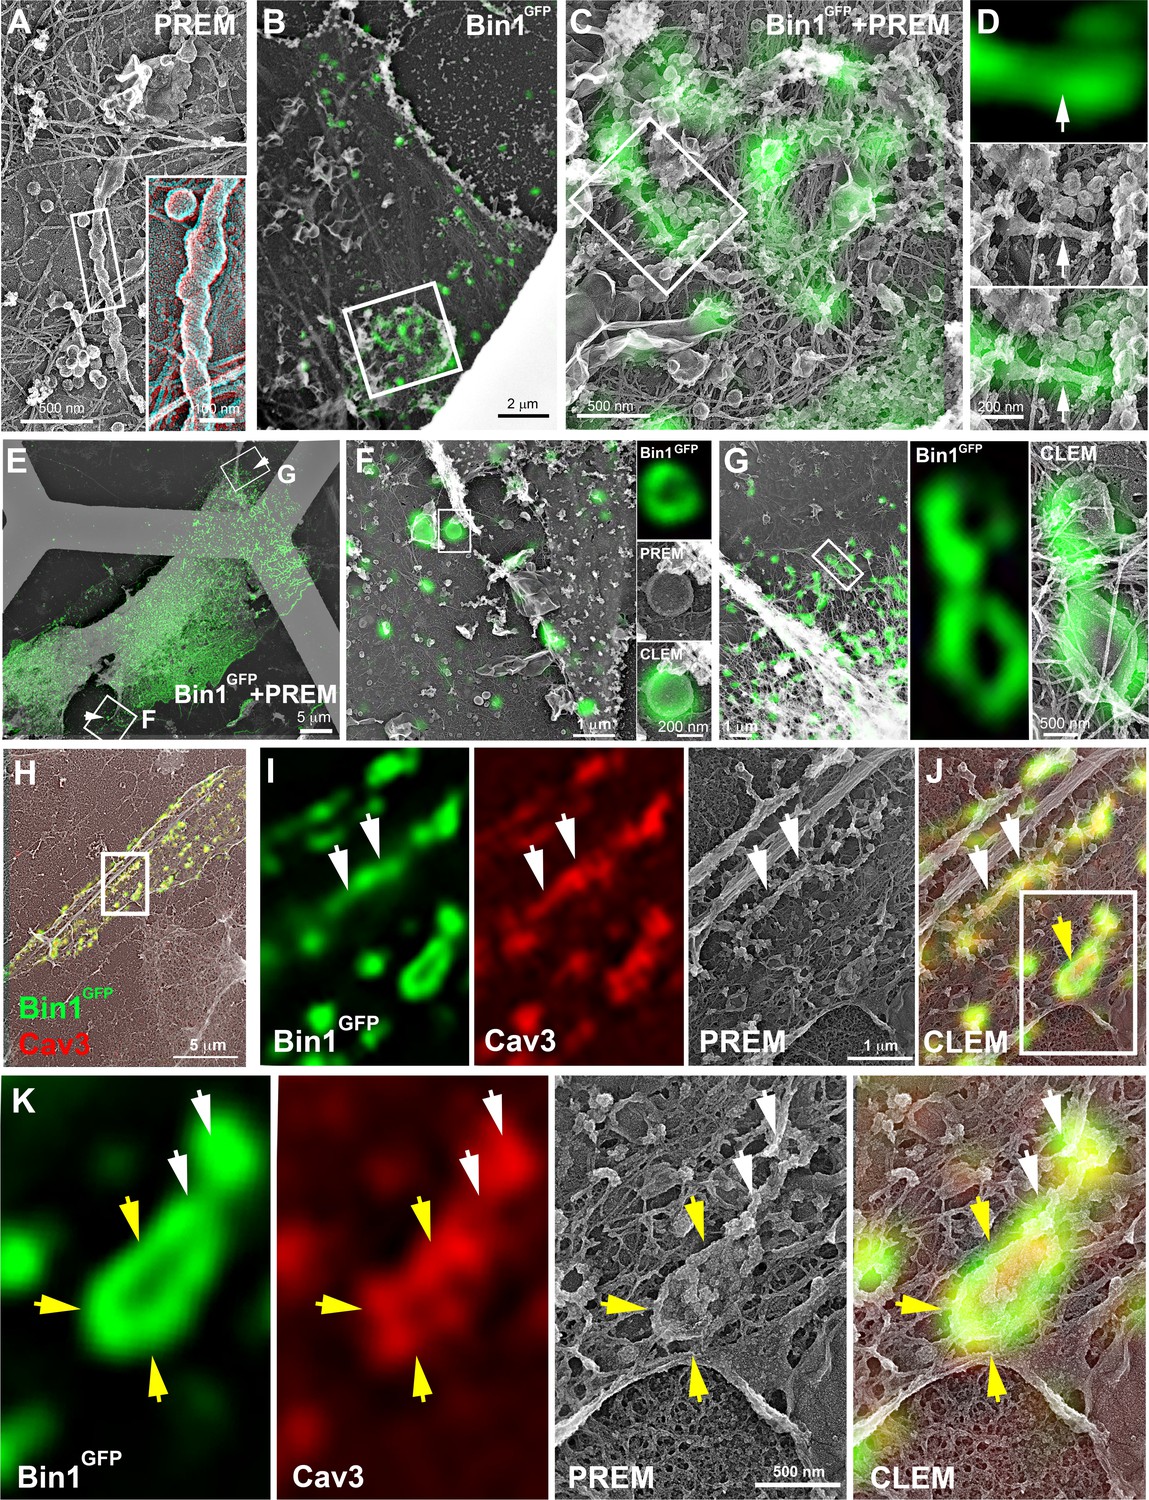
CLEM evidence of Bin1 tubules and rings in human and murine myotubes.
(A) High magnification PREM image of an unroofed human myotube transduced with an adenovirus expressing Bin1GFP forming a characteristic pearled tubule with caveolar material. A 3D anaglyph of the tubule next to a single caveolae with a similar proteinasceous coat is shown in the inset (use red/cyan glasses for viewing). (B–G) Correlative LM and PREM images from human myotubes transduced with Bin1GFP (green). (F and G) Correlative LM and PREM overlay images corresponding to insets in (E). (H) CLEM overlay of extensively differentiated murine myotubes transduced with Bin1GFP (green) and labeled with antibodies against Cav3 (red). (I–J) High magnification PREM views of the inset in (H). Bin1GFP and Cav3 labeling on beaded tubes (white arrows) and rings (yellow arrows). (K) High magnification views of the inset in (J). Bin1GFP (green) colocalized with Cav3 labeling (red) on beaded tubules (white arrows) emanating from rings (yellow arrows).
Figure 6—video 1
Correlative super-resolution/PREM for Bin1GFP corresponding to Figure 6I-K.
The unroofed myotube is shown with successive fluorescent microscopy images (Cav3 in red, Bin1GFP in green), low-magnification PREM image (grid appears white), super-resolution image and high-magnification PREM image of the inset. The high magnification PREM images were acquired with electron tomography by collecting images at different tilt angles up to ±25° relative to the plane of the sample with a 5° increment between each frame.
Figure 7
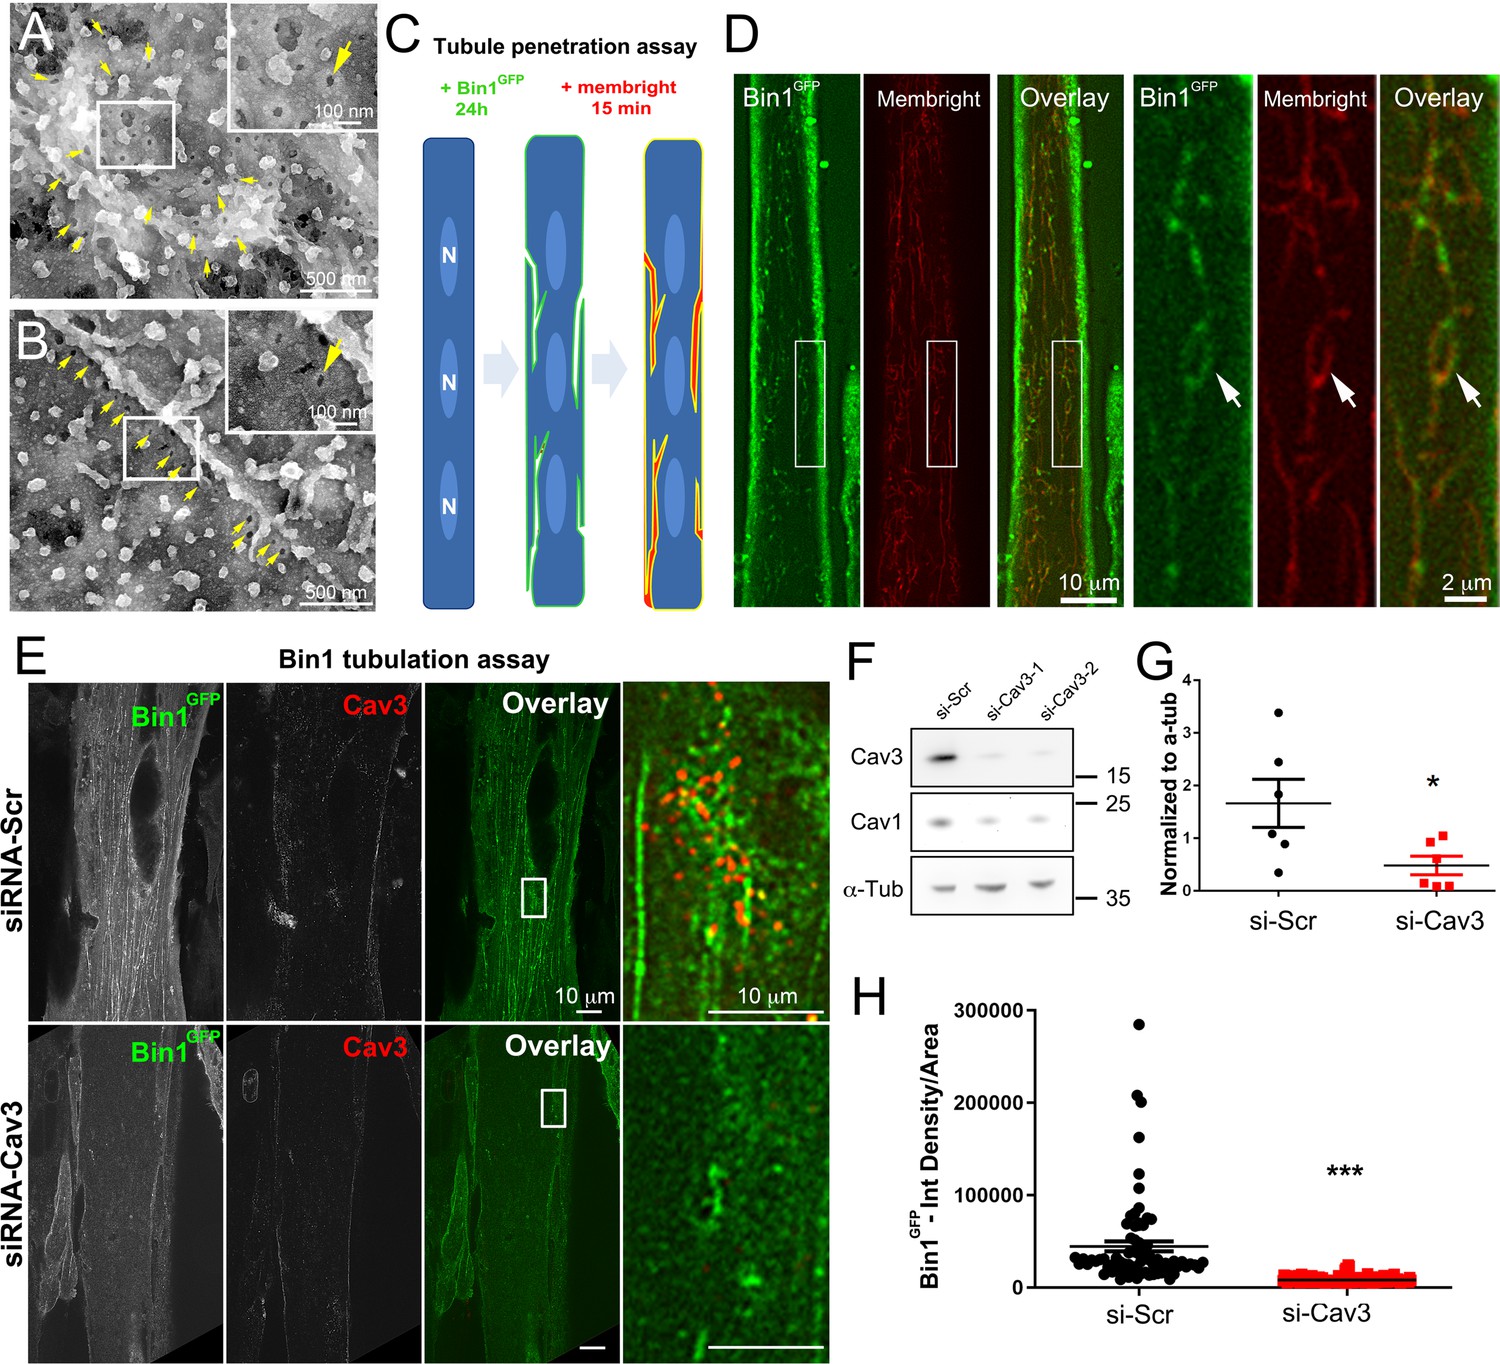
Bin1 tubules are in contact with the extracellular medium and depletion of Cav3 decreases Bin1-induced tubulation.
(A–B) PREM images of intact myotubes transduced with Bin1GFP. Yellow arrows indicate necks of caveolae (25–40 nm) seen from the extracellular side of the plasma membrane organized in a circular (A) or linear (B) fashion. (C) Schematic of the MemBright tubule penetration assay. Multi-nucleated myotubes (blue) expressing Bin1GFP are incubated for 15 min with the impermeable lipid probe (red). (N=nucleus). (D) Sub-diffracted light microscopy images of cultured murine myotubes transduced with Bin1GFP (green) and incubated with an impermeable lipid probe (red) for 15 min. White arrows in the insets denote ring-like structures positive for both Bin1GFP and MemBright signal. (E) Immunofluorescent staining of primary human myotubes at 9 days of differentiation transduced with Bin1GFP. In control cells, Bin1GFP overexpression results in abundant membrane tubulation and the appearance of a dense network of tubes. Cav3 deficiency in siRNA-treated myotubes results in a dramatic decrease in tubulation. (F) Western-blot analysis of Cav3 and Cav1 protein levels in differentiated myotubes treated with two different siRNAs directed against Cav3 (si-Cav3) and a scramble siRNA (si-Scr). (G) Quantification of Cav3 protein levels in cultured myotubes treated with siRNAs directed against Cav3 or scramble siRNA (n=3 independent experiments, p<0.05). (H) Quantification of Bin1GFP fluorescence intensity in cultured control and si-Cav3 myotubes transduced with Bin1GFP (si-Scr, 78 myotubes from n=25 images; si-Cav3, 130 myotubes from n=50 images; p<0.0001 from at least three independent experiments).
-
Figure 7—source data 1
Quantification of Cav3 protein levels in myotubes treated with siRNA against Cav3.
- https://cdn.elifesciences.org/articles/84139/elife-84139-fig7-data1-v2.zip
-
Figure 7—source data 2
Quantification of Bin1GFP fluorescence intensity in control and siCav3 myotubes.
- https://cdn.elifesciences.org/articles/84139/elife-84139-fig7-data2-v2.zip
-
Figure 7—source data 3
Western blot uncropped membranes.
- https://cdn.elifesciences.org/articles/84139/elife-84139-fig7-data3-v2.zip
Figure 8 with 2 supplements
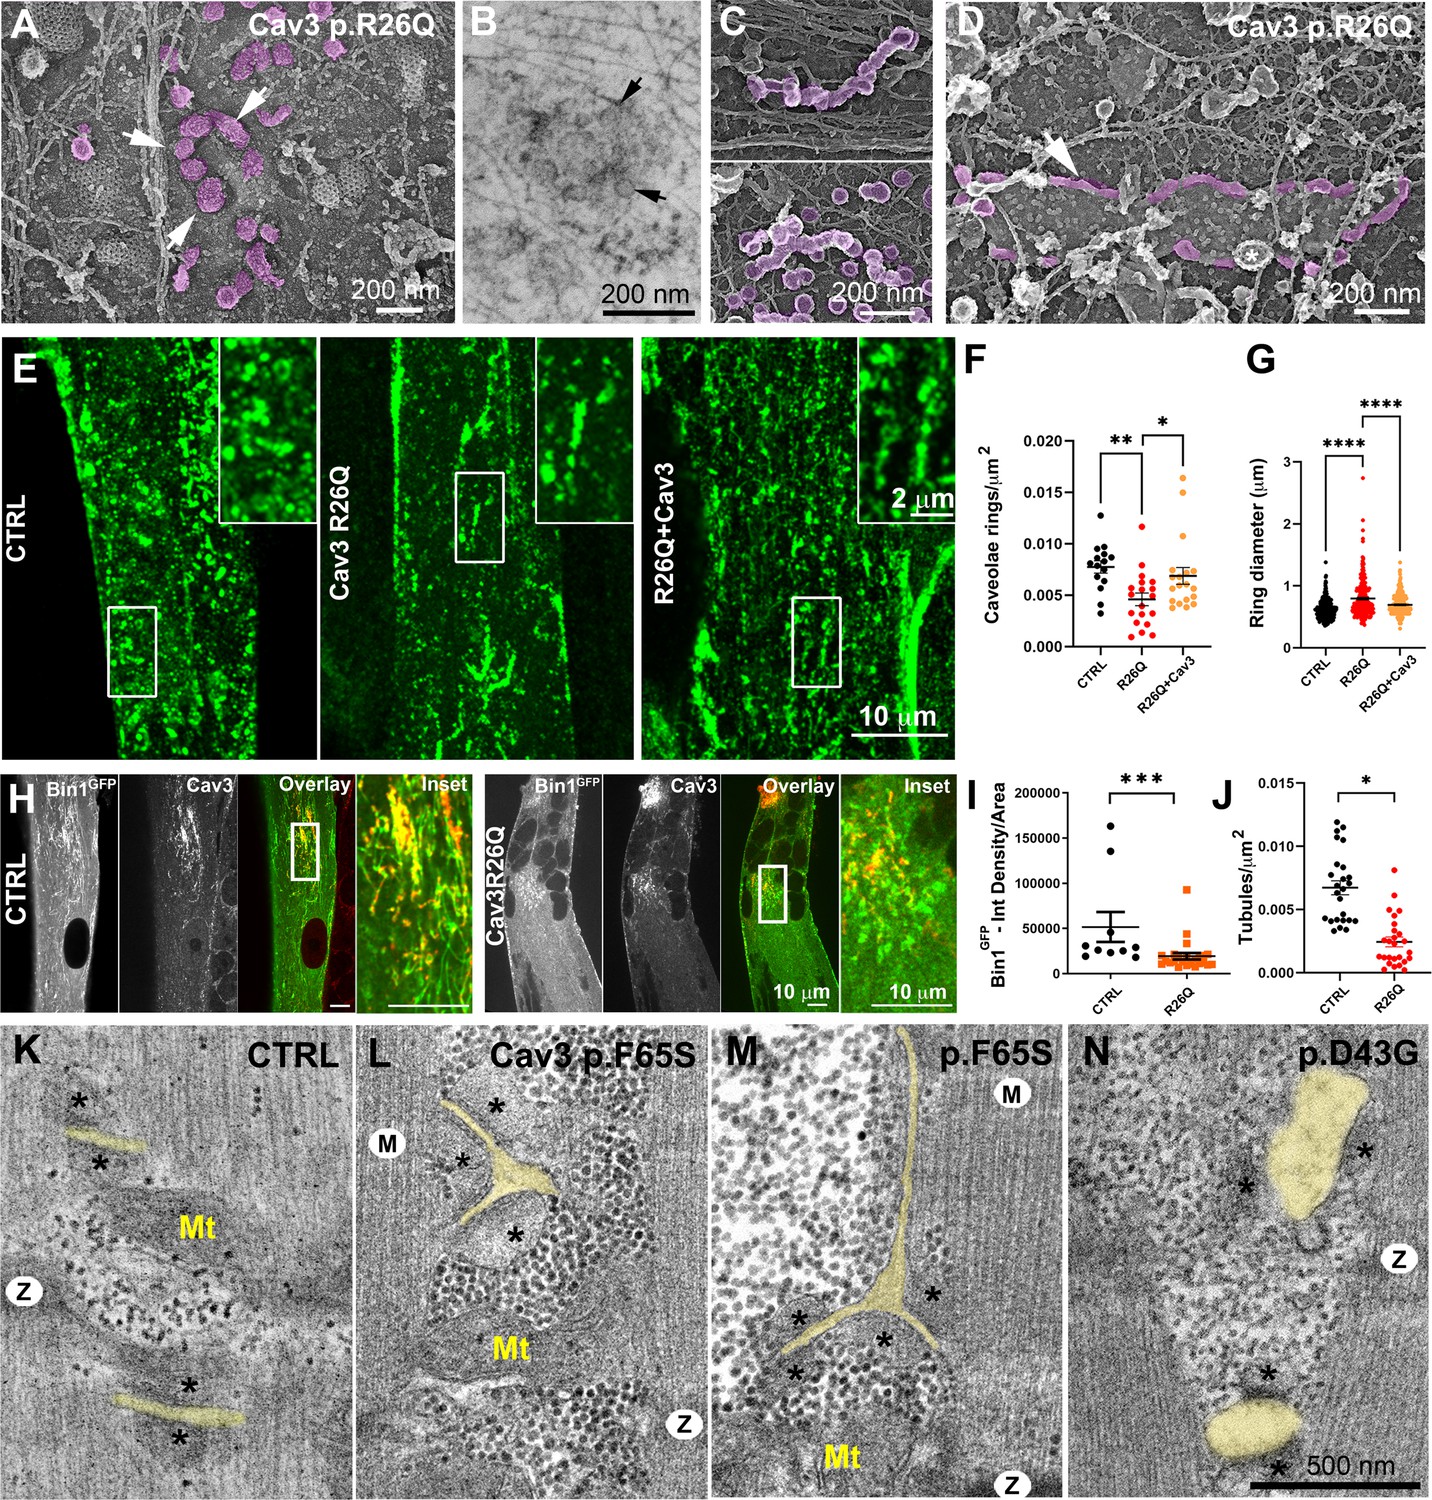
Cav3 mutations disorganize caveolae rings in patient-derived cells and T-tubules in patient muscle biopsies.
(A) High-magnification PREM images of caveolae rings on the cytosolic side of the plasma membrane of sonicated myotubes from patients with the Cav3 R26Q mutation. Caveolae are pseudocolored purple and display an altered structure and spatial organization (white arrows denote individual caveolae with an altered morphology). (B) High-magnification view of a caveolae ring from a patient myotube with the R26Q mutation observed by thin-section EM. Black arrows indicate caveolae forming a loose ring-like structure. (C) High-magnification PREM images of small tubes made of 5–10 concatenated caveolae in unroofed myotubes from patients with Cav3 R26Q mutation. (D) High-magnification view of a giant (>2 μm major axis) caveolae oval-like structure (pseudo-colored in purple) in an unroofed myotube from Cav3 R26Q mutation. White star indicates a clathrin-coated pit. (E) Immunofluorescent staining of control, R26Q patient myotubes and R26Q patient myotubes expressing full length Cav3. (F) Quantification of caveolae ring density from super-resolution images of differentiated control myotubes, caveolinopathy patient myotubes or caveolinopathy patient myotubes with the R26Q mutation stably expressing Cav3GFP (CTRL, n=15 myotubes from three independent experiments; R26Q, n=19 myotubes from three independent experiments; R26Q+Cav3, n=19 myotubes from three independent experiments). (G) Quantification of caveolae ring diameter from super-resolution images of differentiated control myotubes, caveolinopathy patient myotubes or caveolinopathy patient myotubes with the R26Q mutation stably expressing Cav3GFP (CTRL, n=310 rings from three independent experiments; R26Q, n=219 rings from three independent experiments; R26Q+Cav3, n=670 rings from three independent experiments). (H) Immunofluorescent staining of control and Cav3 R26Q patient myotubes transduced with Bin1GFP. In control cells, Bin1GFP overexpression results in excessive membrane tubulation and appearance of a dense network of tubes. Cav3 deficiency in patient myotubes results in a dramatic decrease in tubulation. (I) Quantification of Bin1GFP fluorescence intensity in cultured control and patient myotubes transduced with Bin1GFP. The Cav3 R26Q mutation results in a significant decrease in Bin1 labeling. (CTRL, 10 myotubes from n=8 images; Cav3 R26Q, 24 myotubes from n=16 images; p<0.001 from at least three independent experiments). (J) Quantification of tubule density from super-resolution images of differentiated myotubes either expressing Bin1-exon11GFP or Bin1+exon11GFP (Bin1-exon11GFP, n=21 myotubes from three independent experiments; Bin1+exon11GFP, n=14 myotubes from three independent experiments; p<0.001). (K–N) High magnification thin-section EM images of muscle biopsies from a control subject (K) and patients with either Cav3 F65S (L and M) or D43G mutations (N). SR terminal cisternae are denoted with black asterisks. T-tubules are pseudo-colored pale yellow. Mitochondria (Mt), Z-Disk (Z), M-band (M). In (L) and (M) T-tubules form abnormal bifurcations. Instances of T-tubule swelling (N) are also observed in patient biopsies.
-
Figure 8—source data 1
Quantification of caveolae ring density ctrl vs R26Q vs R26Q+Cav3-GFP.
- https://cdn.elifesciences.org/articles/84139/elife-84139-fig8-data1-v2.zip
-
Figure 8—source data 2
Quantification of caveolae ring diameter in ctrl vs R26Q vs R26Q+Cav3-GFP.
- https://cdn.elifesciences.org/articles/84139/elife-84139-fig8-data2-v2.zip
-
Figure 8—source data 3
Quantification of tubule density in control and patient myotubes transduced with Bin1 +ex11.
- https://cdn.elifesciences.org/articles/84139/elife-84139-fig8-data3-v2.zip
-
Figure 8—source data 4
Quantification of tubule density in control and patient myotubes transduced with Bin1exon11.
- https://cdn.elifesciences.org/articles/84139/elife-84139-fig8-data4-v2.zip
Figure 8—figure supplement 1
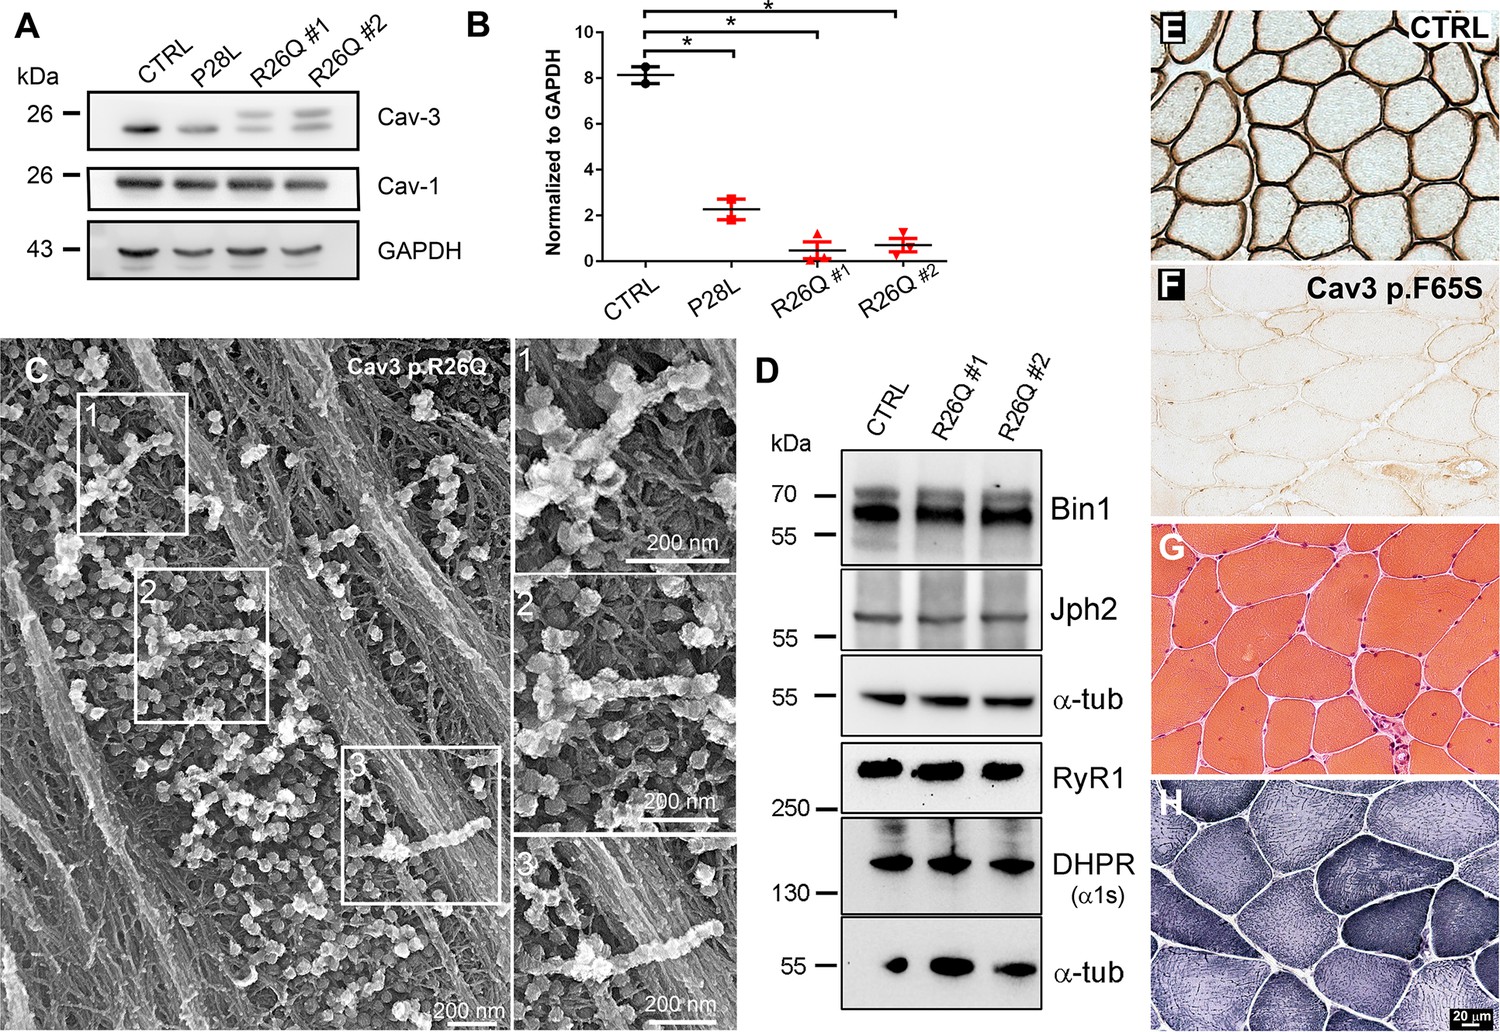
Cav3 protein levels and characteristic ultrastructure of beaded caveolae tubes in caveolinopathy patient myotubes and characteristic histology of caveolinopathy patient muscle biopsies.
(A) Western-blot analysis of Cav3 protein levels in myotubes from patients with P28L and R26Q mutations (n=3 independent experiments). (B) Densitometric quantification of Cav3 protein levels relative to GAPDH levels. (C) High magnification PREM views of unroofed immortalized human myotubes with the Cav3 R26Q mutation after extensive differentiation (21 days). Note the presence of beaded tubes made of 5–10 concatenated caveolae in regions with abundant caveolae. (D) Western-blot analysis of Bin1, Junctophilin 2, RyR1 and DHPR a1s-subunit protein levels in myotubes from control and two caveolinopathy patients with R26Q mutations (n=3 independent experiments). (E–F) Immunohistochemical labeling of Cav3 in muscle biopsy from a control subject or from a patient with p.F65S Cav3 mutation reveals a strong reduction in Cav3 labeling. (G) Hematoxylin and Eosin staining on muscle sections from the patient displays some centralized and internalized nuclei. (H) NADH-TR reaction C on muscle sections from the same patient.
-
Figure 8—figure supplement 1—source data 1
Densitometric quantification of Cav3 protein levels in patient myotubes.
- https://cdn.elifesciences.org/articles/84139/elife-84139-fig8-figsupp1-data1-v2.zip
-
Figure 8—figure supplement 1—source data 2
Western blot uncropped membranes.
- https://cdn.elifesciences.org/articles/84139/elife-84139-fig8-figsupp1-data2-v2.zip
-
Figure 8—figure supplement 1—source data 3
Western blot uncropped membranes.
- https://cdn.elifesciences.org/articles/84139/elife-84139-fig8-figsupp1-data3-v2.zip
Figure 8—video 1
Tomogram from a semi-thin section of a caveolinopathy patient presenting a bifurcation and corresponding to Figure 8M.
High magnification EM images were acquired with electron tomography by collecting images at different tilt angles up to ±60° relative to the plane of the sample with a 2° increment between each frame.
Figure 9
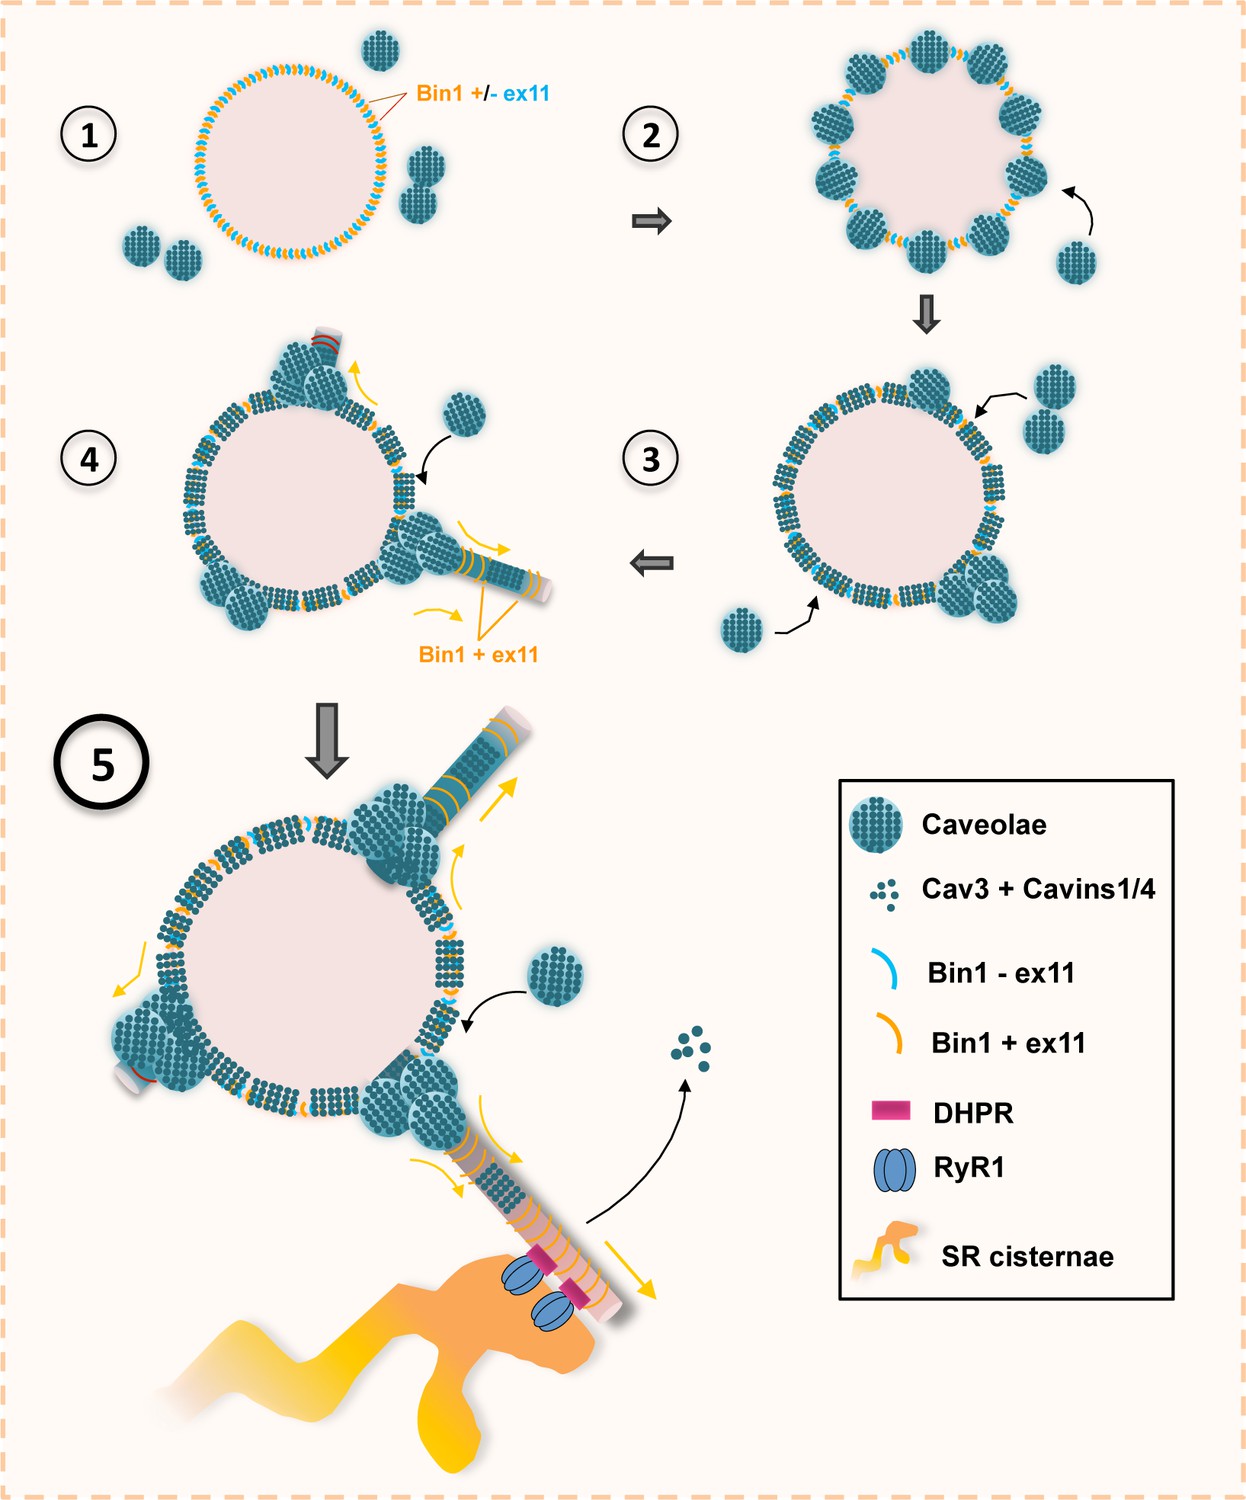
Model of Bin1 and Cav3-mediated ring formation and tubulation.
(1) Bin1 molecules polymerize into ring-like structures and recruit Cav3-positive caveolae. (2) Caveolae assemble into circular structures while additional caveolae accumulate at specific spots on the ring periphery. (3) Bin1-positive tubules emanate from regions where caveolae accumulate. (4-5) Tubules containing the α1s-subunit of the DHPR elongate from the central ring and start forming contacts with RyR1-positive SR cisternae. Caveolar material is either removed from the tubule or diffuses along the tubule membrane.
Author response image 1
Author response image 2
Time-lapse imaging of Cav3/Bin1 tubules extending from rings.
Gallery of consecutive frames from the time-lapse sequences of Cav3GFP expressing myotubes from figure 4 and movies 5 and 6. The gallery shows consecutive frames every 10s of a tubule emanating from a ring (see Video 5 and Video 6). Note the bright spot on the region of the ring from which the tubule emanates.
Tables
Table 1
List of primary antibodies.
| Antibodies | Provider | Product ref |
|---|---|---|
| Cav3 (Mouse) monoclonal | BD Biosciences | 610421 |
| Cav3 (Rabbit) polyclonal | Abcam | ab2912 |
| Cav-1 (Rabbit) polyclonal | Santa Cruz | sc894 |
| Cavin 4 (MURC) (Rabbit) polyclonal | Merck | HPA020973 |
| DHPR (Mouse) monoclonal | Abcam | ab2862 |
| RyR1 (Rabbit) polyclonal | Custom | Marty et al., 1994 |
| Bin1 (Mouse) monoclonal | Merck | 05-449-C |
| Bin1 (Rabbit) polyclonal | Custom | Nicot et al., 2007 |
| GFP (Rabbit) polyclonal | Thermofischer | A11122 |
| -actinin 2(Mouse) monoclonal | Sigma Aldrich | A7811 |
| Junctophilin 2 (Rabbit) polyclonal | Thermofischer | PA5-20642 |
| GAPDH (Rabbit) polyclonal | Santa Cruz | sc25778 |
| -tubulin (Mouse) monoclonal | Thermofischer | 236-10501 |
Table 2
List of siRNA sequences.
| Target | Human siRNASequence |
|---|---|
| Cav3 (1) | 5’-CAGAUCUCGAGGCCCAGAUCG-3’ |
| Cav3 (2) | 5’-AAGCACAAUGGCCCUUCGCUC-3’ |
| Target | Murine siRNASequence |
| Cav3 | 5’-GGUUCCUCUCAAUUCCAC-3’ |
Additional files
Download links
A two-part list of links to download the article, or parts of the article, in various formats.
Downloads (link to download the article as PDF)
Open citations (links to open the citations from this article in various online reference manager services)
Cite this article (links to download the citations from this article in formats compatible with various reference manager tools)
Caveolae and Bin1 form ring-shaped platforms for T-tubule initiation
eLife 12:e84139.
https://doi.org/10.7554/eLife.84139


