Ultrastructural effects of sleep and wake on the parallel fiber synapses of the cerebellum
- Department of Psychiatry, University of Wisconsin-Madison, United States
- Department of Mathematics and Statistics, Brock University, Canada
Figures
Figure 1
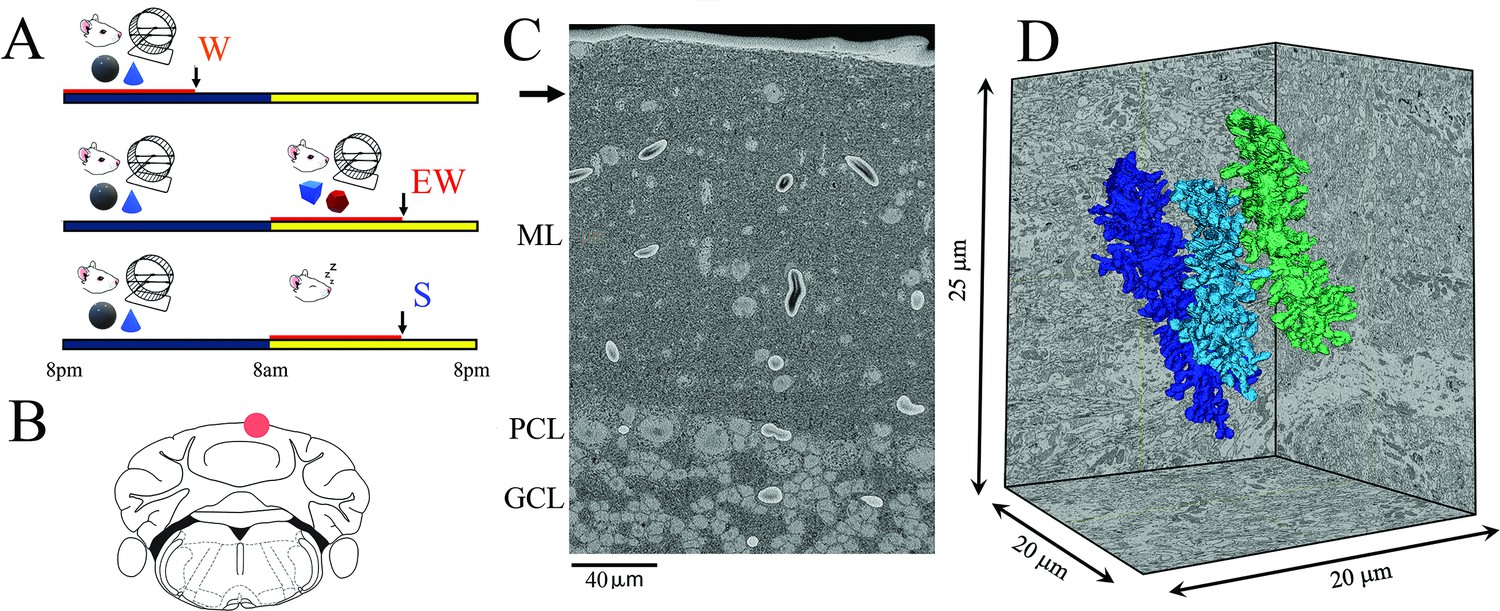
Experimental design.
(A) The three experimental groups. W, spontaneous wake at night; EW, extended wake during the day; S, sleep during the day. Black and yellow horizontal bars indicate the 12 hr dark and 12 hr light phases, respectively. The red horizontal bar marks the last 6–8 hr before the time of brain collection (black arrow). (B) Schematic representation of a coronal section of the mouse brain with the area of the posterior vermis (lobule VI); the area used for serial block face scanning electron microscopy (SBEM) imaging is indicated by a red circle. (C) Low magnification image showing the molecular layer (ML), Purkinje cell layer (PCL), and granule cell layer (GCL). The black arrow indicates the area where the image stack was collected. (D) 3D reconstruction of three dendritic branches in one stack.
Figure 2
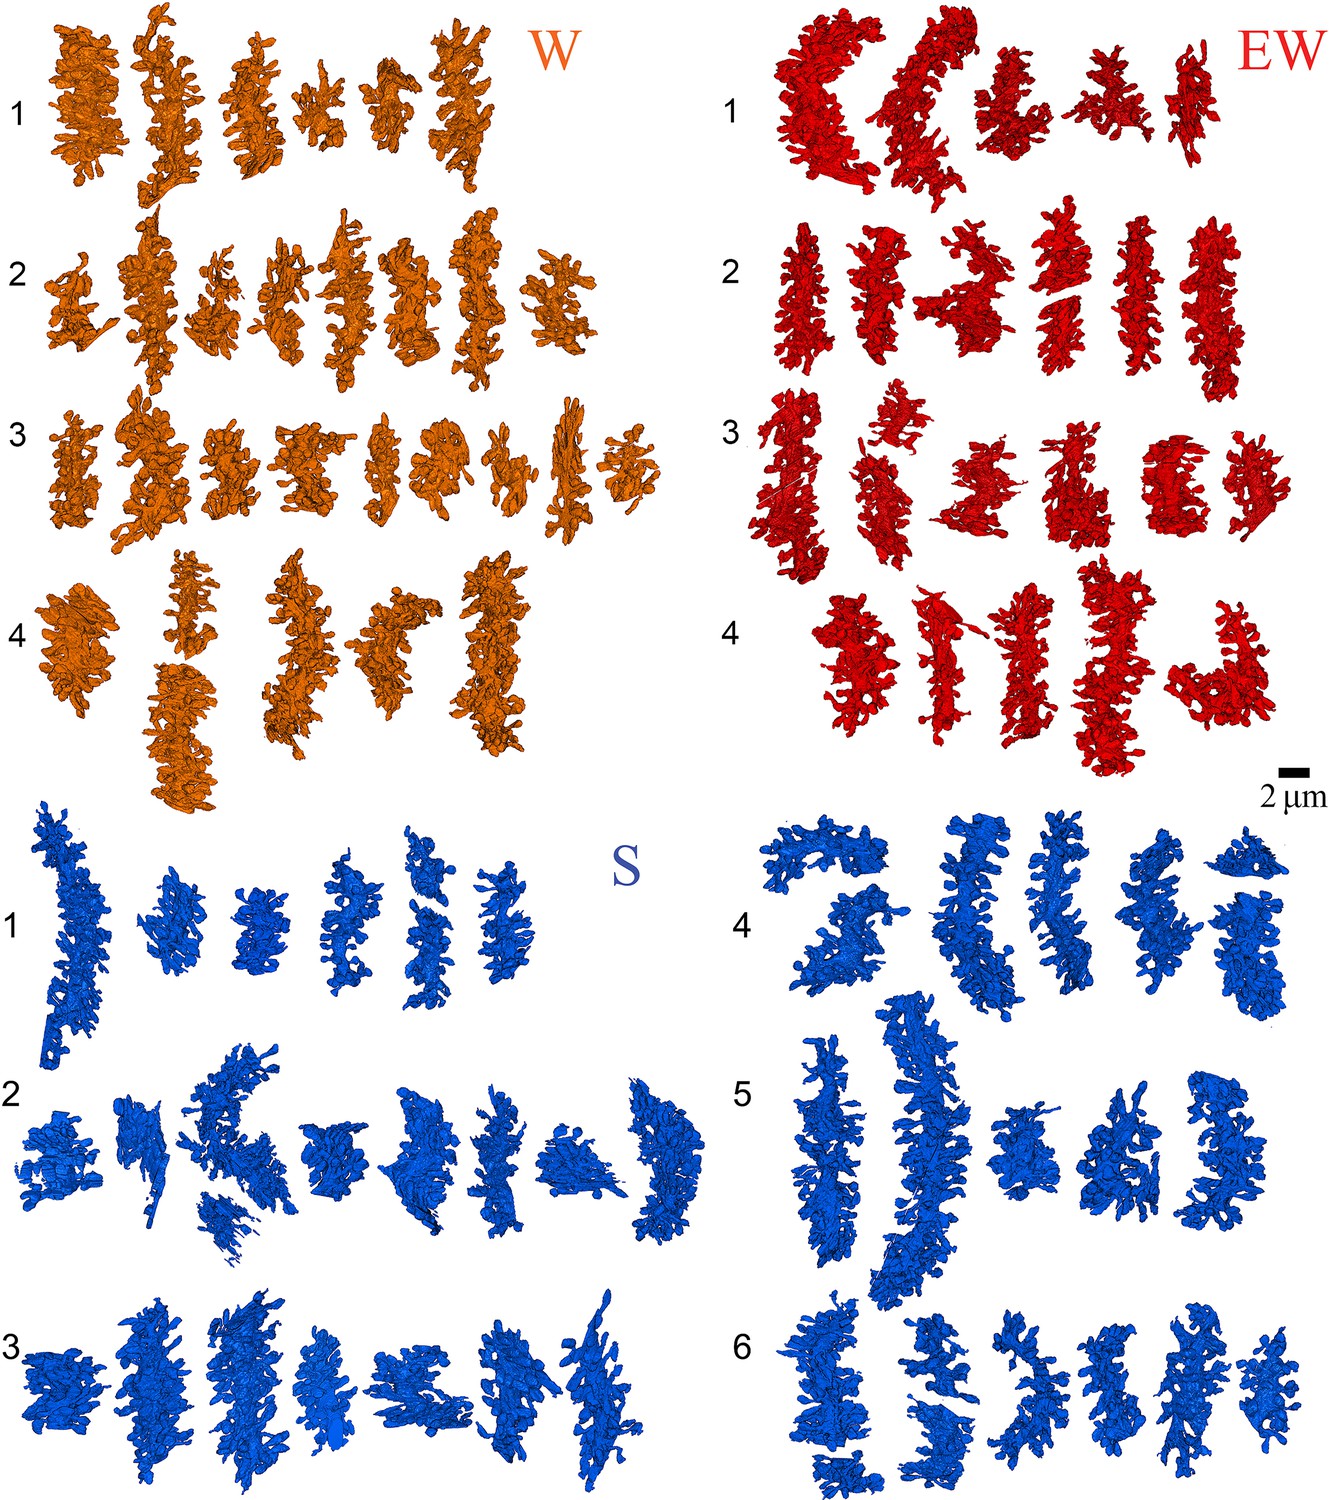
Reconstruction of all dendritic segments used in the study.
W, spontaneous wake (4 mice, 29 dendrites); EW, extended wake (4 mice, 24 dendrites); S, sleep (6 mice, 43 dendrites). Each mouse is identified by a number.
Figure 3
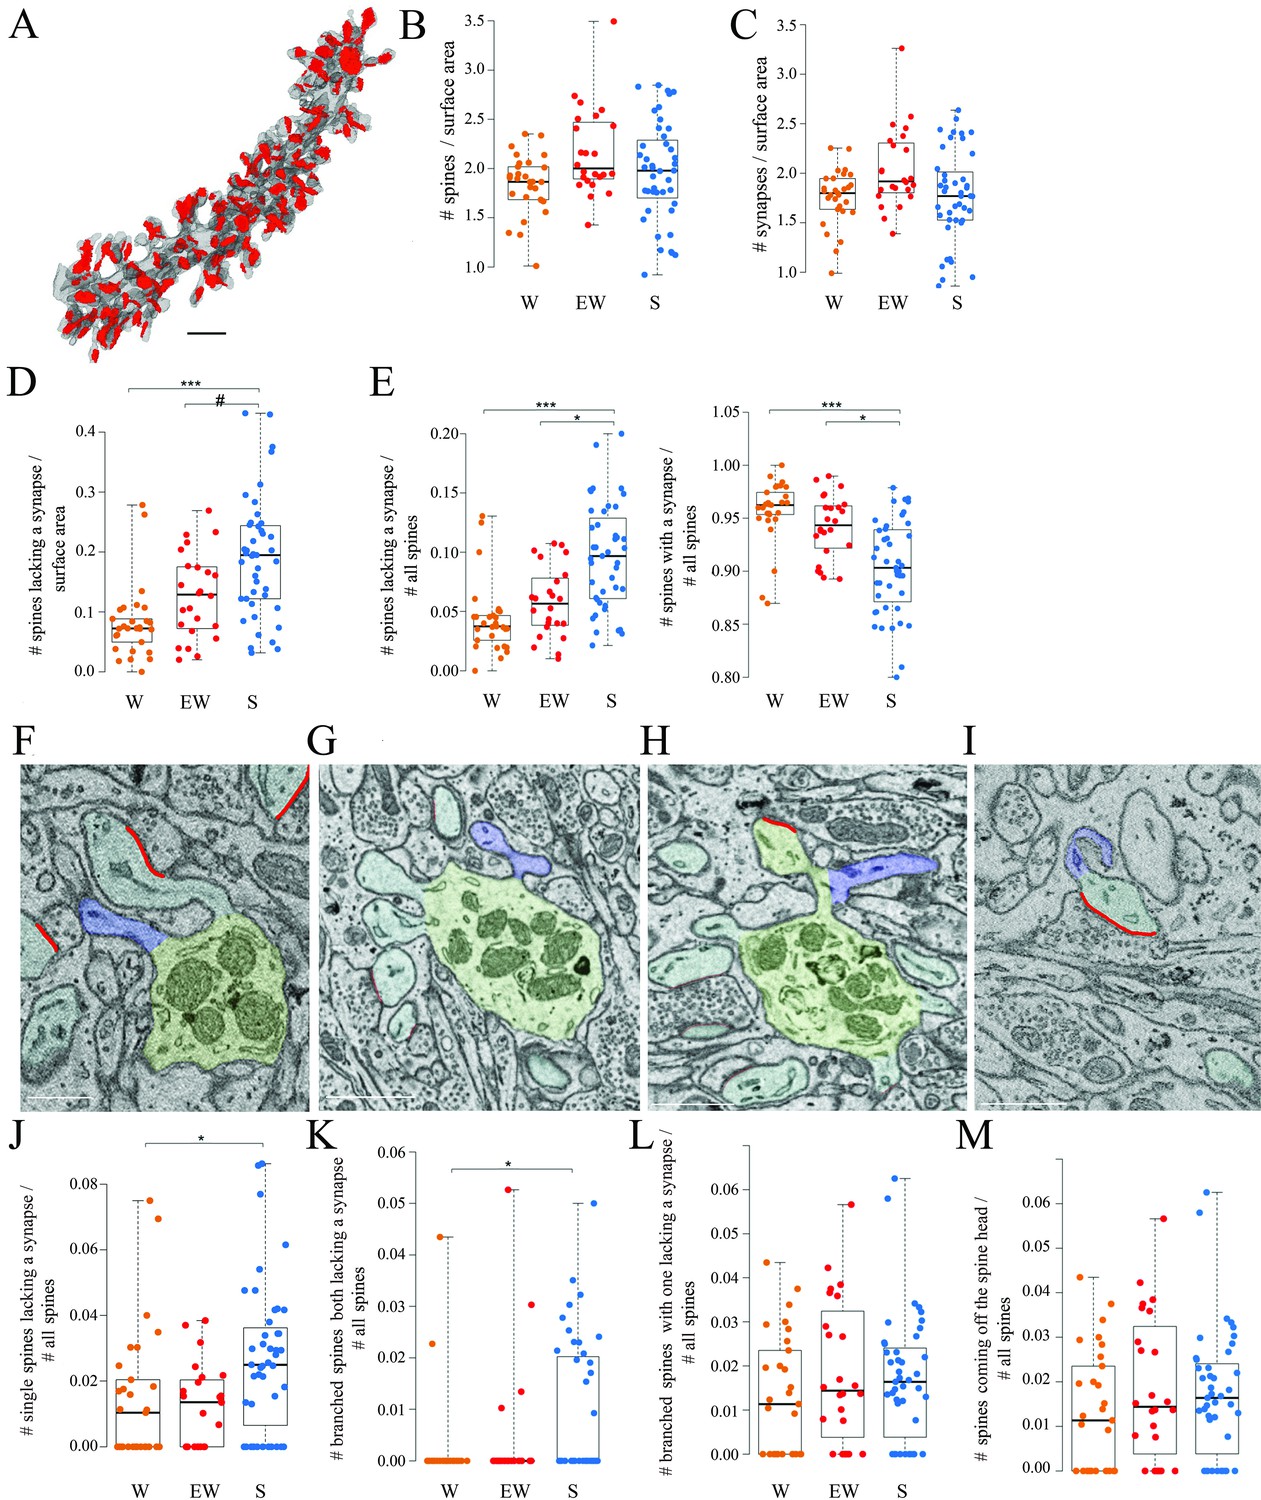
Spines and synapses across groups.
(A) 3D reconstruction of a dendritic branch (spines and dendrite in gray, axon-spine interfaces [ASIs] in red). (B, C) Absolute density of spines and synapses (N per dendrite surface area in µm2) in each experimental group. Each dot is one dendrite. (D) Absolute density of spines without a synapse (N per dendrite surface area in µm2) in each experimental group. Each dot is one dendrite. (E) Relative density of spines without and with a synapse in each experimental group. Each dot is one dendrite. (F–I) 2D images showing examples of spines without a synapse, including a single spine (F, in blue), branched spines both lacking a synapse (G, in blue), branched spines with one lacking a synapse (H, in blue), and spines without a synapse coming off the head of a spine with a synapse (I, in blue). (J–M) Relative density of the four types of spines lacking a synapse. Each dot is a dendrite. Scale bars = 1 µm *, p<0.05; ***, p<0.001; #, p=0.0906. Source data are provided as a source data file (dendrite data.csv).
Figure 4
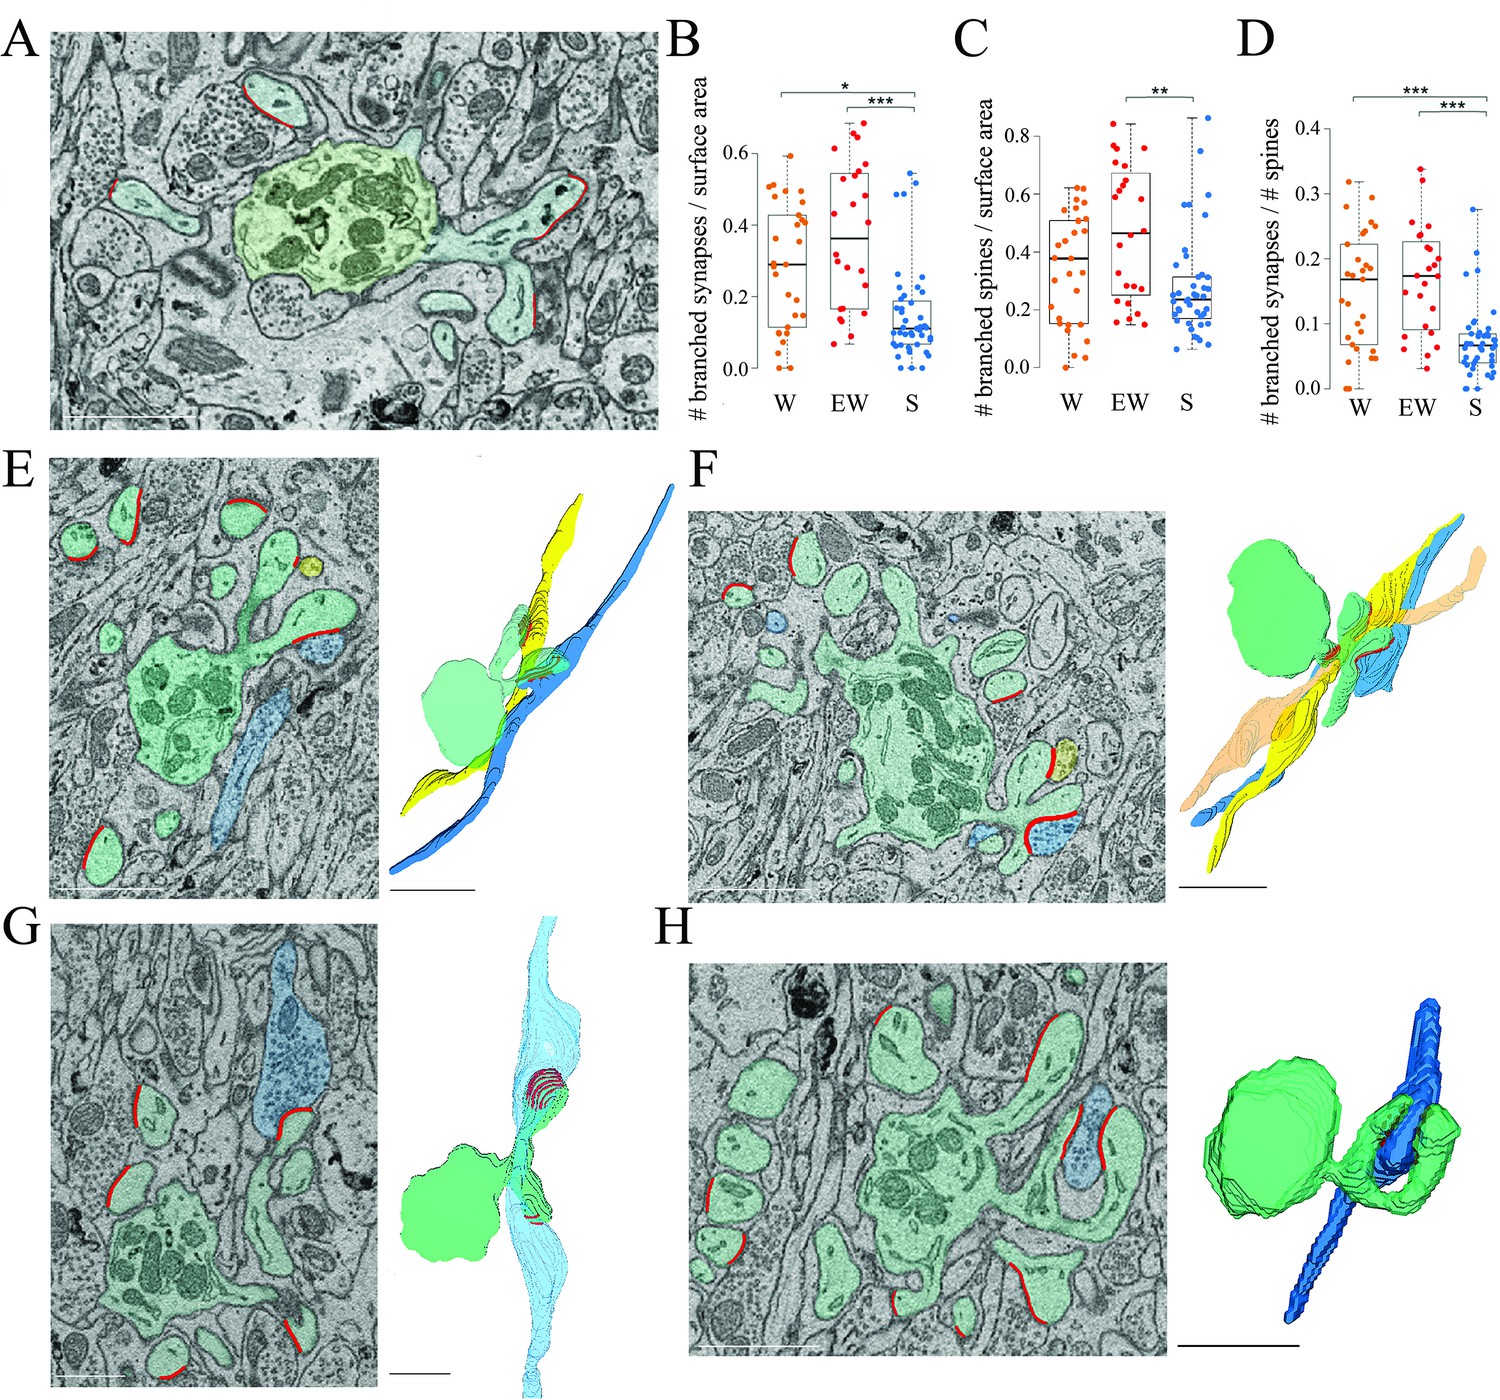
Branched spines and synapses across groups.
(A) 2D image showing an example of two branched synapses, that is, housed in two spines that share the same spine neck, called branched spines (synapses in blue, axon-spine interfaces [ASIs] in red). The dendritic shaft (green) contains multiple mitochondria. (B) Absolute density of branched synapses in each experimental group. Each dot is one dendrite. (C) Absolute density of branched spines in each experimental group. Each dot is one dendrite. (D) Relative density of branched synapses in each experimental group. Each dot is one dendrite. (E, F) Examples of branched synapses contacting two (in E) or three (in F) different parallel fibers. Raw image (left) and 3D reconstruction (right). (G) Example of branched synapses contacting two boutons of the same fiber. (H) Example of branched synapses contacting the same bouton. Scale bars = 1 µm. *, p<0.05; **, p<0.005; ***, p<0.001. Source data are provided as a source data file (dendrite data.csv).
Figure 5

The size of the axon-spine interfaces (ASI) across groups.
(A) Examples of spines with a synapse (ASI in red). Scale bars = 1 µm. (B) Distribution of ASI sizes in cerebellum, cerebral cortex (replotted from de Vivo et al., 2017), and hippocampus (CA1, replotted from Spano et al., 2019) across all three experimental groups. Insets, same on a log scale. (C) Distribution of ASI sizes (sqrt, square-root transformation) in each group. Each dot is a synapse. Source data are provided as a source data file (synapse data.csv).
Figure 6
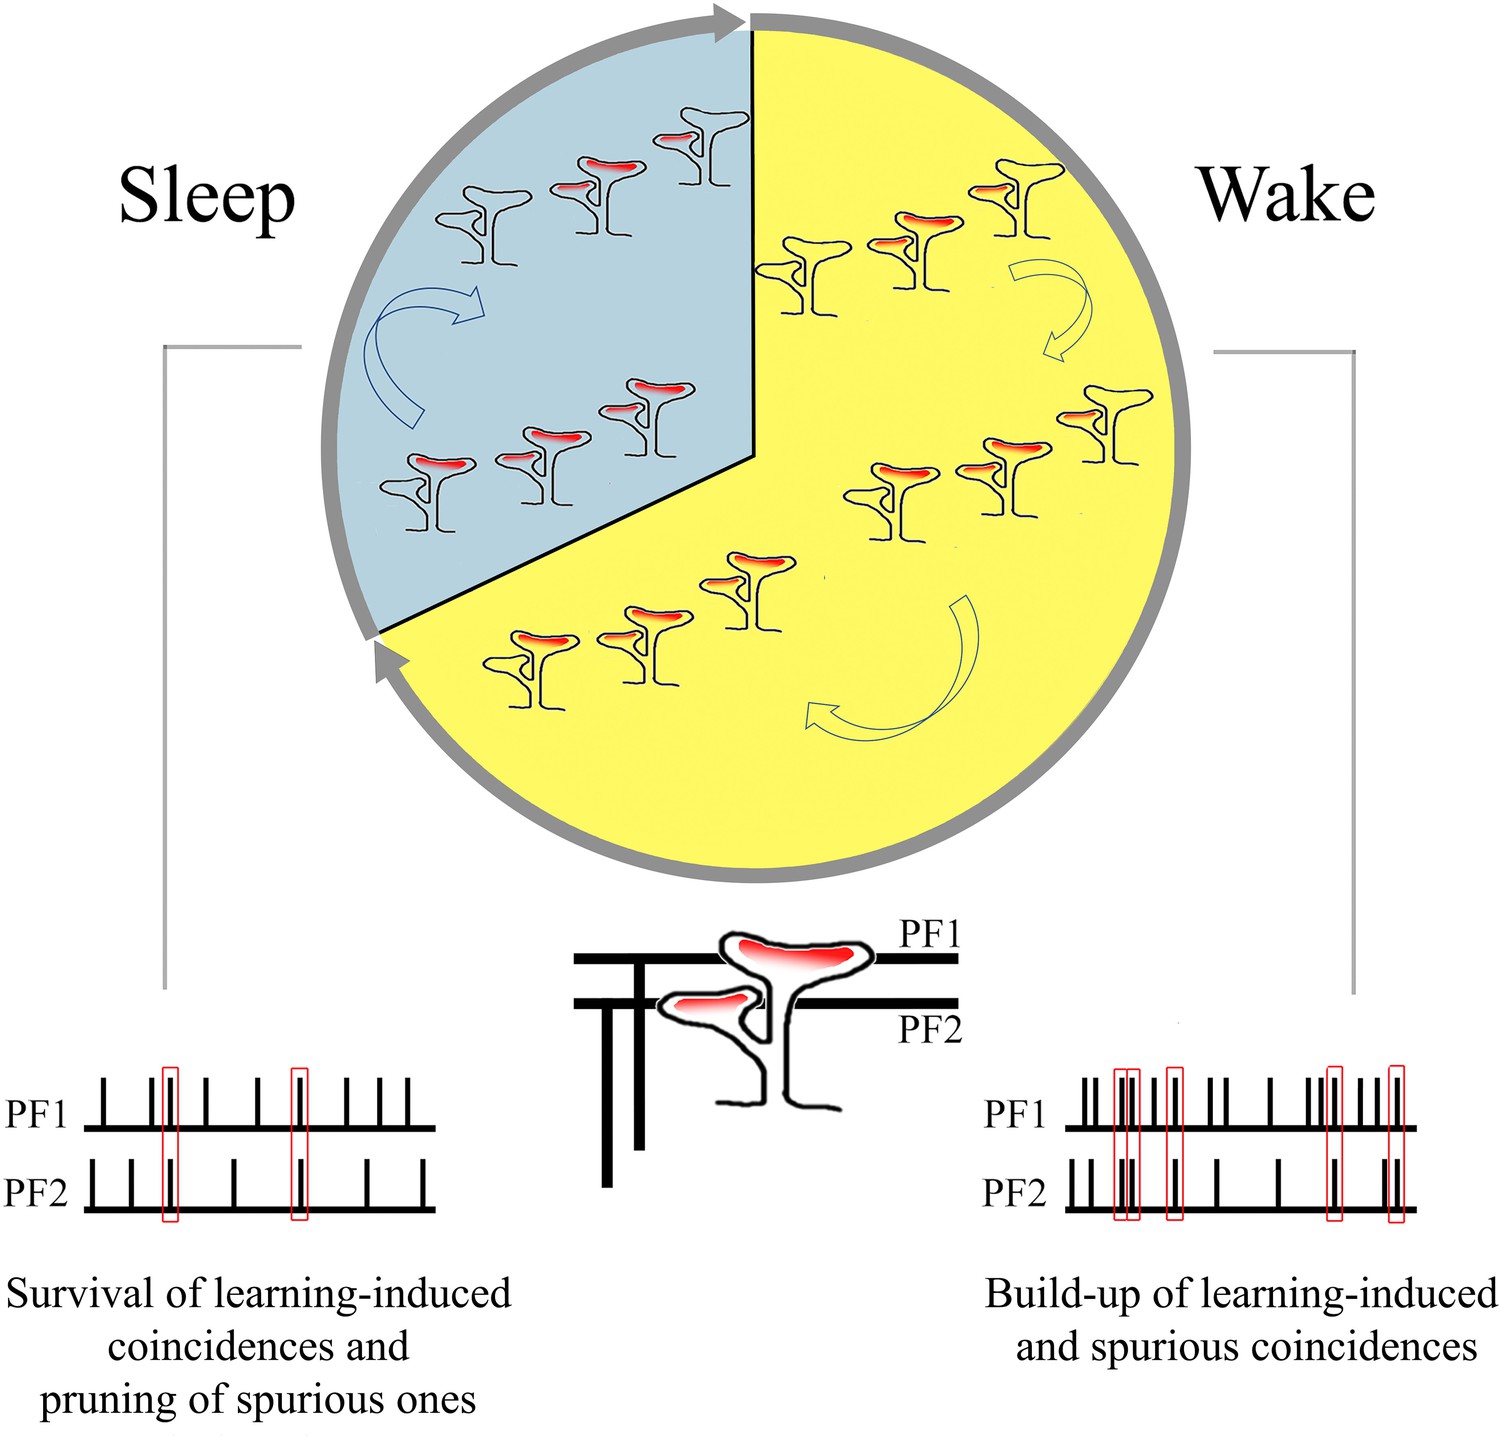
Summary of the main findings: increase in branched synapses in wake compared to sleep and its putative functional consequences.
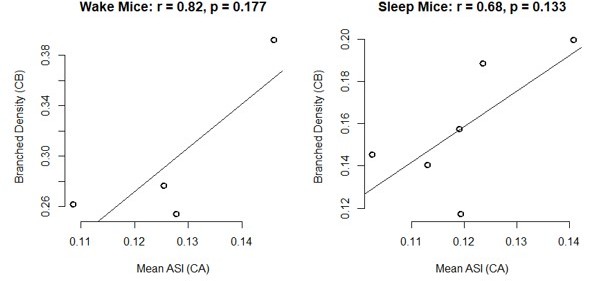
Author response image 1
Tables
Table 1
Parameter estimates for the linear mixed effect (LME) models used to assess changes in dendrite diameter and length.
Residual plots showed no evidence against the assumptions of constant variance and normality.
| LME model – dendrite diameter | |||
|---|---|---|---|
| Random effects | Standard error | ||
| Mouse (intercept) | 0.0680 | ||
| Residual | 0.1500 | ||
| Fixed effects | Level | Estimate | Standard error |
| Intercept | 1.3133 | 0.0459 | |
| Condition | EW (reference) | 0 | 0 |
| W | –0.0024 | 0.0637 | |
| S | 0.0698 | 0.0584 | |
| LME model – dendrite length | |||
| Random effects | Standard error | ||
| Mouse (intercept) | 0.8024 | ||
| Residual | 3.2883 | ||
| Fixed effects | Level | Estimate | Standard error |
| Intercept | 8.7228 | 0.7841 | |
| Condition | EW (reference) | 0 | 0 |
| W | –0.4763 | 1.0734 | |
| S | 0.0007 | 0.9878 | |
Table 2
Summary of ultrastructural measures in the molecular layer of the cerebellum.
Previously reported measures in the hippocampus CA1 region (Spano et al., 2019) and cerebral cortex (de Vivo et al., 2017) are also shown to facilitate the comparison across regions. All protrusions are defined as spines. In oblique spines the axon-spine interface (ASI) could not be measured because the synapse was oriented obliquely or orthogonally to the cutting plane. Standard deviations for the cortex use a pooled estimate based on two sampled regions. MVB, multivesicular body.
| CA1 (stratum radiatum) | Cortex (M1+S1, layer 2) | Cerebellum | |||||||
|---|---|---|---|---|---|---|---|---|---|
| W | EW | S | W | EW | S | W | EW | S | |
| Total N of dendrites | 37 | 26 | 38 | 54 | 57 | 57 | 29 | 24 | 43 |
| Total N of spines | 2764 | 2139 | 3148 | 2919 | 2616 | 2892 | 1944 | 2050 | 3394 |
| Total N of spines with synapse (some incomplete/oblique) | 2702 | 2080 | 3037 | 2467 | 2267 | 2415 | 1861 | 1926 | 3066 |
| Total N spines with synapse with measured ASI | 2552 | 1949 | 2840 | 2180 | 1989 | 2136 | 1766 | 1848 | 3004 |
| ASI (µm2, mean ± std) range (µm2) | 0.128±0.122 0.003–1.033 | 0.130±0.122 0.008–0.764 | 0.120±0.108 0.006–0.672 | 0.299±0.323 0.012–4.019 | 0.290±0.305 0.005–3.543 | 0.248±0.278 0.006–2.038 | 0.187±0.109 0.010–0.702 | 0.158±0.095 0.006–0.569 | 0.174±0.104 0.005–1.113 |
| Dendrite diameter (µm, mean ± std) | 0.60±0.10 | 0.56±0.06 | 0.57±0.09 | 0.89±0.24 | 0.82±0.20 | 0.86±0.25 | 1.31±0.14 | 1.32±0.16 | 1.38±0.19 |
| Dendrite length (µm, mean ± std) | 23.3±5.4 | 23.2±6.9 | 21.9±6.8 | 26.8±5.9 | 23.8±7.5 | 23.7±8.0 | 8.19±2.97 | 8.68±3.00 | 8.66±3.92 |
| Spine density (with/without synapse) by dendrite surface area (#/µm2, mean ± std) | 1.72±0.30 | 2.17±0.33 | 2.00±0.34 | 0.76±0.22 | 0.78±0.23 | 0.84±0.23 | 1.83±0.30 | 2.16±0.44 | 1.97±0.51 |
| Process density (spines without synapse) by dendrite surface area (#/µm2, mean ± std) | 0.04±0.03 | 0.06±0.06 | 0.07±0.08 | 0.12±0.07 | 0.10±0.06 | 0.15±0.09 | 0.08±0.06 | 0.13±0.07 | 0.19±0.10 |
| Synapse density (spines with synapse) by dendrite surface area (#/µm2, mean ± std) | 1.69±0.30 | 2.12±0.34 | 1.93±0.32 | 0.64±0.20 | 0.68±0.22 | 0.69±0.19 | 1.76±0.28 | 2.04±0.41 | 1.78±0.46 |
| Nonperforated synapse density by dendrite surface area (#/µm2, mean ± std) | 1.27±0.26 | 1.72±0.29 | 1.47±0.29 | – | – | – | – | – | – |
| Perforated synapse density by dendrite surface area (#/µm2, mean ± std) | 0.41±0.13 | 0.36±0.10 | 0.44±0.18 | – | – | – | – | – | – |
| Synapse density (spines with synapse) by dendrite length (#/µm, mean ± std) | 3.14±0.60 | 3.69±0.50 | 3.41±0.50 | – | – | – | 7.86±1.39 | 9.07±1.73 | 8.29±1.82 |
| Nonperforated synapse density by dendrite length (#/µm, mean ± std) | 2.38±0.52 | 3.00±0.43 | 2.59±0.35 | – | – | – | – | – | – |
| Perforated synapse density by dendrite length (#/µm, mean ± std) | 0.77±0.23 | 0.63±0.16 | 0.78±0.31 | – | – | – | – | – | – |
| Perforated synapses % of synapses per mouse (mean ± std) | 24.5 ± 1.3% | 17.6 ± 1.9% | 23.2 ± 5.3% | – | – | – | – | – | – |
| Oblique spines % of synapses per mouse (mean ± std) | 4.8 ± 1.7% | 4.7 ± 0.9% | 5.2 ± 2.8% | 8.5 ± 2.2% | 10.8 ± 3.3% | 10.0 ± 1.7% | 7.0 ± 6.0% | 5.6 ± 3.5% | 1.8 ± 2.1% |
| Incomplete synapses (go off the image) % of spines with synapse per mouse (mean ± std) | 1.0 ± 0.9% | 1.7 ± 0.9% | 1.5 ± 1.5% | 2.2 ± 2.2% | 2.8 ± 5.2% | 4.0 ± 4.4% | 0.8 ± 1.5% | 1.2 ± 0.3% | 1.2 ± 0.7% |
| Spines with spine apparatus % of spines with synapse per mouse (mean ± std) | 8.2 ± 0.7% | 10.1 ± 3.1% | 13.5 ± 3.5% | 30.1 ± 4.0% | 29.2 ± 2.5% | 26.1 ± 4.5% | 2.2 ± 3.6% | 6.4 ± 9.8% | 1.8 ± 3.1% |
| Spines with endosome/s % of spines with synapse per mouse (mean ± std) | 34.8 ± 9.4% | 42.9 ± 12.4% | 41.3 ± 9.5% | 46.4 ± 11.1% | 67.2 ± 8.0% | 57.5 ± 10.0% | 96.3 ± 7.4% | 98.9 ± 1.5% | 99.8 ± 0.5% |
| Synapses with coated vesicle % of spines with synapse per mouse (mean ± std) | 2.8 ± 2.2% | 2.9 ± 1.3% | 1.8 ± 1.1% | 2.5 ± 1.8% | 4.3 ± 3.2% | 2.6 ± 1.7% | 1.5 ± 1.9% | 0.2 ± 0.2% | 0.1±0.2% |
| Synapses with spinula % of spines with synapse per mouse (mean ± std) | 19.4 ± 1.9% | 10.1 ± 3.8% | 14.0 ± 3.2% | 1.7 ± 2.0% | 1.3 ± 1.4% | 1.1 ± 0.5% | 1.6 ± 1.0% | 10.3 ± 13.5% | 22.7 ± 16.6% |
| Synapses with MVB % of spines with synapse per mouse (mean ± std) | 5.3 ± 2.3% | 2.7 ± 3.2% | 3.4 ± 3.2% | 6.4 ± 3.5% | 6.6 ± 2.9% | 3.3 ± 2.2% | 3.4 ± 4.1% | 5.7 ± 8.0% | 2.8 ± 3.9% |
| Synapses with presynaptic mitochondrion % of spines with synapse per mouse (mean ± std) | 30.3 ± 2.1% | 30.3 ± 3.7% | 31.6 ± 3.6% | 34.7 ± 4.2% | 35.1 ± 2.1% | 33.7 ± 3.3% | 58.0 ± 1.9% | 61.8 ± 7.5% | 57.3 ± 4.4% |
| Branched synapses % of spines with synapse per mouse (mean ± std) | 15.0 ± 3.7% | 15.8 ± 4.9% | 13.5 ± 1.6% | 13.9 ± 6.1% | 12.2 ± 3.2% | 13.7 ± 3.1% | 17.8 ± 3.3% | 21.0 ± 7.4% | 14.1 ± 2.4% |
Table 3
Parameter estimates for the linear mixed effect (LME) models used to assess changes in spine densities and proportions.
A square-root transformation was applied to each model. Residual analysis showed no evidence against normality or constant variance assumption.
| Spine density (all spines) − sqrt(#/area) | |||
|---|---|---|---|
| Random effects | Standard error | ||
| Mouse (intercept) | 0.0618 | ||
| Residual | 0.1426 | ||
| Fixed effects | Level | Estimate | Standard error |
| Intercept | 1.4681 | 0.0426 | |
| Condition | EW (reference) | 0 | 0 |
| W | –0.1140 | 0.0590 | |
| S | –0.0757 | 0.0542 | |
| Spine density (spines with synapse) − sqrt(#/area) | |||
| Random effects | Standard error | ||
| Mouse (intercept) | 0.0605 | ||
| Residual | 0.1349 | ||
| Fixed effects | Level | Estimate | Standard error |
| Intercept | 1.4241 | 0.0412 | |
| Condition | EW (reference) | 0 | 0 |
| W | –0.0994 | 0.0569 | |
| S | –0.1002 | 0.0522 | |
| Spine density (branched synapses) − sqrt(#/area) | |||
| Random effects | Standard error | ||
| Mouse (intercept) | 0.0350 | ||
| Residual | 0.1760 | ||
| Fixed effects | Level | Estimate | Standard error |
| Intercept | 0.5920 | 0.0401 | |
| Condition | EW (reference) | 0 | 0 |
| W | –0.0934 | 0.0547 | |
| S | –0.2281 | 0.0503 | |
| Spine density (spines without synapse) − sqrt(#/area) | |||
| Random effects | Standard error | ||
| Mouse (intercept) | 0.0387 | ||
| Residual | 0.1027 | ||
| Fixed effects | Level | Estimate | Standard error |
| Intercept | 0.3443 | 0.0286 | |
| Condition | EW (reference) | 0 | 0 |
| W | –0.0791 | 0.0395 | |
| S | 0.0760 | 0.0363 | |
| Proportion of spines without synapse − sqrt(# without/# total) | |||
| Random effects | Standard error | ||
| Mouse (intercept) | 0.0270 | ||
| Residual | 0.0642 | ||
| Fixed effects | Level | Estimate | Standard error |
| Intercept | 0.2331 | 0.0189 | |
| Condition | EW (reference) | 0 | 0 |
| W | –0.0386 | 0.0240 | |
| S | 0.0674 | 0.0262 | |
| Proportion of synapses with spinula – sqrt(# with spinula/# total) | |||
| Random effects | Standard error | ||
| Mouse (intercept) | 0.1285 | ||
| Residual | 0.0898 | ||
| Fixed effects | Level | Estimate | Standard error |
| Intercept | 0.4276 | 0.0669 | |
| Condition | EW (reference) | 0 | 0 |
| W | –0.1730 | 0.0944 | |
| S | 0.0733 | 0.0862 | |
Table 4
Parameter estimates for the linear mixed effect (LME) models used to assess changes in axon-spine interfaces (ASI).
A square-root transformation was applied to the ASI values to ensure the residuals had an approximate Gaussian distribution. Residual analysis showed only minor departures from normality and constant variance in the ASI models, and no evidence against the assumptions in the cumulative ASI model.
| ASI − sqrt(ASI) | |||
|---|---|---|---|
| Random effects | Standard error | ||
| Dendrite (intercept) | 0.0134 | ||
| Mouse (intercept) | 0.0164 | ||
| Residual | 0.1219 | ||
| Fixed effects | Level | Estimate | Standard error |
| Intercept | 0.3797 | 0.0227 | |
| Dendrite diameter | Continuous (linear) | –1e-7 | 2e-5 |
| Condition | EW (reference) | 0 | 0 |
| W | 0.0331 | 0.0129 | |
| S | 0.0197 | 0.0118 | |
| ASI (with branched) – sqrt(ASI) | |||
| Random effects | Standard error | ||
| Dendrite (intercept) | 0.0132 | ||
| Mouse (intercept) | 0.0168 | ||
| Residual | 0.1217 | ||
| Fixed effects | Level | Estimate | Standard error |
| Intercept | 0.3812 | 0.0227 | |
| Dendrite diameter | Continuous (linear) | 7e-7 | 2e-5 |
| Condition | EW (reference) | 0 | 0 |
| W | 0.0333 | 0.0132 | |
| S | 0.0184 | 0.0120 | |
| Branched | No (reference) | 0 | 0 |
| Yes | –0.0217 | 0.0052 | |
| ASI density (sum ASI/surface area) | |||
| Random effects | Standard error | ||
| Mouse (intercept) | 0.0425 | ||
| Residual | 0.0608 | ||
| Fixed effects | Level | Estimate | Standard error |
| Intercept | 0.3159 | 0.0247 | |
| Condition | EW (reference) | 0 | 0 |
| W | –0.0042 | 0.0349 | |
| S | –0.0131 | 0.0316 | |
Additional files
-
MDAR checklist
- https://cdn.elifesciences.org/articles/84199/elife-84199-mdarchecklist1-v1.docx
-
Source data 1
- https://cdn.elifesciences.org/articles/84199/elife-84199-data1-v1.zip
-
Source data 2
Synapse data used for Figure 5.
- https://cdn.elifesciences.org/articles/84199/elife-84199-data2-v1.zip
Download links
A two-part list of links to download the article, or parts of the article, in various formats.
Downloads (link to download the article as PDF)
Open citations (links to open the citations from this article in various online reference manager services)
Cite this article (links to download the citations from this article in formats compatible with various reference manager tools)
Ultrastructural effects of sleep and wake on the parallel fiber synapses of the cerebellum
eLife 11:e84199.
https://doi.org/10.7554/eLife.84199


