Connectomics of the Octopus vulgaris vertical lobe provides insight into conserved and novel principles of a memory acquisition network
- Department of Neurobiology, Silberman Institute of Life Sciences, The Hebrew University, Israel
- Department of Molecular and Cellular Biology, Harvard University, United States
- Faculty of Marine Sciences, Ruppin Academic Center, Israel
Figures
Figure 1 with 4 supplements
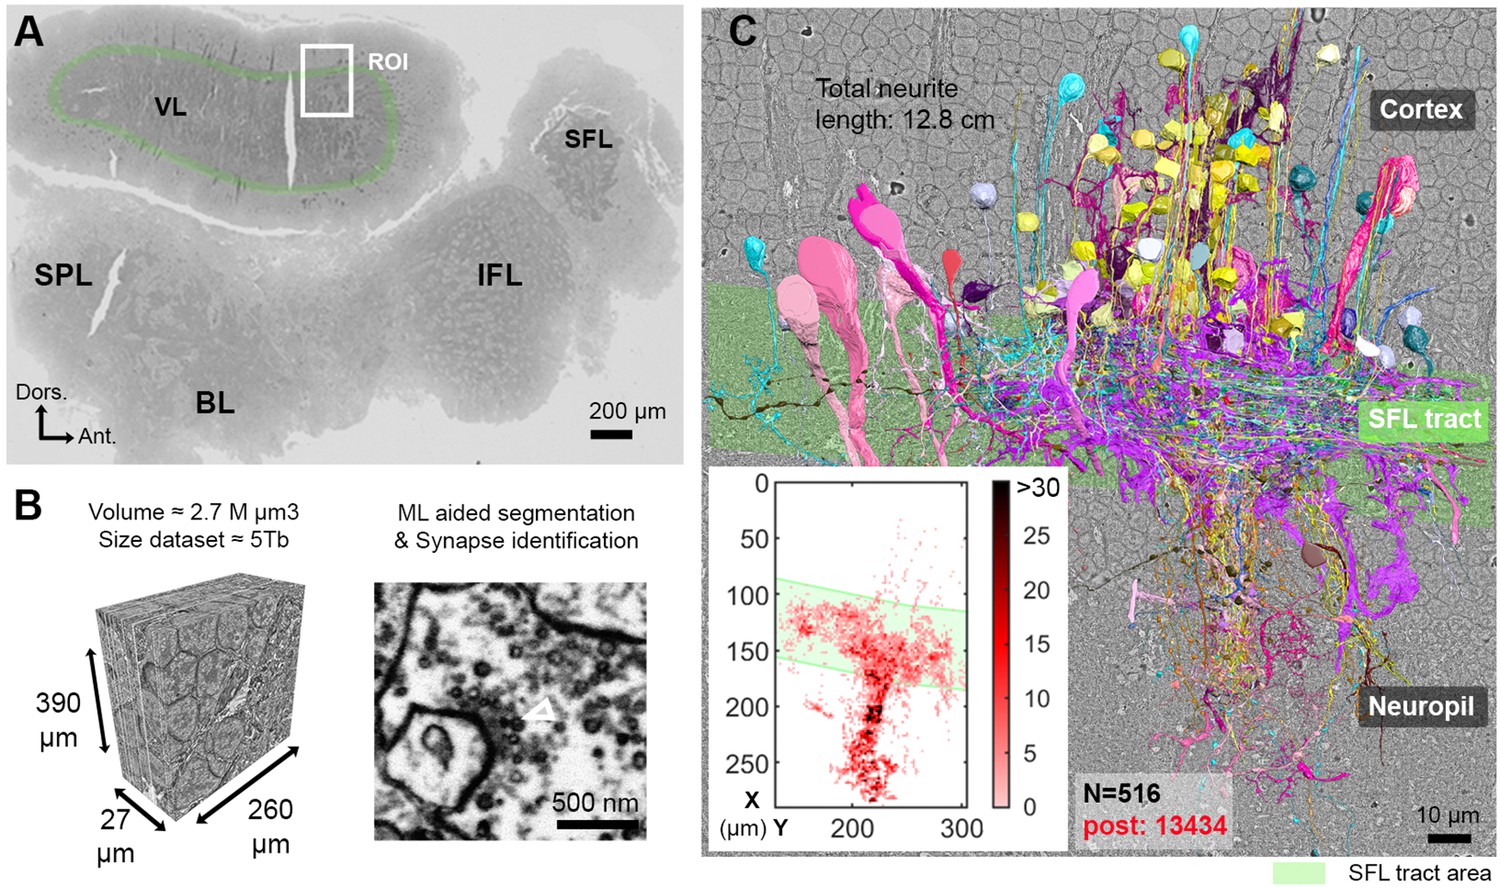
Reconstruction of octopus VL circuits using volume EM.
(A) Low-resolution image of the octopus central nervous system. The VL lies dorsally in the supraesophageal part of the central brain. The region of interest marked within it (ROI, white rectangle) was scanned with a scanning electron microscope (SEM) at 4 nm/pixel. The approximate position of the SFL tract area (green) is shown for orientation and demarcating of the outer and the inner neuropils. (B) 30 nm sections were aligned in a traceable 3D stack for machine learning (ML) aided by manual segmentation and synapse annotation. (See also Figure 1—video 1). Chemical synapses were identified by the presence of a cluster or ‘cloud’ of synaptic vesicles (sv) associated with a pale active zone near the presynaptic membrane. The white empty triangle shows the cluster of sv within the presynaptic elements in the electron micrograph. Synapses were annotated if the accumulation of sv persisted through at least three sections in a row (90 nm). Consistent with previous studies (Gray and Young, 1964; Gray, 1970), none of the chemical synapses displayed a clear postsynaptic density (PSD). (C) The 516 reconstructed cell processes are colored according to cell type (See Figure 1—animation 1 – for all cell types). Total neurite length of the reconstructed cells was 12.8 cm. Reconstructed cells are superimposed on a single EM image. Inset: spatial distribution of the 13,434 postsynaptic sites (post) annotated on the 516 cells presented as a heat-map. Abbreviations: BL, basal lobe; IFL, inferior frontal lobe; SFL, superior frontal lobe; SPL, subpedunculate lobe; VL, vertical lobe. See also Figure 1—figure supplement 1 and Figure 1—figure supplement 2.
Figure 1—figure supplement 1

Three neural elements with yet unclear relationships with the vertical lobe (VL) connectome.
Aside from the seven cell types highly involved in the VL connectivity, our reconstruction revealed the existence of (A) putative interneurons of the VL displaying a neurite with both pre – and postsynaptic sites, which we termed ‘mix cells’. They were poorly represented in the reconstructed volume and without clear involvement in the core connectivity of the VL wiring diagram. (B) In the inner cortex, cells with elongated cell body, irregular nuclear shape, and a very short projection were nested in each other. Juxtaposed onto these cells were other cells with round cell body and short trunk directed inwards that lacked synaptic connections and terminated with filopodia typical of axon growth cones. Although no cell division was observed, these cells morphologically resemble progenitor cells. (C) Although rare, we identified at least two types of protoplasmic glia cells contained within the cortex and widely spread astrocyte-like glia restricted to the superior frontal lobe (SFL) tract. Some putative fibrous glia were also observed.
Figure 1—figure supplement 2
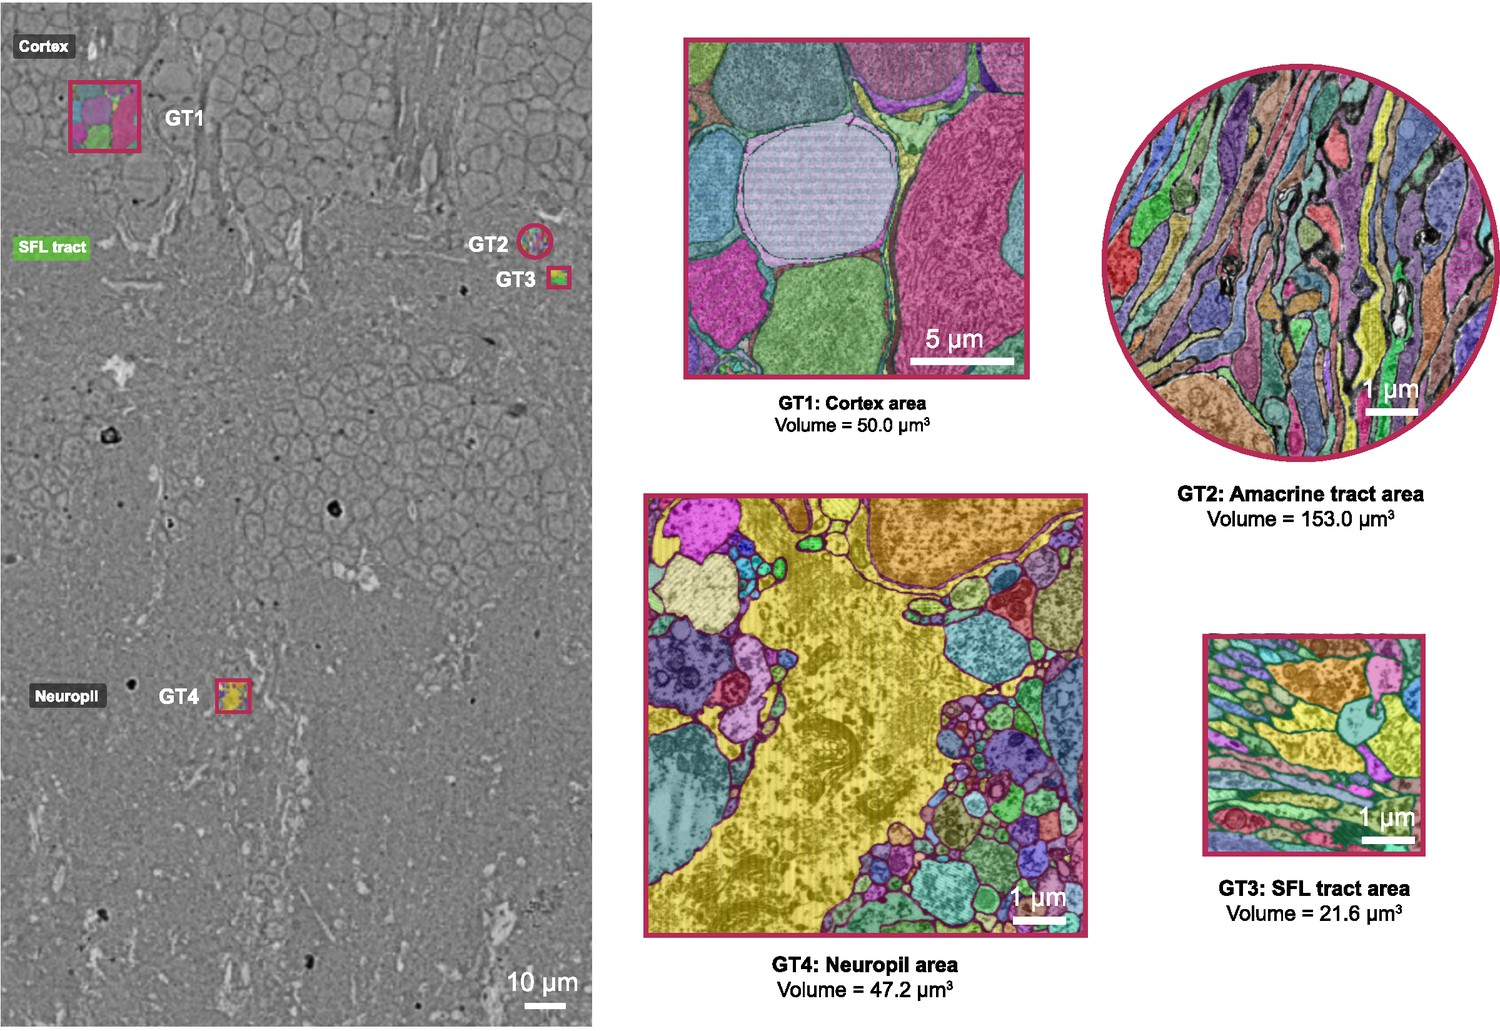
Ground truth incorporated in the training dataset.
Four distinct areas were chosen to represent the diversity of the octopus vertical lobe (VL) ultrastructure: cortex, amacrine tract, superior frontal lobe (SFL) tract, and neuropil. For each area, an expert annotator carefully painted the cytoplasm of cells using distinct colors. This procedure required careful annotation and a correct evaluation of the 3D morphology of cells. Image processing was later used to turn this multi-label set into a ground truth comprising only the boundary categories. This was used to train the deep learning model (see Methods).
Figure 1—video 1
Vertical lobe electron microscopy (EM) volume (260 × 390 × 27 µm) imaged with 4 nm resolution in backscattered electrons mode.
A beam current of 3.2 nA, acceleration voltage of 7 kV and a dwell time of 200 ns/pixel were used. Sections through the region of interest (ROI) volume are shown in sequence.
Figure 1—animation 1
Vertical lobe (VL) neural elements.
Movie shows all neural elements reconstructed in the VL volume and subdivision into neural types according to morphology, ultrastructure, and synaptic connectivity. Only neurons that were sufficiently contained within the reconstructed volume were assigned a cell identity and are represented here.
Figure 2 with 1 supplement
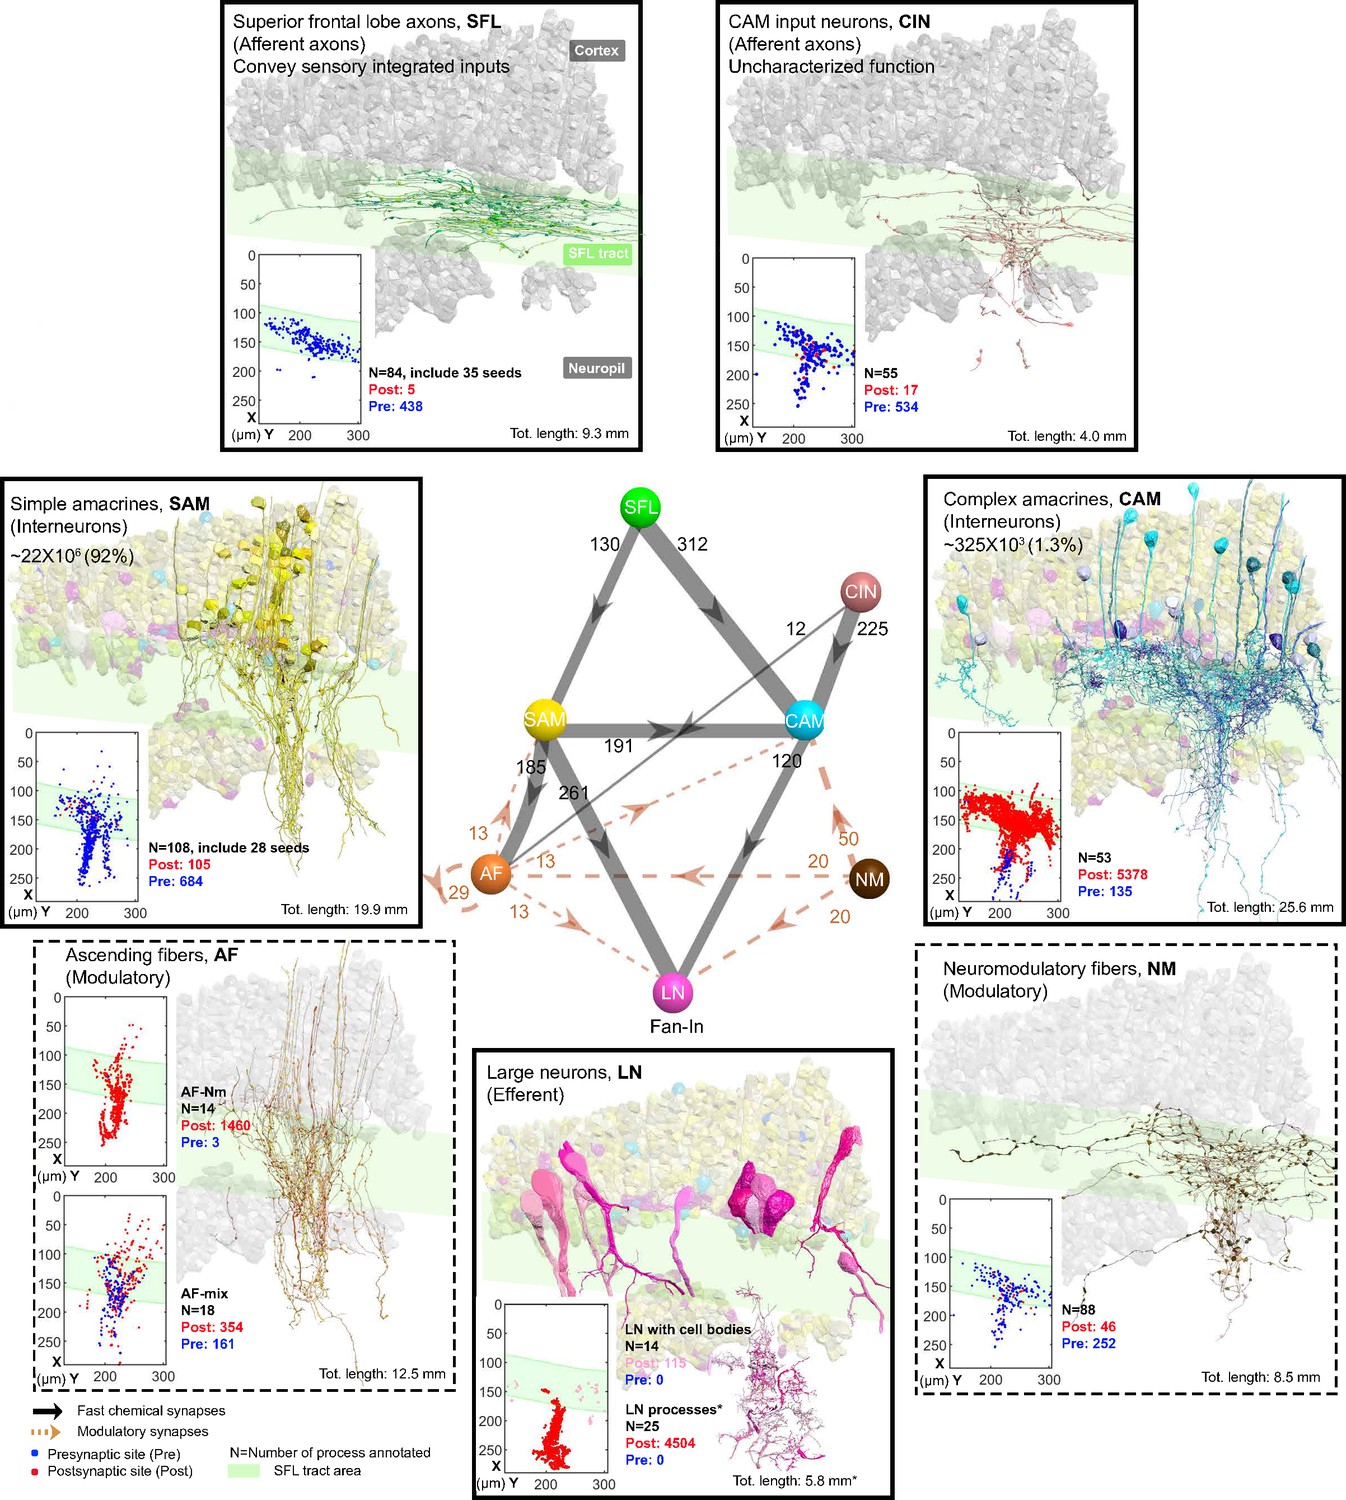
The seven neuronal cell types are classified in the region of interest (ROI) and their wiring diagram.
The middle panel shows the wiring diagram, and the other panels depict the reconstruction of the seven neuronal cell types (superimposed on the vertical lobe (VL) cortex) together with the spatial distribution of their postsynaptic sites (red puncta) and presynaptic sites (blue puncta) within a portion of the ROI. Panels framed with a solid line represent neuronal elements involved in fast transmission (superior frontal lobe: SFL, CAM-input-neurons: CIN, simple AM: SAM, complex AM: CAM, large efferent neurons: LN). Panels framed with a dashed line represent neuromodulatory elements (ascending fibers: AF and neuromodulatory fibers: NM). The approximate position of the SFL tract area (green) is shown for orientation and demarcating the outer from the inner neuropil. In the central panel, each gray solid edge represents fast chemical synapses, and the arrowhead shows the direction of these synapses; line width indicates the relative number of synapses calculated from the number of connections annotated (noted next to each outgoing arrow). Orange dashed edges indicate chemical synapses observed with modulatory processes. Edges are given only if more than 10 synapses were annotated. The VL wiring diagram is characterized by two parallel and interconnected feedforward networks in which two afferents, the parallel SFL axons (green) that convey secondary visual features and a fiber that Gray speculated is associated with ‘pain’ (CIN-dark pink) innervate two distinct populations of amacrine interneurons, the simple amacrines (SAMs - yellow) and the newly discovered complex amacrines (CAMs - cyan). The large neuron processes (LN-magenta) provide the convergence element of the VL fan-in connectivity architecture and are the only VL output. Additionally, the circuit is supplied by a large network of likely modulatory processes: the ‘ascending fibers’ (AF-orange) and the neuromodulatory fibers (NM-brown). The connectivity among neurons in the VL is feedforward; neural activity is transmitted in one direction between populations of neurons without any feedback sub-circuitry among neurites (p<0.05 – see Methods, Analysis of feed-forwardness), except for a few bidirectional (reciprocal) synapses between AFs (modulatory). See Figure 2—figure supplement 1 for neurite level analysis.
Figure 2—figure supplement 1
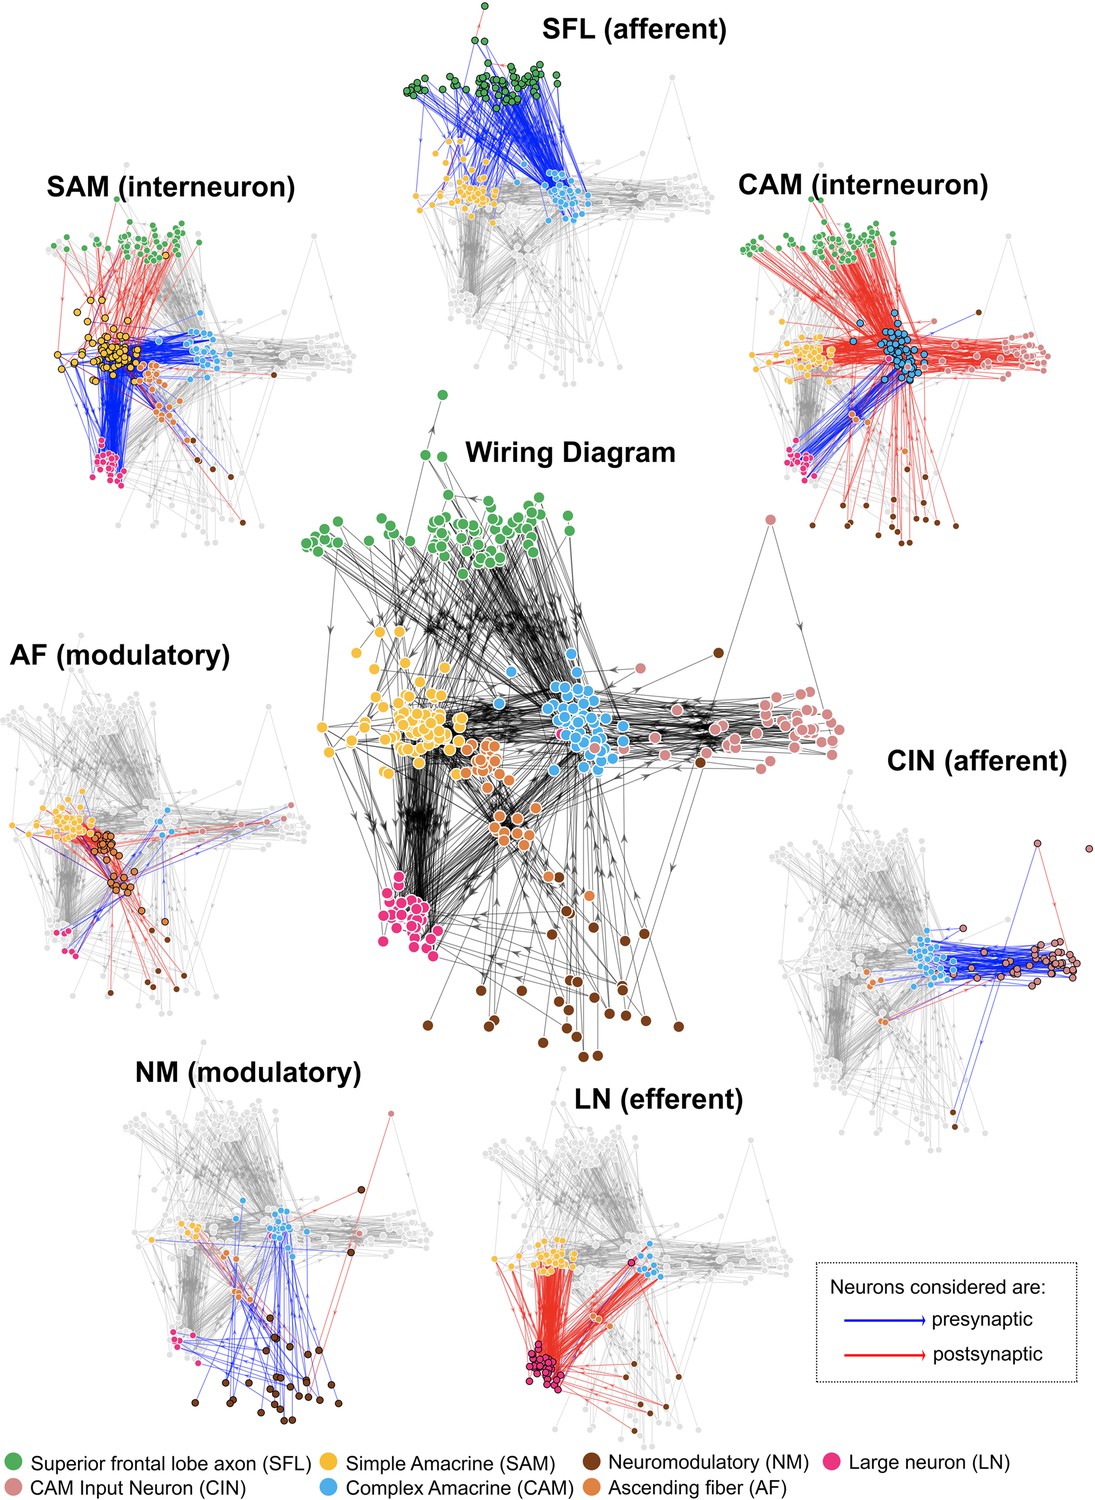
Wiring diagram at the neurite level (middle panel) surrounded by the panels of each of the seven cell types depicting their connectivity.
Each arrow represents the direction of a chemical synapse and the line color indicates the direction of connection: synaptic inputs (red) and outputs (blue). Connections were derived from synaptic annotations based on identified connections between the reconstructed cells and nodes were similarly positioned based on their connectivity (see Methods).
Figure 3 with 2 supplements
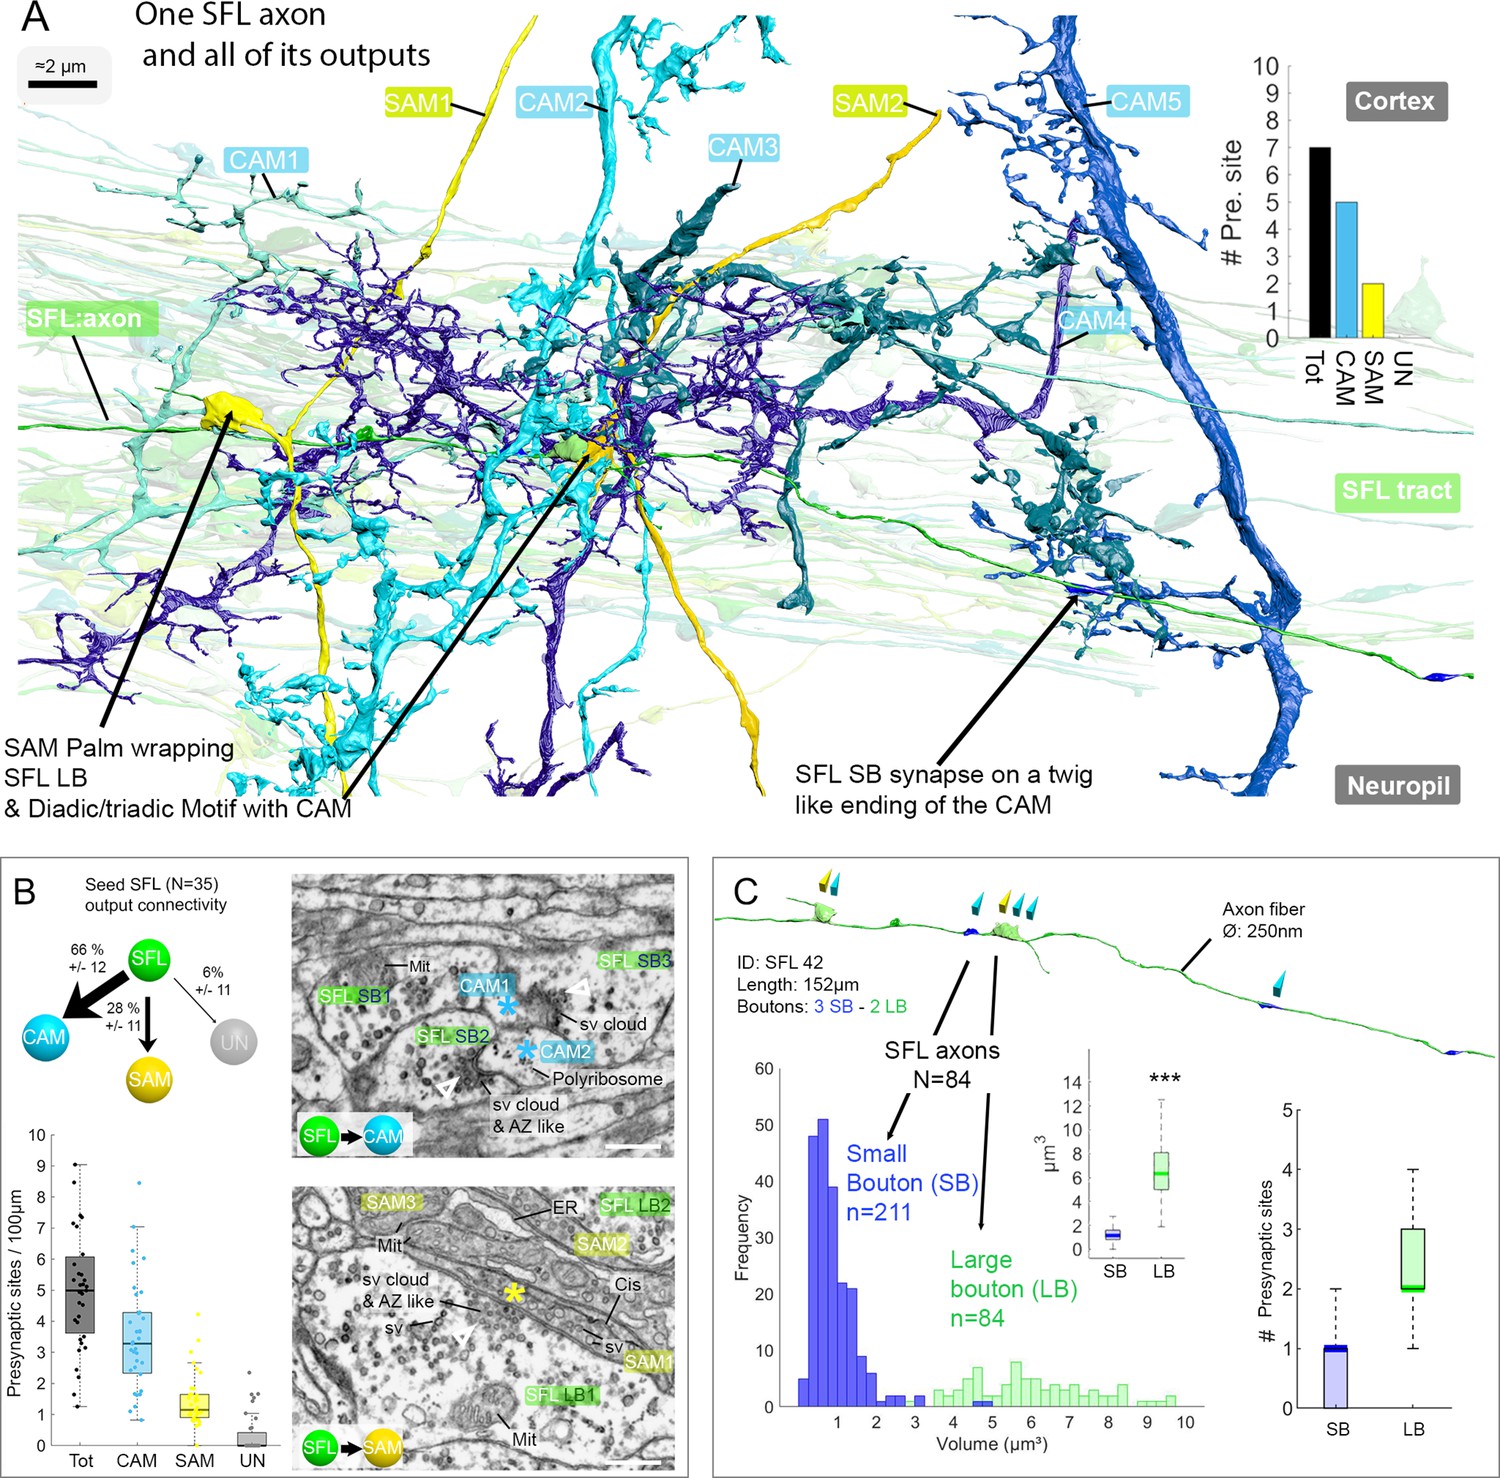
The SFL axons synapse onto the two populations of amacrine interneurons (simple AMs: SAMs and complex AMs: CAMs) via two distinct populations of presynaptic boutons.
(A) Reconstruction of a single SFL axon (green) and its seven en passant outputs within the reconstructed volume: five CAMs (various blue hues) and two SAMs (yellow) superimposed on the 84 reconstructed SFL axons. (B) Quantification of the synaptic outputs of the seed SFL axons (n=35) revealed two main targets, the SAMs (via large boutons - LB) and the CAMs (via small boutons - SB), and a small portion of connections onto unidentified cell types (UN). Upper left shows the distribution of connections in percent. The box plot bottom left shows the number of different presynaptic sites along the 35 SFL axons (per100μm). On the right are high-resolution EM images of the two main SFL synaptic outputs onto SAM and CAM. 1 nm/pixel, dwell time: 200 μs. Scale bar, 500 nm. Empty triangle and asterisk are respectively pre- and postsynaptic profiles. The SFL axons synapse onto the CAMs via their small boutons and large boutons, and onto the SAM exclusively via their large boutons. (C) Example of the distribution of the presynaptic outputs of an SFL axon. This SFL axon synapses onto two SAMs (yellow triangles) and five CAMs (light blue triangles). The histogram displays the bimodal distribution of bouton volumes of 84 SFL axons into the two populations of SFL boutons: small (small boutons: SB-blue) and large (large boutons: LB-green). See the box plot showing the significant difference in volume between the SB (associated only with the CAMs) and the LB (associated with at least one SAMs palm and often involved in dyadic or triadic arrangement with a CAM). The box plot of presynaptic sites per SB and LB reveals their monosynaptic and multisynaptic nature, respectively. Asterisks indicate statistical significance ***p<0.001, **<0.01. Abbreviations: sv, synaptic vesicles; AZ-like, active zone-like; Mit, mitochondria, Cis, cisternae; tER, transport endoplasmic reticulum. See also Figure 3—figure supplement 1 and Figure 3—video 1.
Figure 3—figure supplement 1
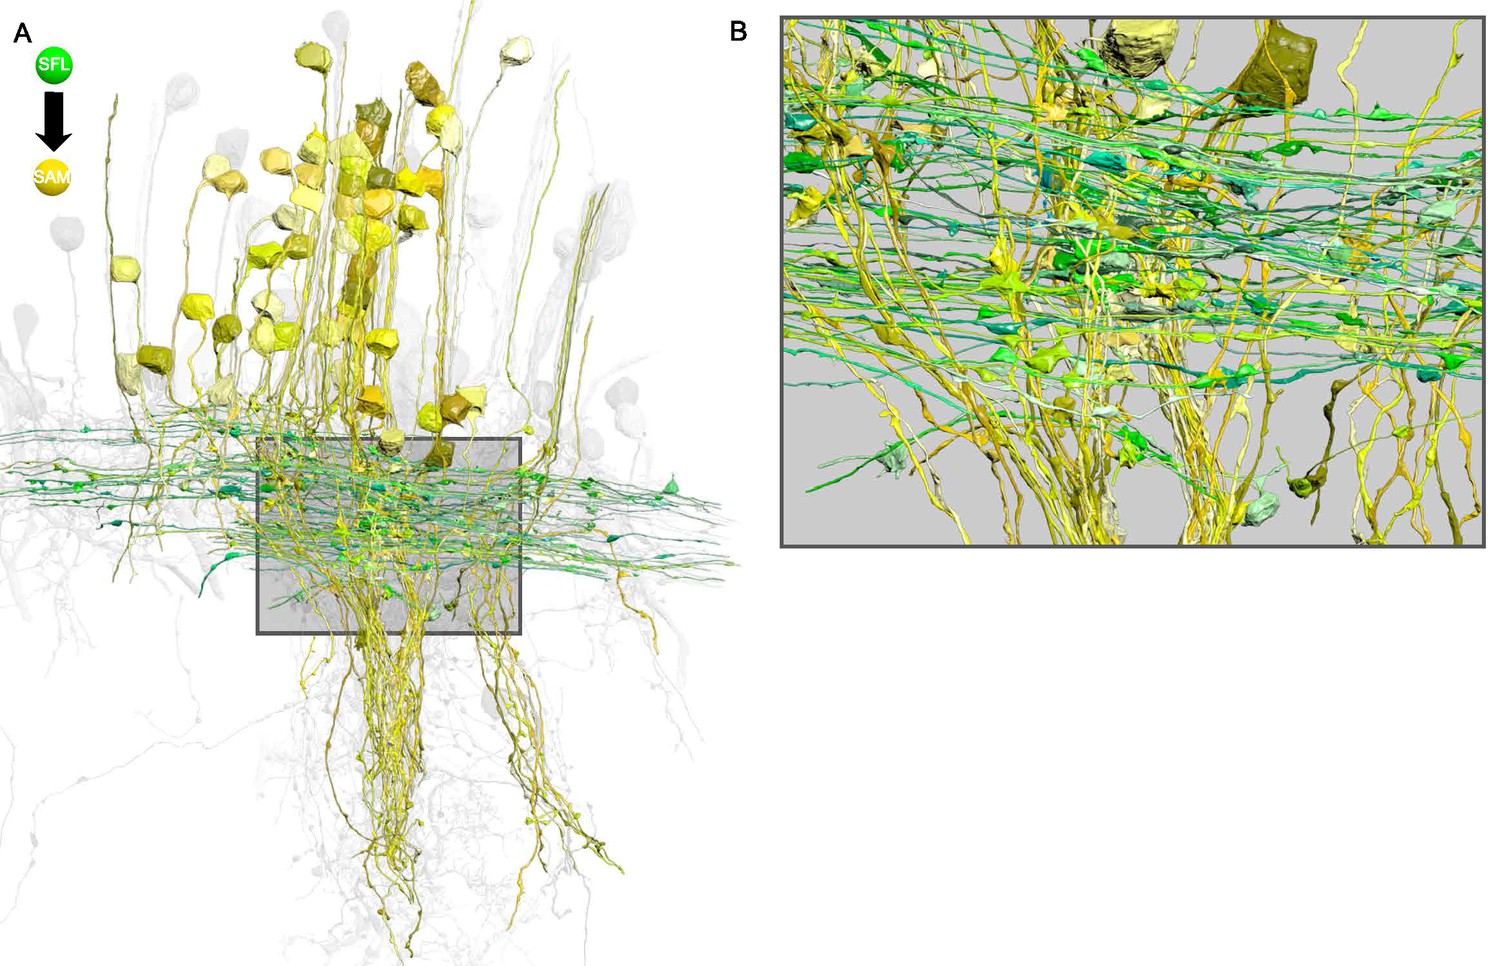
The superior frontal lobe (SFL) axons form en passant connections at their large boutons with the SAMs' palms in a perpendicular arrangement.
(A) The simple AMs (SAMs) (yellow; n=108) and the superior frontal lobe (SFL) axons (green; n=84) form a cruciform connection within the SFL tract. Notice the SFL axons running in parallel that cross the SAMs neuritic trunks perpendicularly. (B) Detail of A. The SFL large boutons can be seen synapsing onto the SAMs palm that constitutes the single input of these cells. Reconstructions are superimposed on a grayscale representation of the 516 reconstructed cells.
Figure 3—video 1
One segmented superior frontal lobe (SFL) axon tracked within vertical lobe electron microscopy (EM) volume (260 × 390 × 27 µm) that was imaged with 4 nm resolution in backscattered electrons mode; a 3.2 nA beam current at 7 kV incident electron energy, and a dwell time of 200 ns/pixel were used.
Figure 4
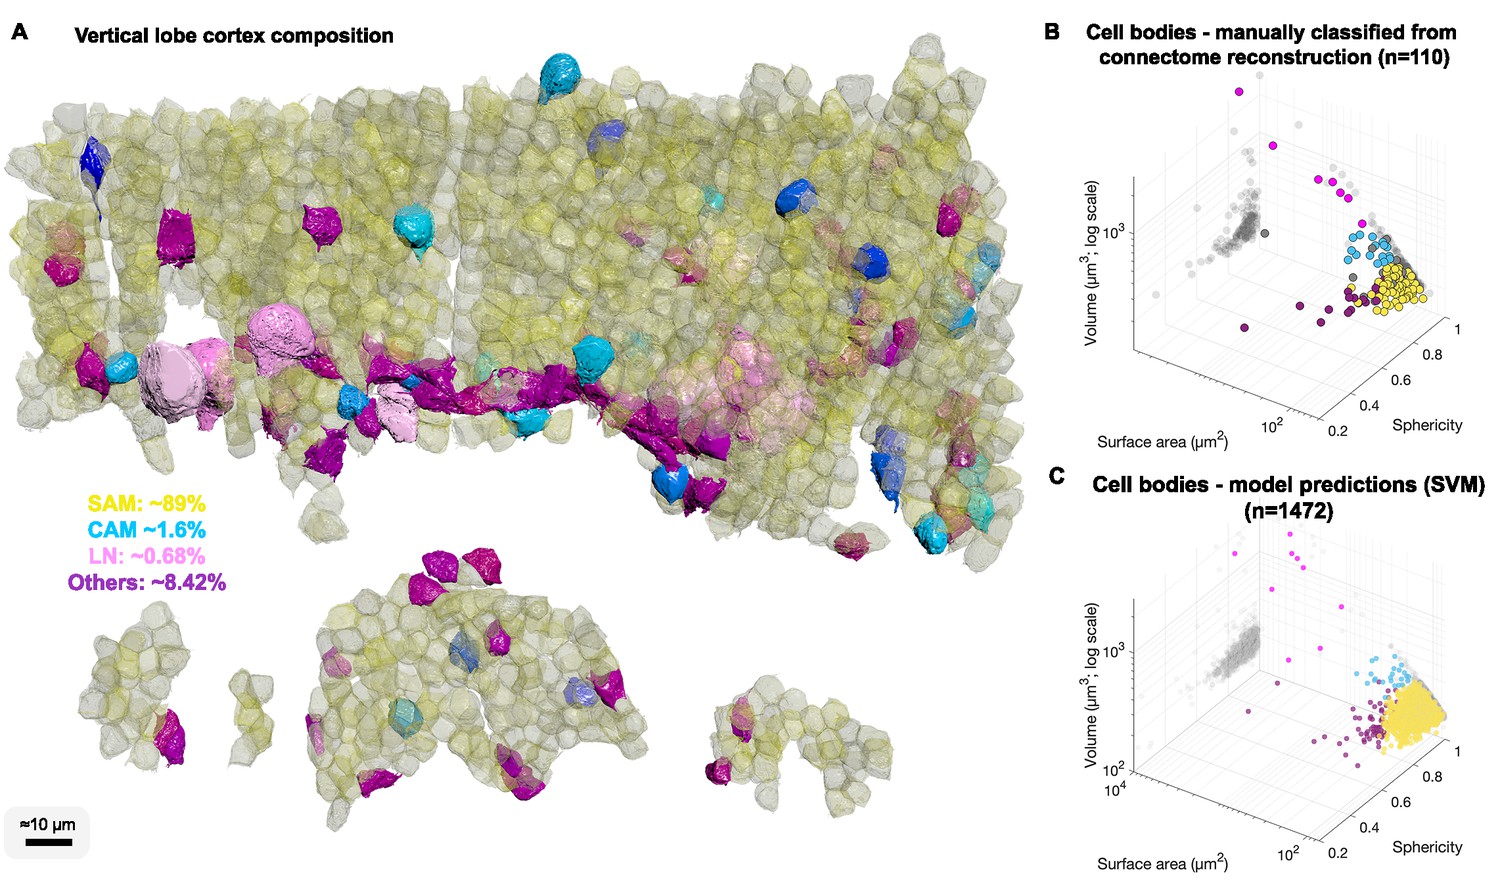
Cell body composition of vertical lobe (VL) cortex.
(A) A subset of 1472 densely packed cell bodies were reconstructed and automatically classified based on their morphology; simple AM: SAM, yellow; complex AM: CAM, blue hues; large efferent neuron : LN, pink; Others, purple. (B, C) The classifier was designed to capture an observed correlation between cell type and cell body geometry. Roundish, relatively smaller cell bodies were associated with SAMs (vol 207.7 ± 26 µm³, mean ± SD). Larger and slightly more elongated cell bodies were associated with CAMs (vol 337.1 ± 41.6 µm³). Considerably larger cell bodies were associated with highly variable volumes with LNs (volume range 464–2850 µm³). Elongated cell bodies were associated with other cell types including glia and uncharacterized cells. A Support Vector Machine (SVM) was trained to separate four cell categories SAM, CAM, LN, and Others on a set of 110 manually classified cells based on three features: volume, sphericity, and surface area, and was validated on an independently prepared set with 47 cells (94.55% training accuracy; 4.01% error on the validation set, all associated with SAMs).
Figure 5
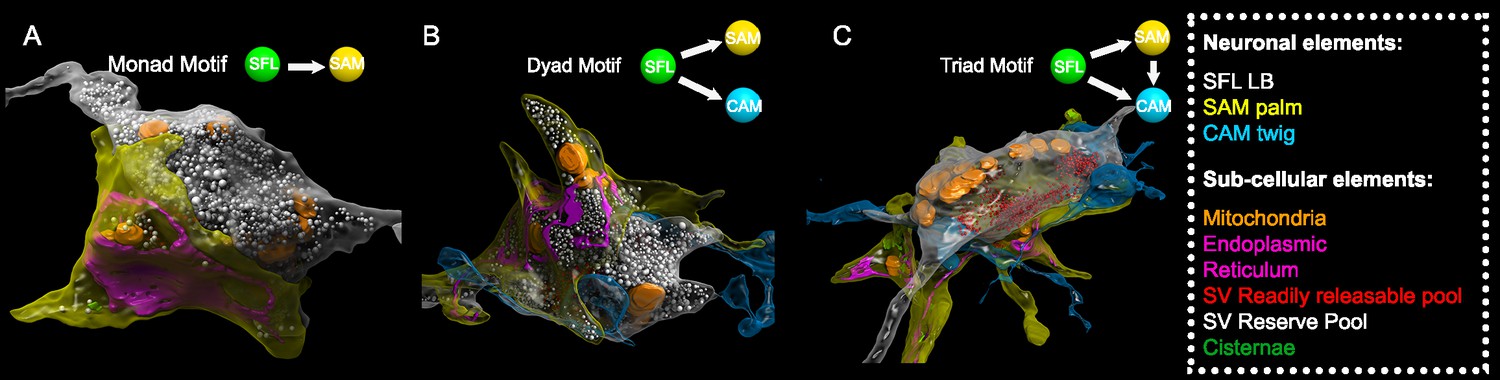
Superior frontal lobe (SFL) large boutons (LBs) are found in multisynaptic motifs forming a synaptic glomerulus involving serial connectivity with both simple AMs (SAMs) and complex AMs (CAMs).
Subcellular 3D reconstruction illustrating the main motifs involving the large varicosity of the SFL axon, which contains glutamate and makes en passant synapses. (A) monad (B) dyad, and (C) triad. Note that in (C) only the presumably ‘readily releasable pool’ of synaptic vesicles is shown for clarity as otherwise the large ‘reserve’ pool in the SFL LB (>5000 synaptic vesicles) would obscure other components of the image. The SFL LB was always partly wrapped by at least one SAM palm (yellow), and they often additionally synapsed onto a twig-like postsynaptic CAM ending (blue).
Figure 6 with 4 supplements
Stereotypic superior frontal lobe (SFL) (‘mononeural’)-input to the simple AMs (SAMs) and multiple (‘polyneuronal’) inputs to the complex AMs (CAMs).
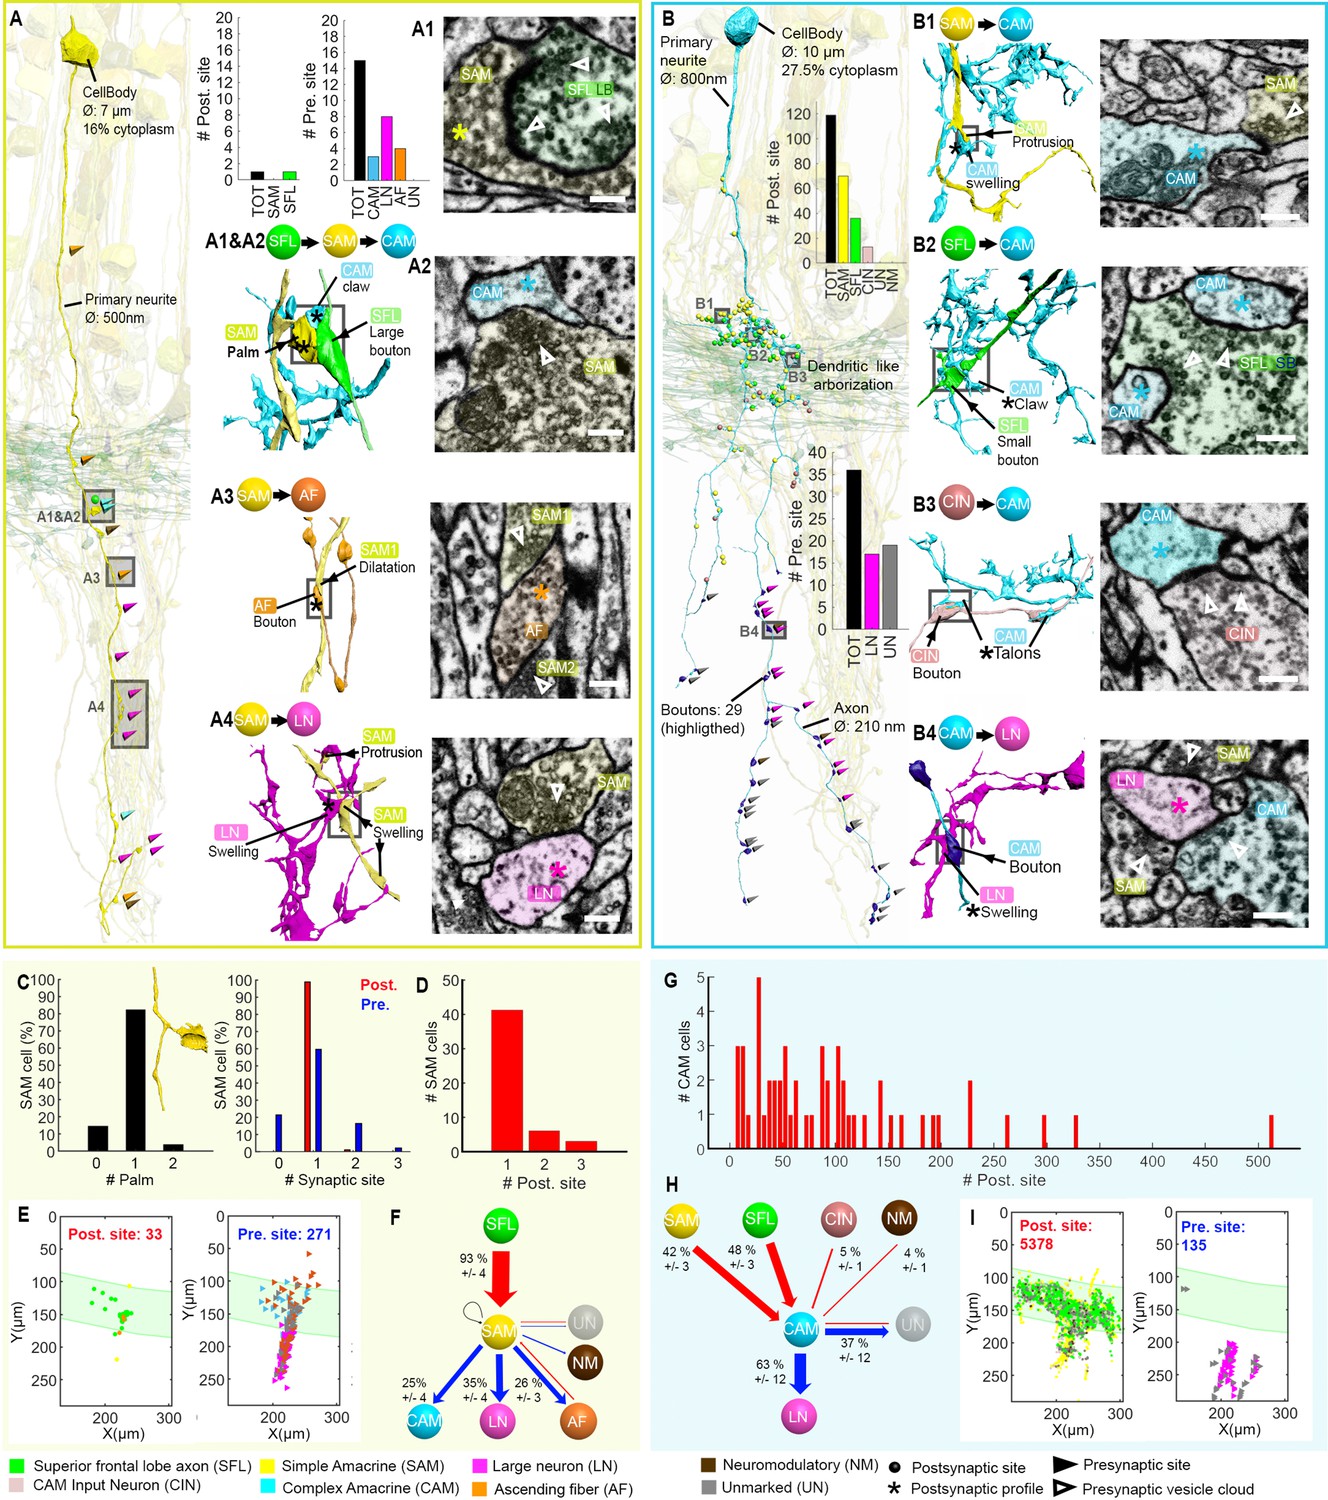
(A,B) 2D projection of a reconstructed SAM (A-yellow) and CAM (B-cyan), superimposed on a reconstruction of the SFL tract (green) and several SAMs (yellow). Triangles and puncta represent presynaptic output and postsynaptic input sites, respectively, color-coded according to pre- or postsynaptic partner. The insets show the corresponding electron microscopy (EM) cross-section of each synapse type. The morphological arrangement of the corresponding synaptic connection is depicted in the colored connectivity scheme next to each image and morphological reconstructions in the corresponding cells’ color code (scale bar = 500 nm). (C) Analysis of the number of inputs onto the SAM ‘palm’ and its pre- and postsynaptic morphological specialization. 82% of SAMs had only one palm, each receiving just one input (red bar). Each SAM innervated up to three targets (blue bars). Only SAMs with their primary neurite fully contained in the SFL tract area were considered (N=56). (D) The majority of the SAMs had only one input located at the palm. (E) Spatial localization of the input/output of the 28 SAM seed cells within the ROI. Note the restriction of SFL-to-SAM inputs to the area of the SFL tract (green area). (F) The connectivity diagram of the 28 SAM seed cells shows the fraction of the inputs (red) and outputs (blue) by neuron type, revealing a single input type with the SFL (A1-green) and three main targets: the CAM (A2-cyan), ascending fiber (AF) (A3-orange), and large efferent neuron (LN) (A4-magenta). (G) Histogram showing the wide distribution of the number of synaptic inputs to the CAMs (dozens to hundreds), in contrast to the SAMs. (H) The connectivity diagram of 53 CAMs shows the percentage of total inputs to and outputs from the corresponding cell type. Most of the CAMs’ presynaptic partners were not reconstructed but identified based on characteristic ultrastructure profiles. Profiles that could not be unambiguously identified were classified as unidentified (Un). Unlike the SAMs, the CAMs integrate dozen to hundreds of inputs from multiple SAMs (B1-yellow), SFL axons (B2-green), and CAM-input-neurons (CINs) (B3-dark pink). The CAMs appear to converge exclusively onto the LN (B4), the only postsynaptic partners identified. (I) Spatial distribution of the CAM inputs and outputs within the region of interest (ROI) showing the spatial segregation of the inputs (SFL tract mostly) and outputs of the CAMs (neuropil). See also Figure 6—figure supplement 1, Figure 6—video 1, Figure 6—figure supplement 2, and Figure 6—figure supplement 3.
Figure 6—figure supplement 1
Contrast between the single [mononeural] input of the simple AMs (SAMs) and the multiple [polyneural] inputs of the complex AMs (CAMs).
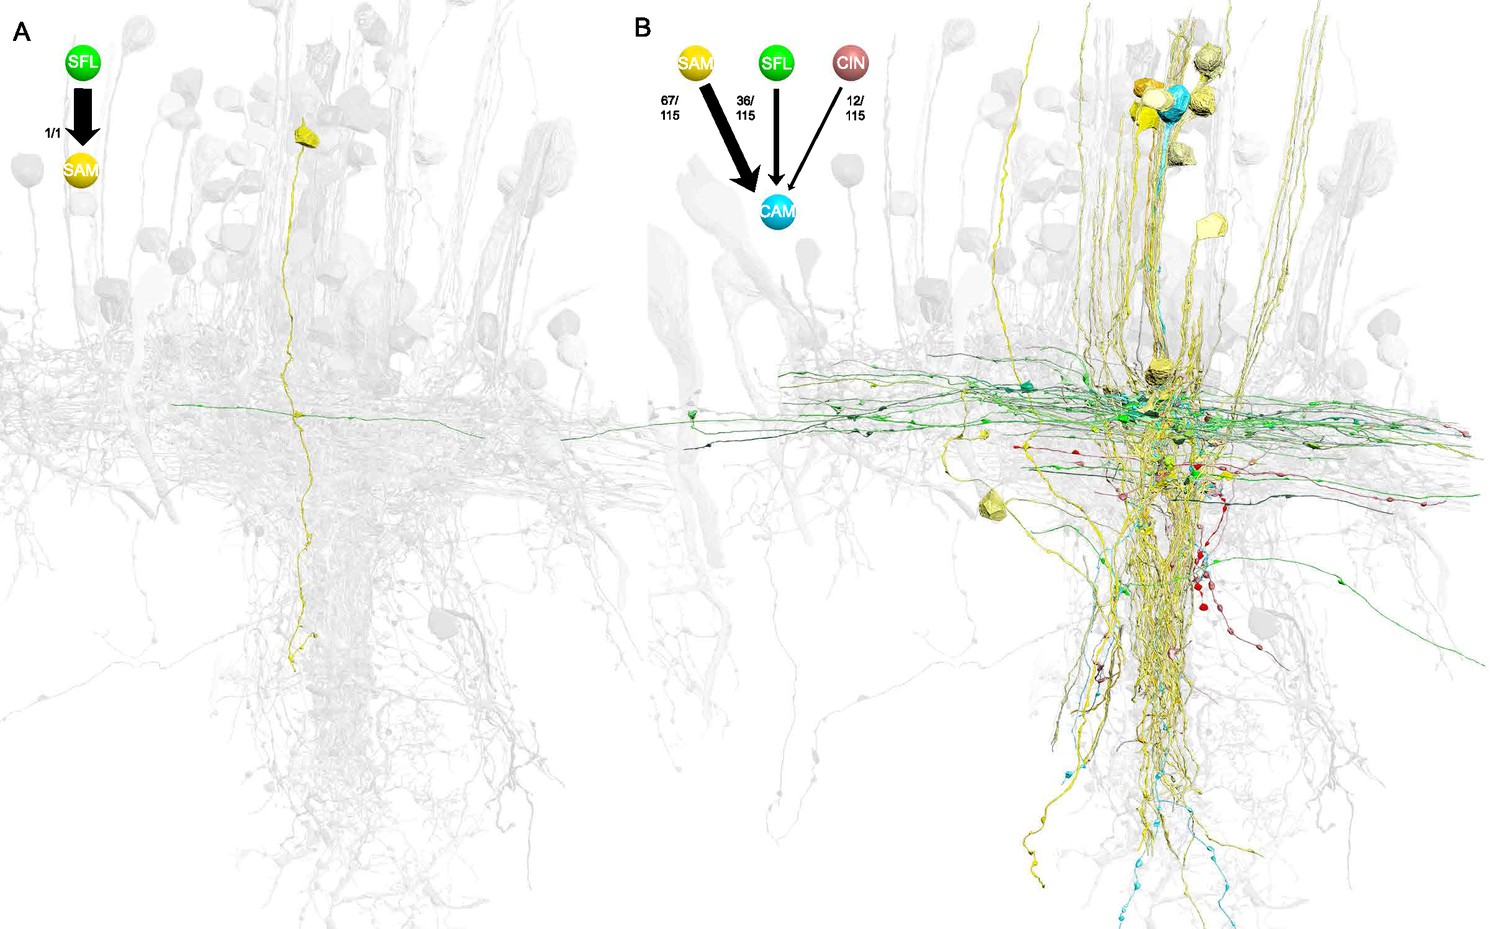
(A) Reconstruction of one SAM (yellow) and its only input from an superior frontal lobe (SFL) axon (green). (B) Reconstruction of all the presynaptic partners of one CAM (cyan), 67 from SAMs, 36 from the SFL axon (green), and 12 from the CAM-input-neurons (CINs) (violet) (total n=115). Both reconstructions are superimposed on a grayscale representation of the 516 reconstructed cells.
Figure 6—figure supplement 2

Example of a vertically projecting complex AM (CAM) and its connectivity.
(A) A CAM superimposed on a reconstruction of the superior frontal lobe (SFL) tract (green) and a few simple AMs (SAMs) (yellow) to facilitate spatial orientation. Puncta and triangle represent, respectively, postsynaptic and presynaptic sites on the CAM, color-coded according to pre- or postsynaptic partner. (B–I) Magnification insets illustrate the synaptic arrangement for the 4 main synaptic connections at the marked location together with the corresponding electron microscopy (EM) cross-section (scale bar = 500 nm). This CAM integrated inputs from multiple SAMs (B, F), SFL axons (C, G) and CINs (D, H) mostly within the SFL tract area. It innervated the large efferent neuron (LN) processes deeper in the neuropil (E, I).
Figure 6—figure supplement 3

A laterally projecting complex AM (CAM) and its connectivity.
(A) A CAM superimposed on a reconstruction of the superior frontal lobe (SFL) tract (green) and a few simple AMs (SAMs) (yellow) to facilitate spatial orientation. Puncta represent the postsynaptic input sites color-coded according to the pre- or postsynaptic partner. (B–G) Magnification insets illustrate the synaptic arrangement for the three main synaptic connections at the marked locations, with corresponding electron microscopy (EM) cross-sections (scale bar = 500 nm). This CAM integrated inputs from multiple SAMs (B, E), SFL axons (C, F), and CAM-input-neurons (CINs) (D, G) mostly within the SFL tract area.
Figure 6—video 1
One segmented simple AM (SAM) tracked within vertical lobe electron microscopy (EM) volume (260 × 390 × 27 µm) imaged with 4 nm resolution in backscattered electrons mode; a 3.2 nA beam current at 7 kV incident electron energy and a dwell time of 200 ns/pixel were used.
The video progresses from the cortex passing through the superior frontal lobe (SFL) tract region to the neuropil.
Figure 7 with 1 supplement
Patterns of synaptic convergence of simple AMs (SAMs) and complex AMs (CAMs) onto large efferent neurons (LNs).
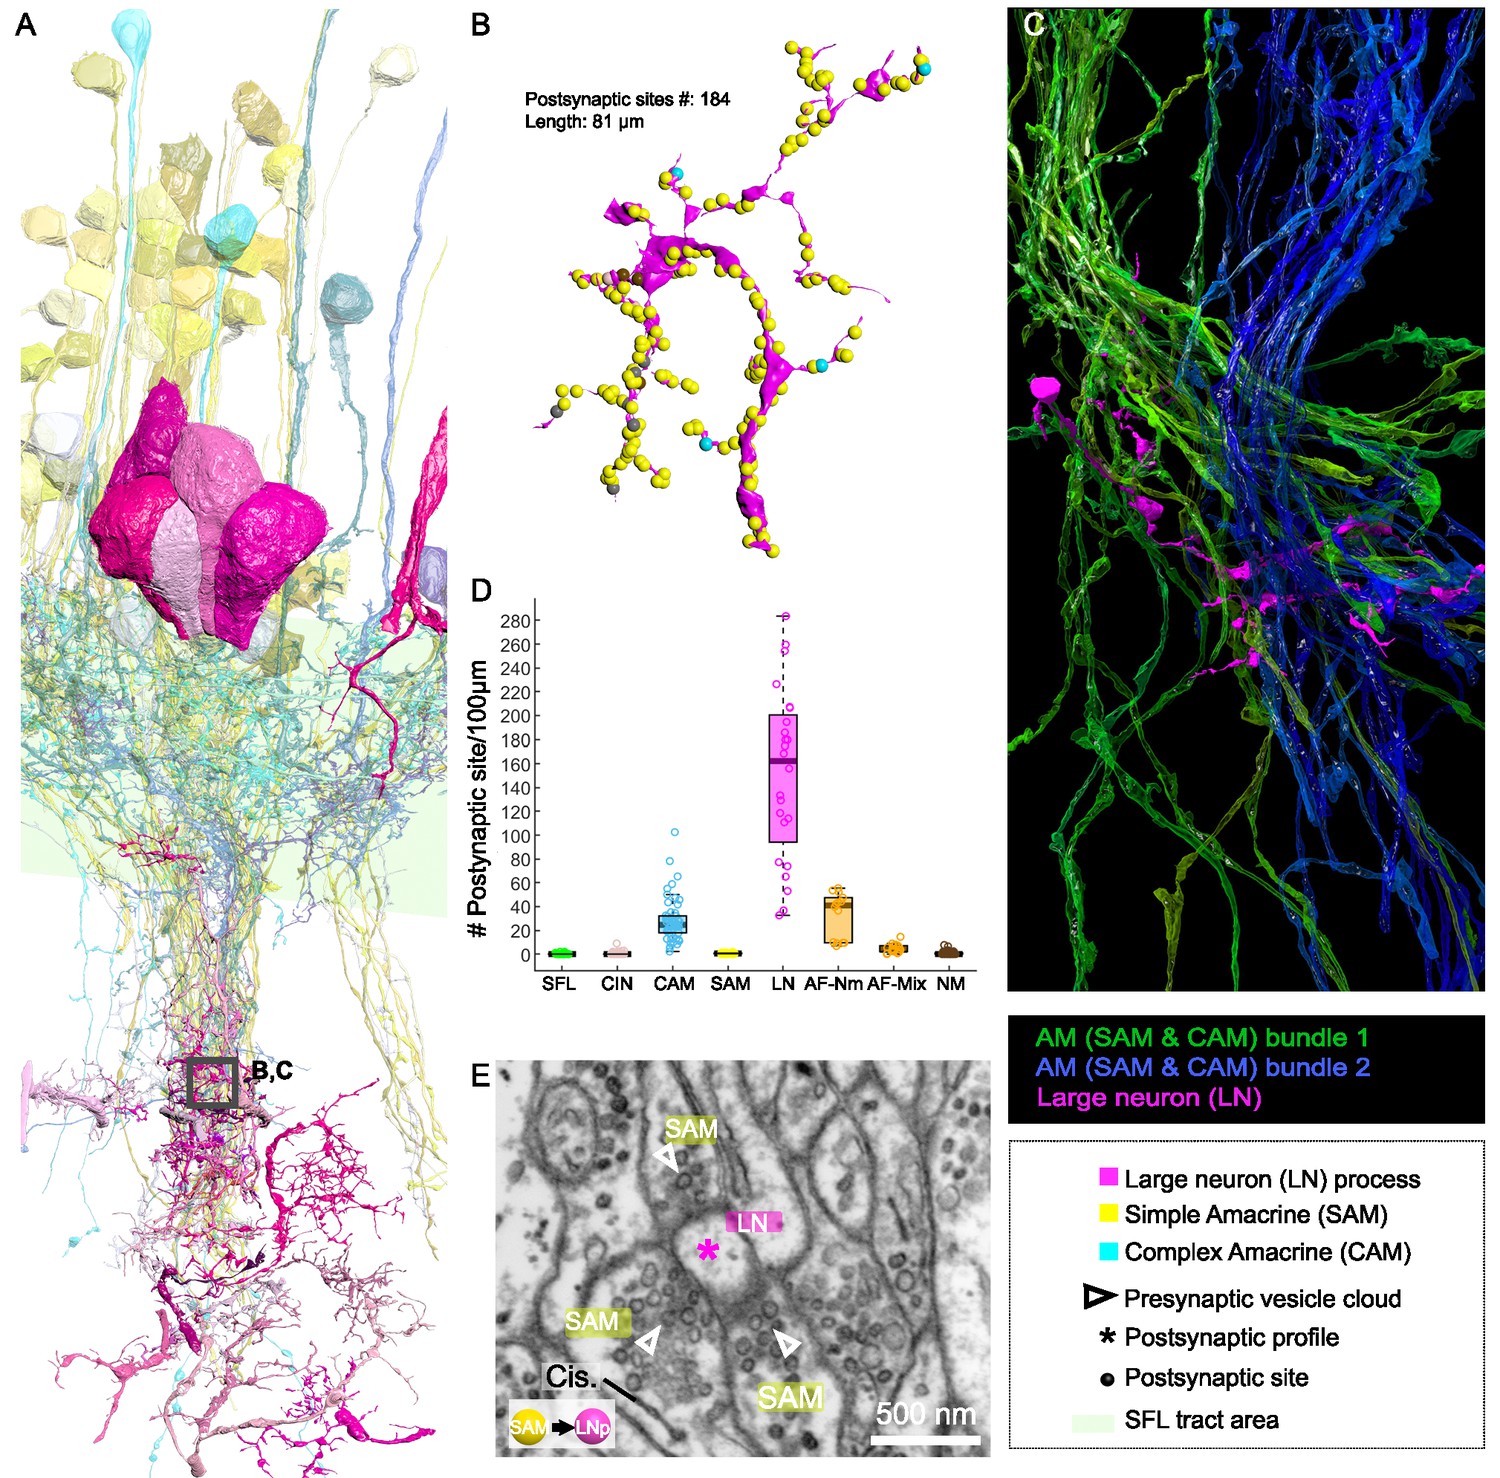
(A) 3D reconstruction of the LN cell bodies and processes (magenta hues) superimposed on SAMs (yellow) and CAMs (cyan). (B) Distributions of the 184 postsynaptic sites on one LN dendrite colored according to the key. Note the very few CAM inputs relative to those of the SAMs. (C) All partners of one LN neurite were reconstructed using a node-based agglomeration of 3D compartments (see Methods) to illustrate the convergence of two bundles of intermingled SAM and CAM neurites onto an LN process. (D) Box plot showing the density of postsynaptic sites for the seven neuronal elements of the VL. The LN processes displayed by far the greatest postsynaptic density among all neuronal elements. (E) High-resolution electron microscopy (EM) illustrating the typical synaptic motif (rosette-like structure) formed by the convergence of three SAMs into one LN process. Empty triangle and asterisk mark pre- and postsynaptic profiles, respectively. Resolution: 1 nm/pixel. Dwell time: 200 μs.
Figure 7—figure supplement 1
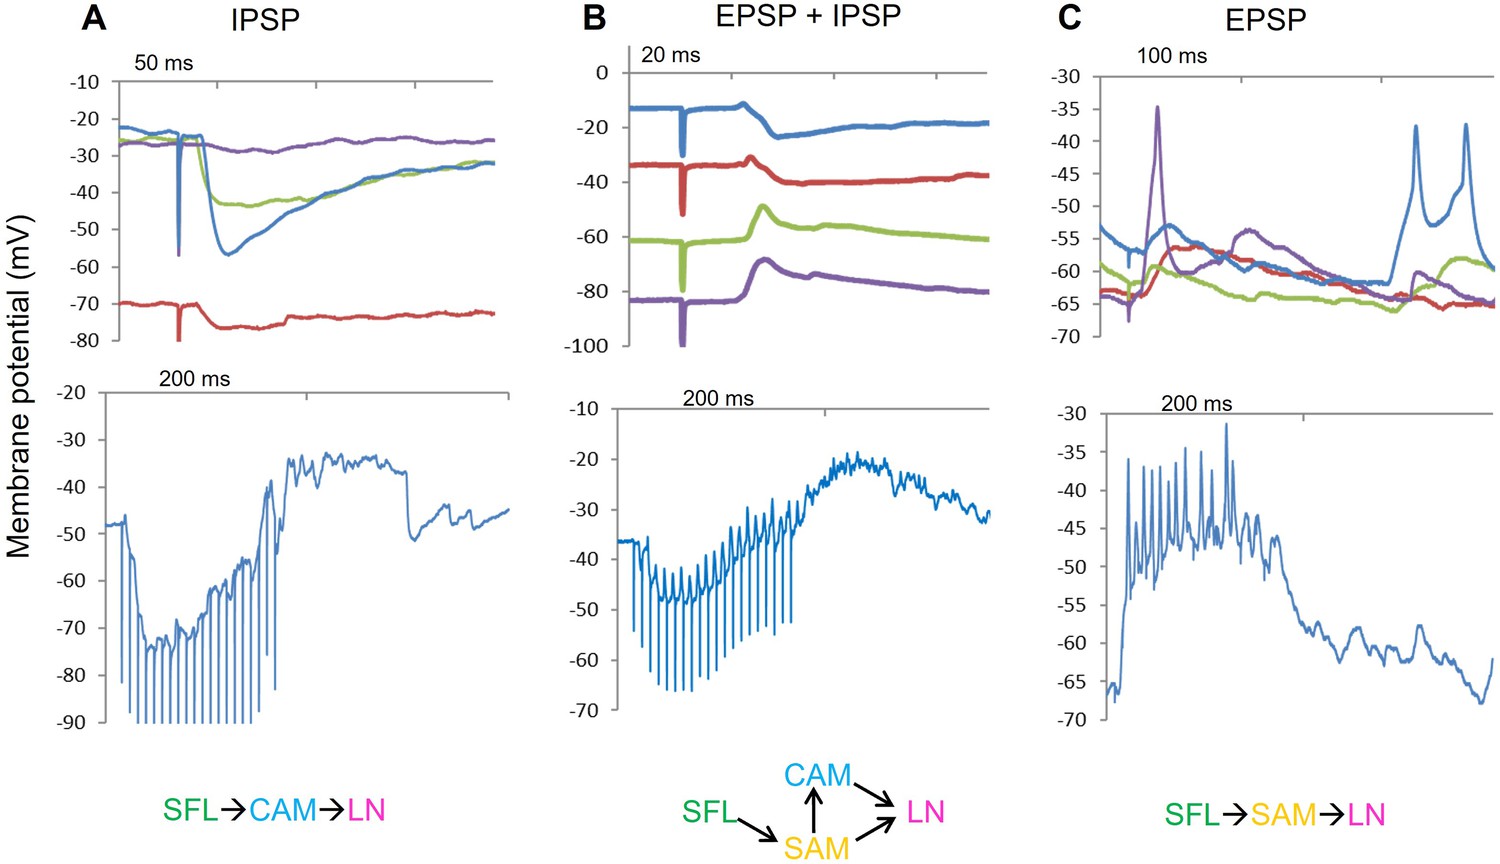
Three previous examples of whole cell LN recording that support the interpretations of the three types of connectivity pathways revealed by the current study (shown at the bottom of the respective A, B and C panels).
(A). An intermitted IPSP is evoked by a single pulse stimulation of the superior frontal lobe (SFL) tact. The red trace shows the expected decline in the IPSP amplitude as a result of hyperpolarizing the membrane potential to around –70 mV. The lower blue trace shows the summation of single IPSPs evoked by a train of 20 pulses at 50 Hz. The IPSPs are depressed as the train continues. (B). An example of an large efferent neuron (LN) in which SFL stimulation evoked a profound EPSP followed by an IPSP. Changing the membrane potential by injecting constant current facilitated discrimination between the excitatory and inhibitory phases of the PSP. The lower blue trace shows the summed postsynaptic response evoked by a train as in A. (C). An example of an LN that received an intermitted EPSP that occasionally reached the action potential threshold (note that the action potential did not cross the zero membrane potential, indicating passive propagation of a remotely generated spikes propagating back to the cell body, typical for invertebrates monopolar neurons). The lower blue trace panel shows the robust excitatory summation of a train of EPSPs.
Figure 8
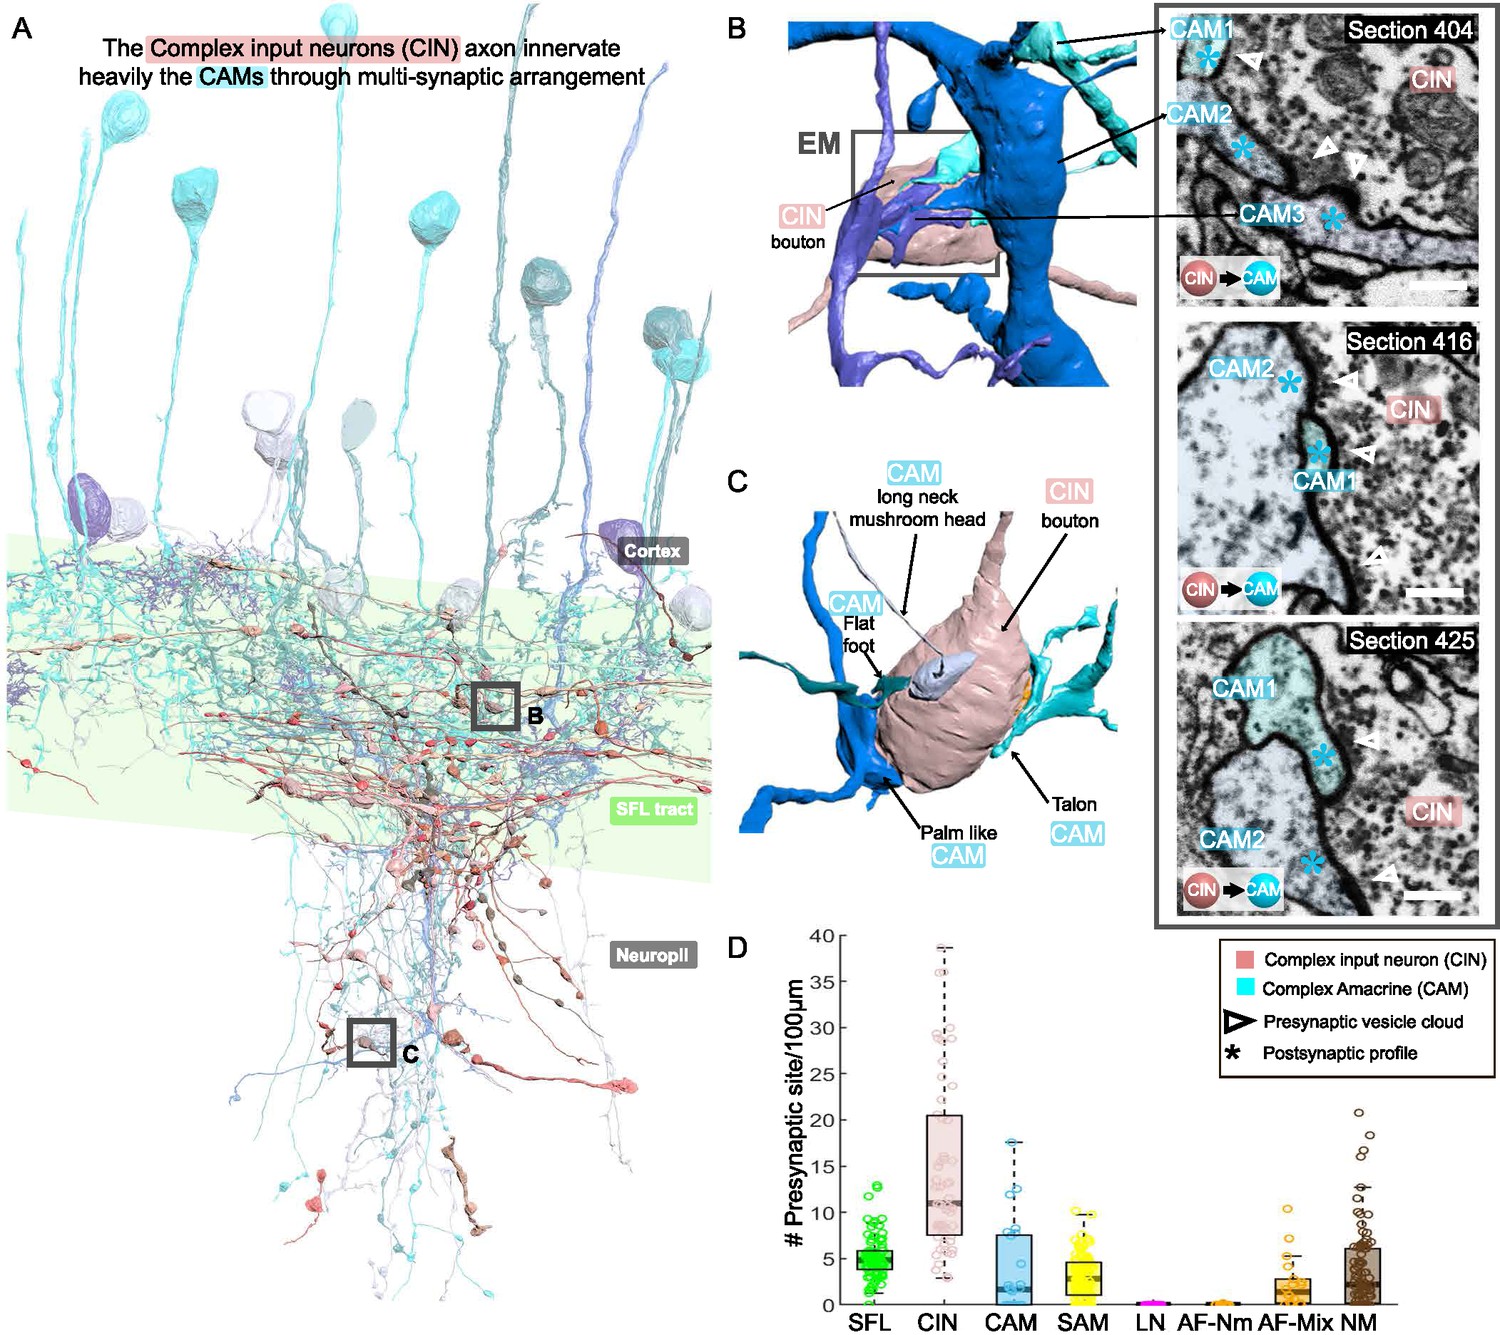
CAM-input-neurons (CINs) exclusively innervate complex AMs (CAMs) via large multisynaptic boutons.
(A) Reconstruction of the CINs (pink) superimposed on the CAMs that are their main postsynaptic partners (blue hues). (B, C) 3D arrangement of a large CIN presynaptic bouton innervating multiple CAM dendrites (3 in B; 4 in C). CAM twig endings varied in shape resembling flattened dendritic spine enlargements. As indicated in (C), their structure can be divided into at least 5 classes. Right inset, three consecutives near cross-sections through a CIN bouton and its three postsynaptic targets. The CIN profile contained the smallest vesicles, about 30 nm in diameter, of the entire dataset. (D) Box plot showing the density of presynaptic sites for the seven neuronal elements of the ventral lobe (VL). CINs had the highest presynaptic site density of the dataset. Error bar = standard error of the mean.
Figure 9 with 1 supplement
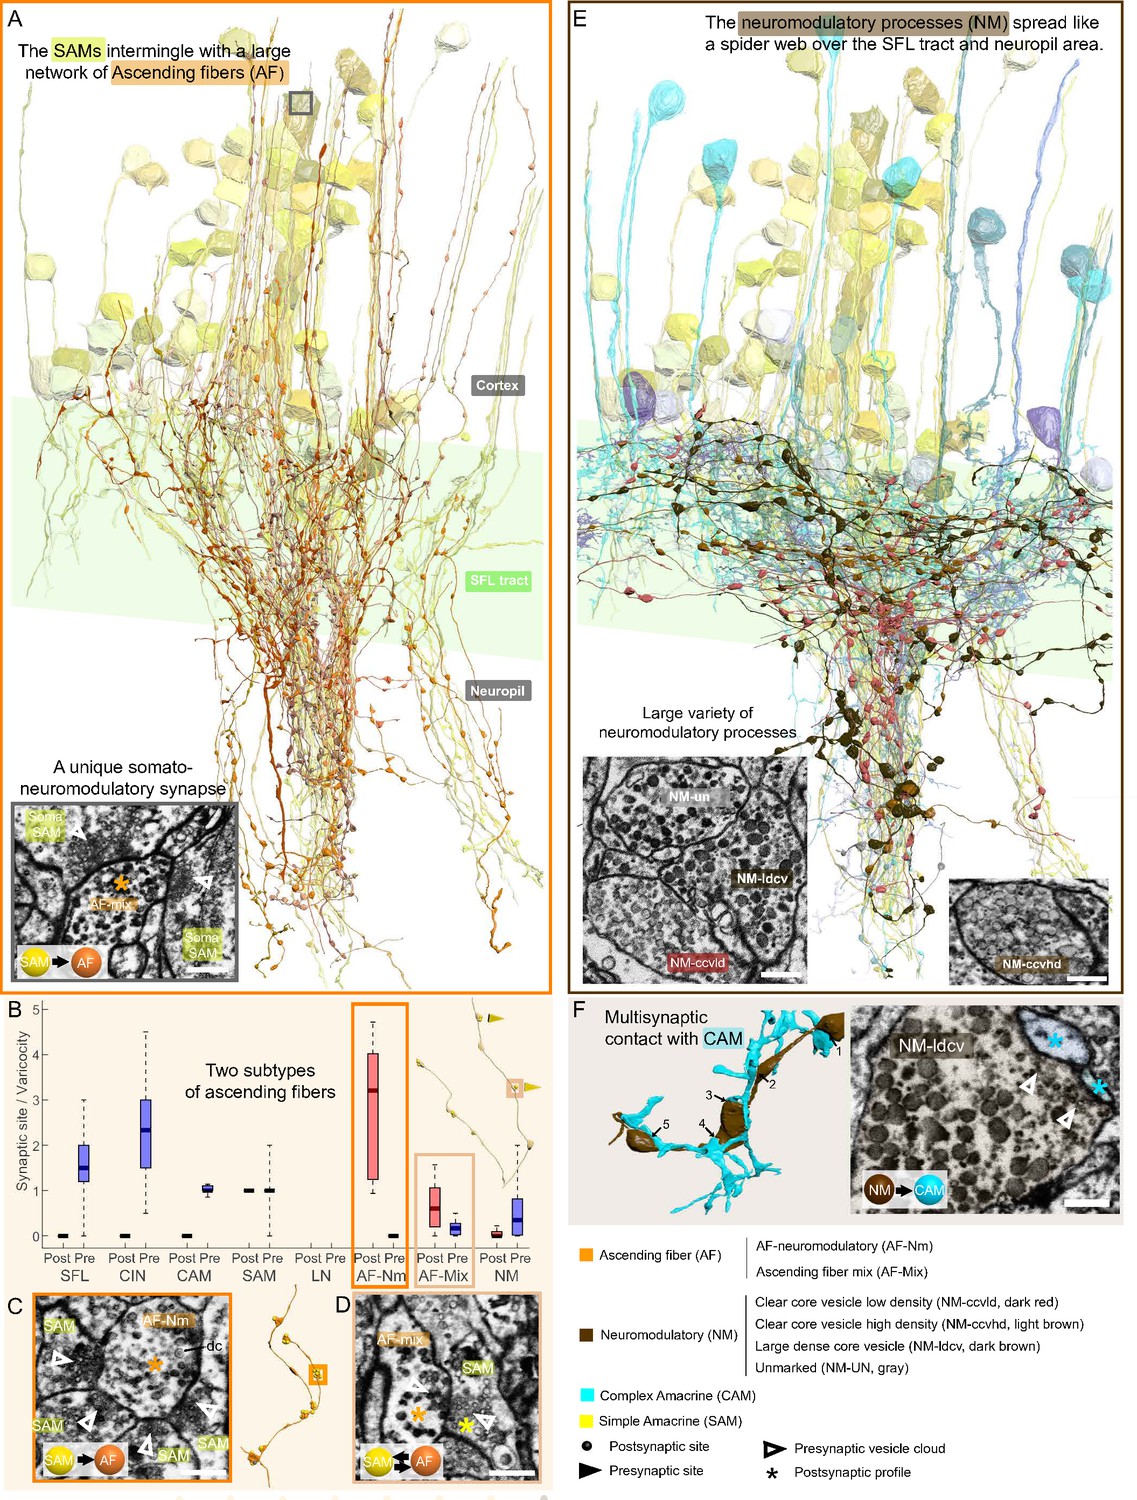
Overlay of two modulatory systems, the ascending fibers (AFs) and widespread neuromodulatory fibers (NMs).
(A) 3D reconstruction of a large network of AFs (orange) intermingling with a SAM neuritic bundle (yellow). The AFs showed varicosities along their length filled with large vesicles and were mainly postsynaptic to the simple AMs (SAMs) (C, D) A somatic synaptic input from SAM to AF was occasionally observed (lower left inset). (B) The distribution of the number of pre- and postsynaptic sites per varicosity (blue and red, respectively) for the seven neuronal elements considered revealed two types of AF processes. (C) The AF-Nm type (orange) were exclusively unidirectional synapses forming a rosette-like structure where 2–5 SAMs made adjacent synapses onto one AF-Nm postsynaptic varicosity (asterisk). (D) The AF-mix (light orange) was more diverse. Their boutons were filled with vesicles of various shapes and sizes, ranging from small dark core vesicles to flat clear core vesicles. Unlike the AF-Nm, they could be bidirectional, both pre- and postsynaptic (triangles and puncta, respectively), and occasionally displayed reciprocal contact with a SAM as shown in the electron microscopy (EM). (E) 3D reconstruction of the widespread NM fibers superimposed on populations of SAMs (yellow) and CAMs (blue). At least three distinct subtypes were distinguishable based on vesicle sizes (EM insets: clear core low density, clear core high density, dense core). (F) 3D reconstruction of NM-to-CAM synapses. The NM occasionally made multisynaptic contacts. The right inset shows a representative EM of a neuromodulatory synapse. Scale bar EM sections, 500 nm. NM synapses were distinguished by the presence of much larger vesicles (>60 nm) in the presynaptic varicosities than those observed in traditional chemical synapses (fast transmission).
Figure 9—figure supplement 1
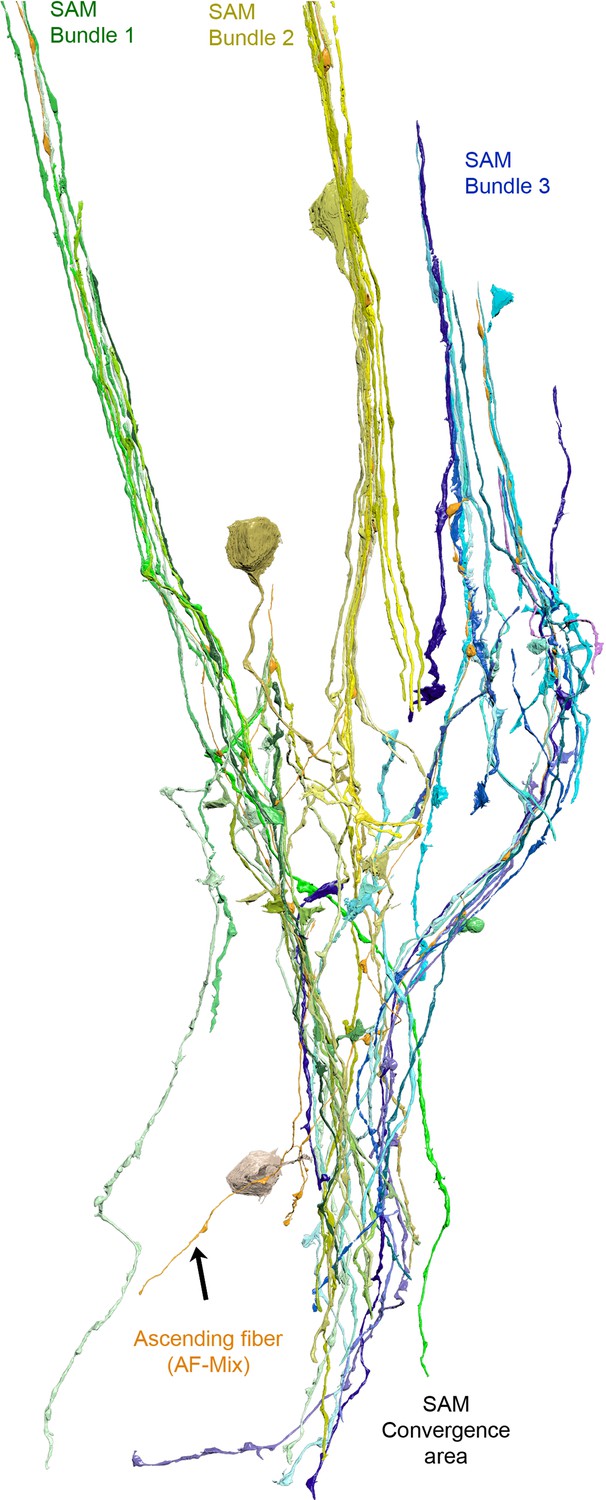
Reconstruction of one ascending fiber (AF)-mix (orange) and its inputs from the simple AMs (SAMs) (yellow).
Notice that the AF intermingles with the SAMs. Within the cortex, the SAMS innervating the AF form distinct trunks/bundles that appear to converge within the neuropil. The SAMs innervating this AF appear to converge within the neuropil.
Figure 10
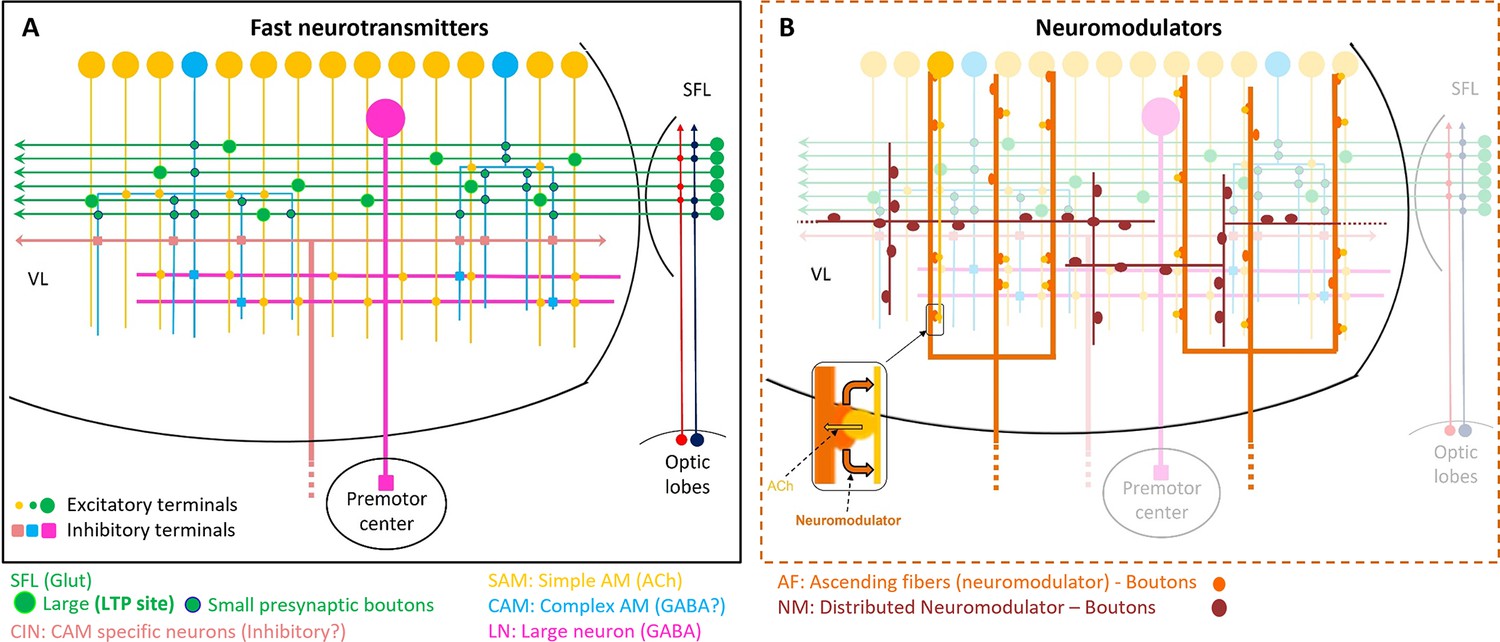
Schematic representation of the currently known circuit architecture of the vertical lobe (VL).
(A) Fast transmitter connectivity. The parallel superior frontal lobe (SFL) axons (green) convey classified sensory information via en passant glutamatergic (glut) synapses to a large group of simple AMs (SAMs) (yellow) and a very small group of complex AMs (CAMs) (cyan). Each SAM has one palm on its neurite innervated by a single large SFL bouton (SFL LB). This connection is endowed with short- and long-term plasticity. The CAMs integrate ongoing activity through multiple inputs from the SFL, SAMs, and CINs (light pink). The SAMs and CAMs converge onto the large efferent neuron (LN) dendrites (magenta) forming two parallel and interconnected feedforward networks (shown in Figure 11). SAM output to the LNs is excitatory cholinergic (ACh). The CAM inputs to the LNs may be inhibitory GABAergic (see text). (B) The two widespread networks of modulatory inputs to the fast transmission circuit (shown in A). The ascending AF processes (orange) make reciprocal connections with the SAM neurites, (shown in the zoom-in inset) possibly inducing the local release of a neuromodulator (likely serotonin). The neuromodulatory fibers (NMs) (brown) spread throughout the neuropil. Physiological and immunohistochemical studies indicate that ascending fibers (AFs) and NMs release neuromodulators such as serotonin and octopamine and dopamine that likely play a role in reinforcing/suppressing the LTP at the SFL-to-SAM synapse.
Figure 11
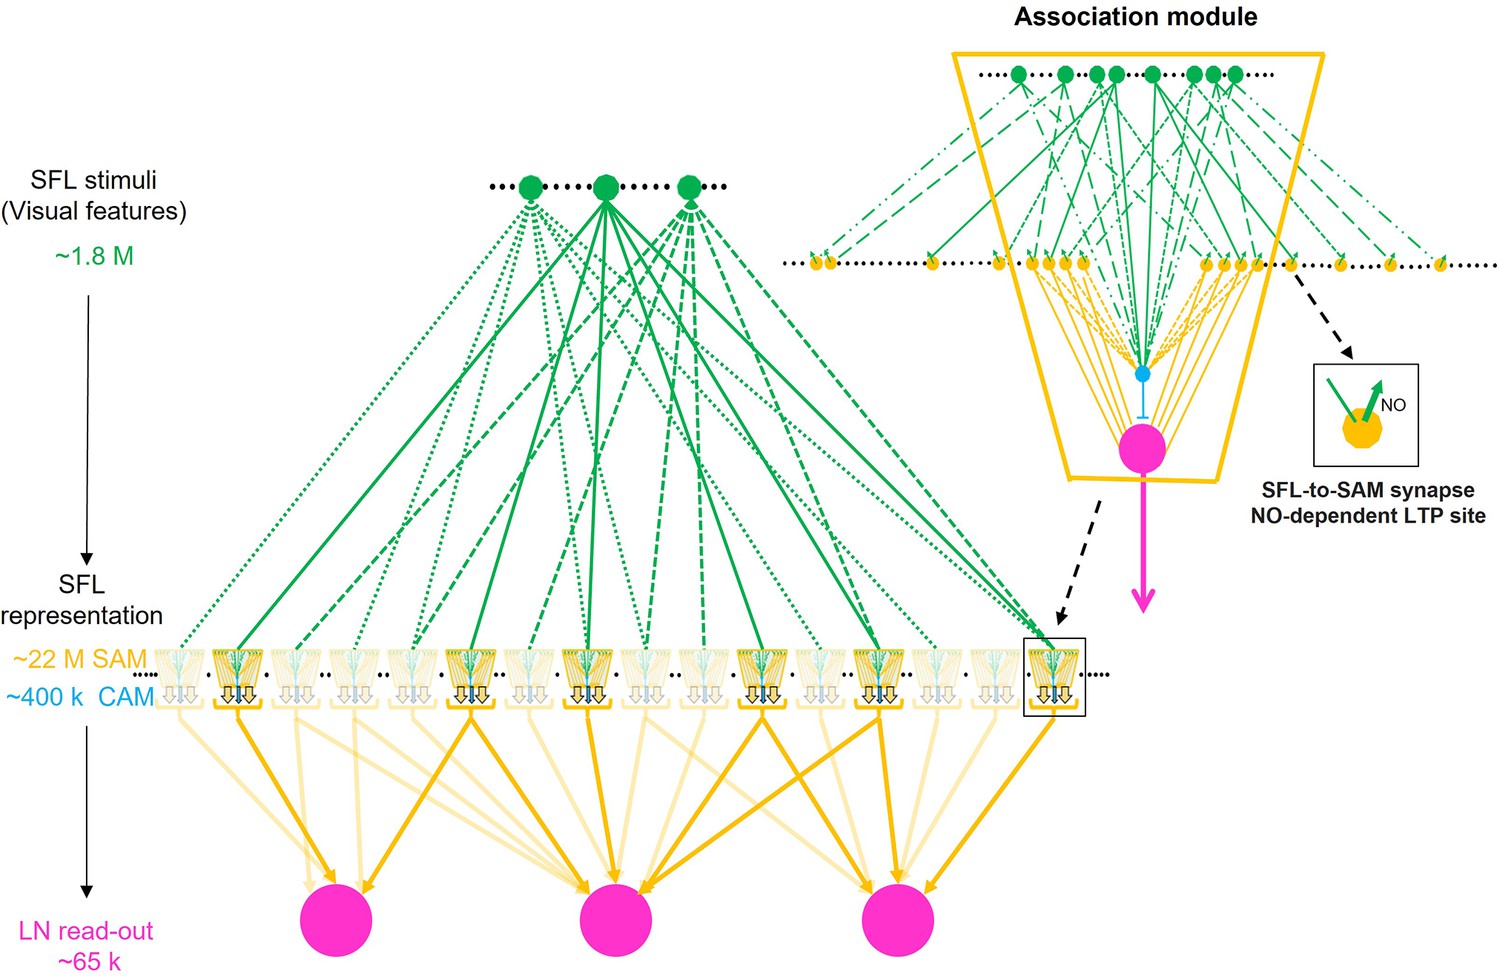
Schema of combinatorial coding in an array of possible association modules.
Inset: The simple AMs (SAMs) and complex AMs (CAMs) appear to be organized in columnar structures that integrate and feedforward ‘sharpened’ stimulus-specific inputs into the large efferent neurons (LNs). A specific stimulus (e.g. a visual feature) is fed forward via the SAMs while the CAMs integrate multiple superior frontal lobes (SFLs) and SAMs inputs and feed a general balancing inhibitory input forward to the LNs. As the input to the SAMs is endowed with long-term potentiation (LTP) (zoom-in inset), this microcircuit unit may be a canonical ‘association module’ of the vertical lobe (VL). The main scheme shows how an array of association modules integrates a very sparse and random distribution of the SFL single input to the SAMs. Each association module likely contains several hundred SAMs and relatively few CAMs (1.8%) suggesting that each module associates a variable combinatorial association of multiple SFL features. Note that computationally an association module may replace a single AM in the intermediate layer of the originally assumed fan-out fan-in classification/association network (Shomrat et al., 2011).
Additional files
Download links
A two-part list of links to download the article, or parts of the article, in various formats.
Downloads (link to download the article as PDF)
Open citations (links to open the citations from this article in various online reference manager services)
Cite this article (links to download the citations from this article in formats compatible with various reference manager tools)
Connectomics of the Octopus vulgaris vertical lobe provides insight into conserved and novel principles of a memory acquisition network
eLife 12:e84257.
https://doi.org/10.7554/eLife.84257


