Oxygen levels at the time of activation determine T cell persistence and immunotherapeutic efficacy
- Department of Physiology, Development and Neuroscience, University of Cambridge, United Kingdom
- Molecular Physiology, Institute of Cardiovascular Physiology, University Medical Center, Georg-August-University, Germany
- Cancer Research UK, Cambridge Institute, University of Cambridge, United Kingdom
- Department of Cell and Molecular Biology, Karolinska Institute, Sweden
Figures
Figure 1 with 1 supplement
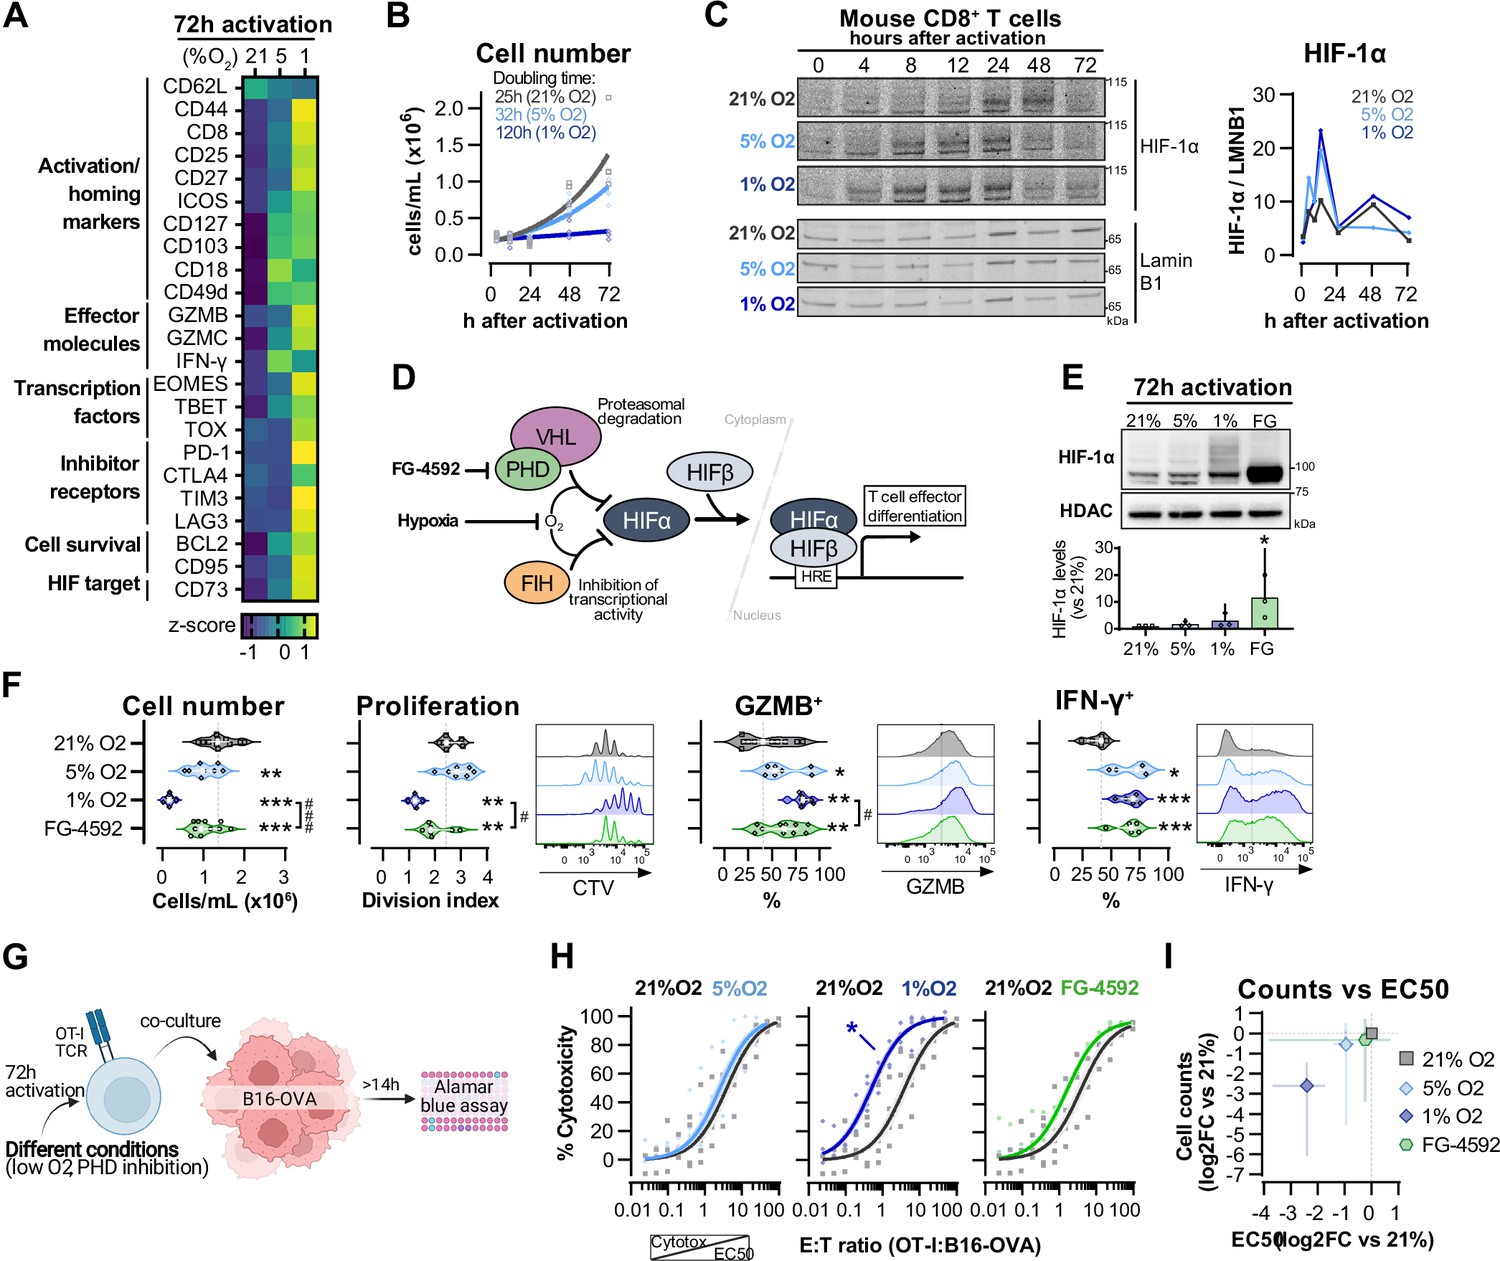
Hypoxia and inhibition of negative hypoxia-inducible factor (HIF) signalling in CD8+ T cell effector differentiation.
(A) Heat map illustrating expression of markers of differentiation as median fluorescence intensity (MFI) determined by flow cytometry 72 hr after activation of naive CD8+ T cells in 21, 5, or 1% O2. Viridis was used as colour scale, and rows represent averaged z-scores; n = 4–29. (B) CD8+ T cell expansion following activation in 21, 5, or 1% O2 determined with automated cell counter. Exponential growth curve fit (represented by thick lines) was used to calculate doubling time in hours of T cells in each oxygen tension; n = 4. (C) HIF-1α protein expression in nuclear extracts from CD8+ T cells activated in 21, 5, or 1% O2. Representative immunoblots (left) and HIF-1α protein signal normalised to Lamin B1 (right); n = 1. (D) Representation of inhibition of negative regulators of HIFα with hypoxia and chemical inhibition of PHD with FG-4592. (E) HIF-1α protein expression in nuclear extracts from OT-I CD8+ T cells activated for 72 hr. Conditions analysed: wild-type (WT) cells activated in 21, 5, or 1% O2; WT cells activated in 21% O2 and treated with 50 µM FG-4592. Representative immunoblot (top) and HIF-1α levels relative to 21% after normalisation to HDAC or Histone 3 loading controls (bottom); n = 3. (F) Analysis of cell number, proliferation, and expression of differentiation markers in the experimental con0ditions described in (E). Cell number determined with automated cell counter and cell proliferation with CTV staining. Expression of differentiation markers was measured after stimulation with SIINFEKL and brefeldin for 3 hr and is shown as a percentage of live CD8+ cells. Histograms are representative flow cytometry plots for each parameter and are pre-gated on live, singlet, CD8+ events. The dotted line defines in violin plot graphs the median of 21% grown cells and in histograms the gate for each marker; n = 8–30. (G) In vitro cytotoxicity assay using OT-I CD8+ T cells shown in (F). OT-I cells were co-cultured with B16–OVA tumour cells at different effector:target (E:T) ratios and cytotoxicity was assessed after 14–18 hr. (H) Cytotoxicity assay obtained according to (G) performed at 1% O2 and shown in dose–response curves (plotted with 95% confidence intervals as shaded areas) determined with non-linear regression ([agonist] vs. normalised response). Asterisk represents significantly lower EC50 values compared to 21%; n = 4–7. (I) Correlation between log2 fold change (FC) of cell counts on day 3 (obtained in F) and EC50 values (obtained in H) relative to 21% O2. All results were pooled from at least two independent experiments and are shown as median ± interquartile range (IQR). Each data point represents an independent animal. *p<0.05, **p<0.01, ***p<0.001; Holm–Šídák’s multiple-comparisons test relative to 21% (E–H) or #p<0.05, ###p<0.001; paired t test (F).
-
Figure 1—source data 1
Raw data and detailed analysis for Figure 1.
- https://cdn.elifesciences.org/articles/84280/elife-84280-fig1-data1-v2.zip
Figure 1—figure supplement 1
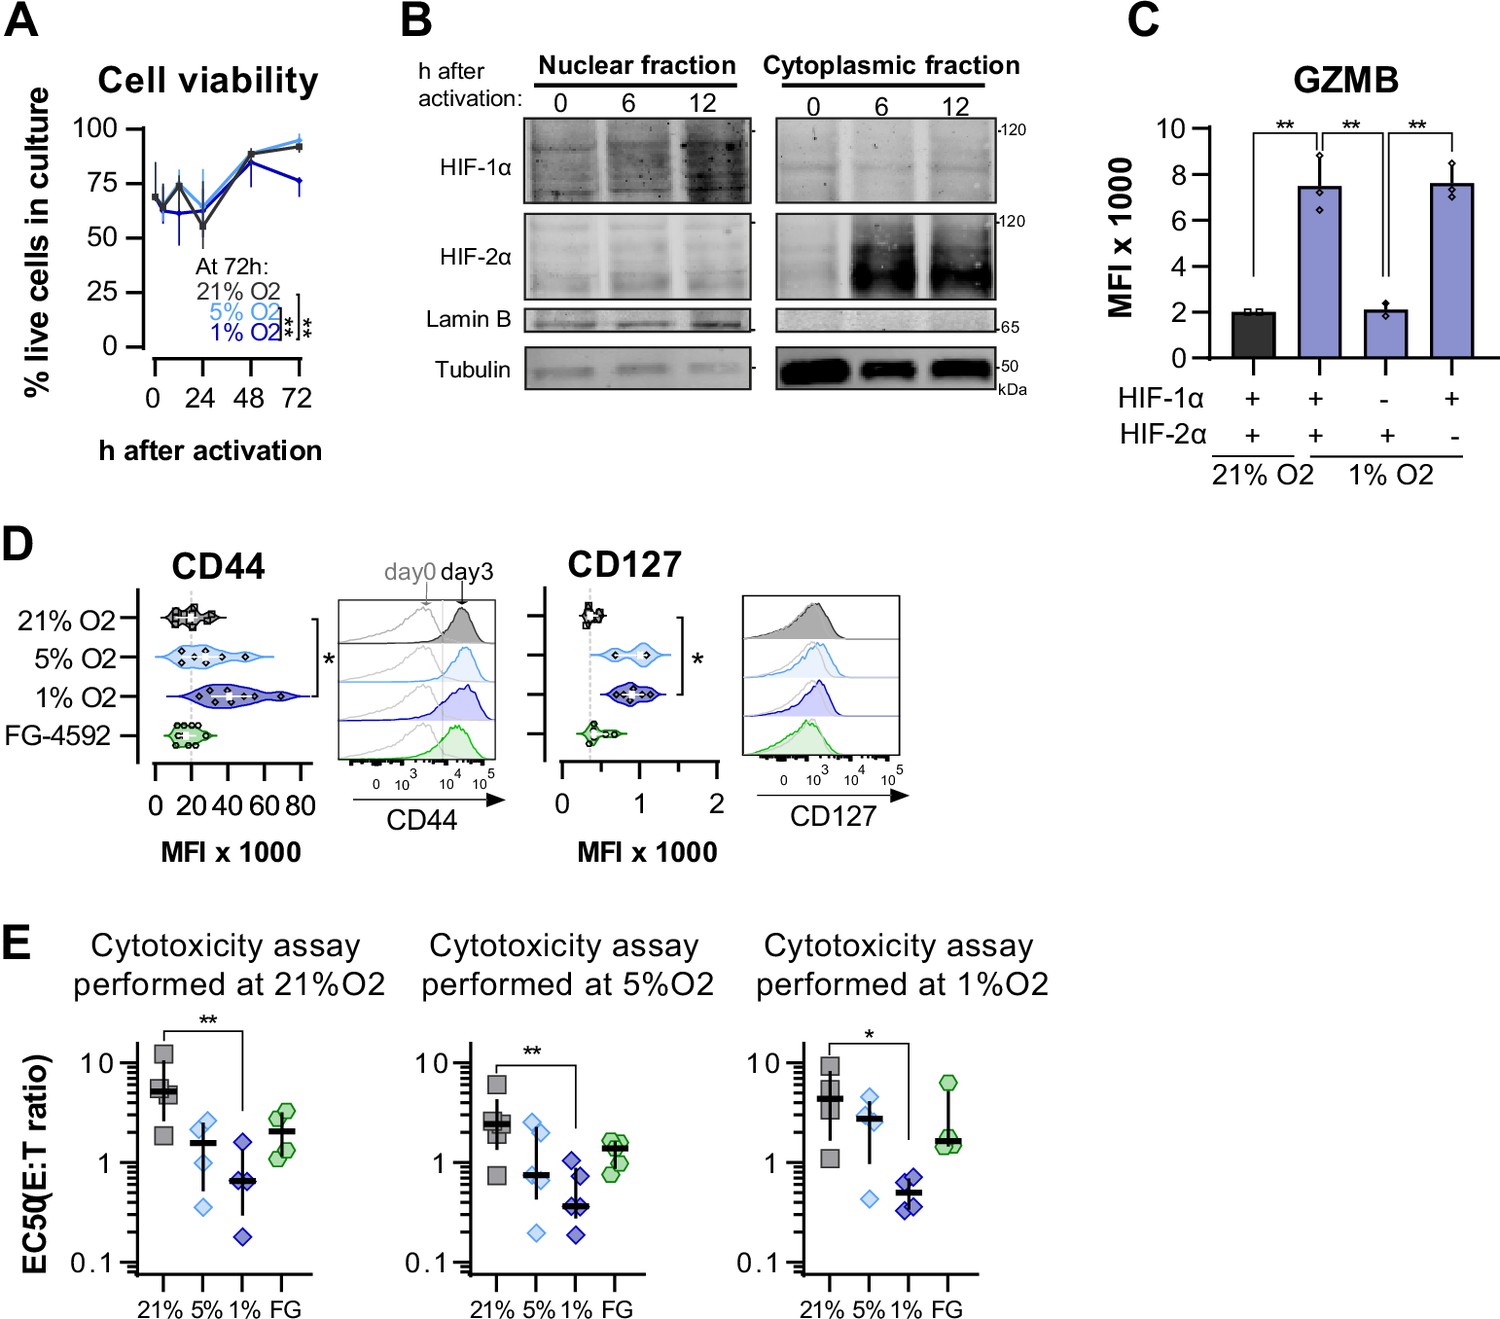
Effects of hypoxia-inducible factor (HIF) stabilisation on CD8+ T cell viability, differentiation, and cytotoxicity at different O2 tensions.
(A) Proportion of viable of CD8+ T cells in cultures grown in 21, 5, or 1% O2 determined with automated cell counter and trypan blue; n = 4. (B) HIF-1α and HIF-2α protein expression in nuclear extracts from mouse CD8+ T cells activated in 21% O2. Lamin B and Tubulin were used as loading control for nuclear and cytoplasmic fractions, respectively. HIF-1α and Lamin B blotted with 800CW secondary antibodies and HIF-2α and Tubulin blotted with 680RD secondary antibodies. VHL knock-out T cells were used as positive control; n = 1. (C) Median fluorescence intensity (MFI) of GZMB in WT (+) and Hif1fl/fldLckCRE Hif2fl/fldLckCRE cells (HIF-1α or HIF-2α KO, -) mouse CD8+ T cells cultures for 7 d in 21% (grey) or 1% O2 (blue); n = 2–3. (D) OT-I CD8+ T cell differentiation was analysed by flow cytometry 3 d after activation. Histograms are representative flow cytometry plots for each parameter and are pre-gated on live, singlet, CD8+ events. The vertical dotted line defines in graphs the median of 21% grown cells and in histograms the gate for each marker. Grey lines in the histograms represent the expression of these markers at day 0 prior to activation (naive). n = 3–10. (E) In vitro cytotoxicity assay using the following conditions: wild-type OT-I cells cultured in 21, 5, or 1% O2; WT cells activated in 21% O2 and treated with 50 µM FG-4592. OT-I cells were co-cultured with B16-OVA cancer cells for at least 14 hr. EC50 values obtained from non-linear regression of dose–response curves obtained from co-cultures with different effector:target (E:T) ratios performed at 21% (left), 5% (middle), or 1% (right); Each data point represents and independent animal; n = 4–5. All results shown as median ± IQR. *p<0.05, **p<0.01, ***p<0.001; two-way ANOVA corrected with Tukey’s test (A) or Holm–Šídák’s multiple-comparisons test (C–E).
-
Figure 1—figure supplement 1—source data 1
Raw data and detailed analysis for Figure 1—figure supplement 1.
- https://cdn.elifesciences.org/articles/84280/elife-84280-fig1-figsupp1-data1-v2.zip
Figure 2 with 1 supplement

Effects of hypoxia and increased hypoxia-inducible factor (HIF) signalling in antitumour function of CD8+ T cells.
(A) Model of adoptive cell transfer (ACT) therapy. CD45.2+ C57BL/6j mice were inoculated with B16-OVA cells, lymphodepleted with cyclophosphamide (CPA) and injected with CD45.1+ OT-I CD8+T cells activated 3 d prior. Peripheral blood was sampled and analysed by flow cytometry. Tumour growth was monitored every 2–3 days until day 60. (B) Blood analysis on day 14. Representative flow cytometry plots with events pre-gated on live, singlet, CD45+. (C, D) Frequency of adoptively transferred OT-I cells per millilitre of peripheral blood (C) and percentage of CD62L-CD44+ among CD8+ CD45.1+ in peripheral blood (D) on day 7 after ACT; n = 17–20, median ± IQR. (E) Tumour growth curves. Animals not receiving T cells (NoACT) were used as negative controls. Thin lines: individual animals; thick lines: Malthusian growth curve fit; n = 7–10. (F) Tumour burden on day 30 shown as log2 fold change relative to day 7 (day of ACT). The value of 0.1 (corresponding to the smallest log2 fold change detected) was added to all conditions to allow the plotting of animals with no tumours; n = 9–14, median ± IQR. (G) Survival curves for tumour growth shown in (D). Threshold for survival was set to 500 mm3; n = 10–16. All results (except E) were pooled from two independent experiments and each data point represents an independent animal. *p<0.05, **p<0.01, ***p<0.001; Kruskal–Wallis test relative to 21% corrected with Dunn’s test (C, D, F) and log-rank (Mantel–Cox) test relative to 21% O2 or NoACT groups (G).
-
Figure 2—source data 1
Raw data and detailed analysis for Figure 2.
- https://cdn.elifesciences.org/articles/84280/elife-84280-fig2-data1-v2.zip
Figure 2—figure supplement 1

(A) Gating strategy for analysis of peripheral blood.
Figure 3 with 1 supplement
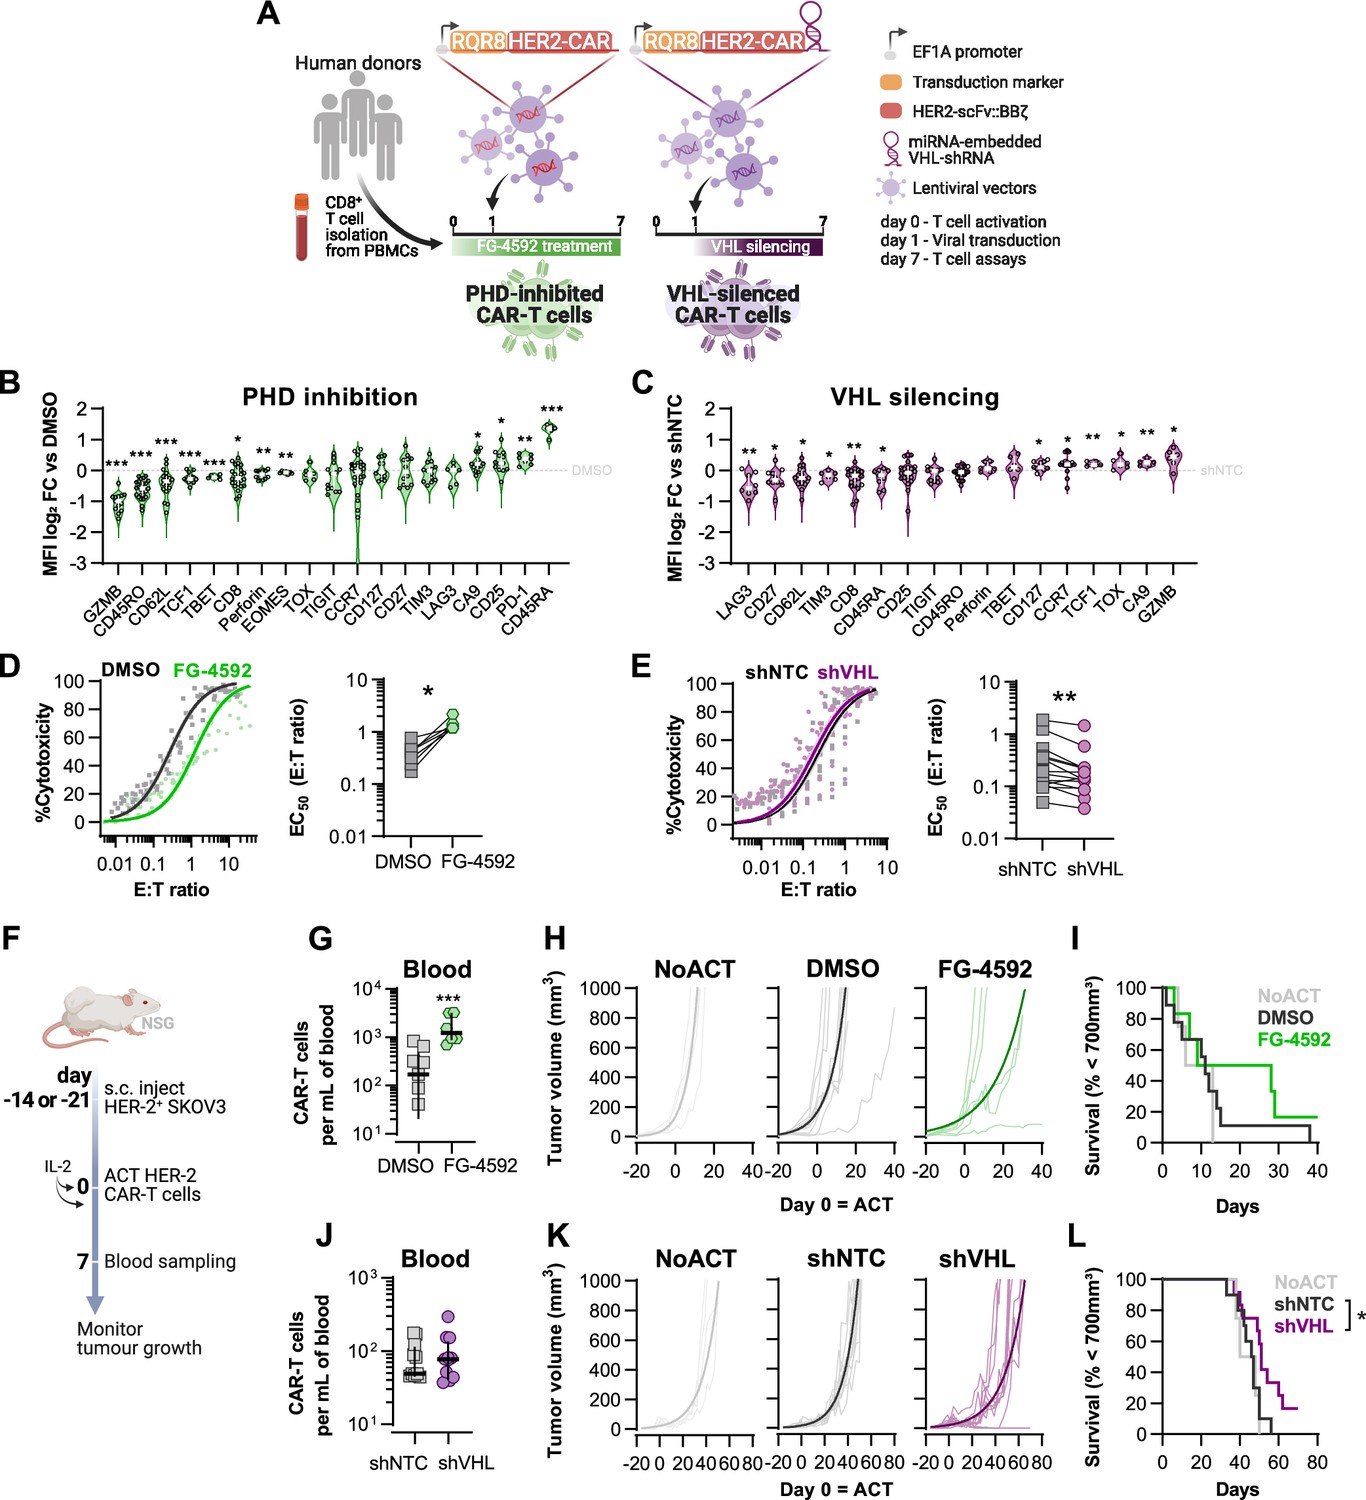
Effects of modified hypoxia-inducible factor (HIF) signalling in CART cell cytotoxicity against solid tumours.
(A) Generation of CAR-T cells. Human CD8+ T cells were activated, transduced HER2-CAR vectors the day after and assayed on day 7. To modulate HIF signalling, 50 µM FG-4592 (FG) were added to CAR-T cell cultures or cells were transduced with a HER2-CAR vector containing a miRNA-embedded shRNA against VHL (shVHL). DMSO treatment and transduction with CAR vector containing a non-targeted control shRNA (shNTC) were used as controls for FG and shVHL conditions, respectively. RQR8 was used as transduction marker. (B, C) Flow cytometry analysis of differentiation markers relative to each respective control (horizontal grey line) following PHD inhibition with FG treatment (B) or VHL silencing (D); n = 6–30, median ± IQR. (D, E) In vitro cytotoxicity assay. DMSO- or FG-treated CAR-T cells (D) and shNTC- or shVHL-expressing CAR-T cells (E) were co-cultured with SKOV3 tumour cells at different effector:target (E:T) ratios and cytotoxicity was assessed after 14–18 hr of co-culture at 1% O2. Left: dose–response curves (plotted with 95% confidence intervals represented in shaded areas) determined with non-linear regression ([agonist] vs. normalised response); right: EC50 values obtained from non-linear regression; n = 7–14. (F) Model of CAR-T cell therapy. NOD.Cg-PrkdcscidIl2rgtm1Wjl/SzJ mice were inoculated with SKOV3 cells and injected with CAR-T cells generated according to (A). Peripheral blood was sampled and analysed by flow cytometry. Tumour growth was monitored every 2–3 d until day 40 or 70 for FG and shVHL experiments, respectively. (G, J) Frequency of adoptively transferred CAR-T cells per millilitre of peripheral blood on day 7 for DMSO- or FG treatment (G) and shNTC- or shVHL-silencing (J); n = 6-12, median ± IQR. (H, K) Tumour growth curves experiment with DMSO- or FG-treated CAR-T cells (H) and shNTC- or shVHL-silenced CAR-T cells (K). Animals not receiving T cells (NoACT) were used as negative controls in both experiments. Thin lines: individual animals; thick lines: Malthusian growth curve fit; n = 5-12. (I, L) Survival curves for tumour growth shown in (H) and (K). Threshold for survival was set at 700 mm3. All results (except G–L) were pooled from two independent experiments, and each data point represents an independent animal. *p<0.05, **p<0.01, ***p<0.001; one-sample t test relative to control (B, C), Wilcoxon matched-pairs signed-rank test (D, E), unpaired t test (G), and log-rank (Mantel–Cox) test relative to shNTC (L).
-
Figure 3—source data 1
Raw data and detailed analysis for Figure 3.
- https://cdn.elifesciences.org/articles/84280/elife-84280-fig3-data1-v2.zip
Figure 3—figure supplement 1
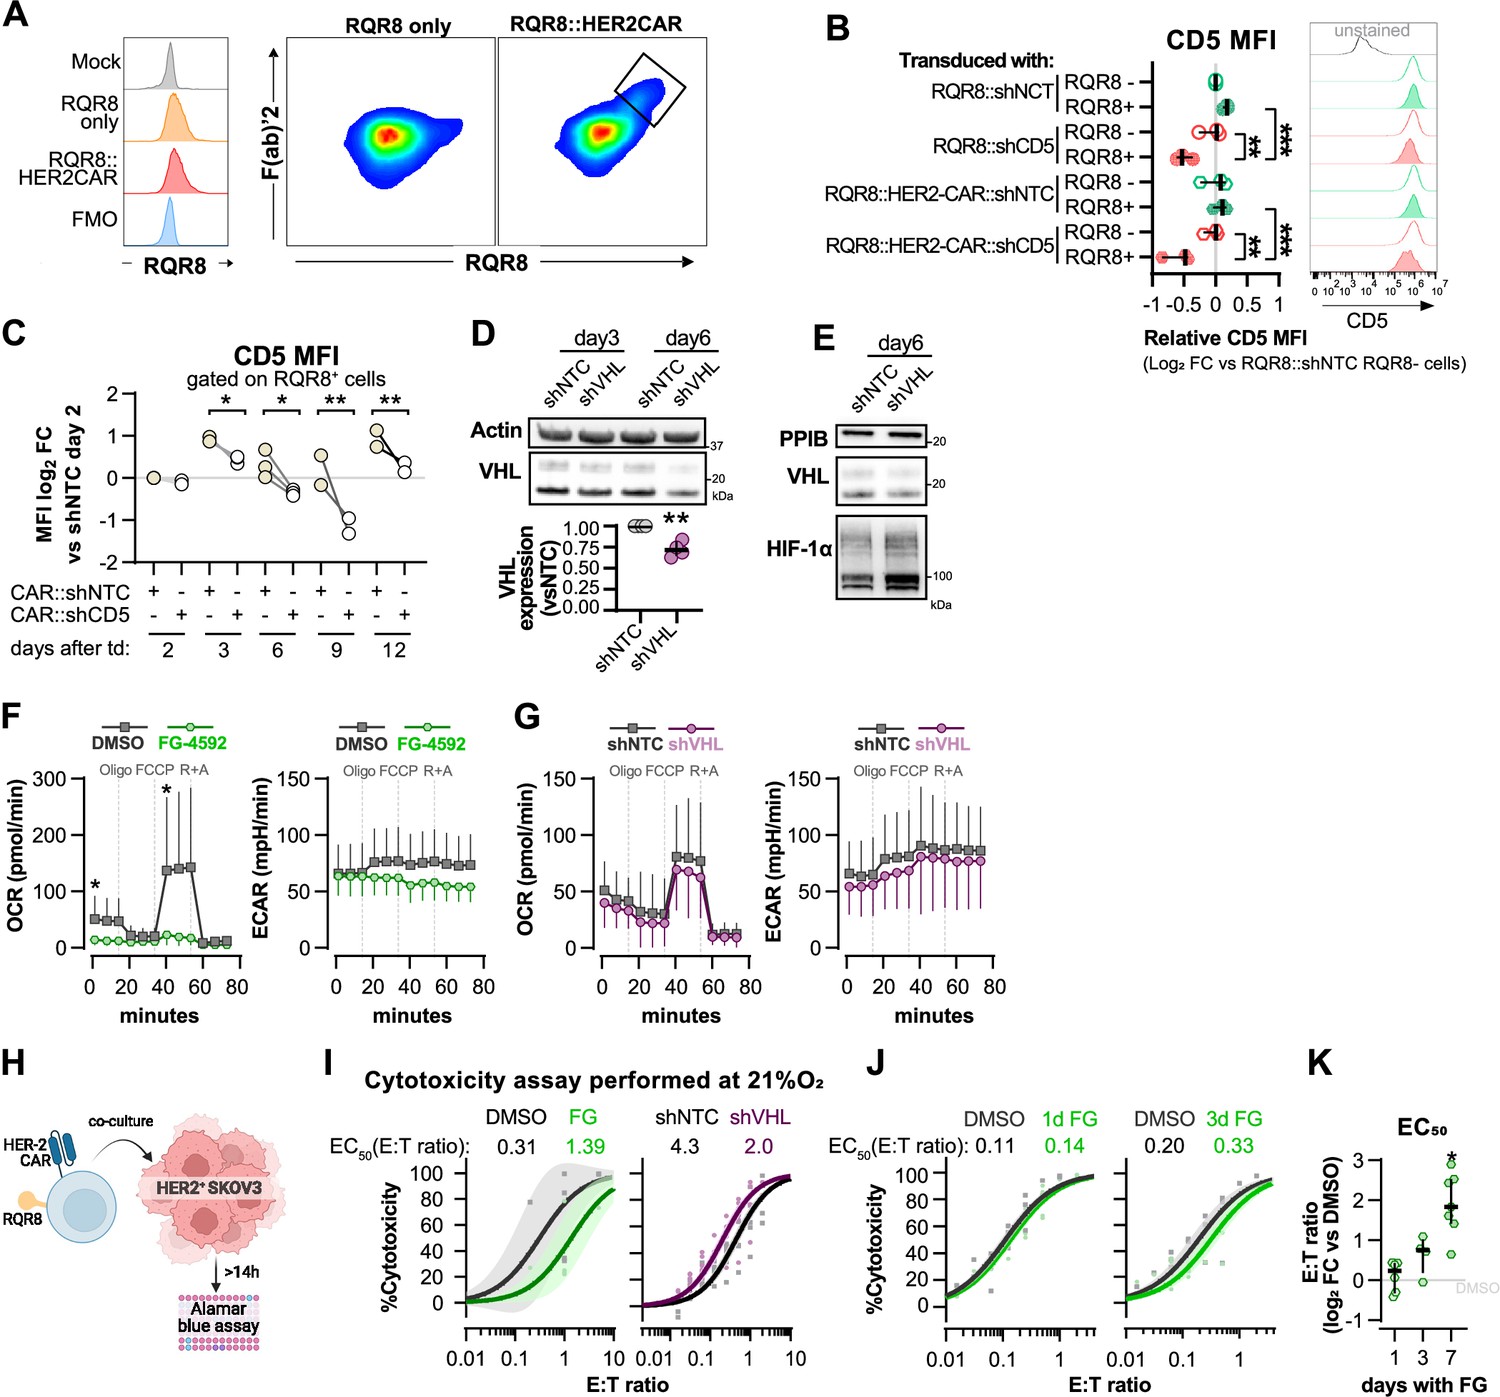
Validation of shRNA-CAR vectors and complementary analysis of FG-treated and VHL-silenced T cells.
(A) Histograms of RQR8 staining with Qbend/10 CDE34 antibody (left) and correlation between RQR8 and surface CAR staining with F(ab)’2. (B) CD8+ T cells were transduced with an shRNA vector against non-target control (NTC) or CD5, alone or in combination with HER2CAR. On day 6, CD5 median fluorescence intensity (MFI) was determined by flow cytometry in RQR8- (non-transduced) and RQR8 (transduced) events. MFI values are presented as log2 fold change (FC) relative to RQR8- cells from the population of cells transduced with RQR8-shRNA vectors. Histograms are representative flow cytometry plots for CD5 and are pre-gated on live, singlet, TCRαβ+ events. The dotted line in histograms was set according to the fluorescence peak of the control condition; n = 3, median ± IQR. (C) Activated human CD8+ T cells were transduced with an shRNA vector against non-target control (NTC) or CD5. MFI values of CD5 were analysed on days 2, 3, 6, 9, and 12 post-transduction and are presented as log2 FC relative to the NTC control in each day; n = 3. (D) Western blot analysis of VHL protein in CAR-T cells 3 and 6 d following transduction with shNTC or shVHL. Actin was used as loading control. Top: representative immunoblot; bottom: quantification of VHL expression relative to shNTC on day 6 (left). (E) VHL and HIF-1a expression 6 d after transduction with shNTC or shVHL. PPIB was used as loading control. (F, G) Seahorse analysis of human CD8+ T cells treated with FG-4592 or DMSO control (F) and transduced with shVHL or shNTC control (G) as shown in Figure 3A. ECAR and OCR traces obtained with mitochondria stress test involving injection of oligo, FCCP, and rotenone+antimycin A (R+A); n = 3–12. (H) Cytotoxicity assay with HER2 CAR-T cells. CAR-T cell number (RQR8+) was determined by flow cytometry, and cells were co-cultured with SKOV3 cell line in different effector:target rations for at least 14 hr in 21 or 1% O2. (I) Cytotoxicity assay as shown in Figure 3D and E but performed at 21% O2; n = 4–5. (J) Cytotoxicity assay as shown in Figure 3D but using 7 d expanded human CD8+ T cells treated with FG-4592 for 1 d (left) or 3 d (right) following T cell activation; n = 4. (K) EC50 values calculated from dose–response curves obtained from cytotoxicity assays shown in Figure 3D and Figure 3J; n = 4–7, median ± IQR. For all results (except panel F, G), each data point represents an independent donor. *o<0.05, **p<0.01, ***p<0.001; two-way ANOVA mixed-effect paired analysis with Šídák’s multiple-comparisons correction (B, C) and Wilcoxon matched-pairs signed-rank test relative to control (C–K).
-
Figure 3—figure supplement 1—source data 1
Raw data and detailed analysis for Figure 3—figure supplement 1.
- https://cdn.elifesciences.org/articles/84280/elife-84280-fig3-figsupp1-data1-v2.zip
Figure 4 with 1 supplement
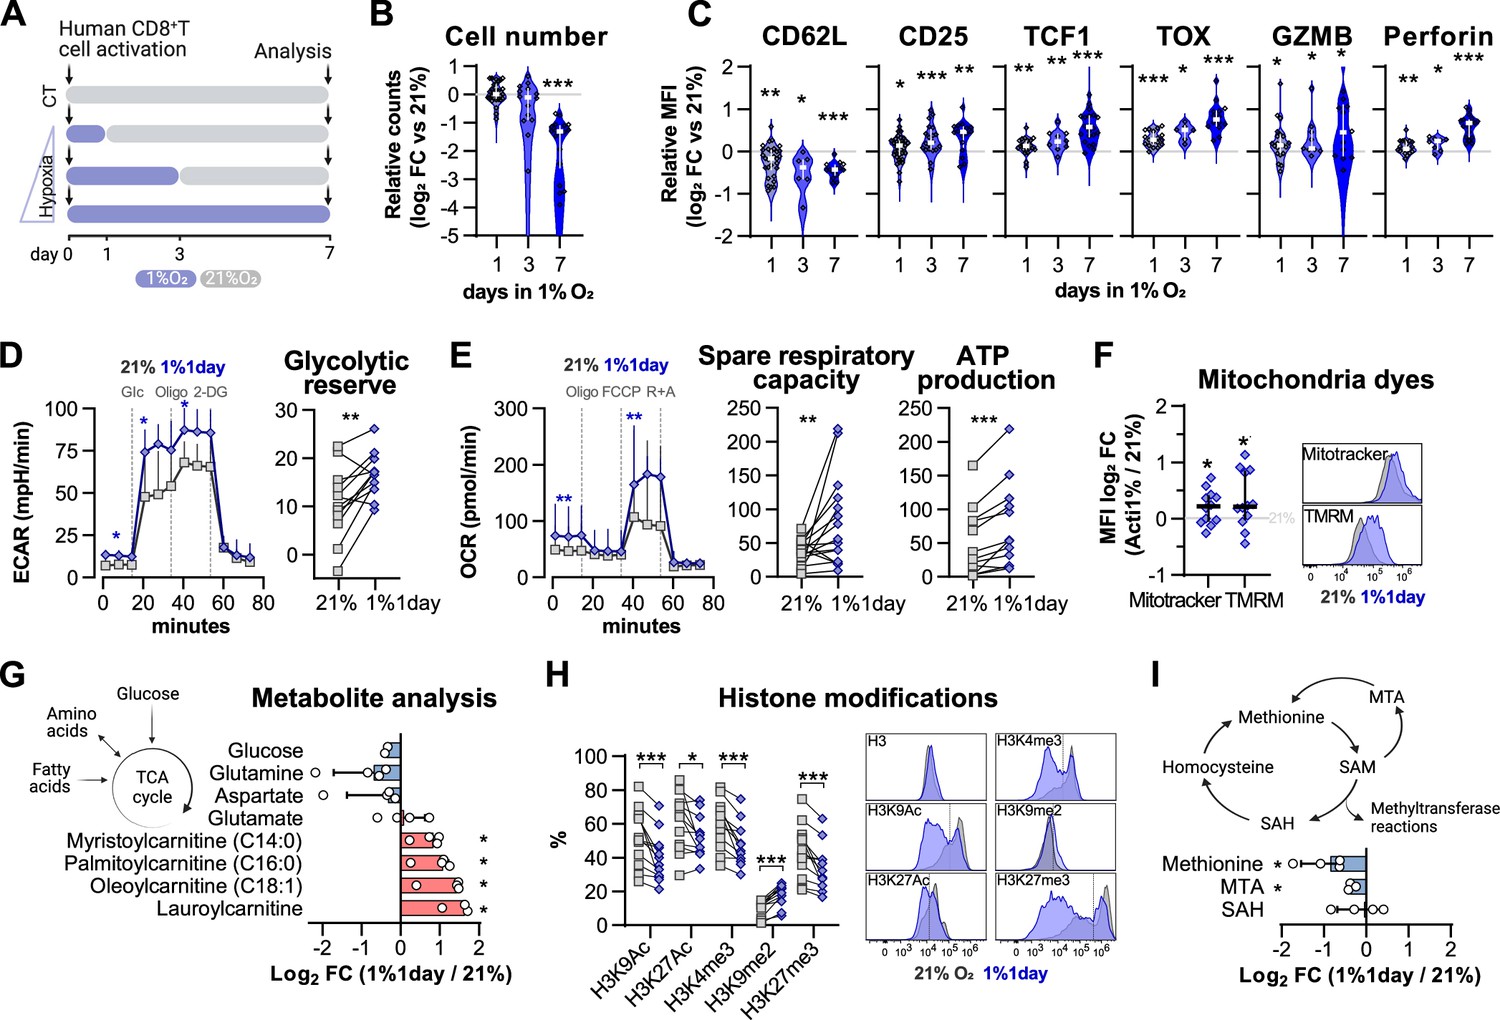
Impact of exposure to hypoxia in human CD8+ T cell differentiation and metabolism.
(A) Human CD8+ T cells were activated in 1% O2 for 1, 3, or 7 d. Cells continuously grown in 21% were used as control (CT), and all analyses were performed on day 7. (B) Number of CD8+ T cells after 7 d of increasing time of exposure to 1% O2 as shown in (A). Cell counts assessed by flow cytometry using counting beads and presented as log2 fold change (FC) relative to 21% cultures; n = 14–29. (C) Expression of differentiation markers shown as log2 FC in median fluorescence intensity (MFI) relative to 21% CT (horizontal grey line) following conditioning to 1% O2 as described in (A); n = 8–38. (D, E) Seahorse analysis of human CD8+ T cells exposed for 1 d to 1% O2 (1% 1 d) as shown in (A). (D) ECAR trace and glycolytic reserve obtained with glucose stress test involving injection of glucose (Glc), Oligomycin (Oligo), and 2-DG; (E) OCR trace, spare respiratory capacity, and ATP production obtained with mitochondria stress test involving injection of oligo, FCCP, and rotenone + antimycin A (R+A); n = 18–24. (F) Signal of Mitotracker DeepRed and TMRM in 1% 1 d CD8+ T cells. Left: log2 FC relative to 21% controls; right: representative histograms 21% control (grey) and 1% 1 d cells (blue); n = 12. (G) Mass spectrometry analysis metabolites feeding the TCA cycle including glucose, amino acids, and fatty acids. Shown as mean difference plots showing log2 FC of metabolite levels in 1%1 d cells relative to 21% grown CD8+ T cells; n = 3–4. (H) Flow cytometry analysis of post-translational histone modifications in 1% 1 d and 21%T cells. Left: proportion of cells expression high levels of each histone modification. Right: representative histograms for 21% controls (dark grey) and 1% 1 d cells (blue); includes total histone 3 (H3) expression profile and dotted line defines the gate for each marker; n = 12. (I) Mass spectrometry analysis of metabolites involved in the methionine cycle including methionine, S-adenosylhomocysteine (SAH), and 5-methylthioadenosine (MTA). S-Adenosyl methionine (SAM) and homocysteine were under detection limit. Results are shown as median ± IQR (expect panel G, H and J) or as before-after plots. Each data point represents an independent donor. *p<0.05, **p<0.01, ***p<0.001; Wilcoxon matched-pairs signed-rank test (B–E, H), and one-sample t test (F, G, I).
-
Figure 4—source data 1
Raw data and detailed analysis for Figure 4.
- https://cdn.elifesciences.org/articles/84280/elife-84280-fig4-data1-v2.zip
Figure 4—figure supplement 1
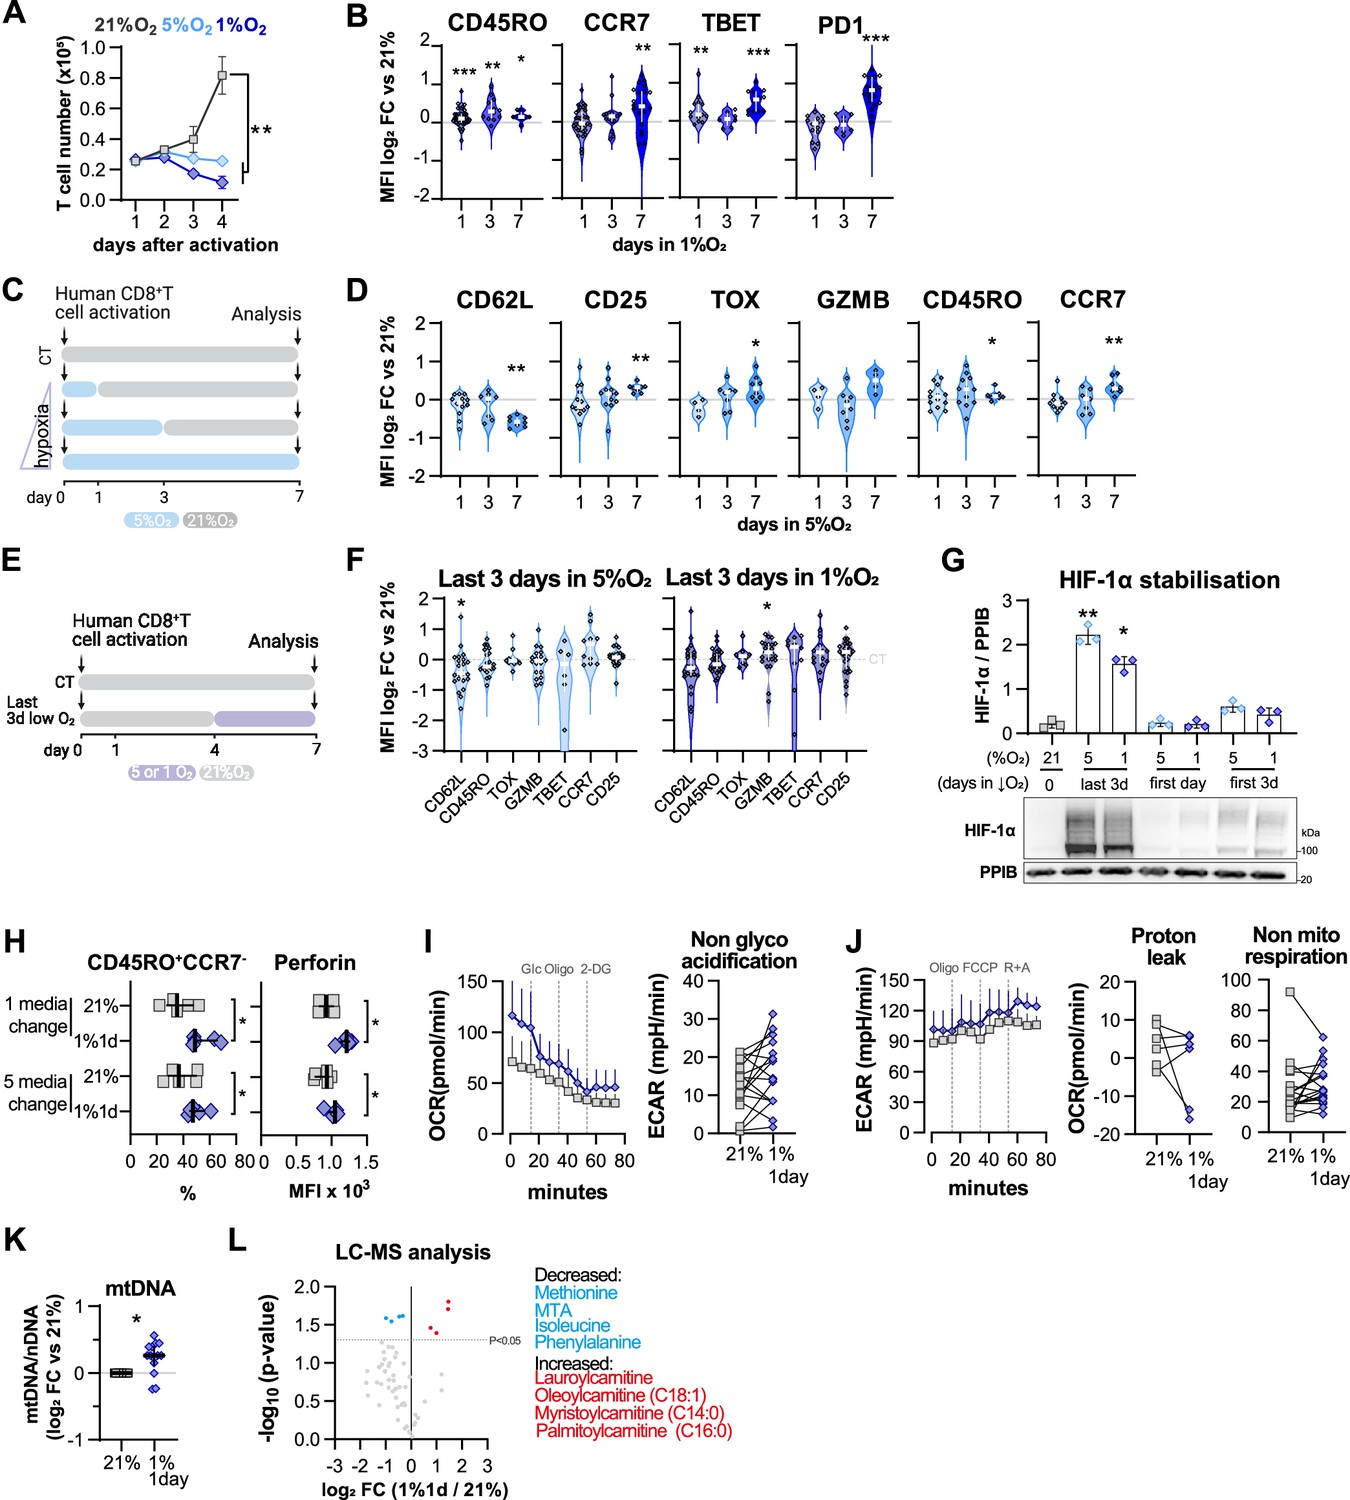
Effect of low oxygen conditioning protocols in human CD8+ T cell differentiation and metabolism.
(A) Expansion of human T cells in 21, 5, or 1% O2 as determined with automated cell counter; n = 4. (B) Expression of differentiation markers determined by flow cytometry and shown as log2 fold change in median fluorescence intensity (MFI) relative to 21% CT (horizontal grey line) following conditioning to 1% O2 as described in Figure 4A; n = 8–38. (C) Human CD8+ T cells were activated in 5% O2 for 1, 3, or 7 d. Cells continuously grown in 21% were used as control (CT). (D) Expression of differentiation markers determined by flow cytometry and shown as log2 fold change in MFI relative to 21% CT (horizontal grey line) following conditioning to 5% O2 as described in (C); n = 4–22. (E) Human CD8+ T cells were activated in 5 or 1% O2 for the last 3 d of a 7 d culture. Cells continuously grown in 21% were used as control (CT). (F) Expression of differentiation markers determined by flow cytometry and shown as log2 fold change in MFI relative to 21% CT (horizontal grey line) following conditioning to 5% (left) or 1% O2 (right) as described in (E). n = 8–38. (G) HIF-1α protein expression in nuclear extracts from human CD8+ T cells activated for 7 d. Conditions analysed: continuous culture in 21% O2 (CT); exposure for the last 3 d to 5 or 1% O2 (as shown in D); culture for 1 or 3 d in 5 or 1% as shown in (B) or Figure 4A, respectively. PPIB used as loading control. Top: quantification of HIF-1α expression normalised to PPIB; bottom: representative immunoblot; n = 3. (H) Proportion of CD45RO+CCR7- cells and MFI of perforin in 1% 1 d or 21% control human CD8+ T cells expanded for 7 d with a single media change on day 4 or with 5 media changes in separate days; n = 5. (I) OCR trace and non-glycolytic acidification relative to the glucose stress test shown in Figure 4D; n = 18–24. (J) ECAR trace, and proton leak and non-mitochondrial respiration relative to the mitochondria stress test shown in Figure 4E; n = 18–24. (K) Mitochondrial DNA (mtDNA) content in CD8+ T cells activated in 1% O2 for 1 d and changed to 21% O2 for 6 d. Data shown in log2 fold change relative to cells continuously maintained in 21% for 7 d. Nuclear DNA (nDNA) was used to normalise mtDNA content; n = 14. (L) Mass spectrometry analysis represented with mean difference plots showing log2 FC of metabolite levels in 1% 1 d cells relative to 21% grown CD8+ T cells. Blue and red circles respectively represent decreased and increased metabolites as defined by a paired t test p-value<0.05. Grey circles: non-differentially altered metabolites; n = 3–4. Apart from panel (L), all results were pooled from at least two independent experiments and are shown as median ± IQR; *p<0.05, **p<0.01, ***p<0.001; two-way ANOVA corrected with Tukey’s test (A), Wilcoxon matched-pairs signed-rank test relative to control (B–F and I–J), Kruskal–Wallis test relative to 21% corrected with Dunn’s test (G) and paired t test (H, K).
-
Figure 4—figure supplement 1—source data 1
Raw data and detailed analysis for Figure 4—figure supplement 1.
- https://cdn.elifesciences.org/articles/84280/elife-84280-fig4-figsupp1-data1-v2.zip
Figure 5 with 1 supplement
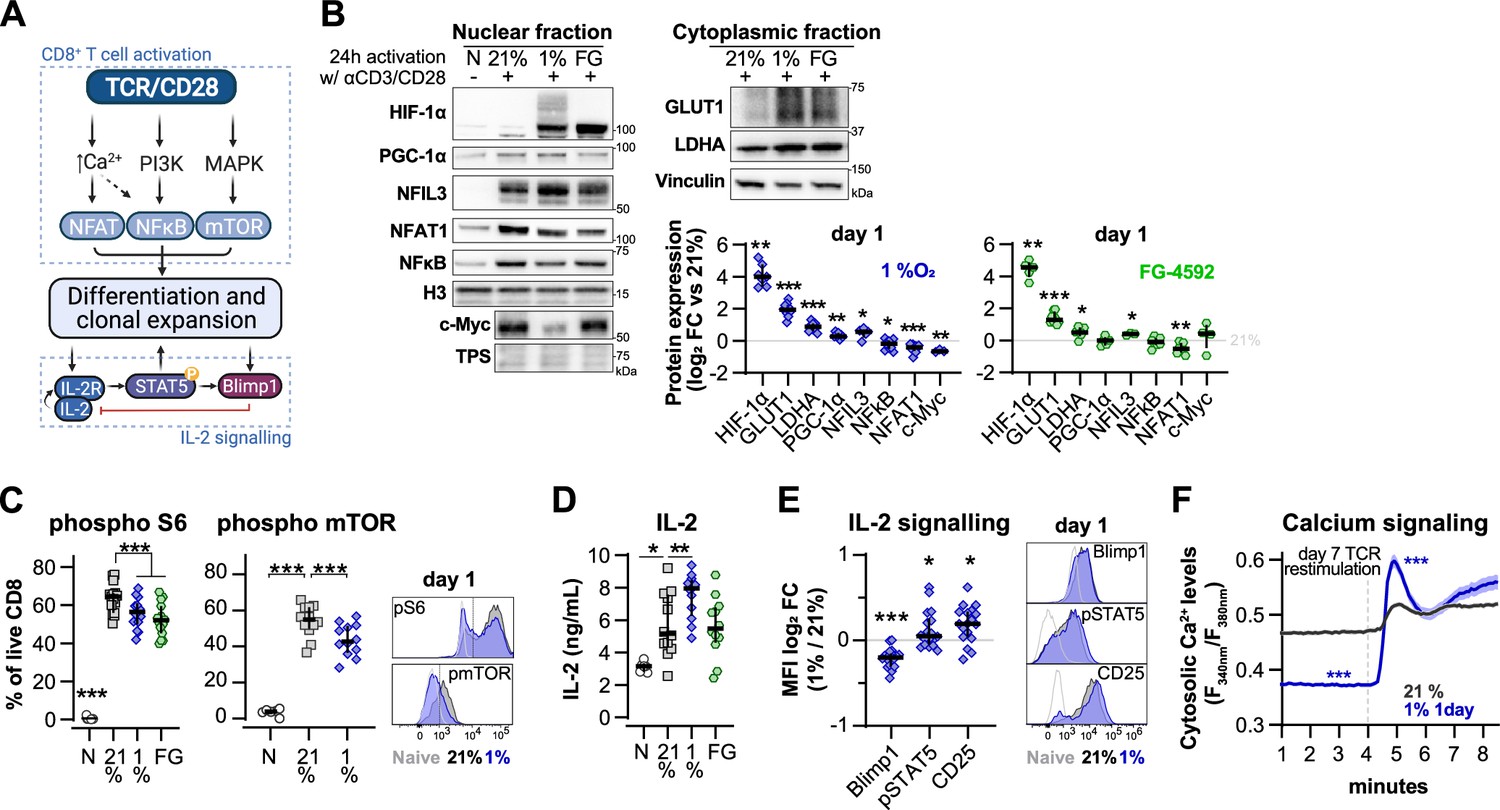
Effect of hypoxia and hypoxia-inducible factor (HIF) stabilisation in CD8+ T cell activation.
(A) TCR signalling. (B) Protein analysis 24 hr after activation of human CD8+ T cells in 21% O2, 1% O2, or 21% O2 + 50 µM FG-4592 (FG). Non-activated cells (N) were used as negative control. Histone 3, Lamin B, HDAC, or total protein stain (TPS) were used as loading control for nuclear fraction proteins, and vinculin was used as loading control for the cytoplasmic fraction. Left: representative immunoblots; right: log2 fold change (FC) in protein expression of cells activated in 1% (top) or with FG (bottom) relative to 21% DMSO controls; n = 3–12. (C) Flow cytometry analysis of the proportion of cells positive for phospho-S6 Ribosomal Protein (Ser235/236, left) and phosphor mTOR (Ser2448, middle) for the same experimental conditions described in (B). Right: representative histograms for naive (light grey) and cells activated in 21% (dark grey) and 1% O2 (blue); dotted line defines the gate for each marker; n = 6–15. (D) IL-2 ELISA performed on supernatant of cells activated for 1 d as described in (B); n = 6–12. (E) Flow cytometry analysis of Blimp1, phospho STAT5 (Y694, pSTAT5), and CD25 in cells activated in 1% O2 for 24 hr. Left: median fluorescence intensity (MFI) log2 FC relative to 21% O2. Right: representative histograms for naive (light grey) and cells activated in 21% (dark grey) and 1% O2 (blue). (I) OT-I T cells were activated for 24 hr in 1%O2 with SIINFEKL and expanded for 6 d in 21% O2 before single-cell cytosolic Ca2+ was measured by microscopy using the radiometric dye Fura-2AM (F340nm/F380nm) in the presence of 1 mM Ca2+ at day 7. Single-cell time-lapse imaging was performed at 5 s intervals with baseline fluorescence measured for 4 min, followed by another 6 min reading after addition of SIINFEKL. Number of cells analysed (21% control [grey], n = 249; 1% 1 d [blue], n = 128) are derived from multiple coverslips and two OT-I donor spleens; mean ± SEM. All results were pooled from at least two independent experiments and are shown as median ± IQR. Each data point represents an independent donor; *p<0.05, **p<0.01, ***p<0.001; one-sample t test (B), Šídák’s multiple-comparisons test relative to 21% (C, D), Wilcoxon matched-pairs signed-rank test (E) and Mann–Whitney test (F).
-
Figure 5—source data 1
Raw data and detailed analysis for Figure 5.
- https://cdn.elifesciences.org/articles/84280/elife-84280-fig5-data1-v2.zip
Figure 5—figure supplement 1
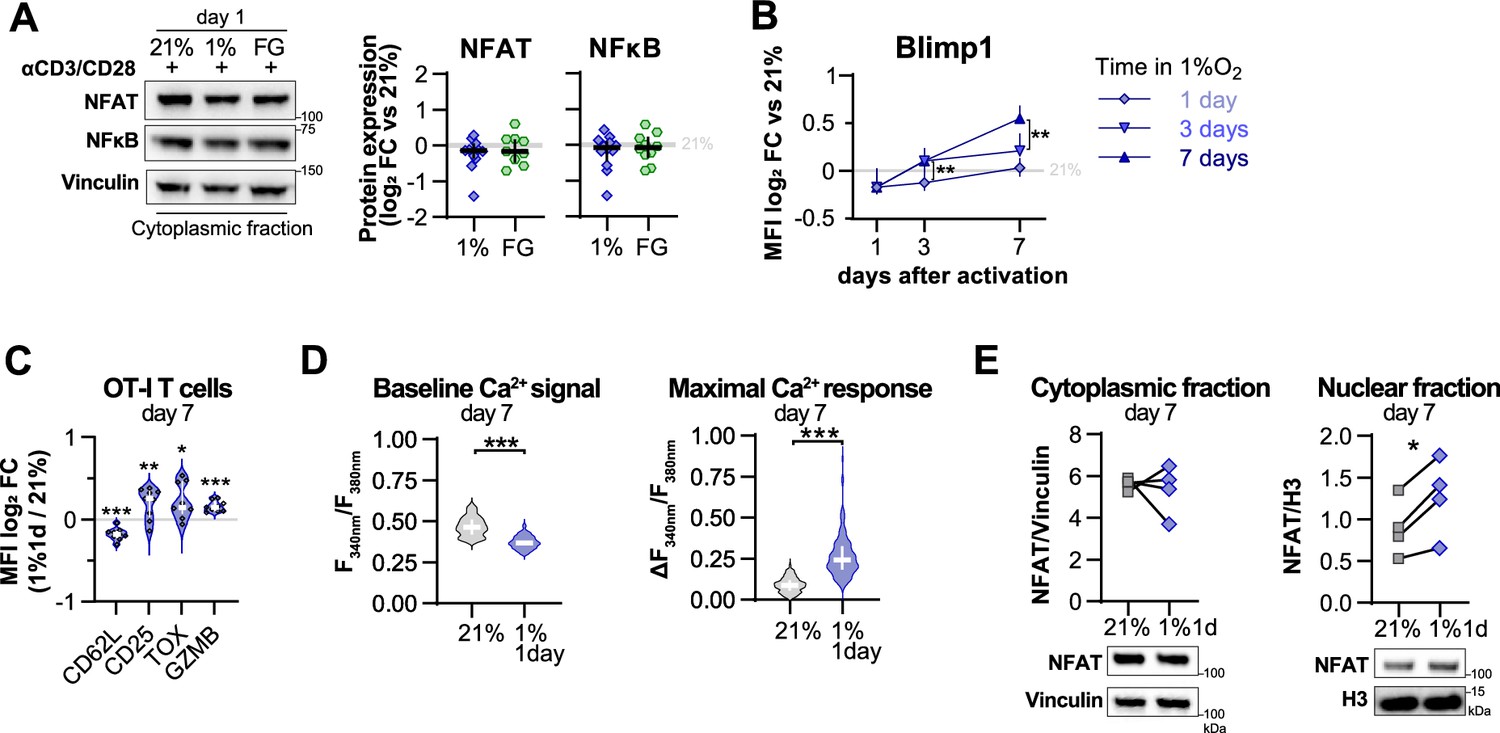
Effect of hypoxia and hypoxia-inducible factor (HIF) stabilisation in CD8+ T cell activation.
(A) Cytoplasmic protein analysis 24 hr post activation of human CD8+ T cells with anti-CD3/CD28 dynabeads in 21% O2, 1% O2, or 21% O2 + 50 µM FG-4592 (FG). Vinculin was used as loading control. Representative immunoblots (top) and quantification of NFAT and NFkB protein levels showed as log2 fold change (FC) relative to 21% DMSO controls; n = 3–10. (B) Time-course flow cytometry analysis of Blimp1 in human CD8+ T cells activated in 1% O2 for 1, 3, or 7 d; n = 8–23. (C) Expression of differentiation markers determined by flow cytometry in OT-I cells activated with anti-CD3/anti-CD28 dynabeads for 24 hr in 1% O2 and expanded for 6 d in 21% O2. Results are shown ad log2 FC in median fluorescence intensity (MFI) relative to 21% control cells (horizontal grey line); n = 9. (D) Baseline cytosolic Ca2+ level (left) and maximal Ca2+ response following addition of SINFEKL (right) in OT-I T-cells activated in 1% O2 for 1 d and expanded for 6 d in 21% O2. Maximal Ca2+ responses to TCR stimulation were calculated relative to baseline = Δ F340nm/F380nm = max (F340nm/F380nm) – baseline (F340nm/F380nm). Number of cells analysed (21% grey, n = 249; 1% 1 d blue, n = 128) are derived from multiple coverslips and two OT-I donor spleens; mean ± SEM. (E) NFAT1 protein expression in cytoplasmic and nuclear fraction of human CD8+ T cells activated for 24 hr in 1% O2 and expanded for 6 d in 21% O2. Vinculin and histone 3 were used as loading controls for cytoplasmic and nuclear fractions, respectively. Representative immunoblots (top) and normalised protein expression (bottom); n = 4. All results are shown as median ± IQR, and each data point represents an individual donor; *p<0.05, **p<0.01, ***p<0.001; two-way ANOVA corrected with Tukey’s test (B), paired t test (C, E) and Mann–Whitney test (D).
-
Figure 5—figure supplement 1—source data 1
Raw data and detailed analysis for Figure 5—figure supplement 1.
- https://cdn.elifesciences.org/articles/84280/elife-84280-fig5-figsupp1-data1-v2.zip
Figure 6 with 1 supplement
Effects of short hypoxic conditioning in T cell function against solid tumours.
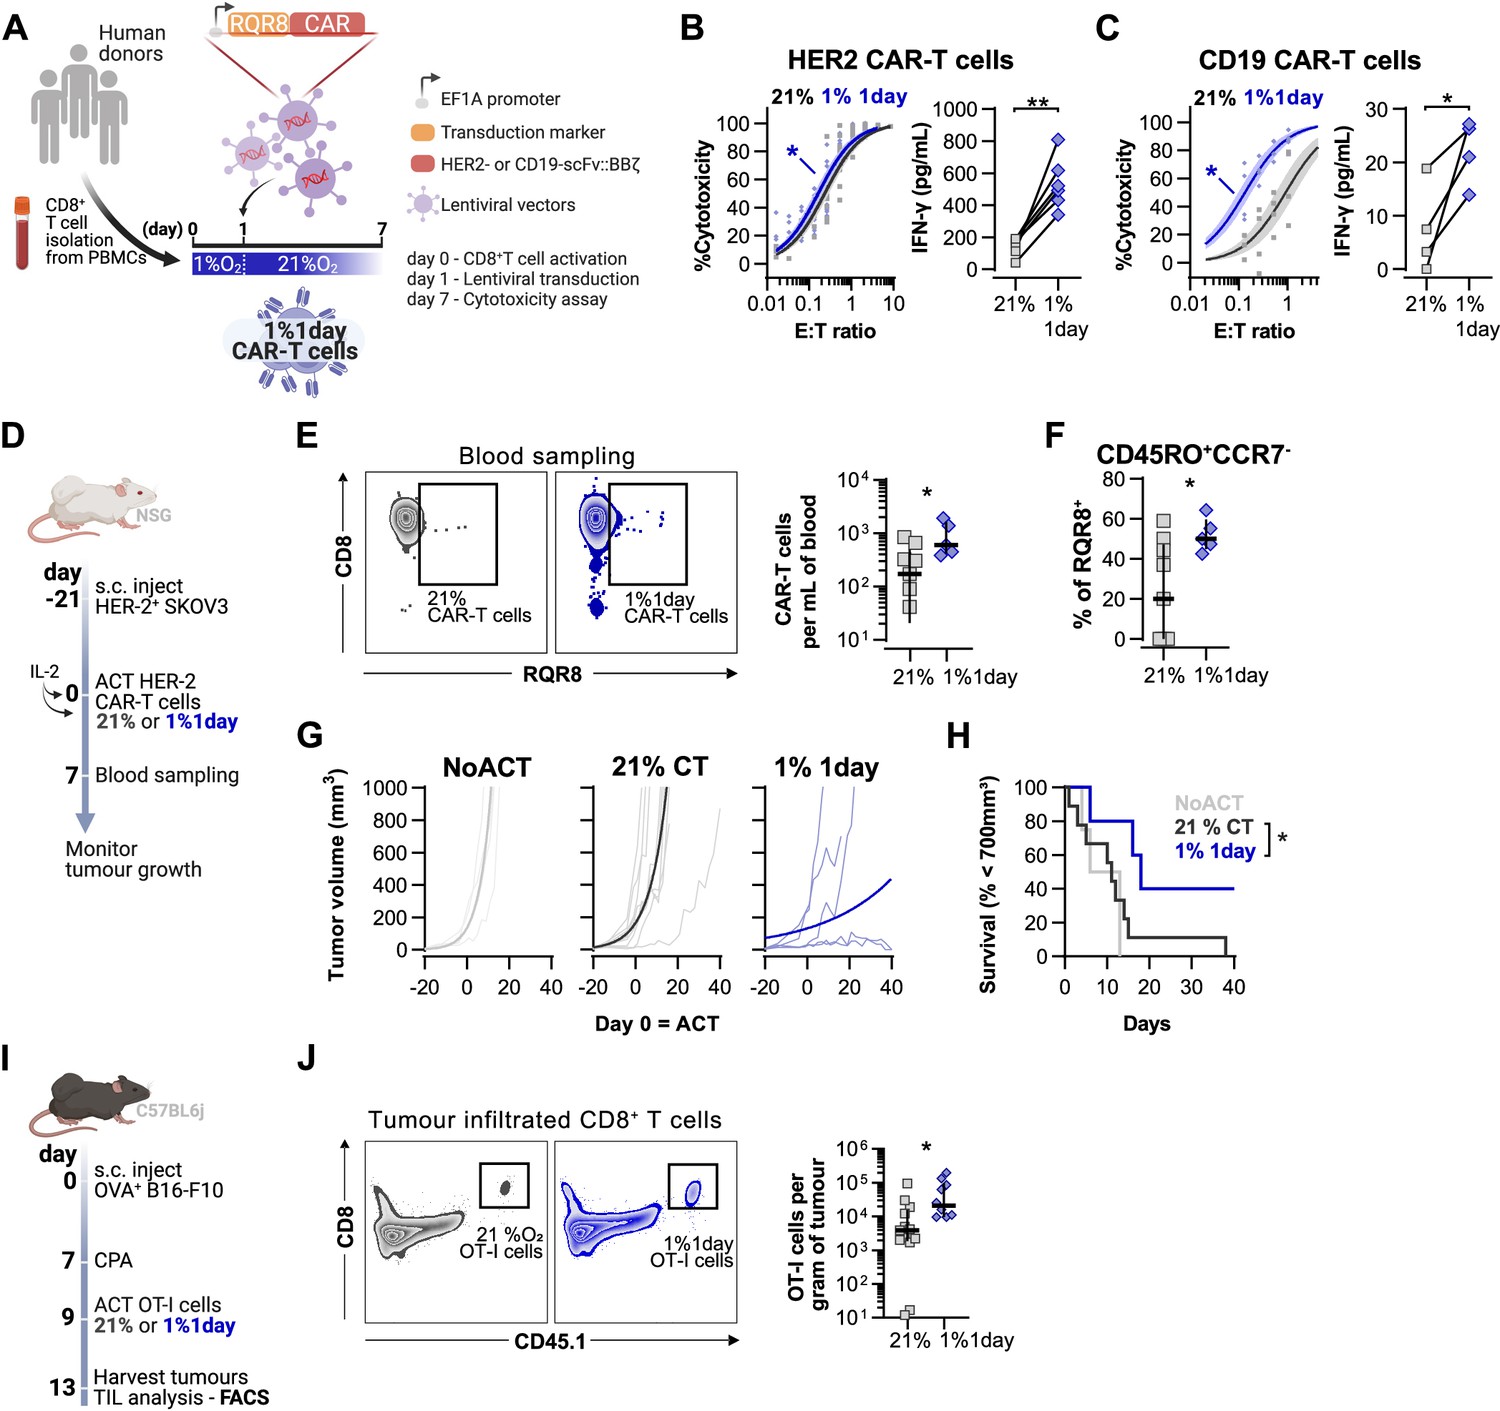
(A) Generation of CAR-T cells. Human CD8+ T cells were activated, transduced with HER2- or CD19-CAR vectors the day after and assayed on day 7. Cells were activated in 1% O2 for 24 hr and swapped to 21% until day 7. CAR-T cells continuously maintained in 21% O2 were used as controls and RQR8 was used as transduction marker. (B) In vitro cytotoxicity assay with HER2 CAR-T cells cultured according to (A). CAR-T cells were co-cultured with SKOV3 tumour cells at different effector:target (E:T) ratios and cytotoxicity was assessed after 14–18 hr of co-culture at 1% O2. Left: dose–response curves (plotted with 95% confidence intervals represented in shaded areas) determined with non-linear regression ([agonist] vs. normalised response); right: EC50 values obtained from non-linear regression; n = 6. (C) In vitro cytotoxicity assay with CD19 CAR-T cells cultured according to (A). CAR-T cells were co-cultured with RAJI tumour cells at a E:T ratio of 2:1 and cytotoxicity was assessed after 14–18 hr of co-culture at 5% O2. Left: cytotoxicity relative to cells transduced with vector control containing RQR8 alone; right: IFN-γ ELISA using supernatants of the co-culture between CAR-T cells and RAJI; n = 4. (D) Model of CAR-T cell therapy. NOD.Cg-PrkdcscidIl2rgtm1Wjl/SzJ mice were inoculated with SKOV3 cells and injected with HER2 CAR-T cells generated according to (A). Peripheral blood was sampled and analysed by flow cytometry. Tumour growth was monitored every 2–3 d until day 40. (E) Blood analysis on day 14. Left: representative flow cytometry plots with events pre-gated on live, singlet, human CD45+. Right: frequency of adoptively transferred CAR-T cells per millilitre of peripheral blood; n = 5–7. (F) Percentage CD45RO+CCR7- cells among RQR8+ cells in peripheral blood on day 7 after ACT; n = 5–7. (G) Tumour growth curves. Animals not receiving T cells (NoACT) were used as negative controls. Thin lines: individual animals; thick lines: Malthusian growth curve fit; n = 5–12. (H) Survival curves for tumour growth shown in (F). Threshold for survival was set at 700 mm3. (I) Tumour infiltration model. C57BL/6j mice were injected subcutaneously with OVA-expressing B16-F10 tumour cells and 7 d later were lymphodepleted with CPA. Mice bearing tumours for 9 d were then intraperitoneally injected with OT-I cells continuously expanded for 7 d in 21% or conditioned to 1% O2 during the first 24 hr of TCR stimulation. Tumours were harvested on day 13 and processed to single-cell suspensions for flow cytometric analysis of tumour-infiltrated lymphocytes (TIL). Endogenous and adoptive populations of TILs were distinguished by the allelic variants of CD45. (J) Representative flow cytometry plots pre-gated on live, singlet, CD45+ events (left) and OT-I cells per gram of tumour (right); n = 10–12. *p<0.05, **p<0.01, ***p<0.001; Wilcoxon matched-pairs signed-rank test relative to control (B), Mann–Whitney test relative to control (C, E, F) and log-rank (Mantel–Cox) test relative to 21% (H).
-
Figure 6—source data 1
Raw data and detailed analysis for Figure 6.
- https://cdn.elifesciences.org/articles/84280/elife-84280-fig6-data1-v2.zip
Figure 6—figure supplement 1
Evaluation of different protocols of low oxygen conditioning in CAR-T cell function.
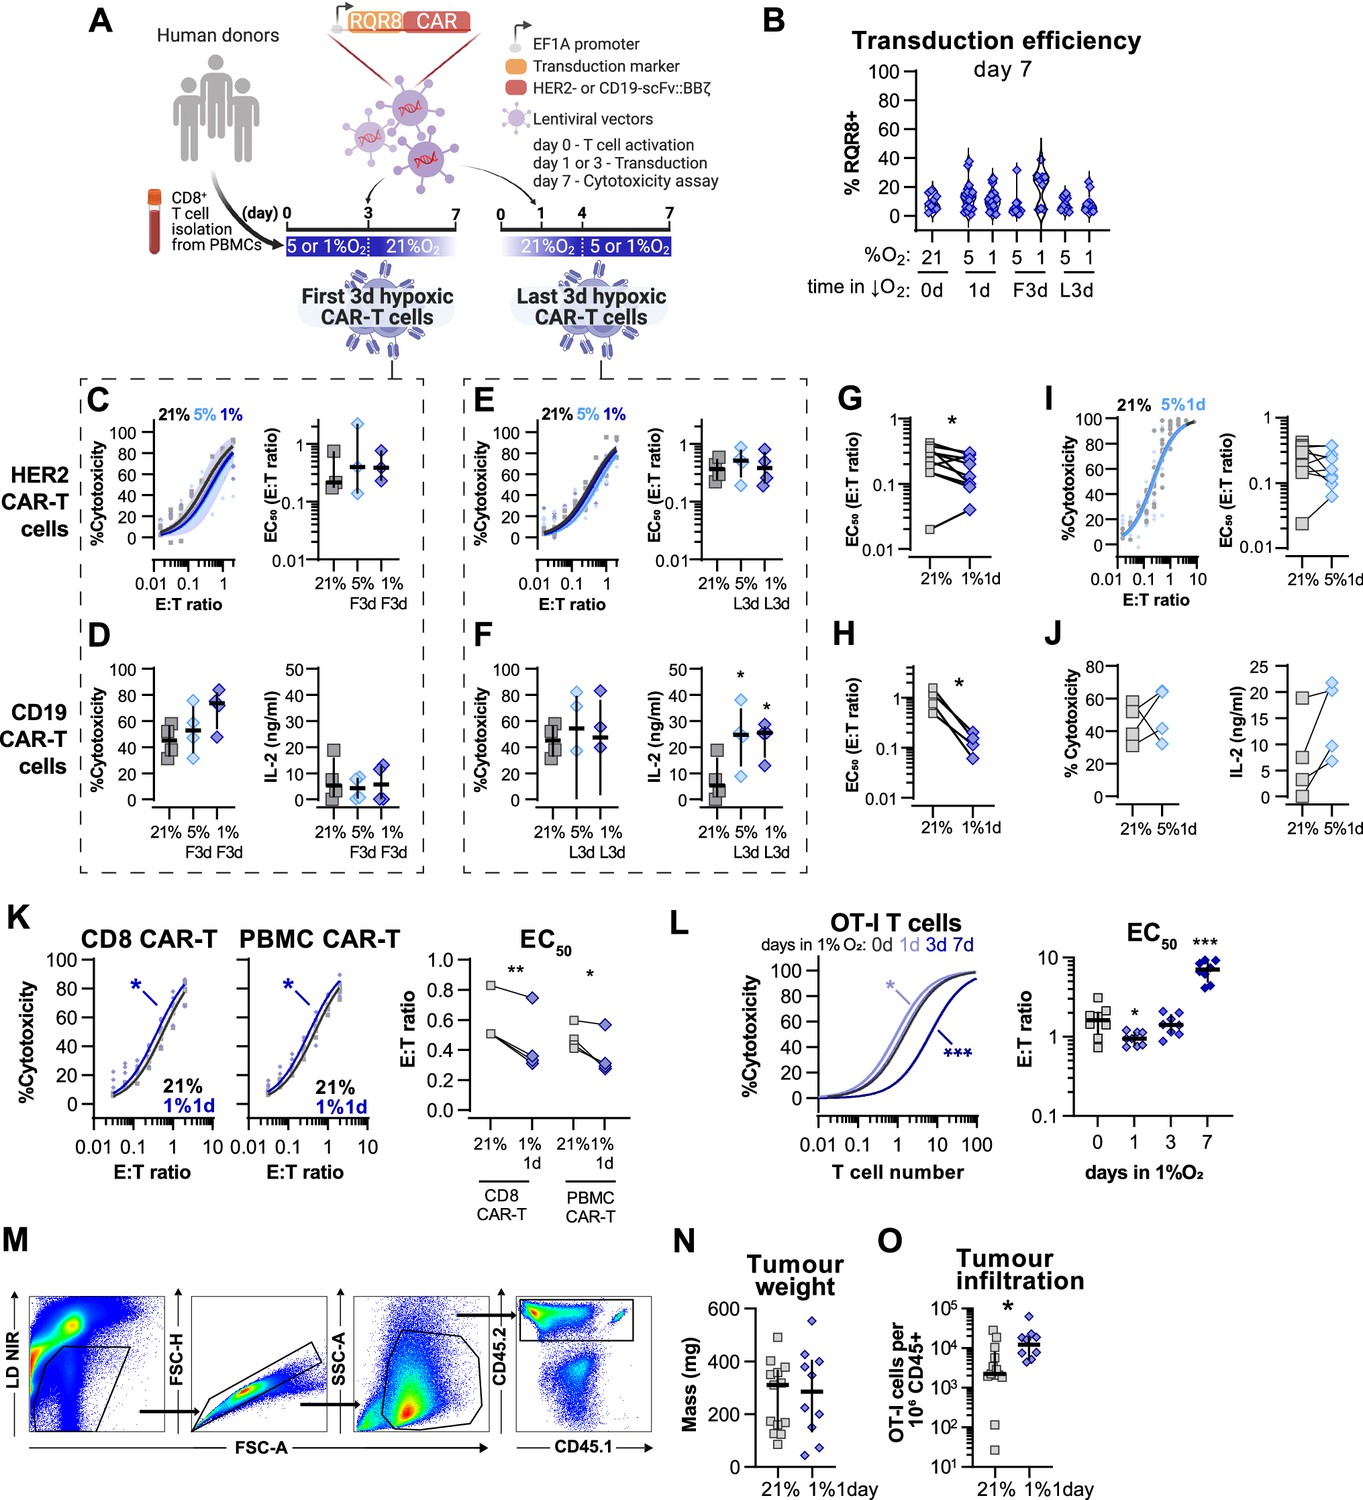
(A) Human CD8+ T cells were activated, transduced with HER2- or CD19-CAR vectors the day after, and assayed on day 7. Cells were activated in 5 or 1% O2 for 3 d and swapped to 21% until day 7 or activated in 21% for 4 d and swapped to 5 or 1% O2 until day 7. CAR-T cells continuously maintained in 21% O2 were used as controls and RQR8 was used as transduction marker. (C) In vitro cytotoxicity assay with HER2 CAR-T cells conditioned to low oxygen for the first 3 d (F3d) of a 7 d culture as shown in (A). HER2 CAR-T cells were co-cultured with SKOV3 tumour cells at different effector:target (E:T) ratios and cytotoxicity was assessed after 14–18 hr of co-culture at 1% O2. Left: dose–response curves (plotted with 95% confidence intervals represented in shaded areas) determined with non-linear regression ([agonist] vs. normalised response); right: EC50 values obtained from non-linear regression; n = 4. (D) In vitro cytotoxicity assay with CD19 CAR-T cells conditioned to low oxygen for F3d of a 7 d culture as shown in (A). CD19 CAR-T cells were co-cultured with RAJI tumour cells at a E:T ratio of 2:1 and cytotoxicity was assessed after 14–18 hr of co-culture at 5% O2. Left: cytotoxicity relative to cells transduced with vector control containing RQR8 alone; right: IFN-γ ELISA using supernatants of the co-culture between CAR-T cells and RAJI; n = 3–4. (E) In vitro cytotoxicity assay with HER2 CAR-T cells conditioned to low oxygen for the last 3 d (L3d) of a 7 d culture as shown in (A). HER2 CAR-T cells used as described in (B); n = 4. (F) In vitro cytotoxicity assay with CD19-CAR T cells conditioned to low oxygen for L3d of a 7 d culture as shown in (D). CD19-2 CAR-T cells used as described in (C); n = 3–4. (G) EC50 values calculated from dose–response curves obtained from cytotoxicity assays showed in Figure 6B. (H) EC50 values calculated from dose–response curves obtained from cytotoxicity assays showed in Figure 6C. (I) Same experiment described in Figure 5B but with conditioning to 5% O2 instead of 1%O2. (J) Same experiment described in Figure 5C but with conditioning to 5% O2 instead of 1%O2. (K) In vitro cytotoxicity assay with HER2 CAR-T prepared from isolated human CD8+ T cells (CD8 CAR-T) or from human peripheral blood mononuclear cells (PBMCs) (PMBC CAR-T). Both CD8 and PBMC CAR-T cells were cultured for 7 d either in 21% or for 1 d in 1% O2 as shown in Figure 6A. CAR-T cells were co-cultured with SKOV3 tumour cells at different effector:target (E:T) ratios and cytotoxicity was assessed after 14–18 hr of co-culture at 21% O2. Left: dose–response curves (plotted with 95% confidence intervals represented in shaded areas) determined with non-linear regression ([agonist] vs. normalised response); right: EC50 values obtained from non-linear regression; n = 4. (L) In vitro cytotoxicity assay with OT-I cultured for 7 d either in 21% or for 1, 3, or 7 d in 1% O2. OT-I cells were co-cultured with B16-OVA tumour cells at different effector:target (E:T) ratios and cytotoxicity was assessed after 14–18 hr of co-culture at 21% O2. Left: dose–response curves (plotted with 95% confidence intervals represented in shaded areas) determined with non-linear regression ([agonist] vs. normalised response); right: EC50 values obtained from non-linear regression; n = 8. (M) Gating strategy for analysis of tumour infiltrated lymphocytes. (N) Weights of tumours analysed for lymphocyte infiltration on day 14; n = 10–12. (O) OT-I cells per million CD45 cells infiltrated in the tumours; n = 10–12. All results shown as median ± IQR; *p<0.05, **p<0.01; paired t test (G–K), Dunnett’s multiple-comparisons test vs. day 0 (L) and Mann–Whitney test (O).
-
Figure 6—figure supplement 1—source data 1
Raw data and detailed analysis for Figure 6—figure supplement 1.
- https://cdn.elifesciences.org/articles/84280/elife-84280-fig6-figsupp1-data1-v2.zip
Figure 7
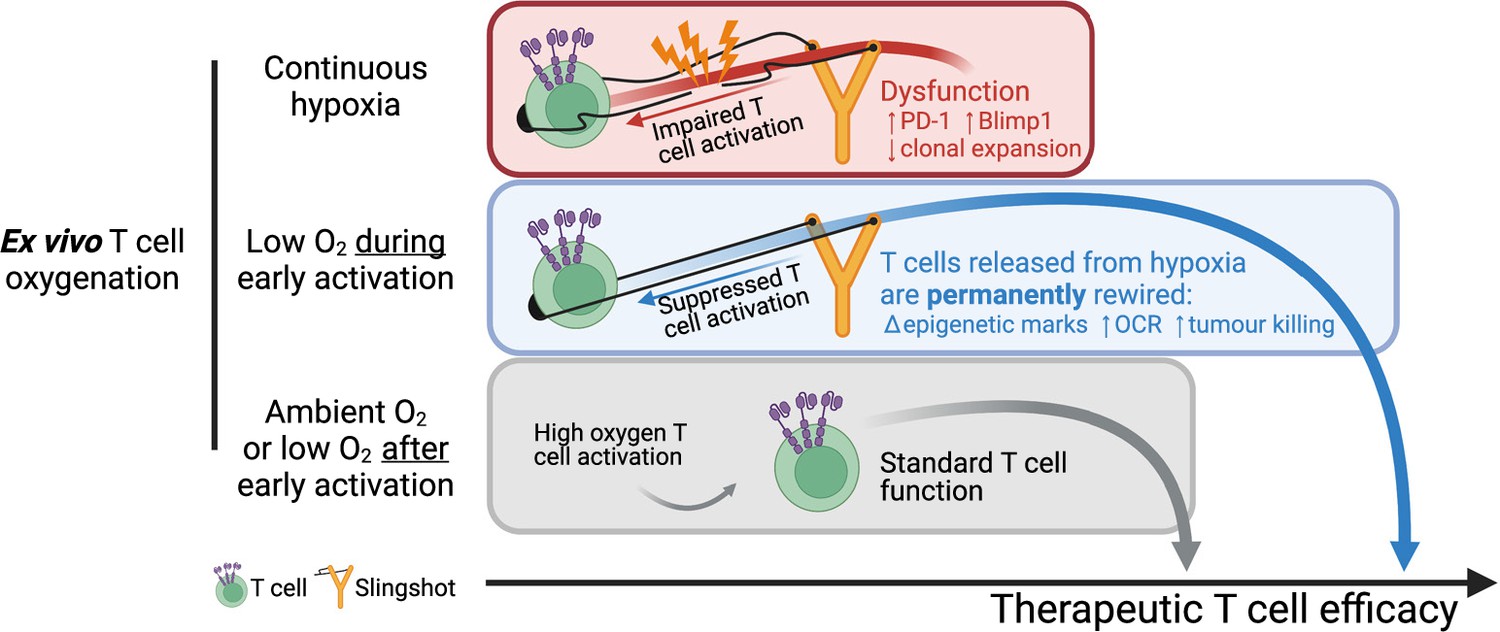
Summary of manuscript findings.
Ex vivo culture of T cells in low oxygen continuously impairs T cell growth, increases expression of checkpoint receptor PD-1 and increased expression of IL-2 signalling repressor Blimp1. On the other hand, low O2 conditioning exclusively during early activation (first 24 hr in 1% O2) supresses T cell activation signalling but results in a permanent shift in histone modifications, increased OCR and ECAR, and increased antitumour function. These effects elicited by low oxygen condition include HIF-dependent and HIF-independent mechanisms such as altered NFAT and PGC-1α expression, respectively. T cells conditioned in low oxygen after early activation (day 3 onwards) are functionally similar to cells continuously grown in 21%. Altogether, these data indicate that while prolonged exposure to 1% O2 is immunosuppressive, the temporary repression of T cell activation elicited by a short low oxygen conditioning functionally benefits T cells after they are released from the initial hypoxia-induced T cell repression.
Additional files
-
Supplementary file 1
List of antibodies used for flow cytometry.
Species reactivity: mouse (M), human (H), or both (M/H).
- https://cdn.elifesciences.org/articles/84280/elife-84280-supp1-v2.docx
-
Supplementary file 2
List of antibodies used for western blot analysis.
- https://cdn.elifesciences.org/articles/84280/elife-84280-supp2-v2.docx
-
Supplementary file 3
List of protein sequences and DNA sequences corresponding to miRNA-embedded shRNAs used in viral vectors.
- https://cdn.elifesciences.org/articles/84280/elife-84280-supp3-v2.docx
-
MDAR checklist
- https://cdn.elifesciences.org/articles/84280/elife-84280-mdarchecklist1-v2.docx
Download links
A two-part list of links to download the article, or parts of the article, in various formats.
Downloads (link to download the article as PDF)
Open citations (links to open the citations from this article in various online reference manager services)
Cite this article (links to download the citations from this article in formats compatible with various reference manager tools)
Oxygen levels at the time of activation determine T cell persistence and immunotherapeutic efficacy
eLife 12:e84280.
https://doi.org/10.7554/eLife.84280


