Dynamic metabolome profiling uncovers potential TOR signaling genes
- Institute of Molecular Systems Biology, ETH Zurich, Switzerland
- Department of Molecular Biology, University of Geneva, Switzerland
Figures
Figure 1 with 4 supplements
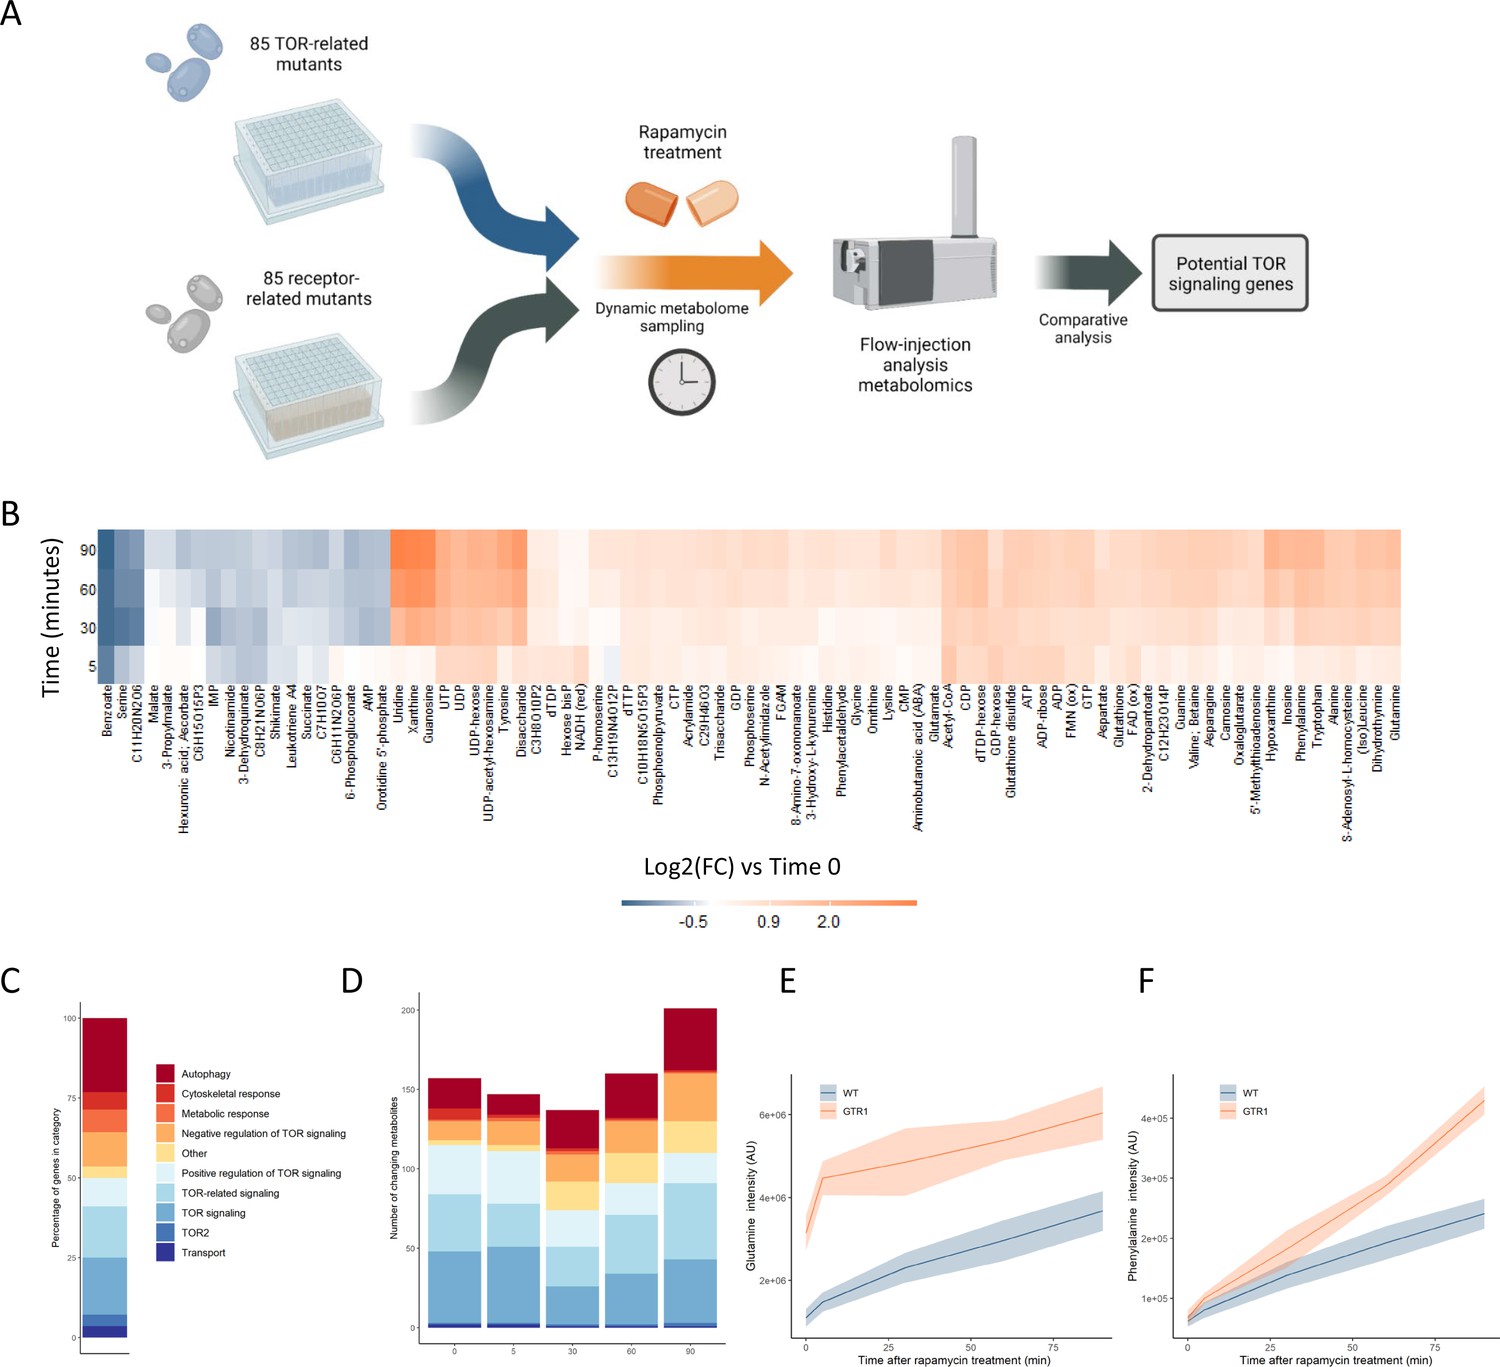
Metabolome profiling of TOR and receptor-related mutants captures dynamic metabolome changes.
(A) A schematic diagram illustrating the study design. (B) The effect of rapamycin treatment over time is shown for wild-type cells after the indicated duration of rapamycin treatment compared with the untreated control condition. Only metabolites that show a significant (p-value<0.05, two-sided t-test) are shown. (C) The share of TOR-related mutants included in the study falling into each of the indicated categories is indicated. (D) The number of significantly changing metabolites across the mutants in the indicated categories is shown for each duration of rapamycin treatment. Significantly changed metabolites show an absolute log2 transformed fold-change compared with wild-type of >0.5, and a p-value of <0.05 based on a two-sided Student's t-test. (E, F) The normalized ion intensities for glutamine and phenylalanine in wild-type and gtr1 yeast are shown after the indicated duration of rapamycin treatment. The central lines indicate the median value across four biological replicates. Shaded areas indicate the standard deviation across replicates.
Figure 1—figure supplement 1
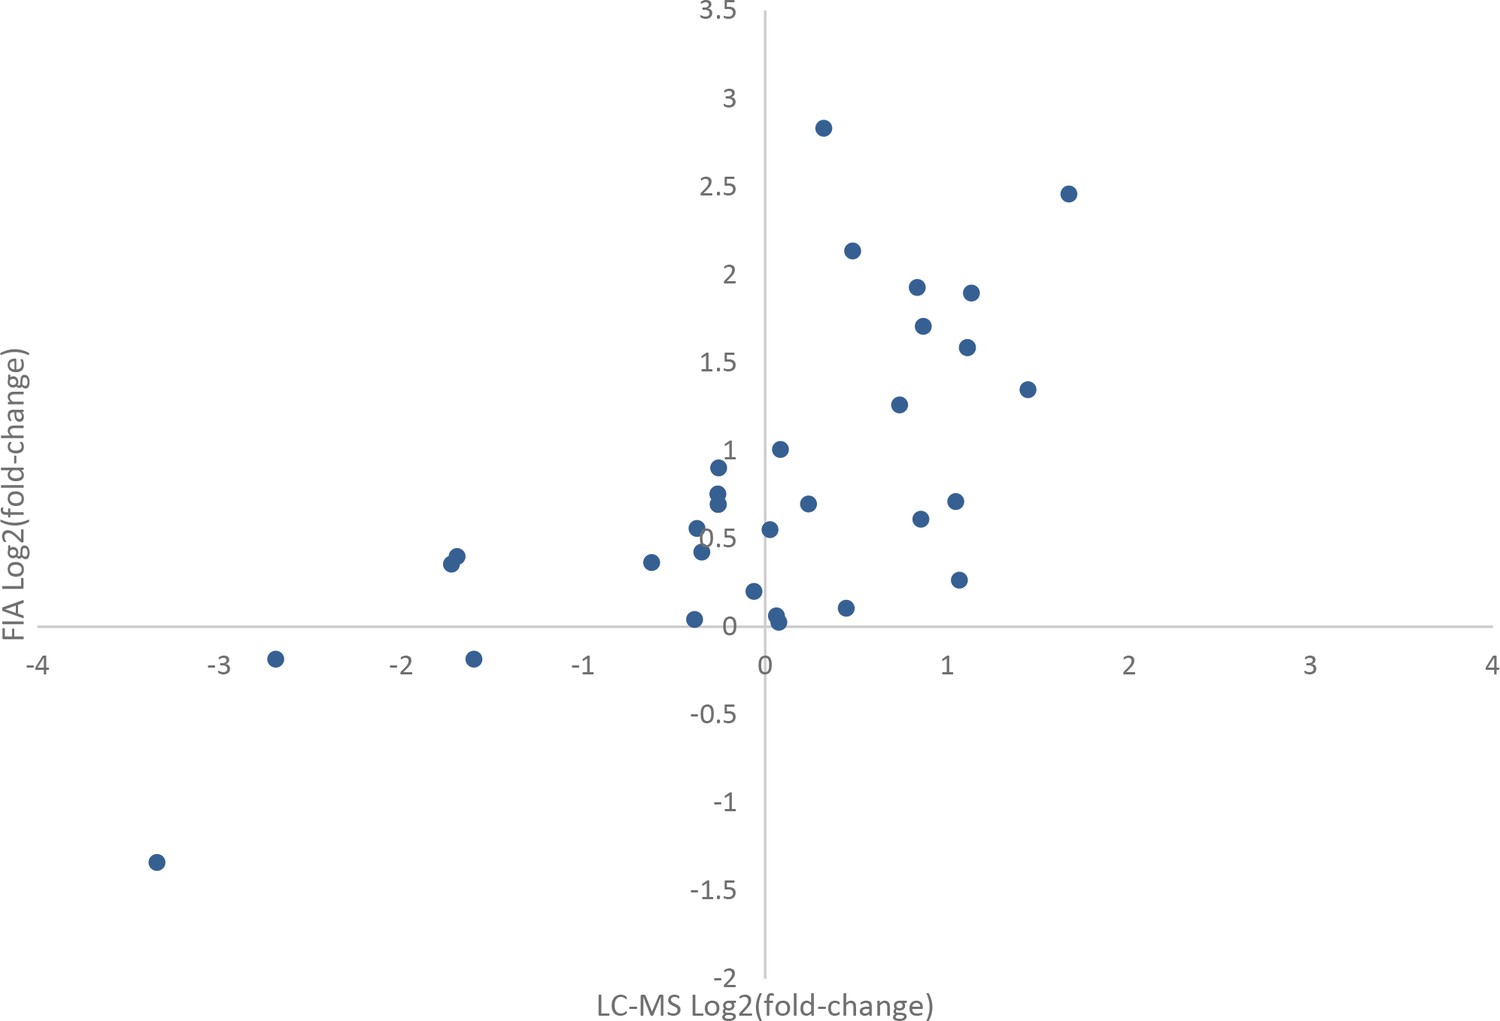
Comparison of effects of rapamycin treatment on the metabolome as measured by flow injection and liquid chromatography-mass spectrometry (LC-MS).
The average log2 transformed fold-changes for metabolites in wild-type yeast treated with 400 ng/mL rapamycin are compared between flow-injection and LC-MS measurements. Points indicate the average log2 fold-change for three biological replicates for a metabolite that was measured using both analytical systems.
Figure 1—figure supplement 2
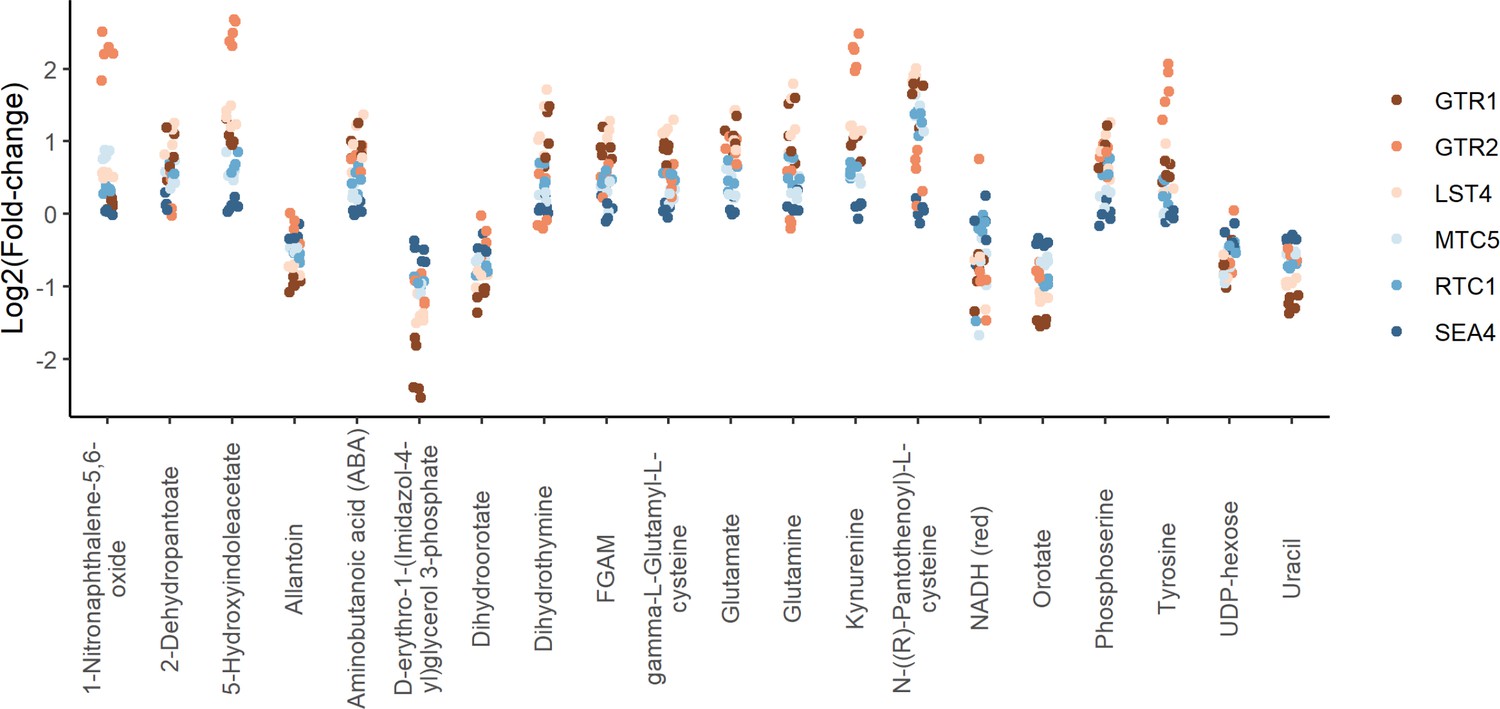
Positive regulators of TORC1 signaling show similar metabolite changes.
The log2 transformed fold-changes for each indicated mutant compared to the wild-type control are shown across the metabolites that demonstrated the largest changes in metabolite levels across the group. Each point indicates the fold-change at one time point for one mutant.
Figure 1—figure supplement 3
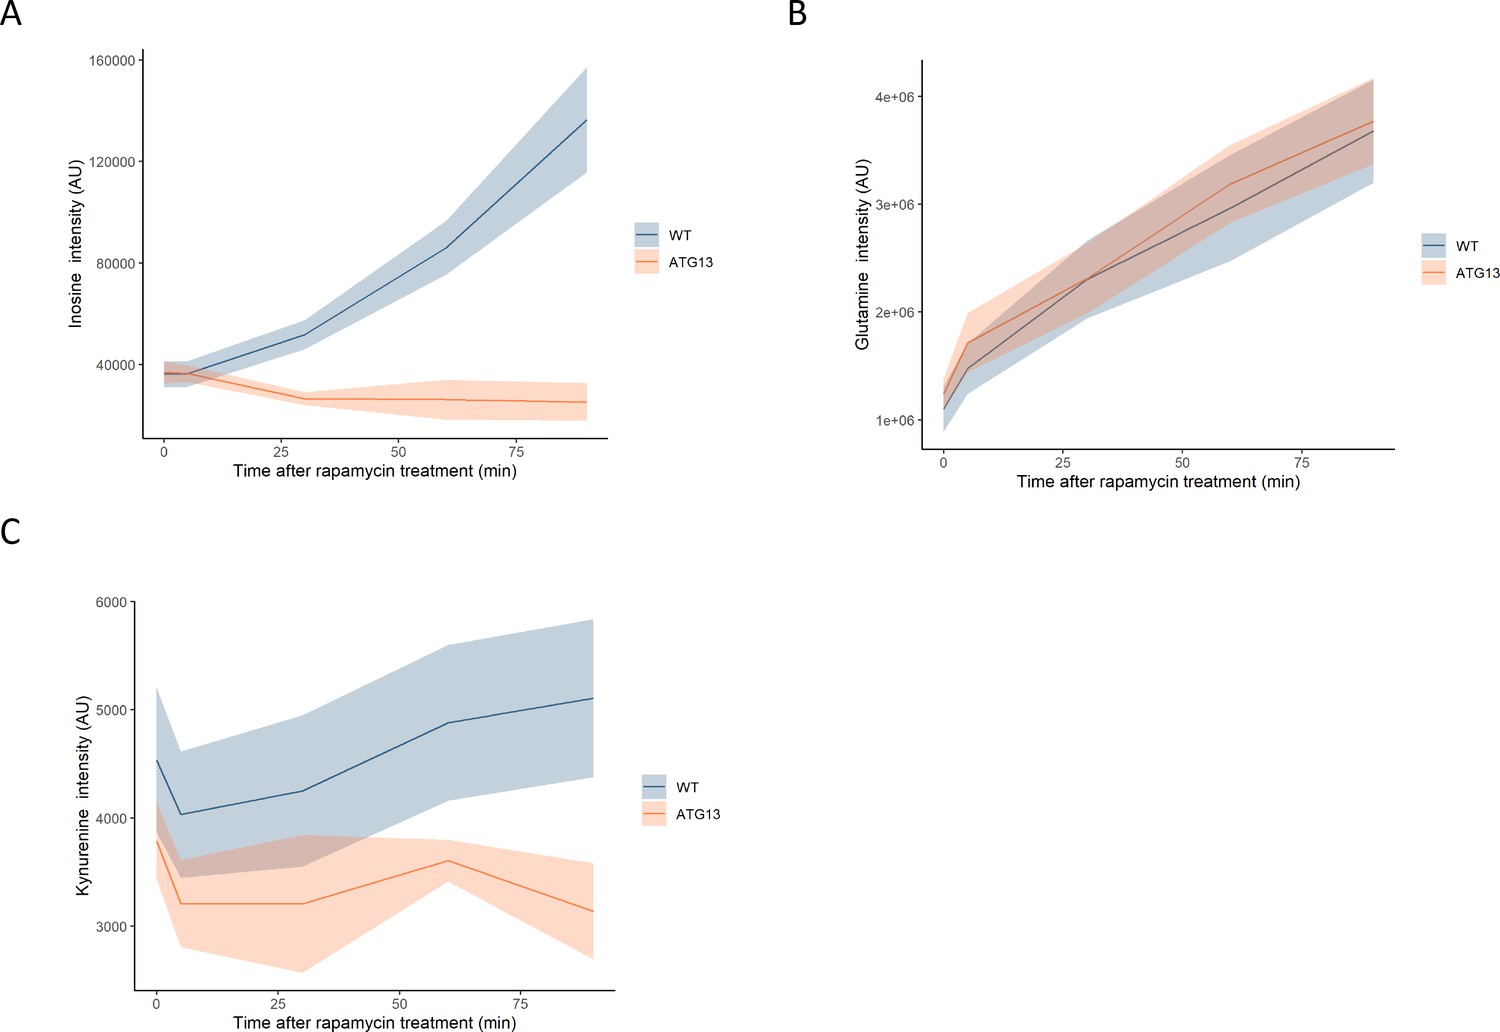
The effect of rapamycin on the levels of metabolites in wild-type and atg13 yeast.
The normalized ion intensities for inosine (A), glutamine (B), and kynurenine (C) in wild-type and atg13 yeast are shown after the indicated duration of rapamycin treatment. The central lines indicate the median value across four biological replicates. Shaded areas indicate the standard deviation across replicates.
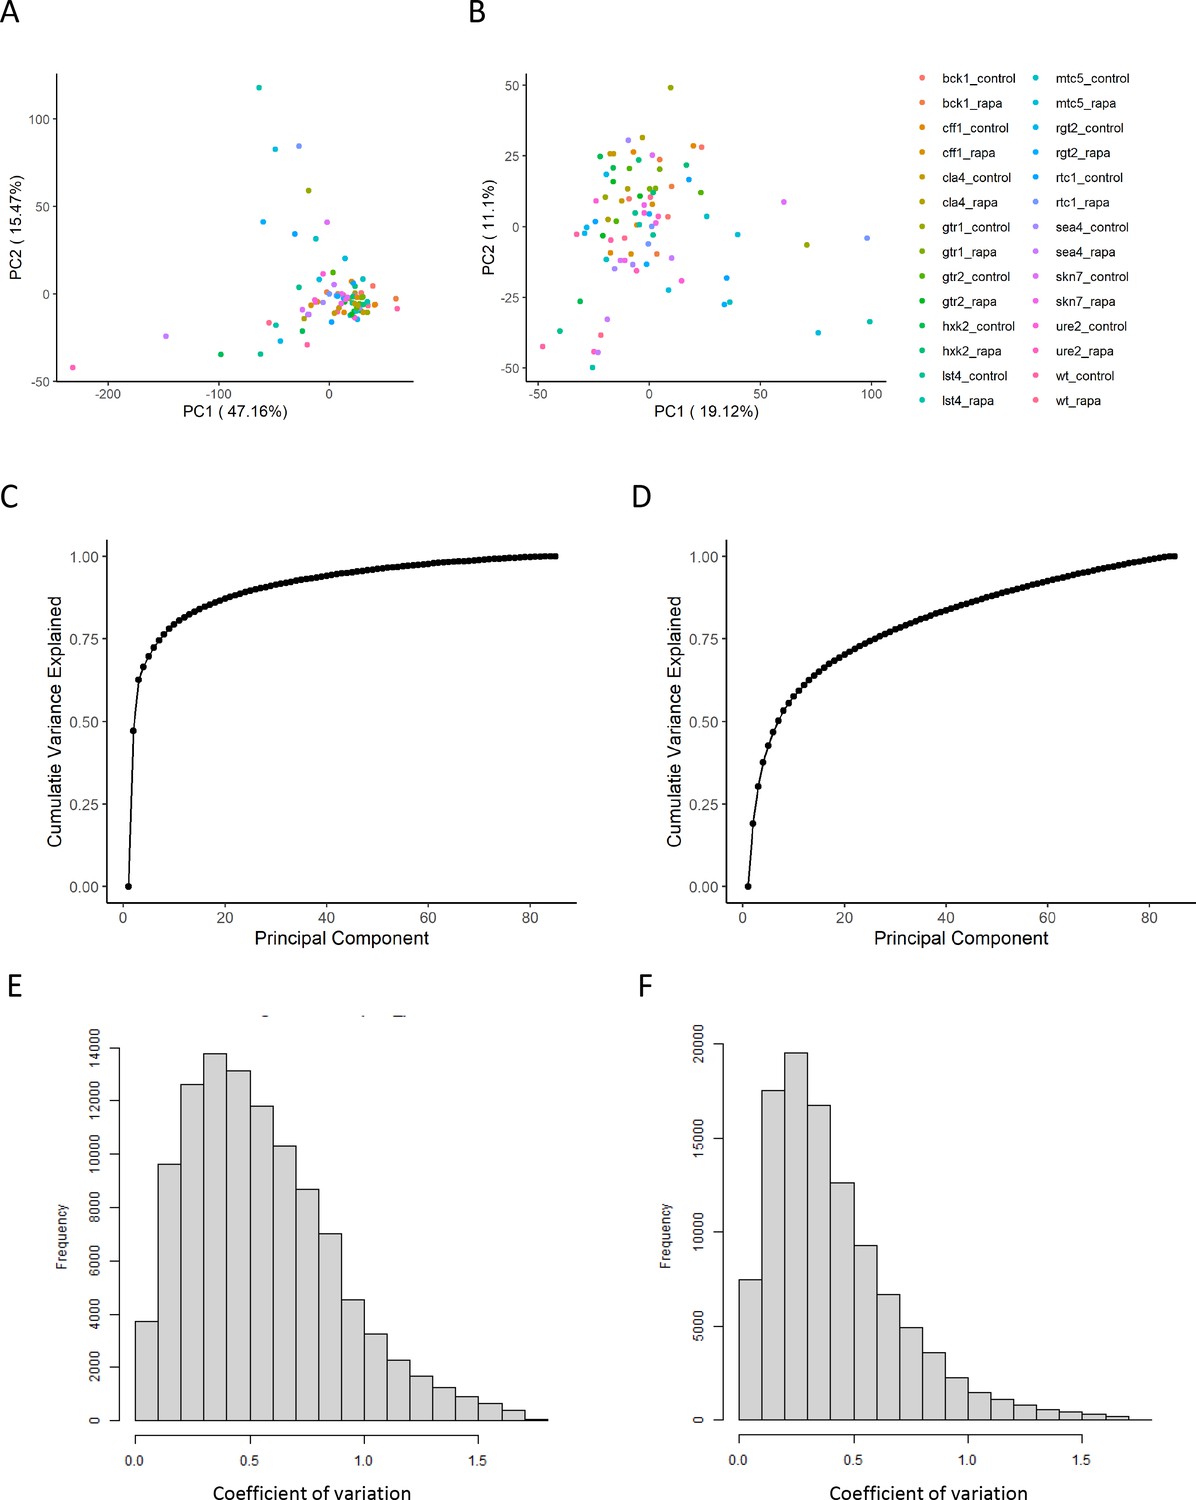
Figure 1—figure supplement 4
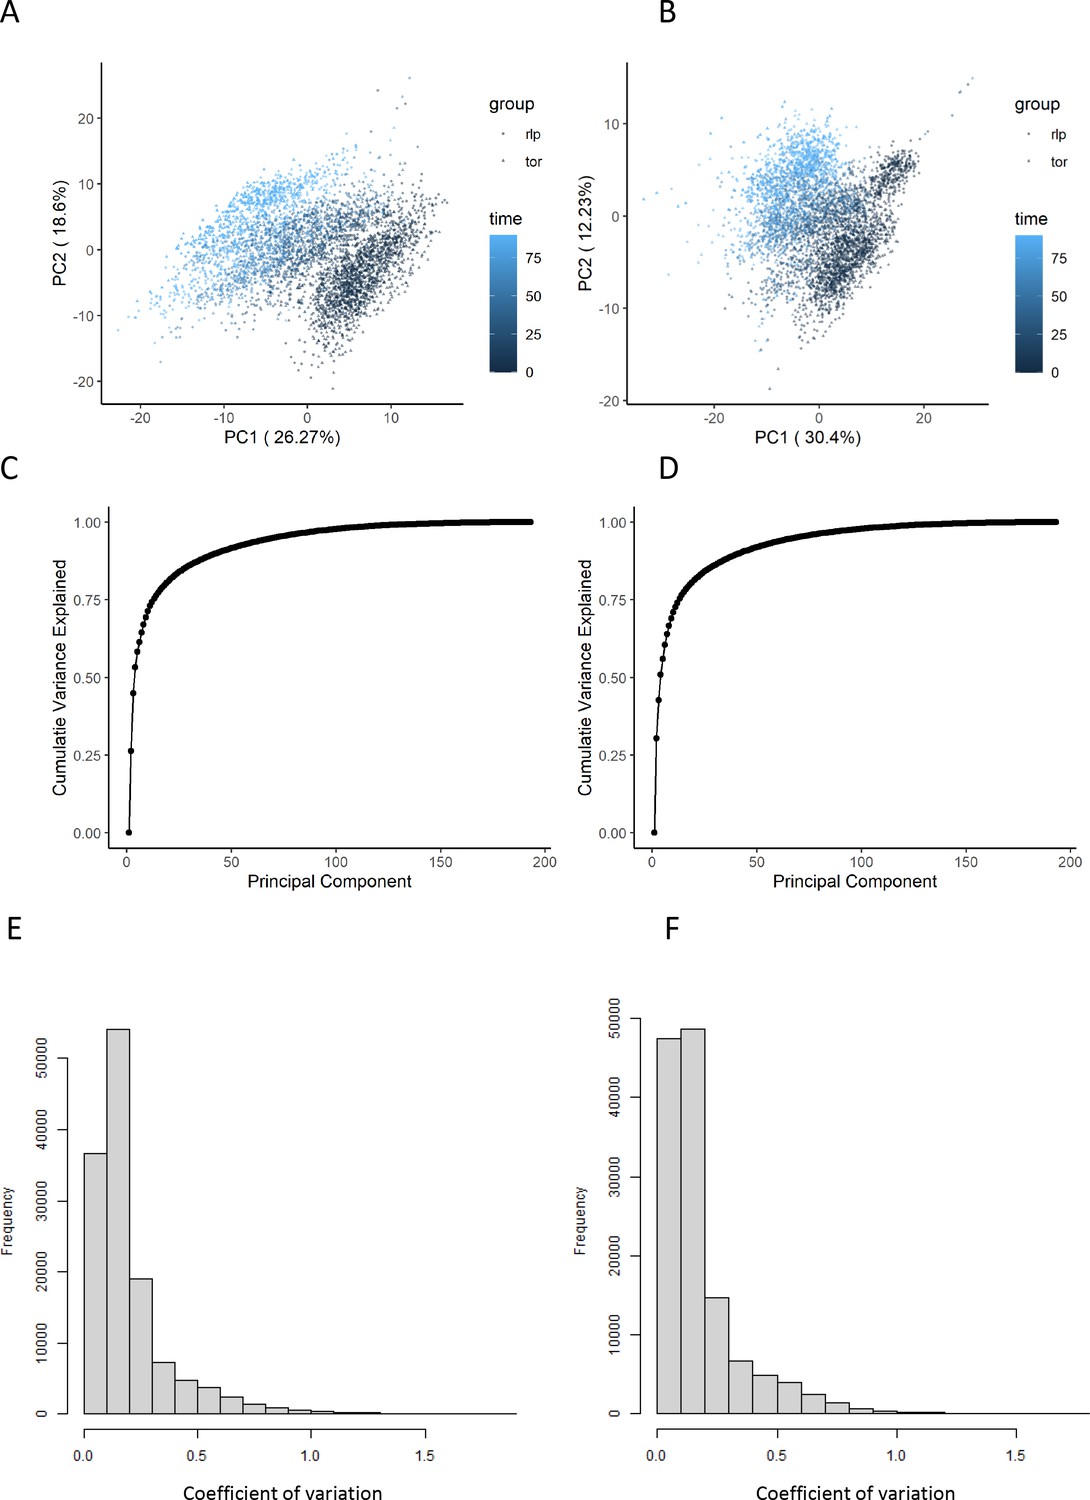
The effect of normalization of flow-injection metabolomics data.
(A, B) Principal components analysis representation of the variance within the dataset before (A) and after (B) the normalization as outlined in the 'Methods' section. The points are colored according to the time after rapamycin treatment. (C, D) The cumulative variance explained by principal component analysis is shown before (C) and after (D) normalization. (E, F) The distribution of coefficients of variation for each ion and set of biological replicates is shown before (E) and after (F) normalization.
Figure 2 with 2 supplements
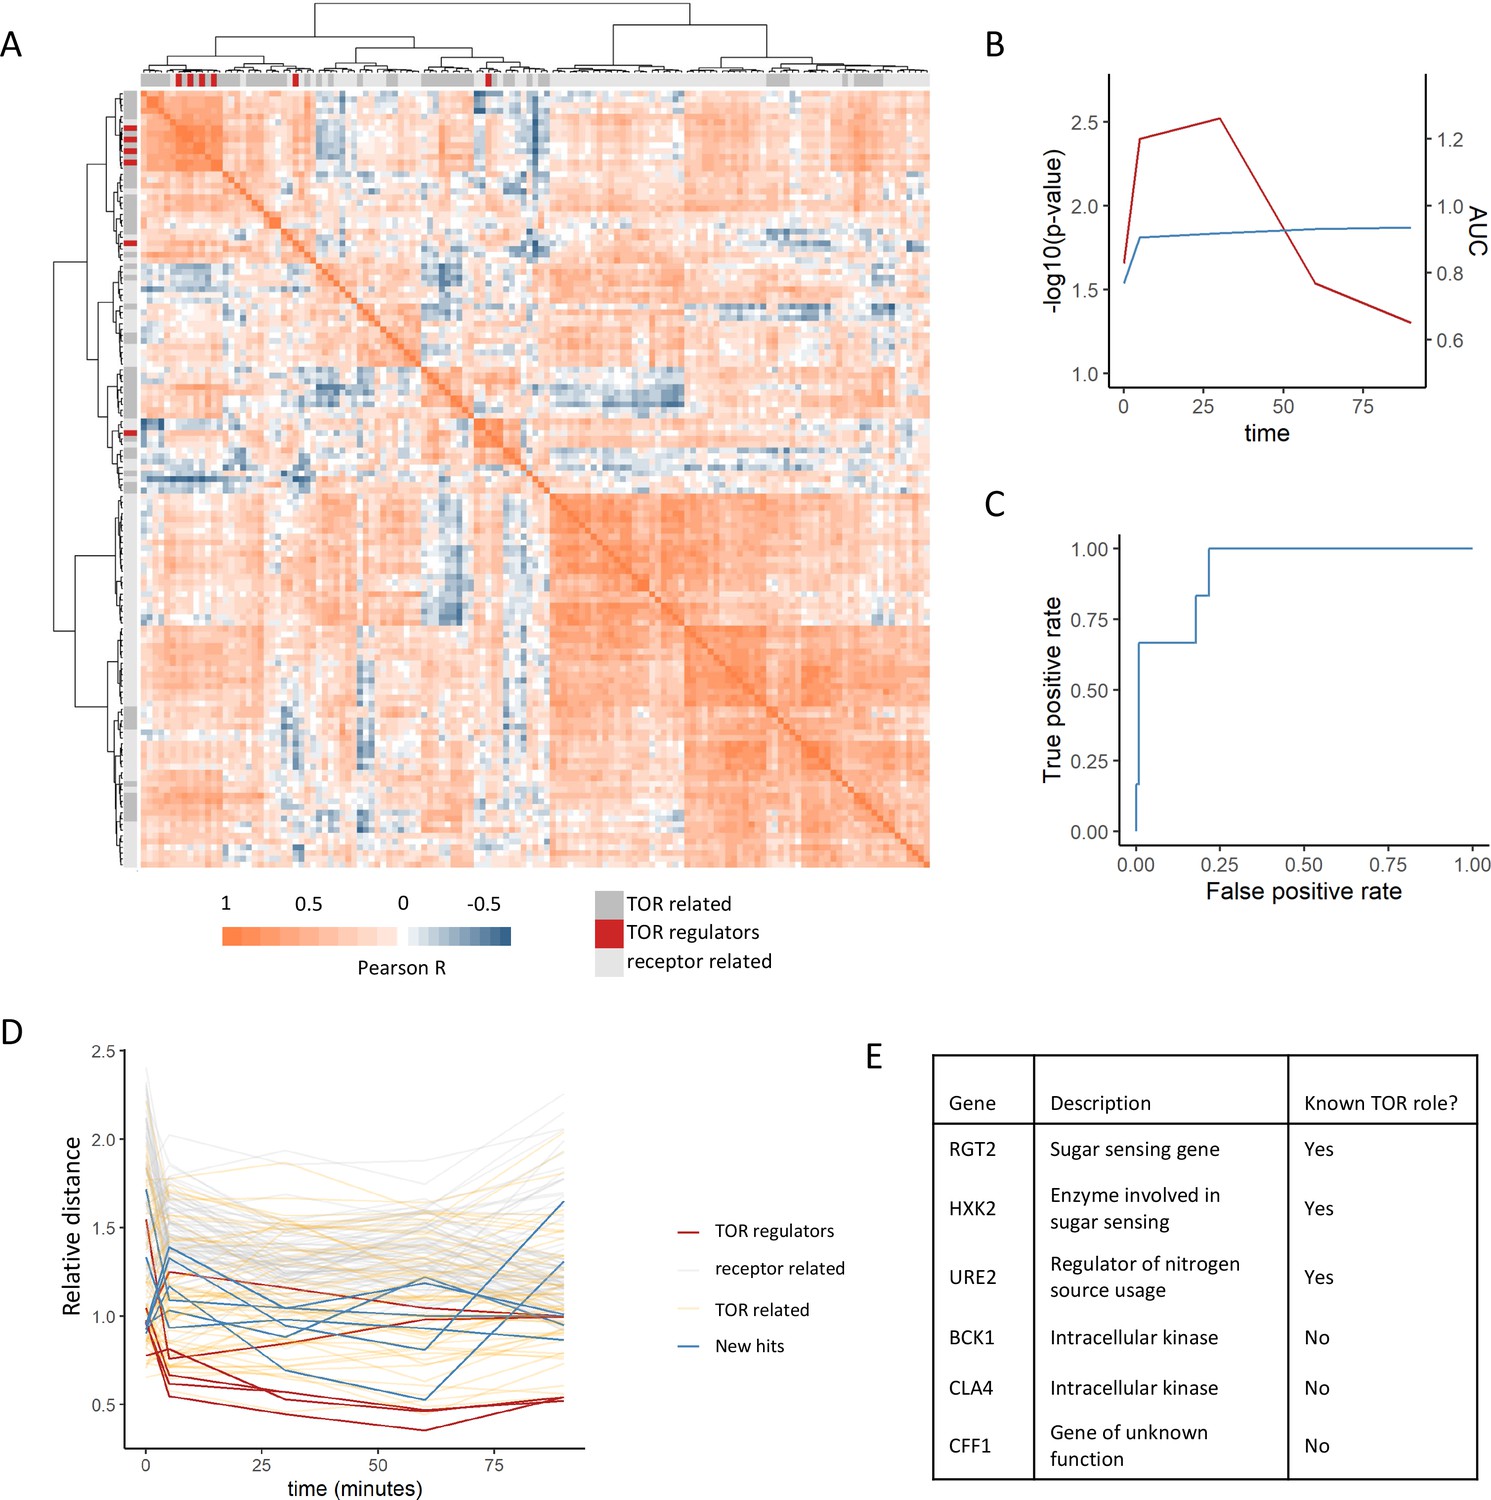
Positive regulators of TOR signaling cluster together based on their metabolome profiles after rapamycin treatment.
(A) The Pearson correlation matrix between all TOR and receptor-related genes is shown for the 30 min rapamycin treatment condition with clustering based on Ward’s algorithm of the Manhattan distance. The identity of the clustered mutants (TOR-related, upstream positive regulators of TOR signaling, or receptor-related) is indicated with the alternate colored heatmap as the edge of the correlation heatmap. (B) The area under the curve for the recovery of known upstream positive regulators of TOR signaling is shown for each time point at which metabolomics data was collected. Area under the curve (AUC) is indicated as a blue line. The empirical p-value for the median distance between those genes is also shown for each time point, based on data randomization. The p-value is indicated as a red line. (C) A receiver operating characteristic curve is shown for the 30 min time point demonstrating the recovery of known positive recovery of known upstream positive regulators of TOR signaling. (D) The distance for each mutant relative to the 0.2 false discovery rate (FDR) threshold calculated for the time point is shown across all time points and genes in this study. Values of <1 indicate that the mutant has passed the distance threshold for that time. (E) Table describing the identity and role of receptor-relating genes that pass the 0.2 FDR threshold for distance from positive regulators of TOR signaling.
Figure 2—figure supplement 1
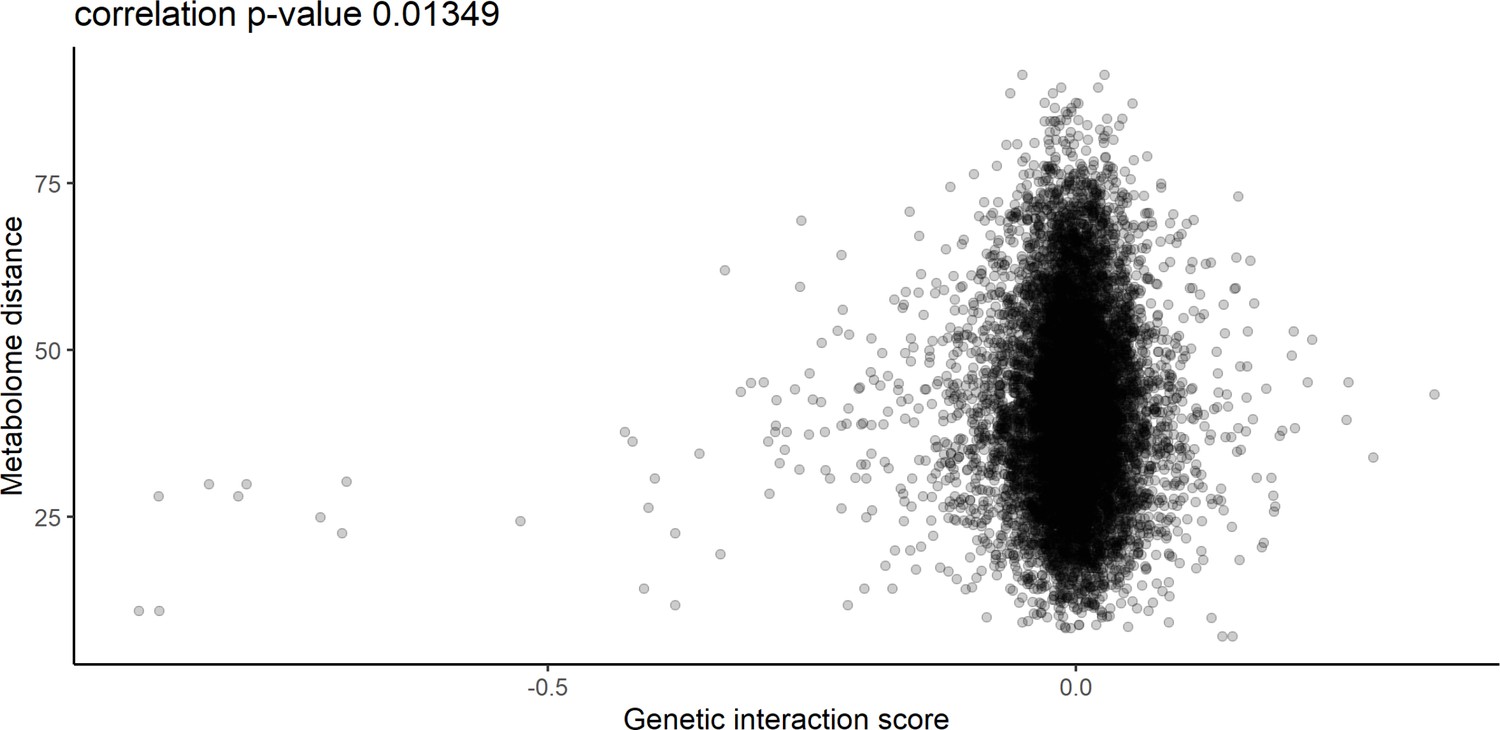
Relationship between metabolome distance and genetic interaction score.
The relationship between the metabolome distance as represented in Figure 2 between genes after 60 min of rapamycin treatment, and the genetic interaction score as defined in Costanzo et al., 2010.
Figure 2—figure supplement 2
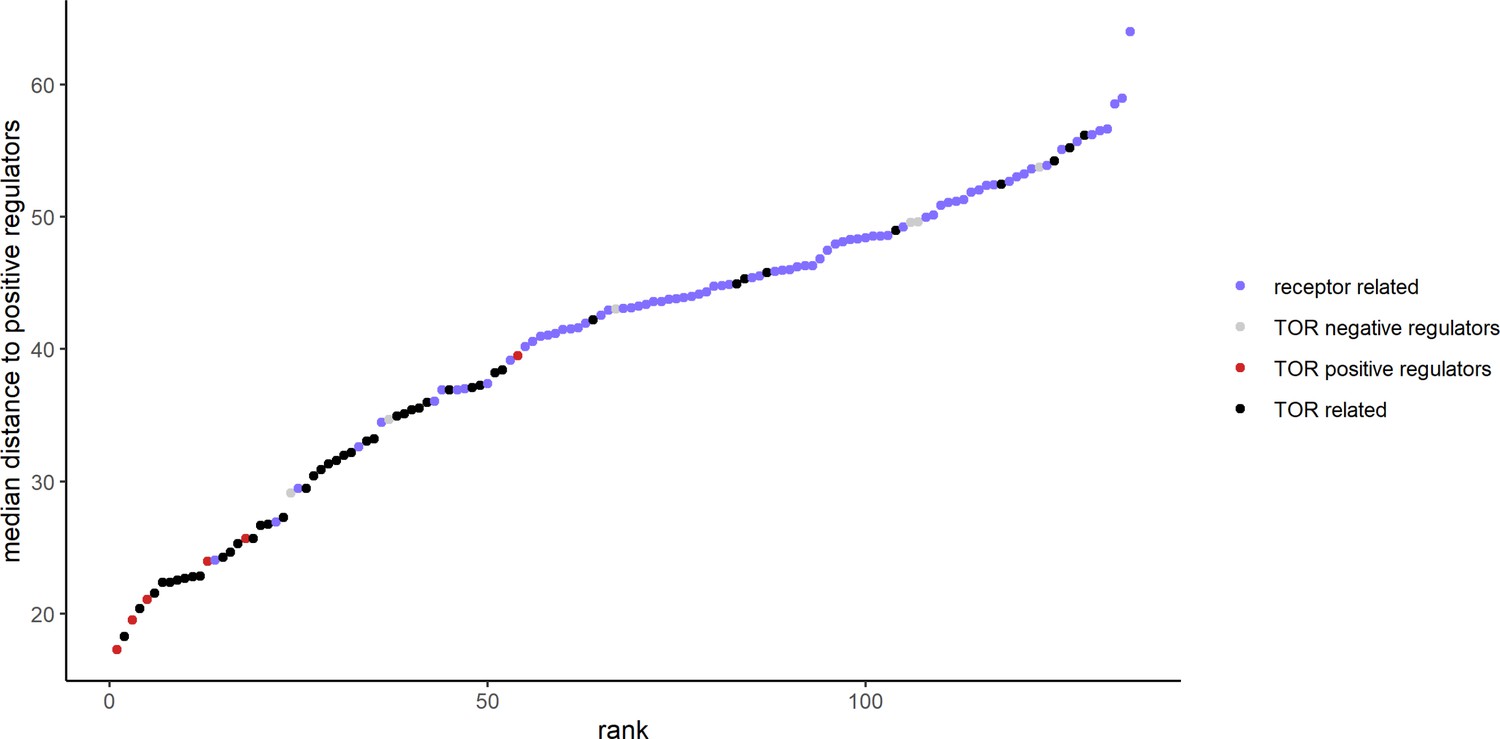
The metabolome distances between positive and negative regulators of TOR signaling.
The metabolome distance as represented in Figure 2 between genes after 30 min of rapamycin treatment and non-self, positive regulators of TOR signaling is shown in ascending order. Positive and negative regulators of TOR signaling are indicated by color.
Figure 3
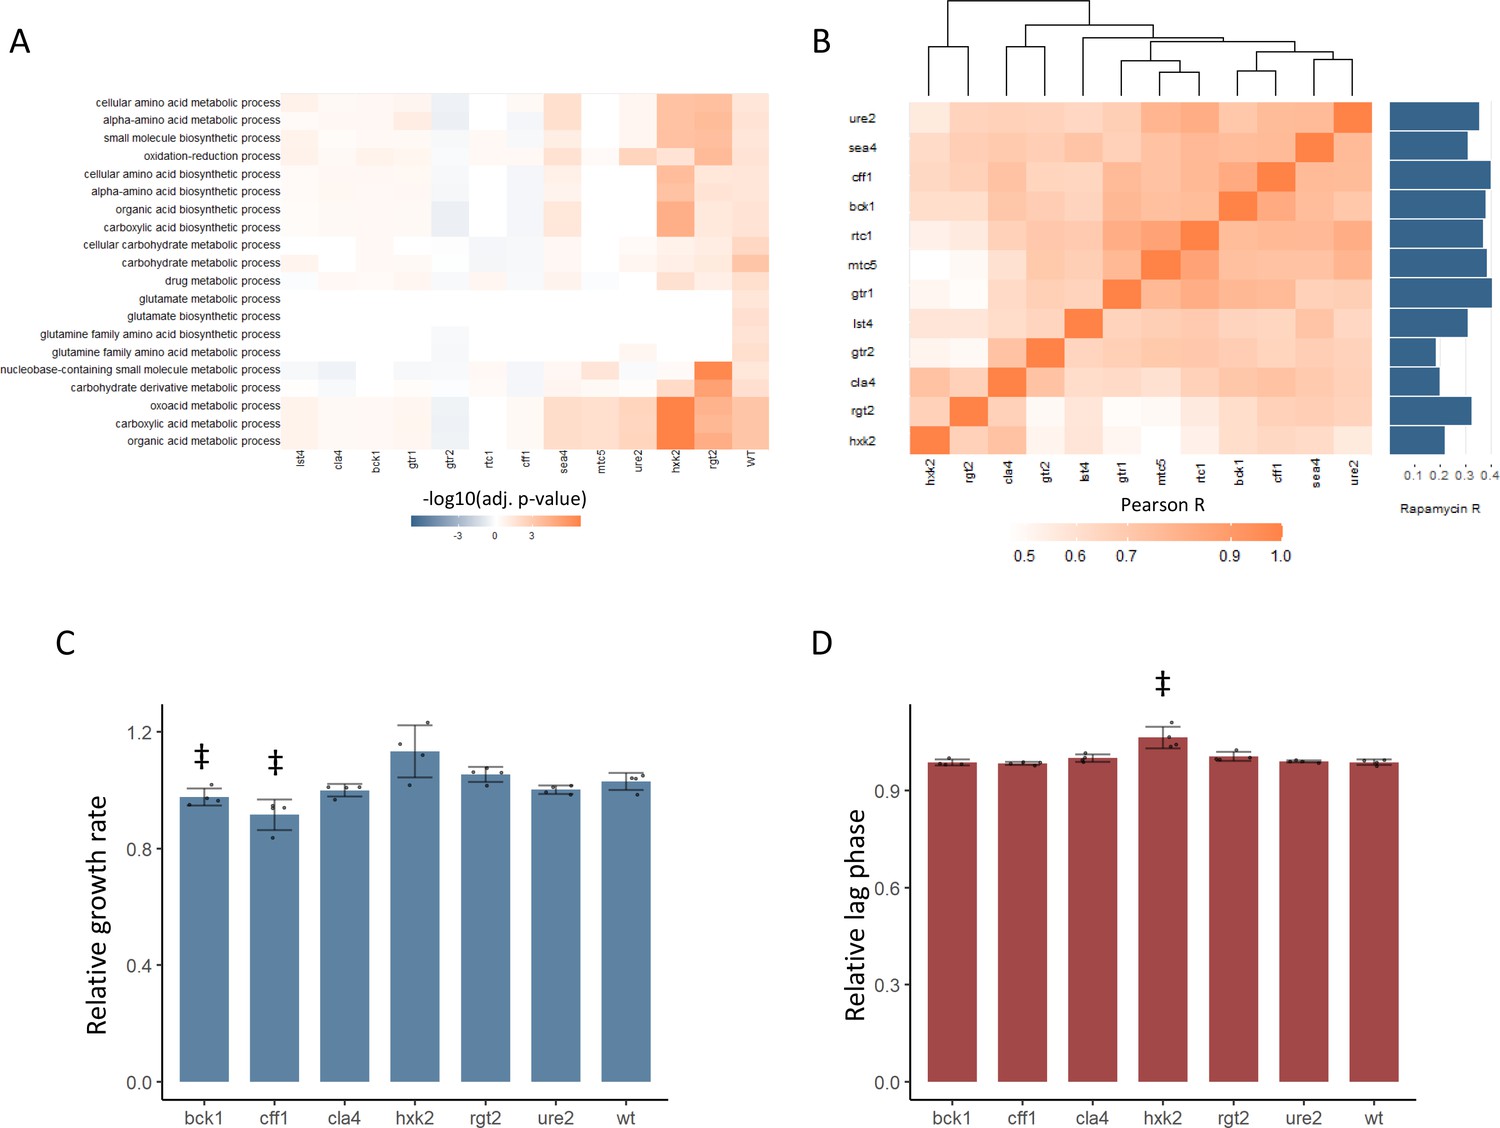
New TOR hits resemble positive TORC1 regulators at the level of the proteome and growth.
(A) -log10 transformed adjusted p-values are shown for the enrichment of gene ontology (GO) biological processes in changing proteins after rapamycin treatment in each mutant. Only GO terms that show enrichment in wild-type yeast treated with rapamycin are included within the plot. Adjusted p-values are Benjamini–Hochberg corrected hypergeometric test outcomes. Negative values indicate an enrichment among proteins of decreased abundance. (B) The Pearson correlations between the protein fold-changes observed when comparing each mutant to wild-type are shown. The Pearson correlation of each mutant proteome to the proteome response of wild-type treated with rapamycin is also shown in bar format to the right of the plot. (C) The maximum relative growth rate for the indicated mutants and wild-type is shown after an upshift from using proline as a nitrogen source to ammonium sulfate. The bar height indicates the mean value, and error bars represent the standard error of the mean from four biological replicates; individual points indicate the average value from one biological replicate. ‡p-value<0.05 for a two-sided t-test compared with the wild-type control. (D) The lag time for the indicated mutants and wild-type is shown after an upshift from using proline as a nitrogen source to ammonium sulfate. The bar height indicates the mean value, and error bars represent the standard error of the mean from four biological replicates; individual points indicate the average value from one biological replicate. ‡p-value<0.05 for a two-sided t-test compared ith the wild-type control.
Figure 4 with 2 supplements
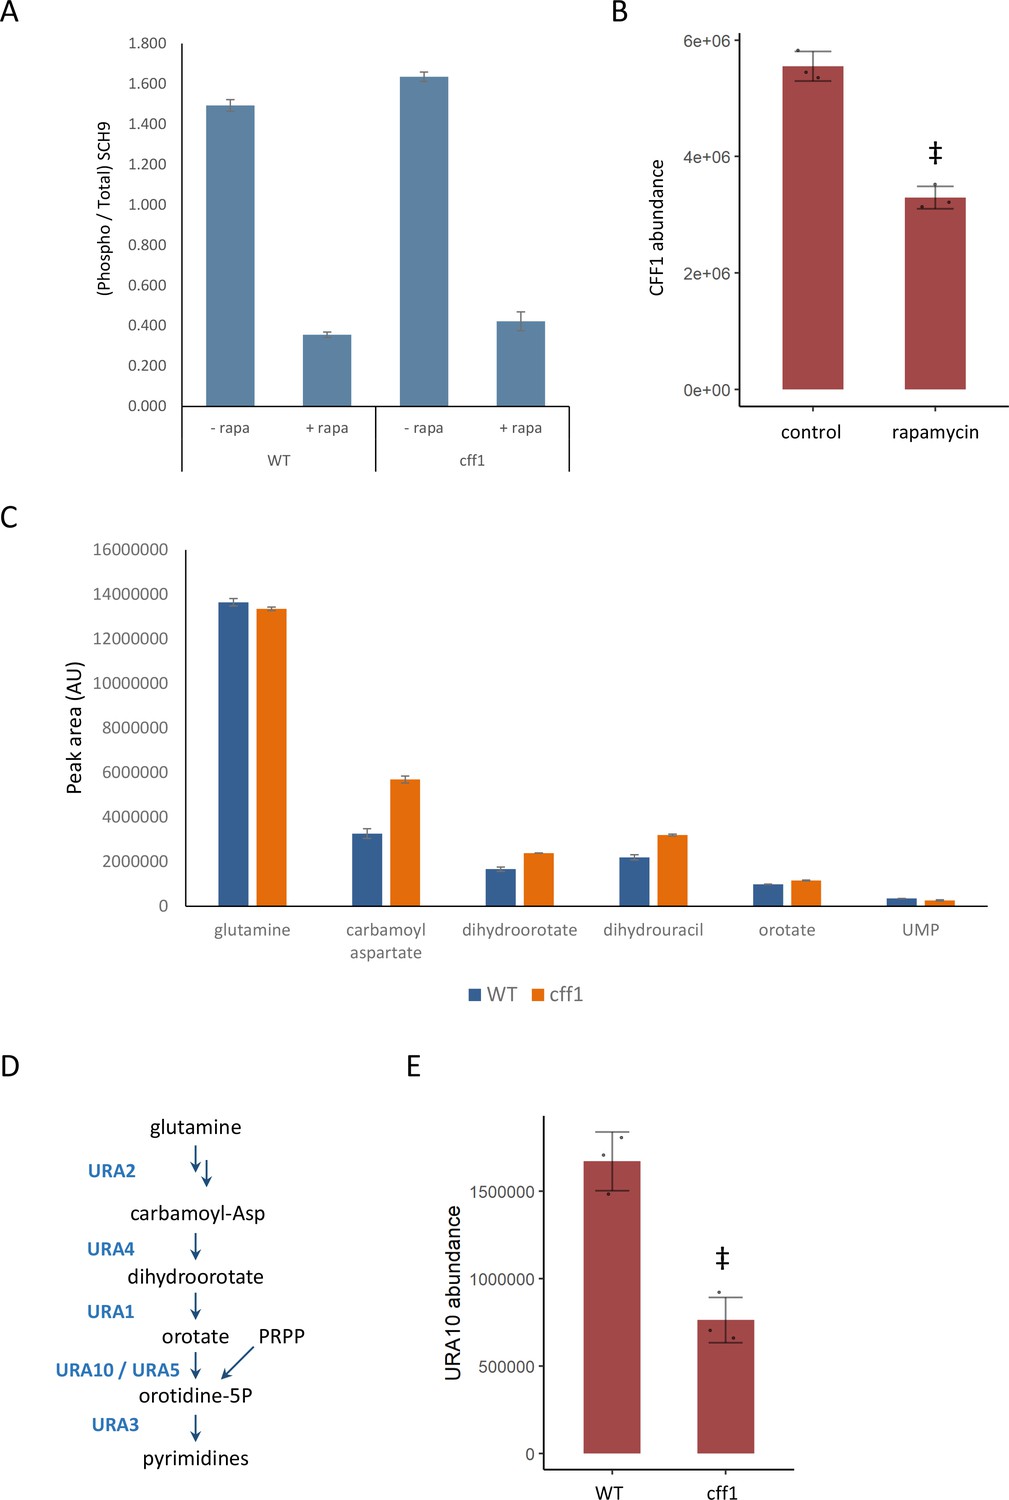
CFF1 acts downstream of TORC1 and in the regulation of pyrimidine metabolism.
(A) The relative ratio of phosphorylated SCH9 to total SCH9 is shown for wild-type and cff1 yeast grown in rich conditions before and after a 30 min treatment with 400 ng/mL rapamycin. Error bars indicate the standard deviation of biological replicates (n = 3). (B) The average abundance of CFF1 is shown in wild-type yeast either treated with rapamycin (400 ng/mL) or a control. Points represent a single replicate, bar height indicates the average value, and the error bar indicates the standard deviation (n = 3 biological replicates). ‡p-value<0.05 for a two-sided t-test compared with the control. (C) The peak areas for the indicated metabolites are indicated for both WT and cff1 yeast that were exposed to a nitrogen source downshift for a duration of 30 min. Data was collected by liquid chromatography-mass spectrometry (LC-MS) as indicated in the 'Methods' section. Bar heights indicate the average value for three biological replicates, with the error bars indicating the standard deviation. (D) A subset of the pathway for pyrimidine biosynthesis is diagrammed with enzymes colored blue and metabolites written in black. (E) The average abundance of URA10 is shown in cff1 yeast or a wild-type control. Points represent a single replicate, bar height indicates the average value, and the error bar indicates the standard deviation (n = 3 biological replicates). ‡p-value<0.05 for a two-sided t-test compared ith the control.
Figure 4—figure supplement 1
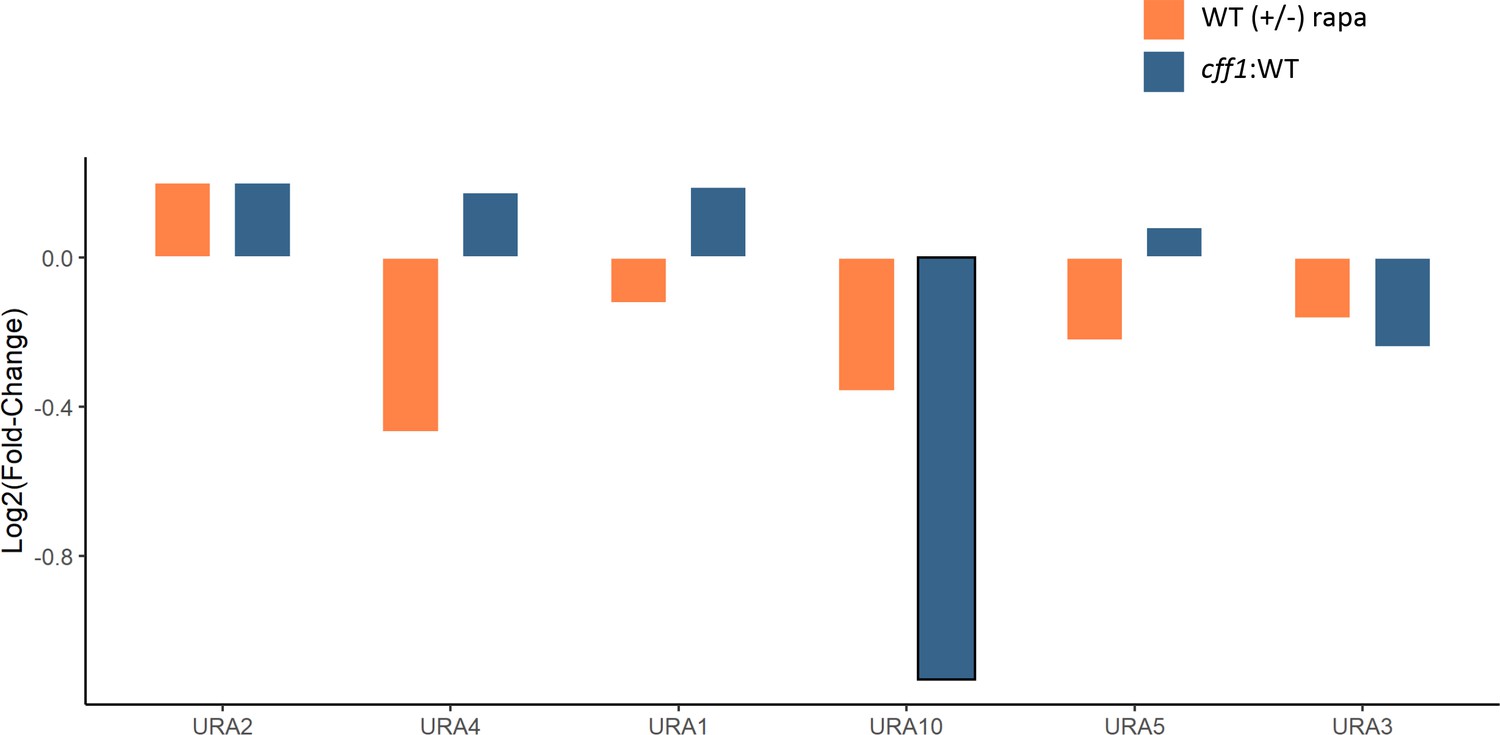
The effect of rapamycin and CFF1 deletion on the levels of pyrimidine biosynthetic enzymes.
The average log2 fold-change for protein levels for the indicated comparison groups is shown (n = 3 biological replicates). Changes with a p-value of <0.05 (two-sided Student's t-test) are outlined in black.
Figure 4—figure supplement 2
The effect of normalization of proteomics data.
(A, B) Principal component analysis representation of the variance within the dataset before (A) and after (B) the normalization as outlined in the 'Methods' section. The points are colored according to the perturbation applied for the sample. (C, D) The cumulative variance explained by principal component analysis is shown before (C) and after (D) normalization. (E, F) The distribution of coefficients of variation for each ion and set of biological replicates is shown before (E) and after (F) normalization.
Additional files
-
Supplementary file 1
Gene IDs for TOR and receptor-related mutant libraries.
- https://cdn.elifesciences.org/articles/84295/elife-84295-supp1-v1.xlsx
-
Supplementary file 2
Annotated ion intensities and sample information for flow-injection analysis.
- https://cdn.elifesciences.org/articles/84295/elife-84295-supp2-v1.xlsx
-
Supplementary file 3
Mobile phase composition for liquid chromatography-mass spectrometry (LC-MS) metabolomics.
- https://cdn.elifesciences.org/articles/84295/elife-84295-supp3-v1.xlsx
-
Supplementary file 4
Liquid chromatography-mass spectrometry (LC-MS) sample information and peak areas for rapamycin-treated wild-type yeast.
- https://cdn.elifesciences.org/articles/84295/elife-84295-supp4-v1.xlsx
-
Supplementary file 5
Liquid chromatography-mass spectrometry (LC-MS) sample information and peak areas for wild-type and cff1 yeast during a nutrient downshift.
- https://cdn.elifesciences.org/articles/84295/elife-84295-supp5-v1.xlsx
-
MDAR checklist
- https://cdn.elifesciences.org/articles/84295/elife-84295-mdarchecklist1-v1.pdf
Download links
A two-part list of links to download the article, or parts of the article, in various formats.
Downloads (link to download the article as PDF)
Open citations (links to open the citations from this article in various online reference manager services)
Cite this article (links to download the citations from this article in formats compatible with various reference manager tools)
Dynamic metabolome profiling uncovers potential TOR signaling genes
eLife 12:e84295.
https://doi.org/10.7554/eLife.84295


